Fuzzy Dark Matter as a Solution to Reconcile the Stellar Mass Density of High-z Massive Galaxies and Reionization History
Abstract
The JWST early release data show unexpected high stellar mass densities of massive galaxies at , a high star formation efficiency is probably needed to explain this. However, such a high star formation efficiency would greatly increase the number of ionizing photons, which would be in serious conflict with current cosmic microwave background (CMB) and other measurements of cosmic reionization history. To solve this problem, we explore the fuzzy dark matter (FDM), which is composed of ultra-light scalar particles, e.g. ultra-light axions, and calculate its halo mass function and stellar mass density for different axion masses. We find that the FDM model with and a possible uncertainty range can effectively suppress the formation of small halos and galaxies, so that with higher star formation efficiency, both the JWST data at and the reionization history measurements from optical depth of CMB scattering and ionization fraction can be simultaneously matched. We also find that the JWST data at are still too high to fit in this scenario. We note that the estimated mean redshift of the sample may have large uncertainty, that it can be as low as depending on adopted spectral energy distribution (SED) templates and photometric-redshift code. Besides, the warm dark matter with keV mass can also be an alternative choice, since it should have similar effects on halo formation as the FDM.
1 Introduction
Exploration of high-redshift (high-) galaxies can provide valuable information of galaxy formation and history of cosmic reionization. Recently, the () has released early observational results of detecting galaxies at , and some unexpected discoveries have been found that may be in tension with the current galaxy formation theory and the widely accepted CDM model as well (Boylan-Kolchin, 2022; Lovell et al., 2022; Mason et al., 2022; Menci et al., 2022; Mirocha et al., 2022; Naidu et al., 2022a, b). In particular, Labbe et al. (2022) reported a much higher stellar mass density in massive galaxies with at , which is more than one magnitude higher at , and three orders of magnitude higher at , than the anticipated values from the standard cosmology and star formation scenarios, raising a challenge to the standard cosmological model.
One way to explain this huge abundance excess is to dramatically enhance the star formation rate (SFR) or UV luminosity function at high- by invoking a large star formation efficiency , which indicates the fraction of baryons that can convert to stars (Boylan-Kolchin, 2022; Lovell et al., 2022; Mason et al., 2022; Mirocha et al., 2022). Although the typical values of is usually expected to be less than 0.1 based on observations at lower redshifts, it is theoretically possible to have a larger value, even up to at the high redshifts, as depends on complicated physics of star formation. Adoption of the higher could partially solve or at least reduce the tension between theories and the observation. However, this may raise new tension with the cosmic reionization history, which is closely related to high- star formation process, and is well constrained by current cosmological observations, such as the cosmic microwave background (CMB) as measured by the and satellites (e.g. Hinshaw et al., 2013; Planck Collaboration et al., 2020). With a higher star formation efficiency, for a given halo mass , more massive galaxy can be formed, but then there is an overall increase of ionizing photons produced, and the Universe would be reionized much earlier than as inferred from current observations.
As only the more massive galaxies is detectable at high redshifts with the current JWST observations, one possible way to resolve this conflict is to boost the formation of massive galaxies while suppress the formation of small galaxies. One can apply a mass-dependent star formation efficiency to suppress the star formation in small halos, but as we shall discuss later, this may still not be enough to explain the observational results.
Here we propose and explore the fuzzy dark matter (FDM) as a solution to this problem. The FDM is a proposed dark matter composed of ultra-light scalar particles (Hu et al., 2000), such as ultra-light axions (see e.g. Marsh, 2016a). Since the FDM particles have extremely low mass with , its de Broglie wavelength can be as large as the size of a dwarf galaxy or even larger. Due to the uncertainty principle in wave mechanics, an effective quantum pressure arises to suppress matter fluctuations below a certain Jeans scale, so small structures cannot form. This will affect the formation and density profile of objects on small scales, and severely suppress the halo mass function at small masses. If the dark matter is composed of FDM, only relatively large halos and massive galaxies are formed, and the rest of dark matter will not cluster, and stay as a smooth component in linear regime. Therefore, it will not significantly affect cosmic reionization history, even when the star formation efficiency is greatly enhanced at high redshifts, since small galaxies do not form in this model.
A number of observations have been performed for probing the FDM, including measurements of density profile and mass function of dwarf galaxies, rotation curves of Milky May, Ly forest that exploring cosmic structures on small scales, and so on (Schive et al., 2014; Marsh & Niemeyer, 2019; Safarzadeh & Spergel, 2019; Broadhurst et al., 2020; Irsic et al., 2017; Armengaud et al., 2017; Maleki et al., 2020). Possible mass ranges or lower limits of mass of the FDM particles have been derived from these detections. Although some inconsistency may still exist in the current observations, e.g. the observations of Milky Way’s dwarf satellites (Safarzadeh & Spergel, 2019), an interesting and possible region around can be located, which is worth for further study. In the following discussion, we assume a flat CDM model with , , , , (Planck Collaboration et al., 2020).
2 Model
Since the FDM cannot form small halos below a certain Jeans scale due to quantum pressure, the halo mass function is suppressed at low mass end. The FDM halo mass function has been discussed in previous literatures based on numerical simulations and semi-analytic techniques (see e.g. Schive et al., 2016; Du et al., 2018; Schutz, 2020; Niemeyer, 2019). Here we use a mass-dependent critical overdensity in the analytical mass function to account for this suppression at small mass scale (Marsh & Silk, 2014; Bozek et al., 2015; Marsh, 2016b; Du et al., 2017), which is given by
| (1) |
Here , where is the critical overdensity for collapse, and is the linear growth factor normalized at . is a factor accounting for mass-dependence, it can be computed with the AxionCAMB code(Hlozek et al., 2015), and fitted as functions of halo and axion masses (e.g. Marsh & Silk, 2014; Marsh, 2016b; Du et al., 2017).
The FDM halo mass function can be obtained with this critical density in the Press-Schechter approach (Press & Schechter, 1974),
| (2) |
where is the current matter density, is the current critical density, and for we take the form as (Sheth & Tormen, 1999)
| (3) |
Here , , , is the normalization factor, , and is the variance of linear power spectrum. For the FDM linear matter power spectrum, we adopt a numerical result given by Hu et al. (2000). Considering suppression of the FDM power spectrum relative to the CDM case, we have
| (4) |
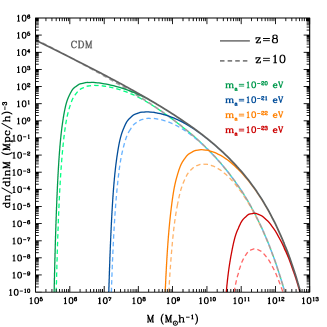
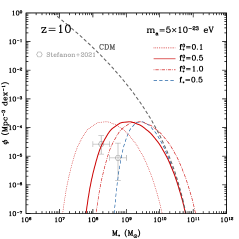
Here is the CDM linear power spectrum, which can be estimated analytically (Eisenstein & Hu, 1998). is the transfer function, and , where and Mpc-1 is the comoving Jeans wavenumber scale at epoch of matter-radiation equality. The transfer function has acoustic oscillation features on small scales below , and will approach to unity for large FDM particle mass when eV or . The FDM halo mass functions at (solid) and (dashed) for different axion masses are shown in Figure 1. We can see that the abundance of low-mass halos is greatly suppressed in FDM, and only massive halos can form with the same mass function as the CDM case. This allows adopting larger number density for massive galaxies without over-producing ionizing photons.
Hence, the comoving cumulative halo mass density with halo mass greater than can be calculated by
| (5) |
Considering the relation between the halo mass and stellar mass, i.e. , we obtain the cumulative stellar mass density with stellar mass larger than ,
| (6) |
We consider two forms of star formation efficiency in this work, i.e. mass-independent and mass-dependent , for the latter we assume a double power-law (DPL) form as given in Mirocha et al. (2017)
| (7) |
where we adopt , , and . These parameters are calibrated to match the observed high- LFs (Bouwens et al., 2015a). is the star formation efficiency at halo mass , and they find 111Note that there is an additional factor 2 in the numerator compared to that given in Mirocha et al. (2017).. We will adjust and to match the data in this work.
As we mentioned, a large star formation efficiency can significantly affect the cosmic reionization history, and may violate the current measurements of epoch of reionization. To evaluate this effect, we can first calculate the hydrogen volume filling factor as a function of redshift.
The evolution of follows (Wyith & Loeb, 2003; Madau et al., 1999)
| (8) |
where is the escape fraction set to be 0.1 (Sun et al., 2021), is the mean number density of hydrogen (both neutral and ionized) atoms at present Universe, is the clumping factor of the ionized gas (Kaurov & Gendin, 2014), is the Case B recombination coefficient, and is the kinetic temperature. We always take K (Robertson et al., 2015), so that cm3s-1. Here for simplicity we assume the helium has the same first stage ionization (i.e. He II) fraction as hydrogen (the full ionization to He III would be much later), so the total ionization fraction can be written as
| (9) |
where is the Helium element abundance. For the emission rate of ionizing photons per unit comoving volume , we take
| (10) |
where is the total ionizing photons produced per stellar baryon throughout its lifetime for typical Pop II galaxies (e.g. see Starburst99222https://www.stsci.edu/science/starburst99/docs/default.htm,Leitherer et al. 1999; Vazquez & Leitherer 2005; Leitherer et al. 2010, 2014), is the star-forming timescale, and we assume that it equals to 10% of the Hubble time at redshift (Wyith & Loeb, 2006; Lidz et al., 2011). is the minimum halo mass corresponding to a virial temperature of K, halos above this mass can sustain effective cooling via the Ly transition (Barkana & Loeb, 2001). We find that, for example, , , and at , 10, and 5, respectively. The major contribution of ionizing photons depends on the shape of , and basically it is dominated by low-mass galaxies in the CDM model. In the FDM model, it can be dominated by massive galaxies, since small galaxies can barely form when is small.
The optical depth of the CMB scattering is adopted as a quantity to characterize the cosmic reionization history, which can be estimated by
| (11) |
where cm-2 is the Thompson scattering cross-section. We integrate up to since the reionization is negligible before this redshift in our model.
3 Result and Discussion
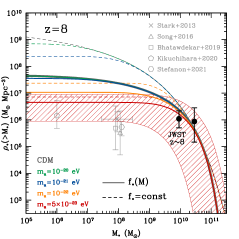
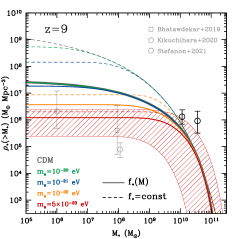
In Figure 2, we show the comoving cumulative stellar mass density as a function of at (Left panel), 9 (Middle panel) and 10 (Right panel) for the FDM and CDM cases. As can be seen, is effectively suppressed at small stellar masses compared to the CDM case, while at the higher mass end the FDM and CDM curves are identical. For example, at , assuming the mass-dependent star formation efficiency with , we find that almost becomes flat when , , , and , when , , , and , respectively. As expected, this effect is more significant in the mass-dependent case than the constant case, since would become smaller at small . Labbe et al. (2022) has given the estimates in two redshift groups ( and ), and at each redshift for and . We also over-plotted these estimates in black solid dots in Figure 2.
If we assume the maximum or can reach to 1, i.e. all baryons will convert to stars in the constant case or at in the case, it seems that both CDM and FDM models considered here can match the data measured by at (refer to the hatched region in the left panel of Figure 2). However, as we will discuss below, most of them will not be consistent with the measurements of cosmic reionization history.
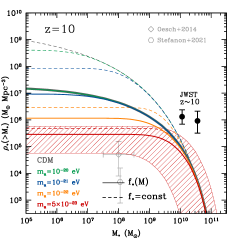
On the other hand, we can see that at ( the Right panel of Figure 2), none of the CDM or FDM model we considered can fit the JWST data even assuming or , as have been found in studies assuming the CDM model (e.g. Boylan-Kolchin, 2022; Menci et al., 2022). This may be due either to strong deviation of cosmological evolution from the CDM model, or due to issues of galaxy selection, measurements of galaxy stellar mass and redshift, dust extinction, and sample variance (Endsley et al., 2022; Ferrara et al., 2022; Ziparo et al., 2022; Adams et al., 2023).
In particular, the stellar mass and redshift of these galaxies are estimated photometrically in Labbe et al. (2022) using the EAZY code (Brammer et al., 2008). Based on other studies, the stellar mass can be even one order of magnitude lower with different assumptions of SED template fitting (e.g. Endsley et al., 2022), and then also will become lower accordingly. If this is true, as shown in Figure 2, the tension between the JWST data and the CDM model with small can be relaxed at . However, even so the JWST data at seem still too high for the CDM model, although they can match our FDM model with large (red hatched region). In addition, the photometric redshift estimation may also have larger errors, especially at these very high redshifts (Adams et al., 2023). To make a simple and practical assessment of this uncertainty, we use another widely used photo- code, i.e. (Arnouts et al., 1999; Ilbert et al., 2006), to derive the photometric redshifts of the seven galaxies given in Labbe et al. (2022). A quick check shows that the mean photo- of the three galaxies in and the four galaxies in are and , respectively, compared to and given by Labbe et al. (2022). Our result is also consistent with other works, e.g. Bouwens et al. (2022) gives for in Labbe et al. (2022). This indicates that there could be relatively large uncertainty in the current galaxy redshift estimation, which depends on the selected photo- analysis code and spectral energy distribution (SED) templates. If we shift the density mean redshift from to , as shown in the middle panel of Figure 2, the data could be explained by the current models within 1 error.
Besides, for comparison, we also show the data of stellar mass density at low stellar mass end down to and , which are given by previous studies (Stark et al., 2013; Oesch et al., 2014; Song et al., 2016; Bhatawdekar et al., 2019; Kikuchihara et al., 2020; Stefanon et al., 2021). We can see that, although some data points are lower and show discrepancy compared to the JWST data at high stellar mass, our model with and (red hatched region) is consistent with most of these data within 1 confidence level. This means that our FDM model has the potential to explain both the measurement of cumulative stellar mass density from JWST at high stellar mass and the data obtained at low stellar mass. One the other hand, it seems that the CDM model can hardly fit all these data in the mean time, no matter assuming large or small star formation efficiency.
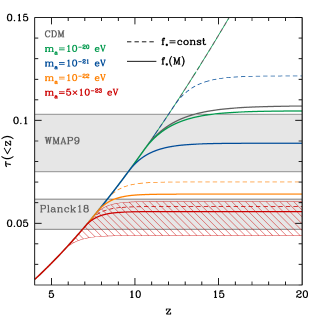
In the left panel of Figure 3, we plot the optical depth as a function of for the CDM and FDM models. The confidence level (C.L.) results of the 9-year (WMAP9) and 2018 (Planck18) (Hinshaw et al., 2013; Planck Collaboration et al., 2020) are also shown in gray parallel bands, which give and , respectively. Note that the WMAP9 result is actually consistent with 2015 result with (Planck Collaboration et al., 2016) in error. We can find that the case of can fit the Planck18 result very well for both mass-dependent and constant star formation efficiencies, and the case is consistent with the WMAP9 results for mass-dependent . Both the CDM cases of assuming mass-dependent with and constant (gray curves) predict much higher , that cannot fit the measurements. Hence, although most of these FDM and CDM models can fit the data at (see the left panel of Figure 2), only and can give good match to the cosmic reionization history measured by and satellites, respectively.
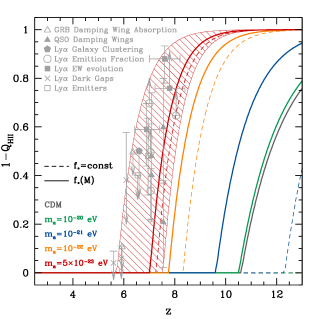
We also show the neutral hydrogen fraction of the intergalactic medium (IGM) characterized by as a function of redshift in the right panel of Figure 3. The results from Ly galaxies, gamma-ray burst (GRB), and quasi-stellar object (QSO) measurements are shown in gray data points (see e.g. Robertson et al., 2015; Bouwens et al., 2015b; Mason et al., 2019). We can see that the FDM model with and (red hatched region) are in good agreement with these data, and the models with other axion masses cannot fit the data very well. Hence, it indicates that the FDM model with can match all the data of high-z galaxy stellar mass density and reionization history measured by optical depth and IGM neutral hydrogen fraction.
We should note that there could be large uncertainties in the current result. On one hand, as mentioned, the current stellar mass density data may still have large errors that needs to be further studied. This can directly affect the analysis and the result of FDM mass determination. For instance, if the stellar mass is overestimated in Labbe et al. (2022), the FDM particle mass will be larger and the star formation efficiency can be smaller. On the other hand, large uncertainties of the model and parameters could exist in our analytical estimation, e.g. star formation efficiency, escape fraction, clumping factor, etc. (Finkelstein et al., 2019; Yung et al., 2020). So the FDM particle mass we derive should have an uncertainty range. Considering the uncertainties in the measurements of stellar mass density, reionization history, and the model and parameters, we can find a possible range of .
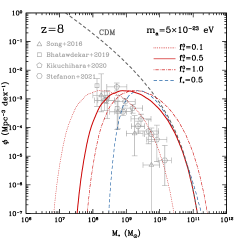
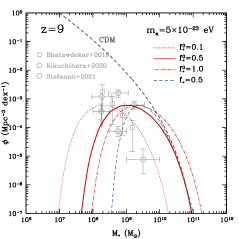
In addition, as we mentioned above, it shows some discrepancy between the cumulative stellar mass density data at high stellar mass and the previous data obtained by Hubble space telescope (HST) and other telescopes at low stellar mass in Figure 2, especially at high redshift. To further check this problem and compare with our FDM model, we calculate the galaxy stellar mass functions (GSMFs) from the FDM halo mass functions with and different star formation efficiencies at , 9 and 10, respectively, and we show the results in Figure 4. For comparison, we also show the observational data at low stellar masses given in previous measurements by HST and Spitzer (Song et al., 2016; Bhatawdekar et al., 2019; Kikuchihara et al., 2020; Stefanon et al., 2021). We only plot the data at here, since the data at usually have large uncertainties on both stellar mass (that can be higher than ) and galaxy volume density at (see e.g. Kikuchihara et al., 2020; Stefanon et al., 2021).
We can find that the FDM model with and can fit most of the GSMF data at and 9, and it seems that the data prefer a even lower star formation efficiency with at . This is obviously not in agreement with the result derived from the cumulative stellar mass density data at high stellar mass, which prefer a large star formation efficiency with as shown in Figure 2. This implies that there is disagreement between data given in Labbe et al. (2022) and the previous measurements at low stellar mass. So further studies are needed to confirm the stellar mass and redshift in the current data, and spectroscopic observations should be especially helpful by providing the SEDs of high- galaxies.
4 Conclusion
We explore the FDM as a solution to reconcile the unexpected high stellar mass density of massive galaxies at obtained in the early release measurements and the reionization history. To explain this high density, a large star formation efficiency is probably needed, which may greatly boost the number of ionizing photons and violate the cosmic reionization history measured by current CMB and other observations. The FDM that is composed of ultra-light scalar particles, e.g. ultra-light axions, can effectively suppress the formation of small halos and galaxies due to the galaxy-size de Broglie wavelength. This provides a possible way to solve this problem.
By exploring the FDM with different axion masses, we find that the FDM model can simultaneously fit the cumulative stellar mass density data from the at and the optical depth of the CMB scattering , when the axion mass and for the Planck18 and WMAP9 results, respectively. After considering the reionization history measurements by the IGM ionization fraction , only with is preferred. Although the stellar mass density data at are still too high to explain, we find that the current photo- estimation may have large uncertainties, and the mean redshift of the sample can be as low as if using different SED templates and photo- codes. Besides, other terms, such as galaxy selection, uncertainty of stellar mass, dust extinction and sample variance, can also affect the results. By comparing with the GSMF data given by previous measurements, we find large disagreement with the current data, which indicates that further studies are needed, especially the measurements by spectroscopic observations. With the current uncertainties from both the observational data and model considered, we can estimate a possible range from to . We also notice that, in addition to the FDM, the warm dark matter with keV mass could have similar effect on halo formation as the FDM, and should be worth to investigate in the future work.
References
- Adams et al. (2023) Adams, N. J., Conselice, C. J., Ferreira, L., et al. 2023, MNRAS, 518, 4755-4766
- Armengaud et al. (2017) Armengaud, E., Palanque-Delabrouille, N., Yeche, C., Marsh D. J. E., & Baur, J. 2017, MNRAS, 471, 4606-4614
- Arnouts et al. (1999) Arnouts S., Cristiani S., Moscardini L., Matarrese S., Lucchin F., Fontana A., Giallongo E., 1999, MNRAS, 310, 540
- Barkana & Loeb (2001) Barkana, R., Loeb, A. 2001, PhR, 349, 125-238
- Bhatawdekar et al. (2019) Bhatawdekar, R., Conselice, C., Margalef-Bentabol, B., & Duncan, K. 2019, MNRAS, 486, 3805
- Bouwens et al. (2015a) Bouwens, R. J., Illingworth, G. D., Oesch, P. A., et al. 2015, ApJ, 803, 34
- Bouwens et al. (2015b) Bouwens, R. J., Illingworth, G. D., Oesch, P. A., et al. 2015, ApJ, 811, 140
- Bouwens et al. (2022) Bouwens, R., Illingworth, G., Oesch, P., et al. 2022, arXiv:2212.06683
- Boylan-Kolchin (2022) Boylan-Kolchin, M. 2022, arXiv:2208.01611
- Bozek et al. (2015) Bozek, B., Marsh, D. J. E., Silk, J., & Wyse, R. F. G. 2015, MNRAS, 450, 209-222
- Broadhurst et al. (2020) Broadhurst, T., de Martino, I., Luu, H. N., Smoot, G. F., Tye, S. -H. H. 2020, PRD, 101, 083012
- Brammer et al. (2008) Brammer, G. B., van Dokkum, P. G. & Coppi, P. 2008, ApJ 686, 1503-1513
- Cooray & Sheth (2002) Cooray A., & Sheth, R. 2002, Phys. Rep., 372, 1
- Du et al. (2017) Du, X., Behrens C., & Niemeyer, J. C. 2017, MNRAS, 465, 941-951
- Du et al. (2018) Du, X., Schwabe, B., Niemeyer, J. C., & Burger, D. 2018, PRD, 97, 063507
- Eisenstein & Hu (1998) Eisenstein, D. J., & Hu, W. 1998, ApJ, 496, 605
- Endsley et al. (2022) Endsley, R., Stark, D. P., Whitler, L., et al. 2022, arXiv:2208.14999
- Ferrara et al. (2022) Ferrara, A., Pallottini, A., & Dayal, P. 2022, arXiv:2208.00720
- Finkelstein et al. (2019) Finkelstein, S. L., D’Aloisio, A., Paardekooper, J.-P., et al. 2019, ApJ, 879, 36
- Hinshaw et al. (2013) Hinshaw, G., Larson, D., Komatsu, E., et al. 2013, ApJS, 208, 19
- Hlozek et al. (2015) Hlozek, R., Grin, D., Marsh, D. J. E., & Ferreira, P. G. 2015, PRD, 91, 103512
- Hu et al. (2000) Hu, W., Barkana, R., & Gruzinov, A. 2000, PRL, 85, 1158
- Ilbert et al. (2006) Ilbert O. et al., 2006, A&A, 457, 841
- Irsic et al. (2017) Irsic, V., Viel, M., Haehnelt, M. G., Bolton J. S., & Becker, G. D., 2017, PRL, 119, 031302
- Kaurov & Gendin (2014) Kaurov, A. A., & Gnedin, N. Y. 2015, ApJ, 810, 154
- Kikuchihara et al. (2020) Kikuchihara, S., Ouchi, M., Ono, Y., et al. 2020, ApJ, 893, 60
- Labbe et al. (2022) Labbe I. et al., 2022, arXiv:2207.12446
- Leitherer et al. (1999) Leitherer, C., Schaerer, D., Goldader, J. D. et al., 1999, ApJS, 123, 3-40
- Leitherer et al. (2010) Leitherer, C., et al. 2010, ApJS, 189, 309-335
- Leitherer et al. (2014) Leitherer, C., Ekstrom, S., Meynet, G. et al., 2014, ApJS, 212, 14
- Lidz et al. (2011) Lidz, A., Furlanetto, S. R., Oh, S., P., et al. 2011, ApJ, 741, 70
- Lovell et al. (2022) Lovell, C. C., Harrison, I., Harikane, Y., Tacchella, S., Wilkins, S. M. 2022, arXiv:2208.10479
- Maleki et al. (2020) Maleki, A., Baghram S., & Rahvar, S. 2020, arXiv:2001.04454
- Madau et al. (1999) Madau P., Haardt F., Rees M. J., 1999, ApJ, 514, 648
- Marsh & Silk (2014) Marsh, D. J. E., & Silk, J. 2014, MNRAS, 437, 2652-2663
- Marsh (2016a) Marsh, D. J. E. 2016, Phys. Rep., 643, 1
- Marsh (2016b) Marsh, D. J. E. 2016, arXiv:1605.05973
- Marsh & Niemeyer (2019) Marsh, D. J. E., & Niemeyer, J. C., 2019, PRL, 123, 051103
- Mason et al. (2019) Mason, C. A., Naidu, R. P., Tacchella, S., & Leja, J. 2019, MNRAS, 489, 2669-2676
- Mason et al. (2022) Mason, C. A., Trenti, M., Treu, T., et al. 2022, arXiv:2207.14808
- Menci et al. (2022) Menci, N., Castellano, M., Santini, P., et al. 2022, arXiv:2208.11471
- Mirocha et al. (2017) Mirocha, J., Furlanetto, S. R., Sun, G. 2017, MNRAS, 464, 1365-1379
- Mirocha et al. (2022) Mirocha, J., & Furlanetto, S. R. 2022, arXiv:2208.12826
- Naidu et al. (2022a) Naidu, R. P., Oesch, P., A., van Dokkum, P., et al. 2022, arXiv:2207.09434
- Naidu et al. (2022b) Naidu, R. P., Oesch, P., A., Setton, D. J., et al. 2022, arXiv:2208.02794
- Niemeyer (2019) Niemeyer, J. C. 2019, arXiv:1912.07064
- Oesch et al. (2014) Oesch, P. A., Bouwens, R. J., Illingworth, G. D., et al. 2014, ApJ, 786, 108
- Planck Collaboration et al. (2016) Planck Collaboration et al., 2016, A&A, 594, A13
- Planck Collaboration et al. (2020) Planck Collaboration et al., 2020, A&A, 641, A6
- Press & Schechter (1974) Press, W. H., & Schechter, P. 1974, ApJ, 187, 425
- Robertson et al. (2015) Robertson, B. E., Ellis, R. S., Furlanetto, S. R., Dunlop, J. S. 2015, ApJL, 802, L19
- Safarzadeh & Spergel (2019) Safarzadeh, M., & Spergel, D. N. 2019, arXiv:1906.11848
- Schive et al. (2014) Schive, H.-Y., Chiueh, T., Broadhurst, T. 2014a, Nature Phys., 10, 496
- Schive et al. (2016) Schive, H.-Y., Chiueh, T., Broadhurst, T., & Huang, K.-W. 2016, ApJ, 818, 89
- Schutz (2020) Schutz, K. 2020, arXiv:2001.05503
- Sheth & Tormen (1999) Sheth, R. K., & Tormen, G. 1999, MNRAS, 308, 119
- Song et al. (2016) Song, M., Finkelstein, S. L., Ashby, M. L. N., et al. 2016, ApJ, 825, 5
- Stark et al. (2013) Stark, D. P., Schenker, M. A., Ellis, R., et al. 2013, ApJ, 763, 129
- Stefanon et al. (2021) Stefanon, M., Bouwens, R., J., Labbe, I., et al. 2021, ApJ, 922, 29
- Sun et al. (2021) Sun, G., Mirocha, J., Mebane, R. H., Furlanetto, S. R. 2021, MNRAS, 508, 1954-1972
- Vazquez & Leitherer (2005) Vazquez, G. A., & Leitherer, C. 2005, ApJ, 621, 695-717
- Wyith & Loeb (2003) Wyithe, J. S. B., & Loeb, A. 2003, ApJ, 588, L69-L72.
- Wyith & Loeb (2006) Wyithe, J. S. B., & Loeb, A. 2006, Nature, 441, 322-324
- Yung et al. (2020) Yung, L. Y., Somerville, R. S., Finkelstein, S. L., et al. 2020, MNRAS, 496, 4574-4592
- Ziparo et al. (2022) Ziparo, F., Ferrara, A., Sommovigo, L., & Kohandel, M. 2022, arXiv:2209.06840