EgoSpeed-Net: Forecasting Speed-Control in Driver Behavior from Egocentric Video Data
Abstract.
Speed-control forecasting, a challenging problem in driver behavior analysis, aims to predict the future actions of a driver in controlling vehicle speed such as braking or acceleration. In this paper, we try to address this challenge solely using egocentric video data, in contrast to the majority of works in the literature using either third-person view data or extra vehicle sensor data such as GPS, or both.To this end, we propose a novel graph convolutional network (GCN) based network, namely, EgoSpeed-Net. We are motivated by the fact that the position changes of objects over time can provide us very useful clues for forecasting the speed change in future. We first model the spatial relations among the objects from each class, frame by frame, using fully-connected graphs, on top of which GCNs are applied for feature extraction. Then we utilize a long short-term memory network to fuse such features per class over time into a vector, concatenate such vectors and forecast a speed-control action using a multilayer perceptron classifier. We conduct extensive experiments on the Honda Research Institute Driving Dataset, and demonstrate superior performance of EgoSpeed-Net.
1. Introduction
Understanding and predicting driver behavior is an important problem for road safety, transportation, and autonomous driving. The National Highway Transportation Safety Administration claims that 94%-96% of auto accidents are due to different types of human errors and the majority of them belong to driver negligence or carelessness (Administration, 2017). Shinar et al.. (Shinar et al., 1998) also suggest that drivers are less aware of their skills with more experience, as most of the actions taken by the driver during the driving are unconscious. Building accurate prediction models helps us better understand how and why drivers make their decisions. Such knowledge can also be incorporated into the design of autonomous vehicles and driving simulators.
In this paper we aim to address a challenging problem in driver behavior analysis, namely, speed-control forecasting, using only egocentric (i.e. first-person view point) videos collected along the trip. Instead of simply predicting the speed or trajectory of a vehicle, we focus on the prediction of acceleration and braking behaviors of drivers as they are the most common and essential actions. In addition, a large number of road fatalities are related to speed-control issues (Administration, 2019). In particular, we formulate the problem using multi-class prediction: given a sequence of egocentric video frames, we try to predict the speed-control action (i.e. slight acceleration, full acceleration, slight braking, full braking) in the next (few) frame. Note that we use solely egocentric video data as the input because it best represents the driver’s first-person visual input during driving. We use driver’s braking or accelerating information from pedal sensor data to define the ground-truth behaviors. We do not use the vehicle’s acceleration or GPS information in the input because they are not part of the road environment and may not be available to the driver in real-time. They are therefore unlikely to have a major and immediate impact on drivers’ speed-control behaviors.
Challenges. To address the problem of speed-control forecasting using egocentric video data, following human driving experience, we are motivated by the fact that the position changes of objects over time can provide us very useful clues for forecasting the speed change in future. However, in practice we are facing the following challenges:
-
•
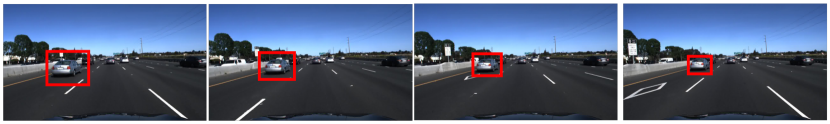
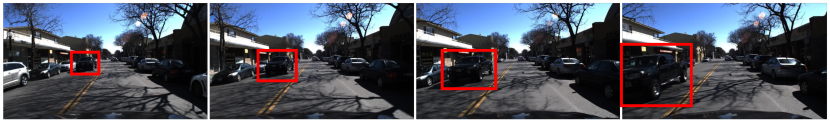
The same speed-control action in different scenarios may lead to different visual observations that could confuse the prediction model significantly. As shown in Figure 1(a), even the labeled car is moving away from the driver’s field of view, his/her speed is still increasing (we know this due to the ground-truth data). Similarly we know that in Figure 1(b) the driver is still speeding up when the labeled car is approaching. Such visual contradictions led by the same speed-control actions widely exist in the real world as well as our evaluation data.
-
•
Drivers are heavily influenced by their surroundings such as traffic conditions, road conditions, nearby vehicles, etc. It will be challenging to identify the consistent relationship, spatially and temporally, among such objects/stuff using egocentric videos that are useful for our prediction.
-
•
The scenes in the egocentric video data are more complicated than those in static cameras because of rapidly dynamical change in objects and background, especially in driving scenarios.
Approaches. Prior works on driver/human behavior prediction include mobility-based methods and vision-based methods. The first group predict behaviors (e.g. movement patterns) using GPS trajectories of vehicles or spatial data (Oliver et al., 2014; Yuan et al., 2018). These techniques do not consider visual input. Vision-based methods typically use fixed camera video data to recognize actions, behaviors, or predict moving paths of pedestrians or drivers (Liang et al., 2020; Shafiee et al., 2021). Some of these works use RCNN-based methods to extract objects from raw pixels. Others model the relationship between objects in the scene as graphs (Hu et al., 2018; Gkioxari et al., 2018). Few recent works in computer vision consider egocentric video data as the input. However, they either predict the behaviors of objects in the scene (not the observer), or use other auxiliary data to help the learning (e.g. spatial trajectories, vehicle sensor readings) (Qiu et al., 2021a, b).
In contrast, our problem differs from these prior works. We aim to predict the future speed-control behavior of a driver, rather than objects in the scene. Note that, the camera collecting our data is also moving, while in the literature the majority of the methods use videos from fixed cameras even from the first-person view. To address the limitations of prior works, we propose an EgoSpeed-Net to learn the spatiotemporal relations among the objects in the videos.
Contributions. Our contributions are listed as follows:
-
•
To the best of our knowledge, we are the first to address the problem of speed-control forecast for driver behavior analysis purely using egocentric video data.
-
•
We propose a novel deep learning solution, namely, EgoSpeed-Net, a seamless integration of graph representations of videos, GCNs (Kipf and Welling, 2017), LSTMs, and an MLP that can be trained end-to-end effectively and efficiently.
-
•
We demonstrate superior performance of our EgoSpeed-Net on the Honda Research Institute Driving Dataset (HDD) (Ramanishka et al., 2018), compared with state-of-the-art methods.
The rest of this paper is organized as follows. Section 2 discusses related work. In Section 3, we define the driver behavior prediction problem and elaborate our proposed EgoSpeed-Net framework. Section 4 presents comprehensive evaluation results. Finally, we conclude the paper in Section 5.

2. Related Work
Mobility-based behavior analysis. Existing works mainly focus on pedestrian trajectory prediction (Xu et al., 2018; Mangalam et al., 2020) and cyclist behavioral studies (Huang et al., 2016; Ding et al., 2020). For example, Mangalam et al. (Mangalam et al., 2020) proposed PECNet to forecast distant pedestrian trajectories conditioned on their destinations. Huang et al. (Huang et al., 2016) represented bicycle movements by taking other road users into consideration using social force model. Few existing works (Liu et al., 2014; Altché and de La Fortelle, 2017) pay attention to driver trajectories prediction. Liu et al. (Liu et al., 2014) estimated the lane change behavior of drivers to predict trajectories. Given a partial GPS trajectory, without any visual input such as images or videos, these methods aim to predict either the destination or the next location along the trajectory. Recent work considered map information and social context. Zaech et al. (Zaech et al., 2020) predicted action sequence of vehicles in urban environments with the help of HD maps. Nevertheless, we only consider egocentric video as input.
Vision-based behavior analysis. In recent years, the applications of deep networks on video analysis have been conducted widely.
-
•
Non-egocentric video data: Traditionally, most works in driver behavior analysis focus on the detection of driver drowsiness and distraction such as drowsing driving, tailgating, lane weaving behavior, etc. Many driver inattention monitoring systems (Volkswagen, 2021; You et al., 2013) have been designed by taking advantage of eye state analysis (Cyganek and Gruszczyński, 2014; Jo et al., 2014), facial expression analysis (Abtahi et al., 2011, 2013), driver physiological analysis (Simon et al., 2011; Baek et al., 2011), etc. Recent studies took the scene context into consideration to predict the pedestrian trajectory (Kosaraju et al., 2019; Sadeghian et al., 2019; Liang et al., 2019) and vehicle movements analysis (Hirayama et al., 2012; Choi and Kim, 2014). Liang et al. (Liang et al., 2020) predicted multiple future trajectories using multi-scale location decoders, while Introvert (Shafiee et al., 2021) proposed a conditional 3D visual attention mechanism to infer human-dependent interactions in the scene context. Some of these driver behavior analyses require facial information of the driver themselves, while others focus on video data recorded from fixed cameras.
-
•
Egocentric video data: Recently, some works have studied on predicting trajectories using egocentric videos (Soo Park et al., 2016; Yagi et al., 2018; Yao et al., 2019). Park et al. (Soo Park et al., 2016) associated a trajectory with the EgoRetinal map to predict a set of plausible trajectories of the camera wearer, while Yagi et al. (Yagi et al., 2018) inferred future locations of people in the video with their past poses, locations and scales, as well as ego-motion. Qiu et al. (Qiu et al., 2021b) proposed an LSTM-based encoder-decoder framework for trajectory prediction of human captured in the scene, while Qiu et al. (Qiu et al., 2021a) integrated a cascaded cross-attention mechanism in a Transformer-based encoder-decoder framework to forecast the trajectory of the camera wearer. Meanwhile, some works focus on ego action anticipation (Fernando and Herath, 2021; Grauman et al., 2021). Fernando et al. (Fernando and Herath, 2021) anticipated human actions by correlating past with the future with Jaccard similarity measures, while Tran et al. (Tran et al., 2021) distilled information from the recognition model to supervise the training of the anticipation model using unlabeled data. However, most drivers behavior depend on movements of objects they have seen. At current stage, we assume all drivers’ behaviors are taken only based on past videos without any future anticipation.
In contrast, we aim at predicting the behaviors of a driver (i.e. the observer) whose movement patterns are likely to be different from those of the pedestrians/vehicles in the scene or the camera wearer. Note that some works utilized multiple modalities. However, the GPS signals are not always accessible or reliable. Our approach only uses the egocentric data as input without any other datasets such as drivers’ trajectories data or vehicles’ various sensor data.
Graph neural networks. For video understanding, early works (Simonyan and Zisserman, 2014; Wang et al., 2016) considered the spatial and temporal relationship separately and then fuse the extracted features. Recently, more works pay attention to visual relationships among object instances in space and time (Hu et al., 2018; Gkioxari et al., 2018). Inspired by object graphs (Jain et al., 2016; Yuan et al., 2017) and GCNs, Wang and Gupta (Wang and Gupta, 2018) proposed to represent videos as space-time region graphs, which model spatial-temporal relations and capture the interactions between human and nearby objects. Xu et al. (Xu et al., 2020) adopted GCNs to localize temporal action with multi-level semantic context in video understanding. Li et al. (Li et al., 2021) designed MUSLE to produce 3D bounding boxes in each video clip and represent videos as discriminative sub-graphs for action recognition problem.
In contrast, our approach is also based on GCNs, but we differ from them in: 1) We aim to predict the behavior of the observer rather than actors in the scene; 2) The camera collecting our data is always moving, while the majority of the existing methods use videos from fixed cameras; 3) Our approach is designed with multi-view object relation graphs, which can reveal different underlying patterns of moving objects from multiple views of the scene.
3. Our Approach: EgoSpeed-Net
Given a sequence of frames from an egocentric video, our goal is to forecast the speed-control action of the driver in the next (few) frame***By default, for simplicity in explanation we consider the next frame in the paper without explicitly mentioning.. We denote a video clip at the current time as , where each is an image of frame . We aim at learning a prediction function to forecast the speed-control action in the next -frame, , based on the current data , where is a multi-valued categorical variable (e.g., different levels of acceleration and braking).
3.1. Overview of EgoSpeed-Net
The framework of our proposed model is visualized in Figure 2. Given a sequence of frames from the egocentric video data, we first extract feature vectors of objects in the scene, which adopts Mask R-CNN (He et al., 2017) to detect objects for each frame. Then, we use the bounding box coordinates to represent objects and select top objects in each frame according to their identified confidence scores and traffic-related categories (e.g. car, pedestrian, traffic light, stop sign, etc.). Specifically, we identify objects and select top , and for vehicle-category (including cars, buses and trucks), pedestrian-category, and traffic-category (including traffic lights and stop signs)†††Empirically we observe that such six semantic object categories are sufficient for analyzing the driving scenarios in our data., respectively. Therefore, the feature dimension is after identifying objects, where . Formally, the object feature is defined as follows:
| (1) |
where car, pedestrian, traffic and . In detail, for identified objects belonging to category in frame , we aggregate corresponding feature matrix , where is the bounding box coordinates of the -th object in category in frame , the total number of top identified objects is , and car, pedestrian, traffic.
Afterwards, based on the bounding box coordinates of the objects, we build object relation graphs, where each node denotes an object. Each edge in the graphs connects two objects from the same category in each frame. Besides, we classify these graphs according to their categories to provide multiple views of the scene. Next, we perform K-hop localized spectral graph convolution on each object relation graph to capture the local spatial relations among objects in each frame. After graph convolution, we max pool over each object relation graph to aggregate the localized spatial features from the nearby objects, which is in -dimension. For each view, we extract the -dimensional matrix to represent feature vectors of objects.
Finally, we apply a standard multi-layer Long Short-Term Memory (LSTM) to learn the temporal dependencies between correlated objects. After graph convolution and a temporal layer, the representations of object relation graphs are fused together to generate spatiotemporal features of objects across space and time. Then, a classifier for predicting the speed-control behavior will be applied on these spatiotemporal features. We adopt a Multi Layer Perceptron (MLP) layer following with a softmax function for the driver behavior classification.
3.2. Modeling Spatial Relations among Objects
As mentioned before, object relation graph is the core of our EgoSpeed-Net. Because the objects identified in each frame are unstructured data and the movements of these objects are dynamic, it is hard to capture these patterns in fixed matrices. Meanwhile, the recent work of Graph Convolution Networks (GCNs) (Kipf and Welling, 2017)-based models can successfully learn rich relation information from non-structural data and infer relational reasoning on graph (Wu et al., 2019; Chen et al., 2019; Li et al., 2021). Motivated by these characteristics, we first model the spatial relation between nearby objects by organizing them as graphs and extracting latent representations through graph convolution. Then, we adopt the LSTM-based method to model the temporal evolution of such object relations. We therefore model the spatiotemporal relations among objects across space and time.
Graph definition. For each frame, the nodes in graph correspond to a set of objects , where car, pedestrian, traffic, is the total number of top identified objects. (To be convenient, we ignore frame here.) We construct graph to represent the pairwise relations among objects in -category, where relation value of each edge measures the interactions between two objects. Currently, we assume each is a complete graph with all edges equal to 1. The importance of the edge value and the edge type will be explored in our future work.
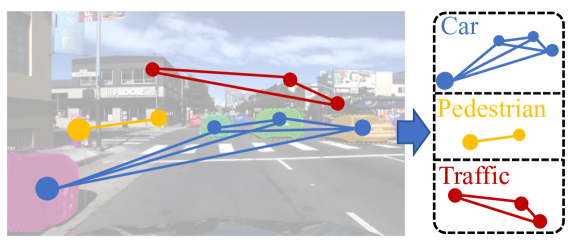
Multi-view object relation graphs. A single object relation graph typically refers to the -category in a specific frame . To capture dynamic patterns of objects in different category, we build a sequence of graphs on the object feature matrices of objects belonging to the -category across different frames, where is the number of frames. As a result, there are 3 graphs in each frame and graphs in total for each sample. Figure 3 illustrates this process. Building such multi-view graphs allows us to capture the local spatial relations of objects from the same category at different frames and then jointly consider the relations of relative changes across time from multiple view. Therefore, our approach can learn the spatiotemporal relations between objects more sufficiently.
Graph convolution. Different from convolution operations on images, the graph convolutions allow us to compute the response of a node based on its neighbors defined by the graph relations. To save computational cost and extract localized features, we apply the -hop localized spectral graph convolution (Kipf and Welling, 2017). Specifically, if , we only use the features of the nearest object and itself to update the representations of each object. However, the nearest object is insufficient to represent the localized features. As mentioned in Section 1, the speed-control behavior is not only affected by the nearest object, but also by the relative position of nearby objects. To consider high-order neighborhood of each object, we can extract more sufficient information from its neighboring objects to reveal its moving pattern.
Formally, given feature matrix and adjacency matrix‡‡‡For frames with few objects, we make up the 0-vector in addition to identified object features and assume these objects are isolated with diagonal adjacency matrix. , we compute the normalized Laplacian matrix ,where is the degree matrix. (To be convenient, we ignore the category and frame at this part.) The Laplacian matrix is symmetric positive semi-definite such that it can be diagonalized via eigen-decomposition as ,where is a diagonal matrix containing the eigenvalues, consists of the eigenvectors, and is the transpose of . We can approximate the spectral convolution by employing with -th order Chebyshev polynomial,
| (2) |
Therefore, it is much more efficient with only learnable parameters and no more eigen-decomposition of . Besides, it also updates features of each object node by aggregating -hop neighborhood information.
3.3. Modeling Temporal Dependencies
Temporal context information of each frame is crucial to capture the dynamic dependencies of objects in the consecutive scenes. Particularly, for long-range temporal dependencies, it is necessary to learn the semantic meaning of relative relations from the movements of objects in the scenes. In order to model the dynamics of both shape and location changes, we first max pool the output features of graph convolution over nodes to aggregate the local spatial relation information and then apply a standard multi-layer LSTM to extract the temporal features of objects from the same category. Because the movements of objects from different categories are significantly different, we pay attention to the different underlying patterns of moving objects in the scene. For example, the objects from the traffic-category are always static, while the pedestrians and cars are moving randomly based on their own intentions. To implement this idea, we propose parallel LSTMs with joint training. Specifically, we jointly train three sub-LSTMs on the training set. Each of the sub-LSTMs models the moving pattern of objects from the same category. We parallelize the three sub-LSTMs and merge them with a concatenate layer to jointly infer the speed-control behavior.
Finally, we can predict the speed-control behavior of a driver as follows:
| (3) | ||||
where is the aggregated representation of the object relation graph in -category, car, pedestrian, traffic. is the spatiotemporal features extracted from the object relation graph in -category. is the final feature. and are weight matrix and bias vector, respectively. denotes an activation function, and we adopt Softmax here.
Overall, the EgoSpeed-Net can be trained in an end-to-end manner. We adopt the Cross Entropy loss for this multi-class prediction problem.
| (4) |
where is the ground-truth behavior label and is the softmax probability for the -th class of sample , respectively. is the total number of egocentric video clip samples in a training batch.
4. Experiments
In this section, we first introduce the dataset and the implementation details of our proposed EgoSpeed-Net. Then, we compare the performance with the state-of-the-art methods. We also conduct extensive experiments to validate the effectiveness of proposed components in our model. Finally, we demonstrate a case study.
Dataset. We adopt the Honda Research Institute Driving Dataset (HDD) (Ramanishka et al., 2018). The dataset includes 104 hours of real human driving in the San Francisco Bay Area collected using an instrumented vehicle equipped with different sensors. The current data collection spans from February 2017 to October 2017. The video is converted to a resolution of 1280 720 at 30 fps. We down sample the egocentric video data (i.e. only 3 frames per second are taken) and exclude the initial stop part (The driver in the first frame of a valid clip should be moving). Besides, we also exclude vague video clips that are difficult to identify objects in the scene, including heavy rainy road condition, overexposed light condition, dark night condition, etc. At current stage, we aim to forecast driver behavior on both highway and urban scenarios without turning (i.e. steering wheel angle is within range [-30, 30] degrees). Based on the observations, drivers mostly keep driving forward except for changing routes or overtaking. In reality, if a driver wants to change the direction, he/she has to observe the surroundings through the rear-view mirror for safety. Therefore, such decisions are self-determined and it is hard to predict without information from the rear mirror. We leave it for future work. After processing the data as described above, we generated 58721 video clips in total (29275 from highway while 29446 from urban) and we use 70% (41105 samples) for training, 10% (5872 samples) for validation, and rest 20% (11744 samples) for testing.
| Method |
|
|
|
|
Overall | GCN |
|
|
||||||||||||
| TRN (Xu et al., 2019) | 77.9 | 75.40 | 53.45 | 45.65 | 67.00 | - | - | ✓ | ||||||||||||
| STIN (Materzynska et al., 2020) | 81.18 | 67.89 | 48.26 | 54.67 | 66.62 | - | ✓ | ✓ | ||||||||||||
| PointNet (Qi et al., 2017) | 53.64 | 57.06 | 10.32 | 36.63 | 44.38 | - | - | - | ||||||||||||
| PointNet (Qi et al., 2017)+T | 61.44 | 56.57 | 20.74 | 42.31 | 49.63 | - | - | ✓ | ||||||||||||
| Base | 67.09 | 64.35 | 32.56 | 45.29 | 56.45 | ✓ | - | - | ||||||||||||
| Base+Single | 74.34 | 56.52 | 29.39 | 49.12 | 56.63 | ✓ | - | - | ||||||||||||
| Base+Multi | 79.09 | 71.96 | 37.12 | 53.90 | 65.22 | ✓ | ✓ | - | ||||||||||||
| Base+T | 86.95 | 85.57 | 54.85 | 68.43 | 77.75 | ✓ | - | ✓ | ||||||||||||
| EgoSpeed-Net | 91.71 | 87.23 | 60.45 | 79.03 | 82.78 | ✓ | ✓ | ✓ |
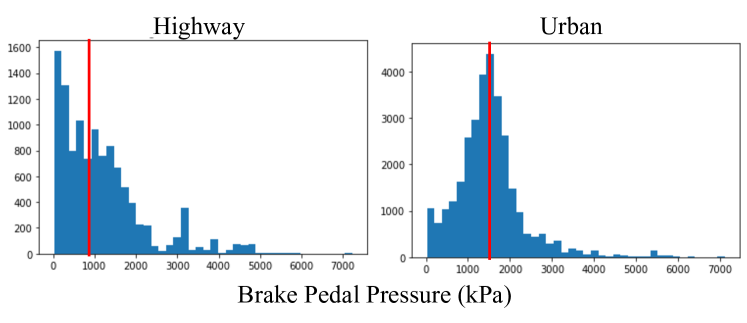
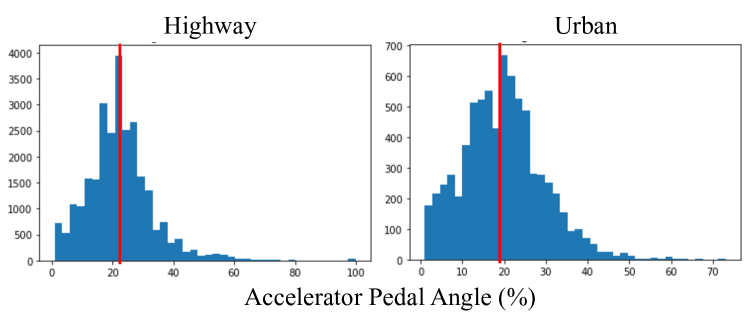
Speed-control actions: HDD (Ramanishka et al., 2018) provides a list of vehicle’s various sensors data. As shown in Figure 4, we use the brake pedal pressure and the percentage of accelerator pedal angle to derive our driver speed-control behaviors and use the steering wheel angle to select samples without turning. These sensor data are only used to generate ground truth labels and not used as the input of our model. In this paper, we define two levels of braking and acceleration behavior based on the braking pedal pressure and the percentage of accelerator pedal angle collected, respectively. We name the four actions Full Braking, Slight Braking, Slight Acceleration, and Full Acceleration. According to the histogram of brake pedal pressure in Figure 4(a), we see that the braking behavior of drivers in different environment shows different patterns. Therefore, we set 958 kPa and 1461 kPa (median value of its histogram) as the threshold of two braking levels for highway and urban scenarios, respectively. In other words, given a pedal pressure with 1000 kPa, we assume the driver is full braking in the highway scene, but slight braking in the urban scene. Similarly, according to the percentage of accelerator pedal angle in Figure 4(b), we set 22% and 19% (median value of its histogram) as the threshold of two acceleration levels for highway and urban scenarios, respectively. As a result, we have 19727, 18546, 9607, and 10841 samples for full braking, slight braking, slight acceleration, and full acceleration, respectively. In the training phase, we oversample the slight acceleration and full acceleration behaviors to overcome the imbalanced data problem.
Implementation. We set up the experiments on a High Performance Computing Cluster using a 256 GB RAM computing node with 2.6 GHz 16-Core CPU with Nvidia Tesla P100 Accelerator Cards. The primary development package is based on PyTorch 0.4.0 in Python 3.6.
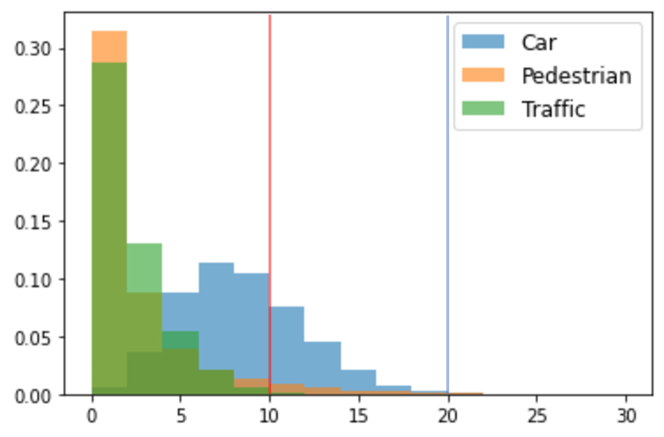
Given a video clip with history length frame, we first apply the Mask R-CNN (Lin et al., 2014) using a ResNet-50-FPN backbone with pre-trained weights on the COCO dataset to select Top objects in each frame according to their confidence scores in related categories. For scenes with few identified objects, we fill the object features with 0 if there are not enough objects found in the scene. The histogram of identified objects from different categories are shown in Figure 5. To include most objects in the scene, we set and . Therefore, we generate feature matrices in dimension, where and 4 represents for the bounding box coordinates of each object in the frame. Then, we build object relation graphs and perform a two layer -hop spectral graph convolution on them with 16 and 32 hidden nodes, respectively. After max pooling, the spatial feature vector is in =32 dimension. We apply a two layer LSTMs with 64 hidden units and the dimension of the output spatial-temporal feature is =64. Finally, the behavior classifier consists of 2 hidden layers with 64 and 32 hidden nodes and followed by an output layer with an activation function softmax. In all experiments, we adopt early stopping criteria, set the batch size as 512, and select the Adam algorithm with default settings as our optimizer. In our experimental settings, if the validation loss decreased less than after 50 epochs, the training will be terminated. In the end, we save the best weights instead of the latest weights.
4.1. State-of-the-art Comparison
To validate the effectiveness of our proposed method on the driver speed-control behaviors prediction problem, we compare the EgoSpeed-Net with the state-of-the-art methods on the Honda Dataset (Ramanishka et al., 2018). For all experiments, our problem settings include history length , future time , and neighborhood size . The default setting is =10, =1, and =1. Here, future time indicates that instead of predicting the speed-control behavior at next frame , we only predict he behavior at exactly the frame . Table 1 summarizes the comprehensive experimental results on EgoSpeed-Net with the state of the art. Baseline models are as follows.
-
•
PointNet (Qi et al., 2017) is a well-known deep network architecture for point clouds (i.e. unordered point sets) and we consider the object features as a set of point clouds. Note that we conduct the necessary normalization and argumentation on our data, including random 4d rotation and adding random noise. Because we only select Top objects in each frame, we set the hidden dimensions of multi-layer perceptron layers as (16,32,128,64,32) instead of (64,128,1024,512,256) in the original experimental settings.
-
•
Temporal Recurrent Network (TRN) (Xu et al., 2019) is proposed to model greater temporal context for the online action recognition problem. For fair comparison, we exclude the parts involving sensor data and extract the same visual feature from the layer in InceptionResnet-V2 (Szegedy et al., 2017) pretrained on ImageNet (Krizhevsky et al., 2012) as done in TRN.
-
•
Spatial-Temporal Interaction Network (STIN) (Materzynska et al., 2020) is proposed to model the interaction dynamics of objects composed in an action for compositional action recognition. To be fair, we use the bounding box coordinates of Top identified objects in the scene as input and follow the same hyper parameter settings in STIN.
Metrics. Recall and accuracy are used to evaluate our model:
where and are the numbers of correctly predicted samples and all samples for each action class , respectively.
As shown in Table 1, our proposed method, EgoSpeed-Net, outperforms all the existing methods consistently with a good margin. Particularly, the Slight Acceleration behavior is the most difficult one to predict for all methods. EgoSpeed-Net is the only one whose accuracy exceed 60%. Others are all around 50% or less. For both Slight Braking and Full Braking behavior, EgoSpeed-Net can achieve 90% accuracy. This outstanding performance shows the effectiveness of our approach EgoSpeed-Net with capability of simultaneously and sufficiently capturing the local spatial relationships and temporal dependencies among identified objects across space and time.
4.2. Ablation Study
In this subsection, we investigate the impact of each design in EgoSpeed-Net. Comprehensive results are summarized in Table 1.
Object relation graphs. We first evaluate the benefit of building object relation graphs over using the original object features. As an alternative, we substitute the object relation graph with a PointNet (Qi et al., 2017) module as described in subsection 4.1. For each frame, we feed the Top object features into shared Multi-Layer Perceptron (MLP) and then aggregate point features by max pooling over each image. Finally, we concatenate the informative points of point cloud across the frame and feed them into the MLP followed by a softmax function. To be fair, we compare its performance with the basic version of EgoSpeed-Net, namely, “Base” in Table 1. The base model only includes car-graph from multi-view and feeds the spatial features directly to the classifier to predict the speed-control behavior of a driver, while skipping the temporal layer. As shown in Table 1, “Base” outperforms PointNet for all speed-control behaviors. It demonstrates that building such graph structure allow us to model the interactions between objects in the same frame more completely and efficiently, while assuming these object features as a set of point clouds may miss some spatial relations.
Multi-view graphs. We also perform the ablation study on the multi-view design to validate its effectiveness. The results are list in Table 1 with label ”Base+Multi”. It suggests that providing the multi view of different categories can model more diverse relations from each other and collect more sufficient information for better representation. The accuracy from multiple views is increased by 15% of the Base model. In addition, we also consider building a single objects relation graph using all objects from all categories, namely Base+Single. Given that we observe results similar to the Base model, we conclude that simply involving more objects into the car-graph does not provide additional information. Therefore, it is necessary to build the object relation graphs from multiple views.
Temporal module. Furthermore, we investigate how the temporal module influences the overall performance. First, we evaluate the impact of introducing a standard two layers LSTMs into the Base model. As shown in Table 1, we observe that adding such a temporal module leads to significant and consistent improvement (overall accuracy increase up to 40% of original value) compared with the Base model and is able to further boost overall accuracy from 77.75% to 82% by combining with aforementioned multi-view design. Then, we compare the performance of including an extra temporal module on other methods. For example, we add the same LSTMs layer before the speed-control behavior classifier in PointNet. We report the accuracy measures of these two methods with label ”Base+T” and ”PointNet (Qi et al., 2017)+T” in Table 1. We see that the temporal module is helpful to improving the performance of both methods. Moreover, our Base model can take full advantage of the extracted temporal features with higher improvement compared with PointNet. Note that combining the multi-view design and temporal module design together is our proposed approach, EgoSpeed-Net, which demonstrates that our framework can effectively and sufficiently model the spatiotemporal relation between objects across space and time.
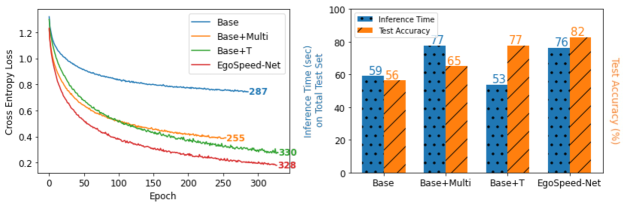
Efficiency analysis. We evaluate the efficiency of each component in EgoSpeed-Net. Figure 6 shows the comparison of training loss curve of different variations, as well as inference time on the total test dataset. Because of the early stopping criteria, Base and Base+Multi stop before overfitting. These curves clearly show that EgoSpeed-Net learns the driver behavior efficiently at first few epochs while its loss drops significantly. Comparing the inference time of Base+Multi and Base+T, we see that the multi-view component is time consuming. Particularly, Base+T model is the most efficient one at the expense of 5% decrease of accuracy compared with EgoSpeed-Net. However, if we average the inference time on the entire test set, the increased time of EgoSpeed-Net is still acceptable.
| Set | Method |
|
|
|
|
Overall |
|
|
|
||||||||||||||
| 1 | Base | 65.63 | 54.43 | 20.81 | 48.28 | 51.49 | 2 | 5 | 1 | ||||||||||||||
| Base+Multi | 74.59 | 70.20 | 25.81 | 61.90 | 62.81 | ||||||||||||||||||
| Base+T | 68.26 | 60.02 | 24.45 | 53.48 | 55.7 | ||||||||||||||||||
| EgoSpeed-Net | 78.18 | 71.58 | 27.32 | 61.24 | 64.57 | ||||||||||||||||||
| 2 | Base | 71.01 | 63.12 | 33.75 | 46.77 | 57.85 | 15 | 5 | 1 | ||||||||||||||
| Base+Multi | 77.16 | 78.53 | 37.22 | 60.22 | 67.83 | ||||||||||||||||||
| Base+T | 91.73 | 87.73 | 71.54 | 74.83 | 83.97 | ||||||||||||||||||
| EgoSpeed-Net | 92.50 | 89.06 | 71.12 | 83.67 | 86.25 | ||||||||||||||||||
| 3 | Base | 71.81 | 60.18 | 24.76 | 56.77 | 57.60 | 15 | 1 | 1 | ||||||||||||||
| Base+Multi | 78.2 | 77.89 | 38.39 | 58.54 | 67.86 | ||||||||||||||||||
| Base+T | 90.36 | 87.22 | 67.16 | 80.69 | 83.74 | ||||||||||||||||||
| EgoSpeed-Net | 92.26 | 88.86 | 68.76 | 83.54 | 85.69 | ||||||||||||||||||
| 4 | Base | 72.81 | 66.11 | 26.10 | 44.06 | 57.74 | 15 | 5 | 10 | ||||||||||||||
| Base+Multi | 82.07 | 76.08 | 31.85 | 61.18 | 68.18 | ||||||||||||||||||
| Base+T | 91.36 | 88.87 | 72.26 | 79.89 | 85.32 | ||||||||||||||||||
| EgoSpeed-Net | 93.27 | 91.22 | 78.94 | 82.49 | 88.26 |
Exploration of different settings. With all the design choices set, we also evaluate their performance with different settings. The results are summarized in Table 2. Here, we list four sets of experiments. Set 2 has the basic settings with history length , neighborhood size , and future time . The variation of history length, neighborhood size and future time is shown in Set 1 (), Set 3 () and Set 4 (), respectively. Comparing Set 1 and Set 2, we observe that the multi view design makes the most contribution to the improvement when history length . As history length increases, the temporal module becomes the main contributor with 56% accuracy improvement, while multi view only boosts 27%. This observation shows that the longer the history, the more effective the time module. Comparing Set 2 and Set 3, except slight acceleration, when more objects are included in the neighborhood, the improvement of other 3 behaviors is limited. We see that the information of the nearest object is sufficient enough to capture the underlying spatial relation between objects in the scene for full braking, slight braking and full acceleration behaviors. However, the slight acceleration is the most difficult behavior to predict, which requires more information from nearby objects in the scene. Comparing Set 2 and Set 4, we see that our approach can predict the speed-control behavior more accurately at future frame. Given a video clip, a driver needs time to response to the environment. This reaction time differs from person to person. Therefore, it is hard to tell the most accurate predicted frame. Our model yields the best performance of slight acceleration behavior with a significant improvement of 11%.
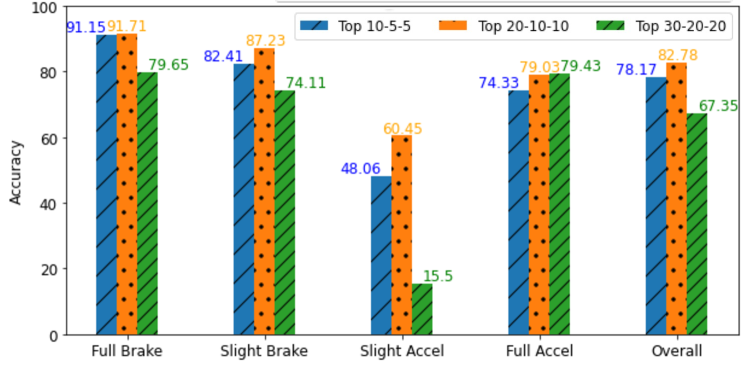
Exploration of different Top objects. We also evaluate EgoSpeed-Net with different Top objects. According to the histogram of identified objects in Figure 5, we select the Top with a set of smaller numbers ( and ) and a set of larger numbers ( and ). Results are shown in Figure 7. According to the histogram, Top 10-5-5 select only part of objects in the scene, while Top 20-10-10 include most objects. We see that including as many objects as possible will complement the information of the scene and improve the prediction accuracy of the speed-control behaviors. However, if we select all objects in the scene with Top 30-20-20 settings, the performance will decrease. For example, the number of identified objects from car-related categories in most scenes is less than 20 referring to Figure 5. Therefore, changing the number to a larger number (e.g., 30) may not make much difference and may cause the matrix to be very sparse. Similar to the pedestrian and traffic-related categories, selecting too many objects may lead to the sparse matrix. As a result, we select the best settings with Top and in our experiments.

4.3. Case Study
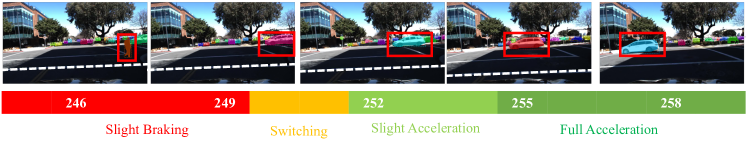
As shown in Table 1 and 2, the slight acceleration is the most difficult behavior to predict with the lowest accuracy among the speed-control behaviors. Figure 8(a) showcases the speed-control behaviors of a driver during a few consecutive frames (245-259). To be convenient, we sample one frame per second to represent the scene observed along the route of the driver. After the pedestrian has crossed the road, the driver has already started to accelerate even if there is a car moving horizontally from right to left in the scene. In detail, the driver starts accelerating at frame 252 and there is a certain distance from the crosswalk. After slightly accelerating for 3 frames, the driver approaches the crosswalk and starts fully accelerating. Comparing frame 249 and frame 252, except for the moving car marked in the red rectangle, there is no changes of other objects in the scene. Based on the relative change of the locations of this moving car, the driver decides to accelerate. Compared with other methods, our model can predict it successfully. This example demonstrates that our approach can capture such small relative changes of objects in few consecutive frames and reveal the underlying pattern of slight acceleration behavior. Another example in Figure 8(b) shows the slight braking behavior from frame 7127 to 7139. When a car appears from a cross, the driver decides to slight braking. At frame 7133, our model predicts it as full braking, which is acceptable. We see that it is hard to distinguish between slight braking and full braking in lack of the speeding information. In future, we will extract more information from the scene to complement the video understanding.
5. Conclusion
This paper investigated the problem of predicting the speed-control in driver behavior. Given a segment of egocentric video recorded from a continuous trip, we aim at learning a model to predict the speed-control behavior of a driver based on the visual contents from his/her point of view in the past few seconds. This problem is important for understanding the behaviors of drivers in road safety research. Prior work did not address this problem as they either used static camera data or only predicted behaviors of targeted objects in the scene rather than the observer. Few of them estimated the egocentric trajectories but required extra data (e.g. trajectories, or sensor data). In this paper, we proposed EgoSpeed-Net, a GCN-based framework to address the problem. EgoSpeed-Net uses multi view object graphs and paralleled LSTMs design to model diverse relations of objects in the scene across space and time. Experiment results on the HDD showed that our proposed solution outperforms the state-of-the-art methods.
Acknowledgements
Yichen Ding and Xun Zhou were funded partially by Safety Research using Simulation University Transportation Center (SAFER-SIM). SAFER-SIM is funded by a grant from the U.S. Department of Transportation’s University Transportation Centers Program (69A3551747131). However, the U.S. Government assumes no liability for the contents or use thereof. Ziming Zhang was supported in part by NSF grant CCF-2006738. Yanhua Li was supported in part by NSF grants IIS-1942680 (CAREER), CNS-1952085, CMMI-1831140, and DGE-2021871.
References
- (1)
- Abtahi et al. (2011) Shabnam Abtahi, Behnoosh Hariri, and Shervin Shirmohammadi. 2011. Driver drowsiness monitoring based on yawning detection. In IEEE International Instrumentation and Measurement Technology Conference. IEEE, 1–4.
- Abtahi et al. (2013) Shabnam Abtahi, Shervin Shirmohammadi, Behnoosh Hariri, Daniel Laroche, and Luc Martel. 2013. A yawning measurement method using embedded smart cameras. In IEEE International Instrumentation and Measurement Technology Conference. IEEE, 1605–1608.
- Administration (2017) National Highway Transportation Safety Administration. 2017. 2016 Fatal Motor Vehicle Crashes: Overview. Traffic Safety Facts—Research Note (Oct 2017).
- Administration (2019) National Highway Transportation Safety Administration. 2019. Risk Driving—Speeding. United States Department of Transportation (2019). https://www.nhtsa.gov/risky-driving/speeding
- Altché and de La Fortelle (2017) Florent Altché and Arnaud de La Fortelle. 2017. An LSTM network for highway trajectory prediction. In 20th IEEE International Conference on Intelligent Transportation Systems (ITSC). IEEE, 353–359.
- Baek et al. (2011) Hyun Jae Baek, Gih Sung Chung, Ko Keun Kim, and Kwang Suk Park. 2011. A smart health monitoring chair for nonintrusive measurement of biological signals. IEEE Trans. on Information Technology in Biomedicine 16, 1 (2011), 150–158.
- Chen et al. (2019) Yunpeng Chen, Marcus Rohrbach, Zhicheng Yan, Yan Shuicheng, Jiashi Feng, and Yannis Kalantidis. 2019. Graph-based global reasoning networks. In Proceedings of the IEEE/CVF Conference on Computer Vision and Pattern Recognition. 433–442.
- Choi and Kim (2014) In-Ho Choi and Yong-Guk Kim. 2014. Head pose and gaze direction tracking for detecting a drowsy driver. In International Conference on Big Data and Smart Computing (BIGCOMP). IEEE, 241–244.
- Cyganek and Gruszczyński (2014) Bogusław Cyganek and Sławomir Gruszczyński. 2014. Hybrid computer vision system for drivers’ eye recognition and fatigue monitoring. Neurocomputing 126 (2014), 78–94.
- Ding et al. (2020) Yichen Ding, Xun Zhou, Han Bao, Yanhua Li, Cara Hamann, Steven Spears, and Zhuoning Yuan. 2020. Cycling-Net: A Deep Learning Approach to Predicting Cyclist Behaviors from Geo-Referenced Egocentric Video Data. In International Conference on Advances in Geographic Information Systems. 337–346.
- Fernando and Herath (2021) Basura Fernando and Samitha Herath. 2021. Anticipating human actions by correlating past with the future with Jaccard similarity measures. In IEEE/CVF Conference on Computer Vision and Pattern Recognition. 13224–13233.
- Gkioxari et al. (2018) Georgia Gkioxari, Ross Girshick, Piotr Dollár, and Kaiming He. 2018. Detecting and recognizing human-object interactions. In Proceedings of the IEEE Conference on Computer Vision and Pattern Recognition. 8359–8367.
- Grauman et al. (2021) Kristen Grauman, Andrew Westbury, Eugene Byrne, Zachary Chavis, Antonino Furnari, Rohit Girdhar, Jackson Hamburger, Hao Jiang, Miao Liu, Xingyu Liu, et al. 2021. Ego4d: Around the world in 3,000 hours of egocentric video. arXiv preprint arXiv:2110.07058 (2021).
- He et al. (2017) Kaiming He, Georgia Gkioxari, Piotr Dollar, and Ross Girshick. 2017. Mask R-CNN. In The IEEE International Conference on Computer Vision (ICCV).
- Hirayama et al. (2012) Takatsugu Hirayama, Kenji Mase, and Kazuya Takeda. 2012. Detection of driver distraction based on temporal relationship between eye-gaze and peripheral vehicle behavior. In IEEE International Conference on Intelligent Transportation Systems. IEEE, 870–875.
- Hu et al. (2018) Han Hu, Jiayuan Gu, Zheng Zhang, Jifeng Dai, and Yichen Wei. 2018. Relation networks for object detection. In IEEE Conference on Computer Vision and Pattern Recognition. 3588–3597.
- Huang et al. (2016) Ling Huang, Jianping Wu, Feng You, Zhihan Lv, and Houbing Song. 2016. Cyclist social force model at unsignalized intersections with heterogeneous traffic. IEEE Trans. on Industrial Informatics 13, 2 (2016), 782–792.
- Jain et al. (2016) Ashesh Jain, Amir R Zamir, Silvio Savarese, and Ashutosh Saxena. 2016. Structural-rnn: Deep learning on spatio-temporal graphs. In Proceedings of the IEEE Conference on Computer Vision and Pattern Recognition. 5308–5317.
- Jo et al. (2014) Jaeik Jo, Sung Joo Lee, Kang Ryoung Park, Ig-Jae Kim, and Jaihie Kim. 2014. Detecting driver drowsiness using feature-level fusion and user-specific classification. Expert Systems with Applications 41, 4 (2014), 1139–1152.
- Kipf and Welling (2017) Thomas N Kipf and Max Welling. 2017. Semi-supervised classification with graph convolutional networks. International Conference on Learning Representations.
- Kosaraju et al. (2019) Vineet Kosaraju, Amir Sadeghian, Roberto Martín-Martín, Ian Reid, S Hamid Rezatofighi, and Silvio Savarese. 2019. Social-bigat: Multimodal trajectory forecasting using bicycle-gan and graph attention networks. arXiv preprint arXiv:1907.03395 (2019).
- Krizhevsky et al. (2012) Alex Krizhevsky, Ilya Sutskever, and Geoffrey E Hinton. 2012. Imagenet classification with deep convolutional neural networks. Advances in Neural Information Processing Systems 25 (2012), 1097–1105.
- Li et al. (2021) Dong Li, Zhaofan Qiu, Yingwei Pan, Ting Yao, Houqiang Li, and Tao Mei. 2021. Representing Videos As Discriminative Sub-Graphs for Action Recognition. In IEEE/CVF Conference on Computer Vision and Pattern Recognition. 3310–3319.
- Liang et al. (2020) Junwei Liang, Lu Jiang, Kevin Murphy, Ting Yu, and Alexander Hauptmann. 2020. The garden of forking paths: Towards multi-future trajectory prediction. In IEEE/CVF Conference on Computer Vision and Pattern Recognition. 10508–10518.
- Liang et al. (2019) Junwei Liang, Lu Jiang, Juan Carlos Niebles, Alexander G Hauptmann, and Li Fei-Fei. 2019. Peeking into the future: Predicting future person activities and locations in videos. In IEEE Conference on Computer Vision and Pattern Recognition. 5725–5734.
- Lin et al. (2014) Tsung-Yi Lin, Michael Maire, Serge Belongie, James Hays, Pietro Perona, Deva Ramanan, Piotr Dollár, and C Lawrence Zitnick. 2014. Microsoft coco:Common objects in context. In European Conference on Computer Vision. Springer, 740–755.
- Liu et al. (2014) Peng Liu, Arda Kurt, and Ümit Özgüner. 2014. Trajectory prediction of a lane changing vehicle based on driver behavior estimation and classification. In IEEE Conference on Intelligent Transportation Systems. IEEE, 942–947.
- Mangalam et al. (2020) Karttikeya Mangalam, Harshayu Girase, Shreyas Agarwal, Kuan-Hui Lee, Ehsan Adeli, Jitendra Malik, and Adrien Gaidon. 2020. It is not the journey but the destination: Endpoint conditioned trajectory prediction. In European Conference on Computer Vision. Springer, 759–776.
- Materzynska et al. (2020) Joanna Materzynska, Tete Xiao, Roei Herzig, Huijuan Xu, Xiaolong Wang, and Trevor Darrell. 2020. Something-else: Compositional action recognition with spatial-temporal interaction networks. In Proceedings of the IEEE/CVF Conference on Computer Vision and Pattern Recognition. 1049–1059.
- Oliver et al. (2014) Dev Oliver, Shashi Shekhar, Xun Zhou, Emre Eftelioglu, Michael R Evans, Qiaodi Zhuang, James M Kang, Renee Laubscher, and Christopher Farah. 2014. Significant route discovery: A summary of results. In International Conference on Geographic Information Science. Springer, 284–300.
- Qi et al. (2017) Charles R Qi, Hao Su, Kaichun Mo, and Leonidas J Guibas. 2017. Pointnet: Deep learning on point sets for 3d classification and segmentation. In Proceedings of the IEEE conference on computer vision and pattern recognition. 652–660.
- Qiu et al. (2021a) Jianing Qiu, Lipeng Chen, Xiao Gu, Frank P-W Lo, Ya-Yen Tsai, Jiankai Sun, Jiaqi Liu, and Benny Lo. 2021a. Egocentric Human Trajectory Forecasting with a Wearable Camera and Multi-Modal Fusion. arXiv:2111.00993 (2021).
- Qiu et al. (2021b) Jianing Qiu, Frank P-W Lo, Xiao Gu, Yingnan Sun, Shuo Jiang, and Benny Lo. 2021b. Indoor Future Person Localization from an Egocentric Wearable Camera. arXiv preprint arXiv:2103.04019 (2021).
- Ramanishka et al. (2018) Vasili Ramanishka, Yi-Ting Chen, Teruhisa Misu, and Kate Saenko. 2018. Toward driving scene understanding: A dataset for learning driver behavior and causal reasoning. In IEEE Conference on Computer Vision and Pattern Recognition. 7699–7707.
- Sadeghian et al. (2019) Amir Sadeghian, Vineet Kosaraju, Ali Sadeghian, Noriaki Hirose, Hamid Rezatofighi, and Silvio Savarese. 2019. Sophie: An attentive gan for predicting paths compliant to social and physical constraints. In Proceedings of the IEEE/CVF Conference on Computer Vision and Pattern Recognition. 1349–1358.
- Shafiee et al. (2021) Nasim Shafiee, Taskin Padir, and Ehsan Elhamifar. 2021. Introvert: Human Trajectory Prediction via Conditional 3D Attention. In IEEE/CVF Conference on Computer Vision and Pattern Recognition. 16815–16825.
- Shinar et al. (1998) David Shinar, Meir Meir, and Israel Ben-Shoham. 1998. How automatic is manual gear shifting? Human Factors 40, 4 (1998), 647–654.
- Simon et al. (2011) Michael Simon, Eike A Schmidt, Wilhelm E Kincses, Martin Fritzsche, Andreas Bruns, Claus Aufmuth, Martin Bogdan, Wolfgang Rosenstiel, and Michael Schrauf. 2011. EEG alpha spindle measures as indicators of driver fatigue under real traffic conditions. Clinical Neurophysiology 122, 6 (2011), 1168–1178.
- Simonyan and Zisserman (2014) Karen Simonyan and Andrew Zisserman. 2014. Two-stream convolutional networks for action recognition in videos. arXiv preprint arXiv:1406.2199 (2014).
- Soo Park et al. (2016) Hyun Soo Park, Jyh-Jing Hwang, Yedong Niu, and Jianbo Shi. 2016. Egocentric future localization. In Proceedings of the IEEE Conference on Computer Vision and Pattern Recognition. 4697–4705.
- Szegedy et al. (2017) Christian Szegedy, Sergey Ioffe, Vincent Vanhoucke, and Alexander A Alemi. 2017. Inception-v4, inception-resnet and the impact of residual connections on learning. In AAAI Conference on Artificial Intelligence.
- Tran et al. (2021) Vinh Tran, Yang Wang, Zekun Zhang, and Minh Hoai. 2021. Knowledge Distillation for Human Action Anticipation. In IEEE International Conference on Image Processing. IEEE, 2518–2522.
- Volkswagen (2021) Volkswagen. 2021. Driver Alert System. In https://www.volkswagen.co.uk/en/technology/car-safety/driver-alert-system.html.
- Wang et al. (2016) Limin Wang, Yuanjun Xiong, Zhe Wang, Yu Qiao, Dahua Lin, Xiaoou Tang, and Luc Van Gool. 2016. TemporalSegmentNetworks:Towards good practices for deep action recognition. In European Conference on Computer Vision. Springer, 20–36.
- Wang and Gupta (2018) Xiaolong Wang and Abhinav Gupta. 2018. Videos as space-time region graphs. In Proceedings of the European conference on computer vision. 399–417.
- Wu et al. (2019) Jianchao Wu, Limin Wang, Li Wang, Jie Guo, and Gangshan Wu. 2019. Learning actor relation graphs for group activity recognition. In Proceedings of the IEEE/CVF Conference on Computer Vision and Pattern Recognition. 9964–9974.
- Xu et al. (2019) Mingze Xu, Mingfei Gao, Yi-Ting Chen, Larry S Davis, and David J Crandall. 2019. Temporal recurrent networks for online action detection. In Proceedings of the IEEE/CVF International Conference on Computer Vision. 5532–5541.
- Xu et al. (2020) Mengmeng Xu, Chen Zhao, David S Rojas, Ali Thabet, and Bernard Ghanem. 2020. G-tad: Sub-graph localization for temporal action detection. In Proceedings of the IEEE/CVF Conference on Computer Vision and Pattern Recognition. 10156–10165.
- Xu et al. (2018) Yanyu Xu, Zhixin Piao, and Shenghua Gao. 2018. Encoding crowd interaction with deep neural network for pedestrian trajectory prediction. In Proceedings of the IEEE Conference on Computer Vision and Pattern Recognition. 5275–5284.
- Yagi et al. (2018) Takuma Yagi, Karttikeya Mangalam, Ryo Yonetani, and Yoichi Sato. 2018. Future person localization in first-person videos. In Proceedings of the IEEE Conference on Computer Vision and Pattern Recognition. 7593–7602.
- Yao et al. (2019) Yu Yao, Mingze Xu, Chiho Choi, David J Crandall, Ella M Atkins, and Behzad Dariush. 2019. Egocentric vision-based future vehicle localization for intelligent driving assistance systems. In IEEE Conference on Robotics and Automation. 9711–9717.
- You et al. (2013) Chuang-Wen You, Nicholas D Lane, Fanglin Chen, Rui Wang, Zhenyu Chen, Thomas J Bao, Martha Montes-de Oca, Yuting Cheng, Mu Lin, Lorenzo Torresani, et al. 2013. Carsafe app: Alerting drowsy and distracted drivers using dual cameras on smartphones. In Proceeding of the 11th annual international conference on Mobile systems, applications, and services. 13–26.
- Yuan et al. (2017) Yuan Yuan, Xiaodan Liang, Xiaolong Wang, Dit-Yan Yeung, and Abhinav Gupta. 2017. Temporal dynamic graph lstm for action-driven video object detection. In Proceedings of the IEEE International Conference on Computer Vision. 1801–1810.
- Yuan et al. (2018) Zhuoning Yuan, Xun Zhou, and Tianbao Yang. 2018. Hetero-convlstm: A deep learning approach to traffic accident prediction on heterogeneous spatio-temporal data. In Proceedings of the 24th ACM SIGKDD International Conference on Knowledge Discovery and Data Mining. 984–992.
- Zaech et al. (2020) Jan-Nico Zaech, Dengxin Dai, Alexander Liniger, and Luc Van Gool. 2020. Action sequence predictions of vehicles in urban environments using map and social context. In IEEE/RSJ International Conference on Intelligent Robots and Systems. IEEE, 8982–8989.