The Uchuu-UniverseMachine dataset: Galaxies in and around Clusters
Abstract
We present the public data release of the Uchuu-UM galaxy catalogues by applying the UniverseMachine algorithm to assign galaxies to the dark matter halos in the Uchuu -body cosmological simulation. It includes a variety of baryonic properties for all galaxies down to with halos in a mass range of up to redshift . Uchuu-UM includes more than cluster-size halos in a volume of , reproducing observed stellar mass functions across the redshift range of , galaxy quenched fractions, and clustering statistics at low redshifts. Compared to the previous largest UM catalogue, the Uchuu-UM catalogue includes significantly more massive galaxies hosted by large-mass dark matter halos. Overall, the number density profile of galaxies in dark matter halos follows the dark matter profile, with the profile becoming steeper around the splashback radius and flattening at larger radii. The number density profile of galaxies tends to be steeper for larger stellar masses and depends on the color of galaxies, with red galaxies having steeper slopes at all radii than blue galaxies. The quenched fraction exhibits a strong dependence on the stellar mass and increases toward the inner regions of clusters. The publicly available Uchuu-UM galaxy catalogue presented here can serve to model ongoing and upcoming large galaxy surveys.
keywords:
methods: numerical, galaxies: clusters: general, dark matter, large-scale structure of Universe, cosmology: theory1 Introduction
In the era of large galaxy surveys, one of the key challenges lies in creating an observable universe or mock galaxy catalogue with a very large number of galaxies to constrain statistical uncertainties, with correct properties of galaxies from sophisticated non-linear astrophysics. Empirical models that employ a galaxy-halo connection to add galaxies into halos and subhalos of N-body simulations provide a unique opportunity for generating a mock catalogue large enough to produce meaningful statistics, while reproducing observed galaxy properties.
The combination of extensive -body simulations such as MultiDark Planck (MDPL2, Klypin et al., 2016) and the UniverseMachine galaxy model (Behroozi et al., 2019) has emerged as a powerful theoretical tool for modeling large galaxy surveys. UniverseMachine provides a computationally efficient approach to generate significant statistics of galaxies by pasting galaxies onto the halos and subhalos in the dark matter only -body simulations. UniverseMachine models galaxy formation and evolution by relating the dark matter halo’s maximum circular velocity and accretion history to the star formation rate of the galaxy. It can model the halo-galaxy connection over a broad range of cosmic time and environments and reproduces a plethora of observational datasets on galaxy formation and evolution (Behroozi et al., 2019; Behroozi et al., 2020). For example, to date, the MDPL2-UM galaxy catalogue has been used to investigate stellar mass-halo mass relations (Bradshaw et al., 2020), galaxy formation physics (Chaves-Montero & Hearin, 2021), the phase space structure of dark matter halos (Aung et al., 2022), and dynamical mass measurements of galaxy clusters (Ho et al., 2019) among others.
The Uchuu -body simulation (Ishiyama et al., 2021) provides a substantial statistical sample of dark matter halos with 8 times larger volume and 5 times better mass resolution than the previous largest simulation combined with UniverseMachine (MDPL2). The Uchuu simulation allows us to capture and resolve the structure and concentration of dark matter halos across cosmic time () (Ishiyama et al., 2021), as well as the subhalo properties to as close as 0.1 percent of the host virial radius (Moliné et al., 2023). Thus, the Uchuu simulation, combined with the UniverseMachine algorithm, provides the required statistics and resolution for the next-generation galaxy surveys.
In this work, we present and analyze an Uchuu-UM galaxy catalogue in , encompassing over cluster-size halos of mass while resolving galaxies down to . We show that the catalogue reproduces the observed galaxy clustering and quenched fractions. We show how the number density profiles and quenched fractions of galaxies in the cluster and group-size dark matter halos depend on the galaxy properties, such as stellar mass and colors.
2 Uchuu-UM Galaxy catalogue Data
2.1 Simulation
Uchuu simulation has a comoving box-size of with a total of 2.1 trillion particles. The simulation was run using the massively parallel TreePM code GreeM (Ishiyama et al., 2009; Ishiyama et al., 2012) for the Planck (2018) cosmology: , , , , , and (Planck Collaboration et al., 2020), resulting in a dark matter particle mass resolution of and a gravitational softening length of . The halo catalogue is generated using the Rockstar code (Behroozi et al., 2013a), and the merger tree is generated by the ConsistentTrees algorithm (Behroozi et al., 2013b). Full simulation details can be found in Ishiyama et al. (2021).
2.2 UniverseMachine
The mock galaxy catalogue is constructed using the UniverseMachine (Behroozi et al., 2019), in which the galaxy–halo relationship is forward modelled to match observational data across cosmic times. The in-situ star formation rate is parameterized as a function of halo mass, halo assembly history, and redshift. We use this relation to assign the star formation rate for each halo and subhalo in the Uchuu simulation. The stellar mass of the galaxy hosted by the halo is then computed by integrating the star formation rates over the merger history of the halo, accounting for mass lost during stellar evolution. The parameters of the algorithm were explored by a Markov Chain Monte Carlo (MCMC) algorithm, and a fitting algorithm optimized the best-fitting parameters so that the resulting mock catalogue from the UniverseMachine Data Release 1 reproduces the following observational data across a broad range of redshifts (): (i) stellar mass functions; (ii) cosmic star-formation rates and specific star-formation rates; (iii) UV luminosity functions; (iv) quenched fractions; (v) correlation functions for all, quenched, and star-forming galaxies; (v) measurements of the environmental dependence of central galaxy quenching; and (vi) UV-stellar mass relations. These comparisons are based on the data obtained from the Sloan Digital Sky Survey, the PRIsm MUlti-object Survey, and the CANDELS survey, among others (for more details, see the Appendix in Behroozi et al., 2019).
To compensate for artificially disrupted subhalos in the simulations, UniverseMachine adds “orphan” galaxies, which do not correspond to any subhalos or halos in the halo catalog of the corresponding snapshot, but are descendants of the subhalos in previous snapshots. Orphans are added by leapfrog integration of the positions and velocities of disrupted subhalos, with a modified mass and loss prescription based on Jiang & van den Bosch (2016). We retain orphans until of the subhalo drops below a mass-dependent threshold, which is fitted with two free parameters.
| parameter | units | data type | description |
|---|---|---|---|
| id | n/a | int64 | ID of the galaxy. Share the ID with dark matter halo (appeared in Rockstar catalogs and merger trees) in which galaxy resides, if it is not an orphan. For orphans, the id is the last ID in the halo catalog + (number of snapshots as an orphan) |
| upid | n/a | int64 | ID of the largest dark matter halo in which galaxy resides ( for central halos) |
| Mvir | float32 | virial mass (Bryan & Norman, 1998) of the dark matter halo | |
| sm | float32 | true stellar mass of the galaxy | |
| icl | float32 | true intracluster stellar mass inside the dark matter halo | |
| sfr | float32 | true star formation rate of the galaxy | |
| obs_sm | float32 | observed stellar mass of the galaxy including random and systematic errors | |
| obs_sfr | float32 | observed star formation rate of the galaxy including random and systematic errors | |
| obs_um | M1500,AB | float32 | observed UV Magnitude |
| x, y, z | comoving | float32 | comoving x,y,z position of the galaxy |
| desc_id | n/a | int64 | ID of descendant halo (or -1 at ) |
| vx, vy, vz | peculiar | float32 | peculiar velocity of the galaxy |
| Mpeak | float32 | halo peak historical mass (virial mass) | |
| Vmax_Mpeak | float32 | maximum circular velocity when peak mass was achieved | |
| vmax | float32 | maximum circular velocity of the dark matter halo | |
| A_UV | mag | float32 | UV attenuation |
| SFH | float32 | star formation rate history for the present-day stellar population in the galaxy (including all merged progenitors) | |
| ICLH | float32 | star formation rate history for the present-day population in the intrahalo light | |
| SM_main_progenitor | float32 | the main progenitor galaxy’s stellar mass history | |
| ICL_main_progenitor | float32 | the main progenitor’s intrahalo light history | |
| M_main_progenitor | float32 | the main progenitor’s halo mass history | |
| SFR_main_progenitor | float32 | the main progenitor’s star formation rate history (excluding any mergers) | |
| V@Mpeak | float32 | the main progenitor’s Vmax_Mpeak history | |
| A_first_infall | n/a | float32 | Scale factor at which the galaxy first passed through a larger halo |
| A_last_infall | n/a | float32 | Scale factor at which the galaxy last passed through a larger halo |
Table 1 describes the data presented in the Uchuu-UM catalog, generated from 50 snapshots of the halo catalogs spanning to . We report the halo mass and radius of the spherical overdensity halo mass definition provided by the Rockstar algorithm.111We note that the outer profiles of the halos are self-similar when the radius is normalized using , i.e., the profiles are independent of mass and redshift(Diemer & Kravtsov, 2014; More et al., 2015), while the inner profiles are self-similar when normalized using (Lau et al., 2015). For the subhalo masses, we use because the UniverseMachine algorithm provides only the virial masses of the orphan galaxies. For galaxy stellar masses, we use the true stellar mass provided by UniverseMachine in units of .
2.3 Comparison with observations
Here, we show how well the Uchuu-UM catalogue reproduces the observed data of galaxy clustering and quenched fractions that are used to constrain the parameters of the UniverseMachine algorithm. We define galaxies that have specific star formation rates of as galaxies that are star-forming (blue), and those with as quenched galaxies (red).
Figure 1 shows the projected correlation function of red, blue, and all galaxies as a function of projected radius for different stellar mass bins. The correlation function measured in the simulation agrees well with the observed data compiled in Behroozi et al. (2019). The correlation function increases for larger stellar mass as the brighter, more massive galaxies reside in larger mass halos which cluster more strongly(Scranton et al., 2002; Connolly et al., 2002). Red, quenched galaxies also exhibit a stronger correlation than blue, star-forming galaxies because the quenching of satellite galaxies, which produces red galaxies, happens preferentially in clusters and groups, which are more clustered (e.g., Hearin & Watson, 2013; Hearin et al., 2014; Watson et al., 2015).
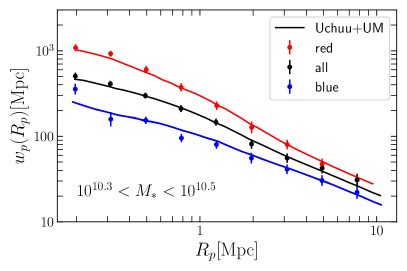
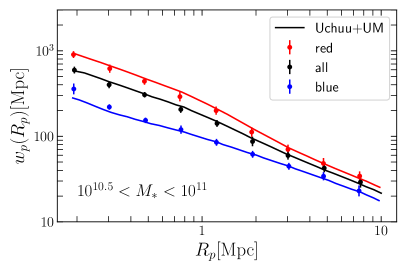
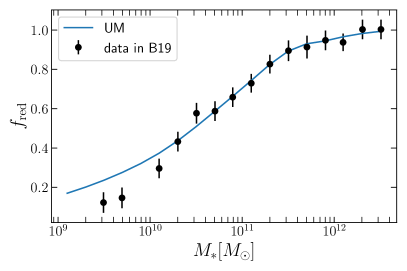
Figure 2 shows that the global quenched fraction as a function of the galaxy’s stellar mass agrees with the observed quenched fraction compiled in Behroozi et al. (2019). We define the quenched fraction as the ratio of red galaxies to the total number of galaxies. This figure demonstrates that galaxies of smaller mass are more star-forming, while those with large mass are more quenched. Even though our simulation does not include baryonic physics, the dependence of the quenched fraction on stellar mass is reproduced well.
3 Statistics and properties of galaxies in the Uchuu-UM catalogue
In this section, we study the statistics and properties of galaxies in the Uchuu-UM catalogue, focusing on the stellar mass function, radial distribution of galaxies, and quenched fraction. Because of the unprecedented volume and high resolution of the Uchuu simulation, the UniverseMachine mock catalogue allows us to probe galaxies with stellar masses as large as while including galaxies down to . This also allows us to measure the radial distributions of galaxies as a function of halo radius for galaxy clusters and groups for dynamic mass ranges of satellite galaxies, where the addition of orphan galaxies mitigates artificial disruption of subhalos.
3.1 Stellar Mass Functions
The stellar mass function (SMF) of the Uchuu-UM sample is similar to the SMF based on the Bolshoi-Planck simulation.222Note that the cosmological parameters of these simulations were not identical to those of Uchuu. The main difference lies in the size of the simulation volume, where the Uchuu simulation has a volume 512 larger than that of the Bolshoi-Planck simulation. The stellar mass function is complete above at , as the stellar mass function starts to flatten below this mass. This lower bound stellar mass for the completeness limit is smaller at higher redshifts.
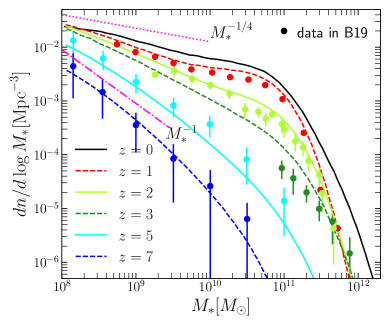
Figure 3 shows the evolution of the stellar mass function. At small masses (), the SMF becomes steeper at higher redshifts and gradually becomes shallower at low-. To a large degree, this is driven by the fast growth of stellar mass in Milky-Way-type galaxies with halo masses and stellar masses .
The SMF’s shape and evolution at is qualitatively similar to the evolution of the halo mass function. At small masses, the slope of the stellar mass function is steeper with redshift, the same as for the halo mass function, and approaches (dot-dashed line in the plot). At larger masses, the SMF declines, but the decline is gradual – compare and curves – similar to the halo mass function. The ’knee’ – a point of transition from the small-scale power-law trend to a steeper decline – increases in mass as the Universe expands.
The evolution of the SMF starts to change at . Because of the high efficiency of star formation in galaxies, the slope of SMF at larger masses dramatically steepens over time. Evolution from to of the high-mass tail of SMF is not related to star formation: galaxies with these masses are quenched and do not form new stars. However, just as observed galaxies (e.g., van Dokkum et al., 2010; van der Wel et al., 2014), they grow substantially by minor mergers and tidally stripping galaxies that move close to them (e.g., Naab et al., 2009; Damjanov et al., 2022).
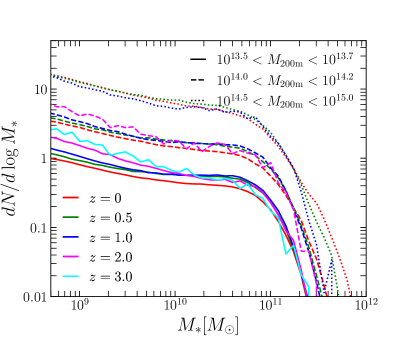
Figure 4 shows results on the satellite stellar mass function: the number of satellites in halos with different dark matter masses. As expected, the number of satellites of nearly all masses roughly increases linearly with the halo mass, and the increase in the satellite abundance does not depend on the satellite mass . The satellite abundance also increases as the redshift of the halo increases. Dark matter halos of the same mass at earlier redshift have higher rates of satellite accretion and hence, larger numbers of satellites (van den Bosch et al., 2005). However, the trend with redshift disappears for the largest mass cluster bin, where the clusters are actively accreting even at redshift . However, note that the lack of redshift evolution in the satellite stellar mass function at the highest mass bin does not imply the lack of evolution for individual halos, as the halos are growing in mass over time.
-body simulations tend to suffer from numerical effects, especially on small scales, due to limited particle count and force resolution. Specifically, the properties of halos and subhalos (including with smaller masses) may not be estimated correctly (Mansfield & Avestruz, 2021). As our galaxy catalogue places galaxies directly onto subhalos identified from Rockstar in the simulation and orphans extrapolated by our algorithm, the validity of the galaxy properties depends on the values in the simulation. The ratio of maximum circular velocity to the circular velocity at () in our simulation decreases with increasing mass above a certain halo mass limit . Below this limit, the ratio increases with increasing mass, indicating a resolution limit (see Mansfield & Avestruz, 2021). Notably, this corresponds to a stellar mass of in the stellar mass-halo mass relations. Thus, we caution the readers to treat galaxy properties below this mass threshold with care.
3.2 Number-density profiles
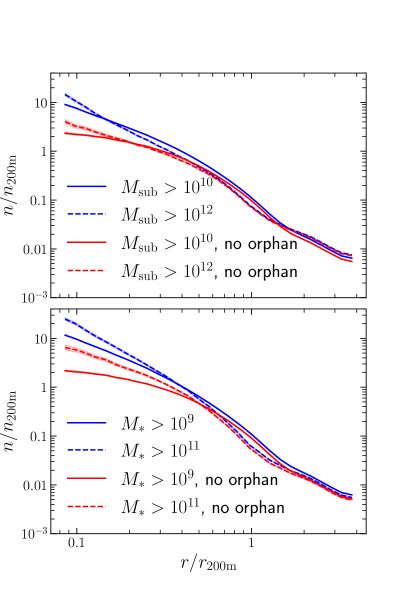
Figure 5 shows the average number-density profile of galaxies as a function of normalized radius, for halos with masses . Galaxies were selected either by the dark matter mass (top panel) or stellar mass (bottom panel). The shaded areas in the plot indicate the errors of the mean. Inclusion of orphan galaxies changes the inner region of the profile: the slope of the profile increases when orphan galaxies are included. This happens regardless of galaxy selection, either by stellar or subhalo mass. Note also that the profile gets steeper for more massive galaxies.
The situation is different in the outer regions of the halos. Here the number-density profiles do not depend on how galaxies are selected. Suppose we ignore orphan galaxies added by the UniverseMachine algorithm. In that case, the profile starts to flatten in the inner region instead of maintaining the cuspy shape that dark matter density profiles exhibit. Orphans are added instead of subhalos which cannot be tracked by the halo finder anymore as they are artificially disrupted.
However, the decrease in slope/plateauing in the inner regions of the clusters with or without orphan galaxies is much smaller than previously reported by Nagai & Kravtsov (2005). The difference likely stems from the halo finder Bound Density Maxima, BDM employed by Nagai & Kravtsov (2005). BDM does not give an accurate estimate of subhalo mass and tends to miss subhalos in the inner region of the clusters and groups (Knebe et al., 2011). The number-density profiles in the inner part of the clusters without orphan galaxies likely depend on the halo finder employed, as we find that the slope of the number-density profile increases with increasing subhalo or stellar mass.
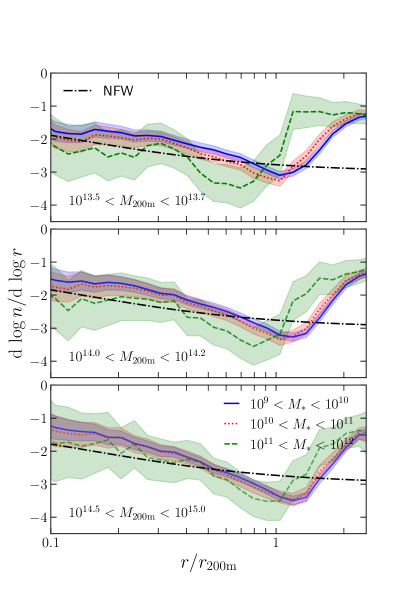
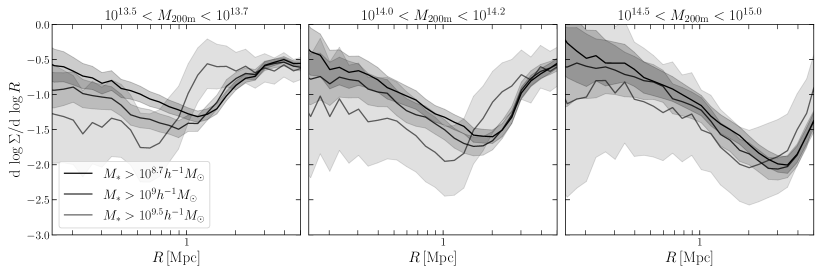
Figure 6 shows the logarithmic slopes of the average number-density profiles of galaxies in halos with different masses. Here we select galaxies by their stellar mass as indicated in the plot. The shaded regions present the errors on the slope propagated from the errors on the mean of the profiles. Overall, the profiles tend to follow the NFW profile of the dark matter (Navarro et al., 1996), using the mass–concentration relation from Ishiyama et al. (2021).
However, there are important differences. The steepening feature at and the bump at is the result of a pile-up of backsplash galaxies which are at their second turnaround after infalling into the central halo for the first time.
The profiles do not show a significant dependence on the central halo mass once the radius is normalized by . However, the slope increases with the increasing stellar mass of galaxies. In addition, the radius, where the density slope steepens, is smaller for galaxies with larger stellar mass. This is likely due to the dynamical friction, which is stronger for higher mass galaxies, reducing their kinetic energy and, thus, the second turnaround radius (Adhikari et al., 2014).
3.3 Galaxy Quenching

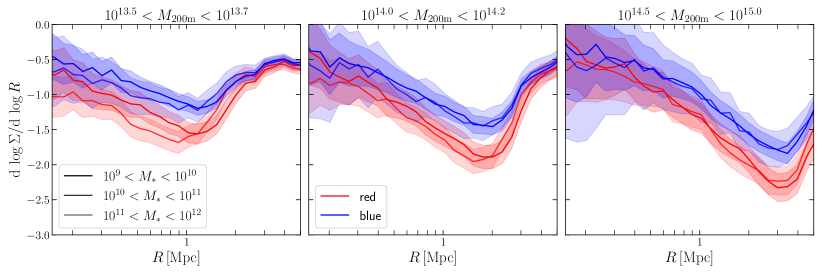
Figure 7 shows that the slope of the number-density profile of galaxies depends on the galaxy color. The slope of red galaxies is steeper than for blue galaxies at all radii, including the steepening feature around the splashback radius. Red galaxies, on average, have spent a long time in the dark matter halo, experiencing tidal stripping and dynamical friction for a more extended period. Hence, the difference in the slope between high and low stellar mass galaxies also appears for red and blue galaxies. Note, however, that the radius at which the steepest density slope occurs is similar for galaxies of different star formation rates at the same stellar mass.
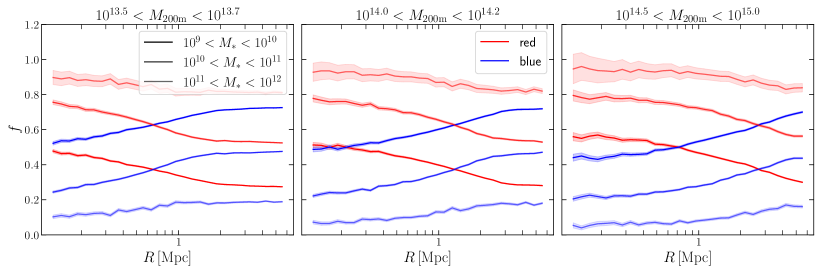
Figure 8 shows the fraction of quenched galaxies as a function of halo radius around galaxy clusters and groups. The fraction of red galaxies decreases monotonically from the inner region to the outskirt. It asymptotically approaches the global quenched fraction at the large cluster-centric radius. In the cluster outskirts, the main culprit of quenching in field galaxies is baryonic feedback, whose effect is more pronounced in higher mass halos, explaining why there are more red galaxies among galaxies with larger stellar masses. The quenched fraction beyond approaches the global quenched fraction, indicating the limits of the impact of the clusters and groups. Galaxies in a high-density environment (such as galaxy clusters) tend to quench due to strangulation by ram pressure and tidal stripping and starvation due to lack of cold gas inflow or feedback effects (Cortese et al., 2021). This creates an increasing gradient in the fraction of red galaxies from the outer to the inner region of the dark matter halo. The fraction deviates from the global fraction starting around and increases as the separation becomes smaller. This behavior has been reported in the observed color gradients of the galaxy clusters (e.g., Wetzel et al., 2014; Adhikari et al., 2021). The excess fraction of red galaxies outside and splashback radius is due to backsplash galaxies: galaxies that have had pericentric passage inside the cluster and experience quenching can backsplash and reach beyond virial radius, extending out to (Balogh et al., 2000; Mamon et al., 2004; Ludlow et al., 2009; Wang et al., 2009; Aung et al., 2021).
The global quenched fraction at large radii and the quenched fraction in the cluster is a strong function of stellar mass. At large radii, only of the galaxies with are quenched, while of the galaxies with are quenched. The quenched fraction for galaxies increases from to by 0.2-0.3 for all stellar mass bins, and at , of galaxies with are quenched, while only of the galaxies with are quenched. The quenched fraction has a very mild dependence on the halo mass. This behavior is qualitatively similar to the observational measurements in Wetzel et al. (2012), where the overall quenched fraction in the cluster is a strong function of stellar mass. The excess quenching in the cluster environment (i.e., the difference between the quenched fraction in the cluster relative to the field) is independent of the stellar mass of galaxies. We also found that the larger the halo mass, the larger the quenched fraction is for the same stellar mass galaxies, indicating stronger environmental effects. However, the fraction of quenched galaxies changes by less than 0.05 in the halo mass range probed.
Note that our mock catalogue reproduces the expected features of galaxy quenching despite the lack of explicit models of environmental effects. UniverseMachine does not consider whether a galaxy is near or inside clusters and groups but only considers the changes in the halo’s . If of the halo stops growing, i.e., the halo stops accreting mass, the galaxy will have a lower star formation rate. The fact that the catalogue produces the observed environmental effect indicates that the halo’s most influencing factor in determining the star formation rates of the galaxies is the mass accretion rate.
3.4 Projected Galaxy Profiles around Galaxy Clusters and Groups
Finally, building on the physical intuition based on the three-dimensional profiles, we investigate two-dimensional projected profiles of galaxy properties to connect with observations. We generate a mock catalogue by projecting the simulation box along the axis. We select galaxies with the line-of-sight velocity with respect to the clusters within .
Figure 10 shows the logarithmic slope of the projected number density profile of galaxies similar to Figure 5 but as a function of projected radius. The profiles show similar qualitative features as 3D profiles, where the slope of the density profile decreases and steepens. In contrast, the splashback radius decreases as the stellar mass of the galaxies increases. The slope is offset by about from 3D profiles at most radii due to the integral along line-of-sight.
Figure 9 shows the logarithmic slope of the projected number density profile but for different galaxy colors, separately for red and blue galaxies. Similar to Figure 7, red galaxies exhibit an overall steeper slope but are offset by about . Adhikari et al. (2021) reports that in observed galaxies in 2D, the number density profile of red galaxies is steeper than that of blue galaxies similar to our findings in 3D. The splashback radius of red galaxies is also smaller than that of blue galaxies, which is not found in our studies. This is likely caused by different mass selections in red vs. blue galaxies.
Figure 11 shows the quenched fraction as a function of the projected radius. Similar to the number density profile, the 2D profiles show a qualitative feature similar to 3D profiles where the quenched fraction decreases as a function of the projected radius and asymptotes to the global fraction at a large radius.
4 Conclusions
In this work, we presented the Uchuu-UM mock galaxy catalogue for a large volume with a box size of on the side and mass range , including over cluster-size halos with galaxies down to . Key features of the Uchuu-UM mock galaxy catalogue are summarized below:
- •
-
•
The stellar mass function (Figure 3) agrees with the previous UniverseMachine datasets. Both the stellar mass function and satellite stellar mass function for satellite galaxies at given dark matter halo mass show completeness above (Figure 4). Compared to the MDPL2 simulation, the Uchuu-UM catalogue includes significantly more massive galaxies hosted by large-mass dark matter halos.
-
•
Overall, the number-density profile of galaxies follows the NFW profile of dark matter halos. The profile becomes steeper around , where the slope is . At larger radii, the profile flattens again in the region of the splashback radius . The density profile tends to be steeper for larger stellar masses.
- •
-
•
The number-density profile of galaxies depends on the color of galaxies, with red galaxies having steeper slopes at all radii when compared to blue galaxies. The red galaxies tend to steepen more at the splashback radius, while the steepening feature is weaker in blue galaxies (Figure 7).
-
•
The fraction of quenched galaxies in and around cluster-size halos shows a remarkably complex behaviour. As expected, there are more quenched galaxies in the inner regions of the halos. However, at a fixed stellar mass the dependence on cluster mass is remarkably weak: at and for the quenched fraction is for . It is nearly the same for .
-
•
We find by far the strongest trend of the quenched fraction on the stellar mass. In central cluster regions of massive galaxies are quenched while only are quenched for . The quenched fraction then asymptotically approaches the global quenched fraction at large radii. The fraction increases toward the inner regions of the cluster-centric radius, indicating quenching in cluster environments (Figure 8).
- •
The Uchuu-UM galaxy catalogue presented here represents a step forward in modeling ongoing and upcoming large galaxy surveys. Recent advances in hydrodynamic cosmological simulations provide an alternative approach for modeling galaxy formation and evolution (e.g., Hirschmann et al., 2014; Schaye et al., 2015; McCarthy et al., 2017; Pillepich et al., 2018; Cui et al., 2018). In the future, we plan to compare the predictions of the Uchuu-UM galaxy catalogue to a plethora of observables (such as the radial distribution of cluster galaxies, splashback radius, and galaxy quenching) in hydrodynamic cosmological simulations and observations.
Acknowledgements
We thank the Instituto de Astrofísica de Andalucía (IAA-CSIC), Centro de Supercomputaciń de Galicia (CESGA), and the Spanish academic and research network (RedIRIS) in Spain for hosting Uchuu DR1 in the Skies & Universes site (http://www.skiesanduniverses.org/) for cosmological simulations. We are grateful to Antonio Fuentes, and his team at RedIRIS, for providing the skun@IAA_RedIRIS server that hosts Uchuu DR1 and DR2 through Skies & Universes with a fast download speed through their RedIRIS High Speed Data Transfer Service; to the staff at CESGA for developing the Uchuu-BigData platform and providing the computer resources; and the staff at the IAA-CSIC computer department for proving support and managing the skun@IAA_RedIRIS server.
The Uchuu simulations were carried out on Aterui II supercomputer at the Center for Computational Astrophysics, CfCA, of the National Astronomical Observatory of Japan, and the K computer at the RIKEN Advanced Institute for Computational Science (Proposal numbers hp180180, hp190161). The Uchuu-UM galaxy catalogue data release has used the skun6@IAA facility managed by the IAA-CSIC in Spain; this equipment was funded by the Spanish MICINN EU-FEDER infrastructure grant EQC2018-004366-P. The MICINN grant AYA2014-60641-C2-1-P funded the skun@IAA_RedIRIS server.
DN and HA acknowledge support from Yale University and the Yale Center for Research Computing facilities and staff. HA also acknowledges support from the Zuckerman Postdoctoral Scholars Program while completing this work. T.I. has been supported by IAAR Research Support Program at Chiba University Japan, MEXT/JSPS KAKENHI (Grant Number JP19KK0344, JP21F51024, and JP21H01122), MEXT as “Program for Promoting Researches on the Supercomputer Fugaku” (JPMXP1020200109), and JICFuS. FP, AK, EP, JR thank the support of the Spanish Ministry of Science and Innovation funding grant PGC2018-101931-B-I00.
Data Availability
The Uchuu-UM galaxy data is publicly available on http://www.skiesanduniverses.org/ along with the Uchuu simulation data release. Non-public data are available upon request. Under the UchuuProject on Github 333https://github.com/uchuuproject, we provide a collection of general tools for the community, codes / scripts / tutorials and Jupyter notebooks for analysing the Uchuu data.
References
- Adhikari et al. (2014) Adhikari S., Dalal N., Chamberlain R. T., 2014, J. Cosmology Astropart. Phys., 11, 19
- Adhikari et al. (2021) Adhikari S., et al., 2021, ApJ, 923, 37
- Aung et al. (2021) Aung H., Nagai D., Rozo E., García R., 2021, MNRAS, 502, 1041
- Aung et al. (2022) Aung H., Nagai D., Rozo E., Wolfe B., Adhikari S., 2022, arXiv e-prints, p. arXiv:2204.13131
- Balogh et al. (2000) Balogh M. L., Navarro J. F., Morris S. L., 2000, ApJ, 540, 113
- Behroozi et al. (2013a) Behroozi P. S., Wechsler R. H., Wu H.-Y., 2013a, ApJ, 762, 109
- Behroozi et al. (2013b) Behroozi P. S., Wechsler R. H., Wu H.-Y., Busha M. T., Klypin A. A., Primack J. R., 2013b, ApJ, 763, 18
- Behroozi et al. (2019) Behroozi P., Wechsler R. H., Hearin A. P., Conroy C., 2019, MNRAS, 488, 3143
- Behroozi et al. (2020) Behroozi P., et al., 2020, MNRAS, 499, 5702
- Bradshaw et al. (2020) Bradshaw C., Leauthaud A., Hearin A., Huang S., Behroozi P., 2020, MNRAS, 493, 337
- Bryan & Norman (1998) Bryan G. L., Norman M. L., 1998, ApJ, 495, 80
- Chaves-Montero & Hearin (2021) Chaves-Montero J., Hearin A., 2021, MNRAS, 506, 2373
- Collette (2013) Collette A., 2013, Python and HDF5. O’Reilly
- Connolly et al. (2002) Connolly A. J., et al., 2002, ApJ, 579, 42
- Cortese et al. (2021) Cortese L., Catinella B., Smith R., 2021, Publ. Astron. Soc. Australia, 38, e035
- Cui et al. (2018) Cui W., et al., 2018, MNRAS, 480, 2898
- Damjanov et al. (2022) Damjanov I., Sohn J., Utsumi Y., Geller M. J., Dell’Antonio I., 2022, ApJ, 929, 61
- Diemer (2018) Diemer B., 2018, ApJS, 239, 35
- Diemer & Kravtsov (2014) Diemer B., Kravtsov A. V., 2014, ApJ, 789, 1
- Harris et al. (2020) Harris C. R., et al., 2020, Nature, 585, 357
- Hearin & Watson (2013) Hearin A. P., Watson D. F., 2013, MNRAS, 435, 1313
- Hearin et al. (2014) Hearin A. P., Watson D. F., Becker M. R., Reyes R., Berlind A. A., Zentner A. R., 2014, MNRAS, 444, 729
- Hearin et al. (2017) Hearin A. P., et al., 2017, AJ, 154, 190
- Hirschmann et al. (2014) Hirschmann M., Dolag K., Saro A., Bachmann L., Borgani S., Burkert A., 2014, MNRAS, 442, 2304
- Ho et al. (2019) Ho M., Rau M. M., Ntampaka M., Farahi A., Trac H., Póczos B., 2019, ApJ, 887, 25
- Hunter (2007) Hunter J. D., 2007, Computing in Science & Engineering, 9, 90
- Ishiyama et al. (2009) Ishiyama T., Fukushige T., Makino J., 2009, PASJ, 61, 1319
- Ishiyama et al. (2012) Ishiyama T., Nitadori K., Makino J., 2012, in Proceedings of the International Conference on High Performance Computing, Networking, Storage and Analysis. SC ’12. IEEE Computer Society Press, Washington, DC, USA (arXiv:1211.4406)
- Ishiyama et al. (2021) Ishiyama T., et al., 2021, MNRAS, 506, 4210
- Jiang & van den Bosch (2016) Jiang F., van den Bosch F. C., 2016, MNRAS, 458, 2848
- Klypin et al. (2016) Klypin A., Yepes G., Gottlöber S., Prada F., Heß S., 2016, MNRAS, 457, 4340
- Knebe et al. (2011) Knebe A., et al., 2011, MNRAS, 415, 2293
- Lau et al. (2015) Lau E. T., Nagai D., Avestruz C., Nelson K., Vikhlinin A., 2015, ApJ, 806, 68
- Ludlow et al. (2009) Ludlow A. D., Navarro J. F., Springel V., Jenkins A., Frenk C. S., Helmi A., 2009, ApJ, 692, 931
- Mamon et al. (2004) Mamon G. A., Sanchis T., Salvador-Solé E., Solanes J. M., 2004, A&A, 414, 445
- Mansfield & Avestruz (2021) Mansfield P., Avestruz C., 2021, MNRAS, 500, 3309
- McCarthy et al. (2017) McCarthy I. G., Schaye J., Bird S., Le Brun A. M. C., 2017, MNRAS, 465, 2936
- Moliné et al. (2023) Moliné Á., et al., 2023, MNRAS, 518, 157
- More et al. (2015) More S., Diemer B., Kravtsov A. V., 2015, ApJ, 810, 36
- Naab et al. (2009) Naab T., Johansson P. H., Ostriker J. P., 2009, ApJ, 699, L178
- Nagai & Kravtsov (2005) Nagai D., Kravtsov A. V., 2005, ApJ, 618, 557
- Navarro et al. (1996) Navarro J. F., Frenk C. S., White S. D. M., 1996, ApJ, 462, 563
- Pillepich et al. (2018) Pillepich A., et al., 2018, MNRAS, 475, 648
- Planck Collaboration et al. (2020) Planck Collaboration et al., 2020, A&A, 641, A6
- Schaye et al. (2015) Schaye J., et al., 2015, MNRAS, 446, 521
- Scranton et al. (2002) Scranton R., et al., 2002, ApJ, 579, 48
- Virtanen et al. (2020) Virtanen P., et al., 2020, Nature Methods, 17, 261
- Wang et al. (2009) Wang H., Mo H. J., Jing Y. P., 2009, MNRAS, 396, 2249
- Watson et al. (2015) Watson D. F., et al., 2015, MNRAS, 446, 651
- Wetzel et al. (2012) Wetzel A. R., Tinker J. L., Conroy C., 2012, MNRAS, 424, 232
- Wetzel et al. (2014) Wetzel A. R., Tinker J. L., Conroy C., van den Bosch F. C., 2014, MNRAS, 439, 2687
- van Dokkum et al. (2010) van Dokkum P. G., et al., 2010, ApJ, 709, 1018
- van den Bosch et al. (2005) van den Bosch F. C., Tormen G., Giocoli C., 2005, MNRAS, 359, 1029
- van der Wel et al. (2014) van der Wel A., et al., 2014, ApJ, 788, 28