Molecular dynamics simulations with grand-canonical reweighting suggest cooperativity effects in RNA structure probing experiments
Abstract
Chemical probing experiments such as SHAPE are routinely used to probe RNA molecules. In this work, we use atomistic molecular dynamics simulations to test the hypothesis that binding of RNA with SHAPE reagents is affected by cooperative effects leading to an observed reactivity that is dependent on the reagent concentration. We develop a general technique that enables the calculation of the affinity for arbitrary molecules as a function of their concentration in the grand-canonical ensemble. Our simulations of an RNA structural motif suggest that, at the concentration typically used in SHAPE experiments, cooperative binding would lead to a measurable concentration-dependent reactivity. We also provide a qualitative validation of this statement by analyzing a new set of experiments collected at different reagent concentrations.
keywords:
American Chemical Society, LaTeX1 Introduction
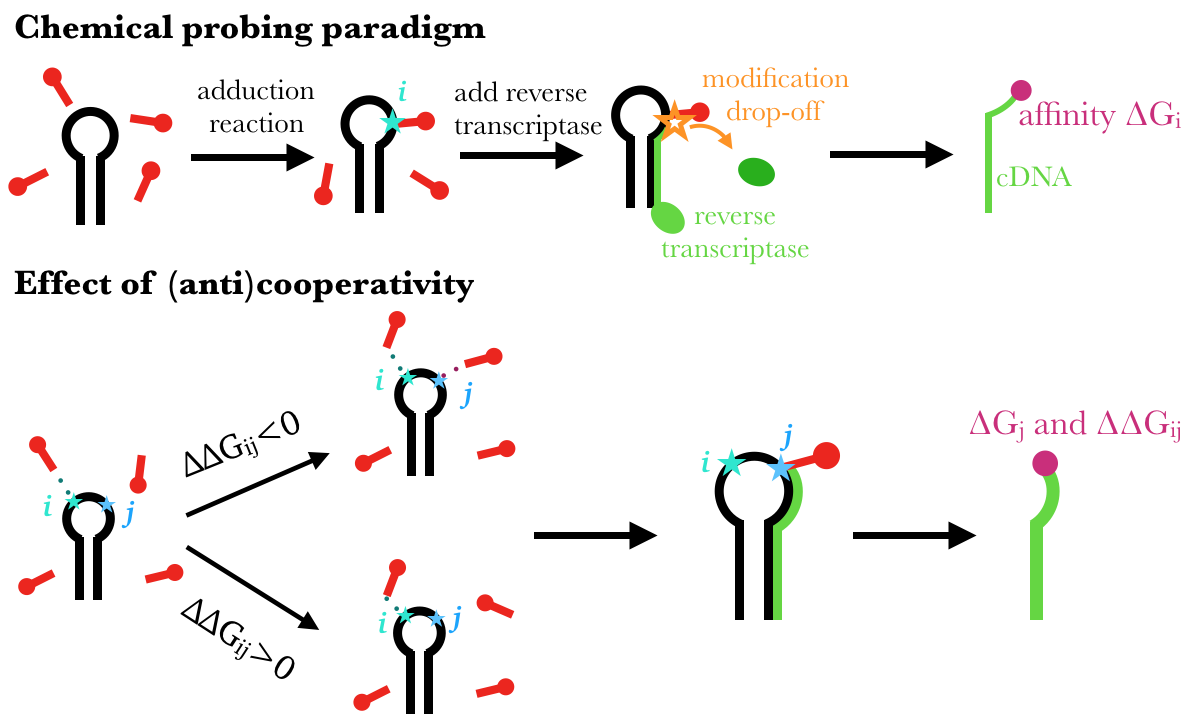
Chemical probing experiments allow measuring RNA structure at nucleotide resolution by adding a chemical reagent to RNA in solution and probing at which positions adducts are formed 1. A prototypical case is the selective 2′-hydroxyl acylation analyzed by primer extension (SHAPE) technique 2, where reagents bind to the hydroxyl group of flexible nucleotides 3. This information can then be used to improve the performance of RNA structure prediction methods (see, e.g., Refs. 4, 5, 6, 7, 8, 9, 10). Chemical probing of small RNA molecules is usually performed in conditions that lead to the single-hit kinetics regime, where a single adduction per RNA molecule is formed on average 11, so that the typical spacing between adducts is on the order of a few tens of nucleotides at least. However, it is important to note that adduction requires a prior reversible physical binding followed by an irreversible chemical reaction. Even when the number of adductions per RNA molecule can be empirically verified, this cannot rule out a larger number of physical binding events in the proximity of the adduction site, potentially altering RNA dynamics and influencing the adduction rate. These physical binding events can be considered as a form of small-molecule crowding 12. Possible cooperative or anti-cooperative effects (see Fig. 1) might lead to unexpected concentration-dependent reactivities.
Atomistic molecular dynamics (MD) simulations give direct access to RNA dynamics 13 and has been used to characterize RNA flexibility and correlate it with SHAPE reactivity 14, 15, 16, 17, 18. In some of these works, MD simulations have been used to explicitly characterize the physical binding of SHAPE reagents to RNA in the infinite dilution limit, where a single reagent molecule is present 16, 18. In principle, MD simulations with multiple copies of the reagent might help identifying (anti)cooperative effects at the typical experimental concentrations. In order to access to concentration-dependent effects, however, one should perform simulations with unrealistically large boxes or, better, at constant chemical potential, where the number of copies of the reagent varies according to its concentration in a virtually infinite reservoir 19. Constant chemical potential simulations are usually performed using Monte Carlo techniques,20 which are inefficient if a bulky reagent (see Fig. 2) is to be inserted in a condensed phase. These difficulties can be alleviated using an oscillating chemical potential 21, that however introduces some additional approximation, or using nonequilibrium candidate Monte Carlo 22. These Monte Carlo methods typically require specifically modified MD codes. Alternatively, a dedicated region of the box can be used as a reservoir and a position-dependent potential can be added modulating the number of copies in the analyzed region using adaptive-resolution 23 or constant constant-chemical-potential 24 MD simulations. The adaptive-resolution method is not available in general purpose MD engines, whereas constant-chemical-potential MD is directly compatible with most simulation software via plugins such as PLUMED 25. However, both these methods require parameters such as the size and shape of the transition and reservoir regions and the form of the bias potential to be chosen in advance.
In this work, we use MD simulations to investigate (anti)cooperative effects in the physical binding of a SHAPE reagent to a typical RNA structural motif. We introduce an approach to grand-canonical averaging that is based on a maximum-likelihood procedure used to analyze a set of simulations performed at a constant number of copies of the reagent molecule. The analysis requires the solution of a self-consistent set of equations similar to those employed in weighted-histogram analysis method 26, 27 or in multistate Bennett acceptance ratio estimations 28. Importantly, the analysis is done as an a posteriori reweighting, so that it allows to choose and optimize the reservoir region after the simulations have been performed, computing weights to be associated to each of the simulated snapshots. In addition, the chemical potential or, equivalently, the concentration of reagent molecules in the buffer, can be chosen a posteriori, thus allowing for the straightforward calculation of concentration-dependent properties from a single set of simulations. The method is then applied to compute the concentration-dependent physical binding affinity of a SHAPE reagent on an RNA tetraloop (see Fig. 2). Interestingly, we predict that nucleotides in the loop undergo cooperative reagent binding at the typical experimental concentrations. Experimental data supporting the existence of cooperative effects in RNA tetraloops are also reported. Our observation opens the way to a new dimension in the interpretation of chemical probing data, where concentration-dependent results might be used to identify specific structural motifs.
2 Methods
2.1 Grand Canonical Reweighting of Molecular Dynamics
In order to describe physical situations where the number of particles is varying, the grand-canonical ensemble is necessary. In this ensemble the fixed quantities are the chemical potential , that controls the fluctuations in the number of particles, the volume of the system and the temperature . The ensemble can be represented as a canonical ensemble coupled to a particle reservoir that can gain or lose particles without appreciably changing . We consider the case where the chemical potential of a single species is controlled, whereas all the other species are simulated at constant number of particles. We then introduce a procedure that can be used to obtain grand-canonical averages from the combination of a set of independent simulations, each with a different fixed number of those particles whose chemical potential is controlled, . The simulation box is divided into two sub-regions and that are assumed to be sufficiently decoupled. In the th simulation, which is run in the canonical ensemble, the probability to observe particles in region is
| (1) |
Here, and are the canonical partition functions associated to regions and , respectively. We then define the count matrix which reports, for the trajectory with copies of the particles, how many frames were seen with exactly particles in region and particles in region . We notice that this is a triangular matrix, since cases where are impossible by construction. The probability to observe such a matrix can be computed as the probability to generate each of the corresponding frames and is equal to:
| (2) |
Here, the normalization coefficients are required to ensure that, at fixed , the sum of the probabilities over is equal to one. The maximum-likelihood (ML) estimation of and is obtained by minimizing the negative log-likelihood . By using the Lagrange multiplier methods to include the normalization constraint mentioned above, one obtains the following Lagrangian function
| (3) |
where are Lagrangian multipliers. The notation can be simplified by defining: , counting the number of times that, in the whole set of trajectories, a particle was found in region ; , counting the equivalent number for region ; and , the total number of frames accumulated in the trajectory with particles. In Section S1 we show that minimizing Eq. 3 as a function and leads to the following coupled equations:
| (4) | ||||
These equations can be solved iteratively through the procedure reported in Algorithm S1. Since we made no assumption on the length of each trajectory , the method can be straightforwardly used also when the minimum number of simulated copies of the controlled particles is greater than 1 or when some simulations are missing, by just setting some of the elements of to zero. Once the ML estimates of have been obtained, they can be directly plugged in the grand-canonical probability of observing molecules in regions , which is defined as
| (5) |
This expression can be then used to compute the grand-canonical average of the number of particles in both regions and , at a fixed value of chemical potential .
| (6) |
Equation 6 provides a connection between the concentration in the experimental buffer and the chemical potential . Specifically, one can use the bisection method reported in Algorithm S2 to obtain corresponding to the desired concentration in region (see Section S2).
Once has been obtained, grand-canonical averages in region can be obtained by weighting frame with a factor
| (7) |
where is the number of copies of the molecule in region in that frame. These weights, and the relationship between the concentration in region and the chemical potential (Eq. 6), can be used to obtain arbitrary grand-canonical ensemble averages as smooth continuous functions of the concentration.
In short, our method is composed of the following steps: (a) a number of simulations are performed with different number of copies of the particles and concatenated; (b) histograms counting how many times particles are present in region and are computed; (c) these histograms are used to compute the canonical partition functions and ; (d) is used to calculate which is the chemical potential corresponding to a given concentration; (e) and are used to compute the weight associated to each of the frames of the initial concatenated trajectory.
2.2 Lattice model
We test the method on a lattice space divided in two regions, and , containing and sites, respectively. Sites are then populated with a number up to of particles that interact only through mutual exclusion: a site cannot be occupied by more than one particle. Two scenarios are tested: a purely entropic lattice, in which the free energy depends only on the number of possible configurations of the particles occupying the sites; and a lattice with one stabilizing site in region that brings in a negative contribution to the free energy. The latter is supposed to mimic the situation where reagent molecules can bind to an RNA molecule that is located in region . For more details, see Section S3.
2.3 GAAA tetraloop of SAM-I riboswitch
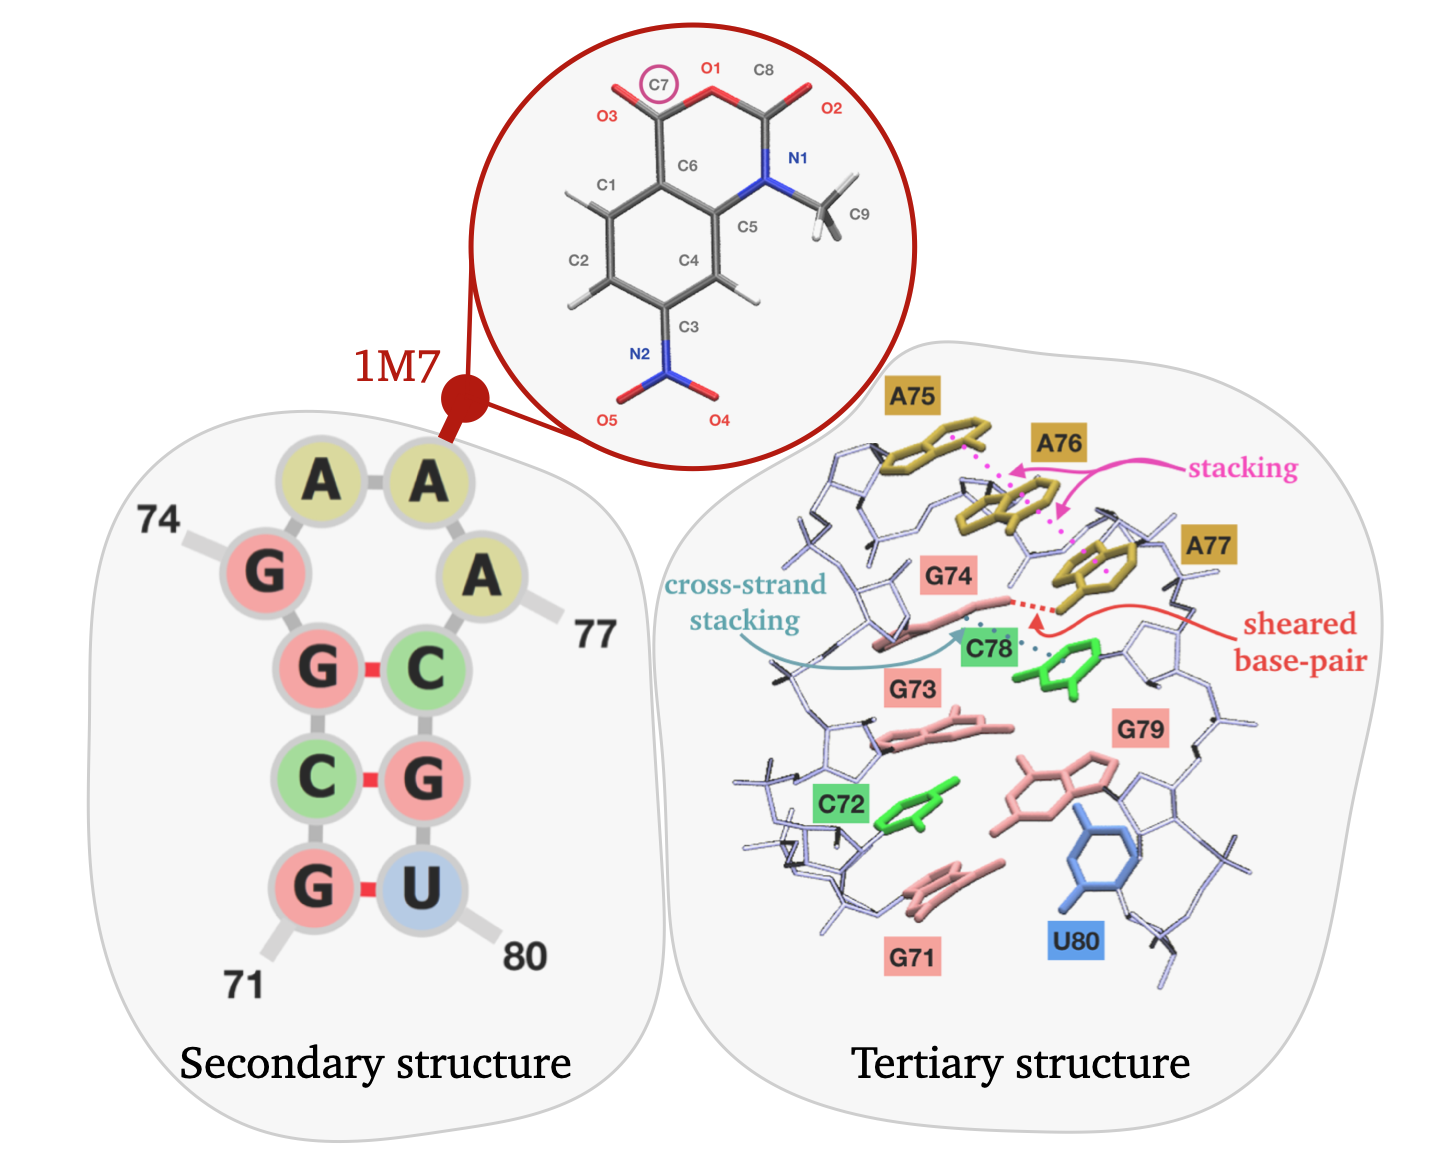
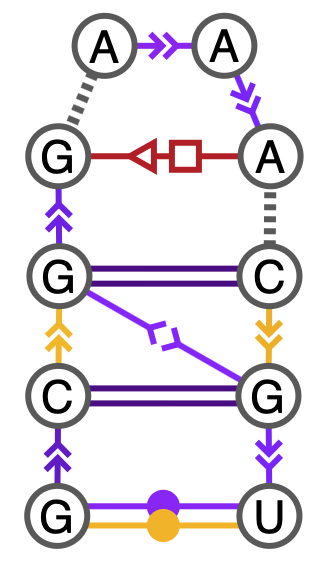
We then apply the introduced method to an RNA GNRA tetraloop (here N is any nucleotide and R is G or A), as this type of structural motif has some well-established properties: it presents (a) highly stable secondary structure 29 along with (b) rich dynamics involving multiple non-canonical contacts 30, 31, that could lead to significant structural changes when in contact with SHAPE reagents; noticeably, (c) in SHAPE experiments the GNRA tetraloop presents a typical reactivity pattern 16. We simulate a single loop motif rather than duplexes or larger structures in order to keep computational costs low, under the hypothesis that long-range effects are negligible. We expect this hypothesis to be reasonable as there is no evidence of conformational rearrangements due to interaction with SHAPE reagents, rather than at a local scale 16. The gcgGAAAcgu tetraloop is taken from the annotated structure of SAM-I riboswitch, that can be found in the PDB entry 2GIS 32. A representation of the resulting construct is shown in Fig. 2. The stretch obtained in this way consists in a sequence of three base pairs, namely G71-U80, C72-G79 and G73-C78, plus the tetraloop under study: G74-A-A-A77. The initial conformation for this molecule is obtained by extracting the coordinates of the corresponding atoms from the PDB 2GIS entry. The closing base-pair of the sequence (G71-U80) is observed to unpair in preliminary simulations where a larger number of reagents is used. Since the calculation is meant to be representative of a GNRA tetraloop embedded in a longer RNA molecule, a harmonic restraint is applied to the hydrogen bonds between 71G/O6 and 80U/N3 and between 71G/N1 and 80U/O2, and these bases are excluded from analysis of reactivity and cooperativity to minimize terminal effects. RNA is parametrized according to the AMBER force field 33, 34, 35.
2.4 Parametrization of 1-methyl-7-nitroisatoic anhydride (1M7)
1M7 is an efficient reagent used for SHAPE probing 36. The molecule is parametrized according to the general Amber force field (GAFF) 37, 38 for organic molecules using the Antechamber and parmchk tools implemented in Ambertools 39. The 1M7 probe structure is generated through the Maestro interface of the Schrödinger suite 40. The Gaussian 16 package is then employed for geometrical optimization and calculation of the electrostatic potential of the probe, using the B3LYP hybrid functional method with basis set. Partial charges are then calculated using the RESP method 41 as implemented in Antechamber. The resulting charges, that sum up to 0 as 1M7 is overall neutral, are reported in Table S1. The resulting Amber potential is then converted to the GROMACS implementation 42, using acpype 43. The optimized structure of 1M7 is reported in Fig. 2.
2.5 Simulation protocol
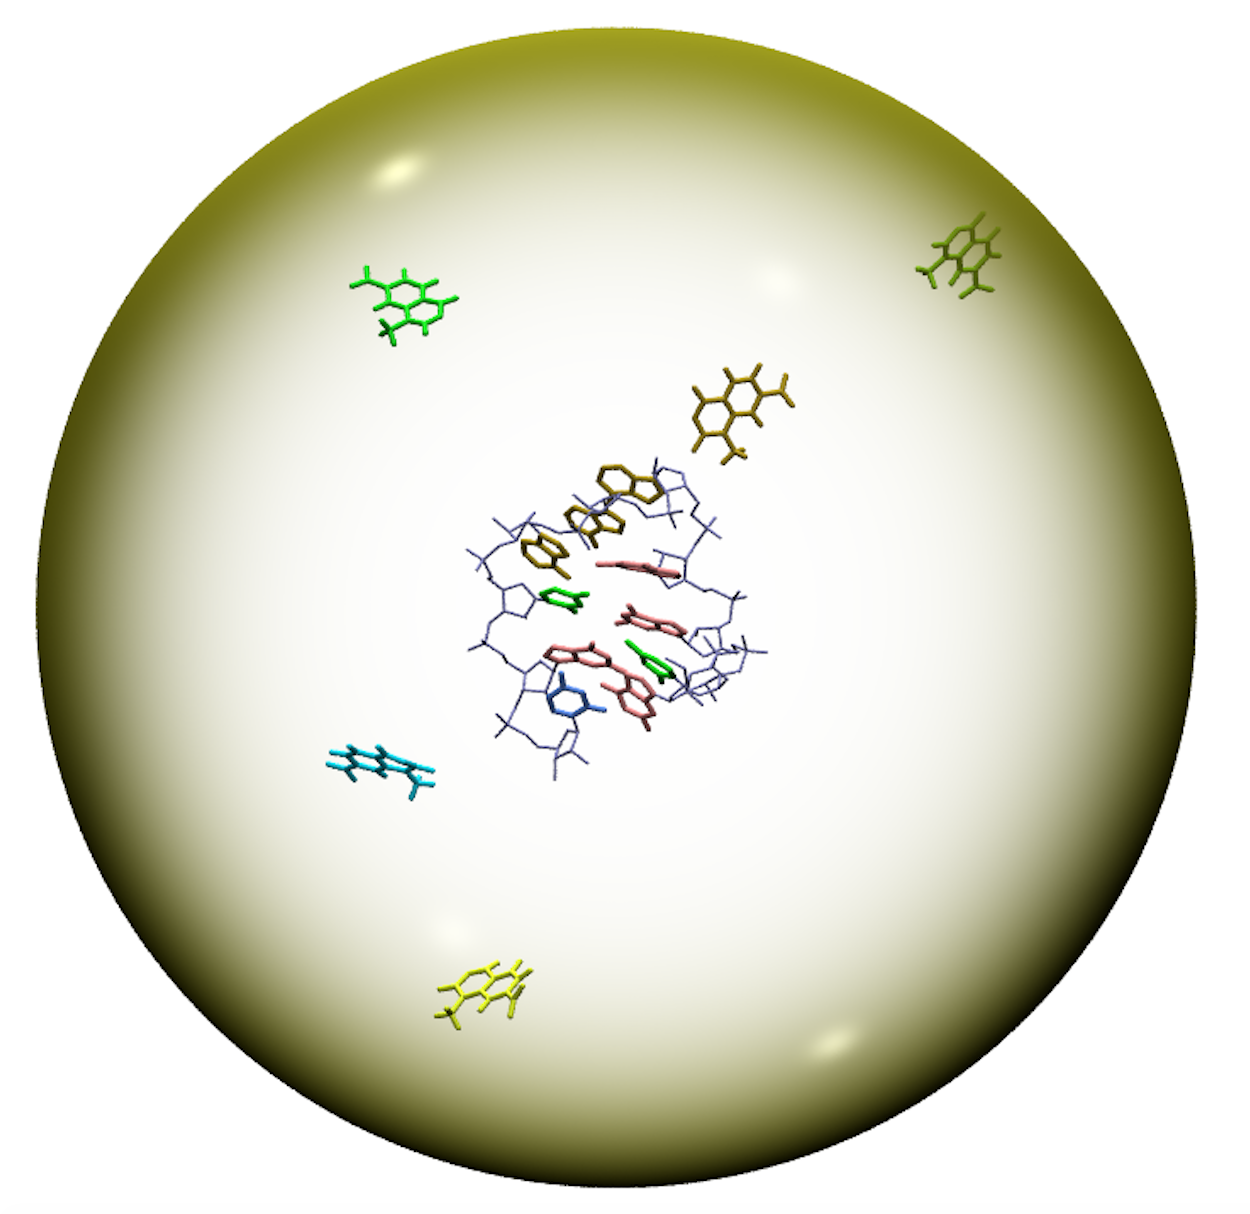
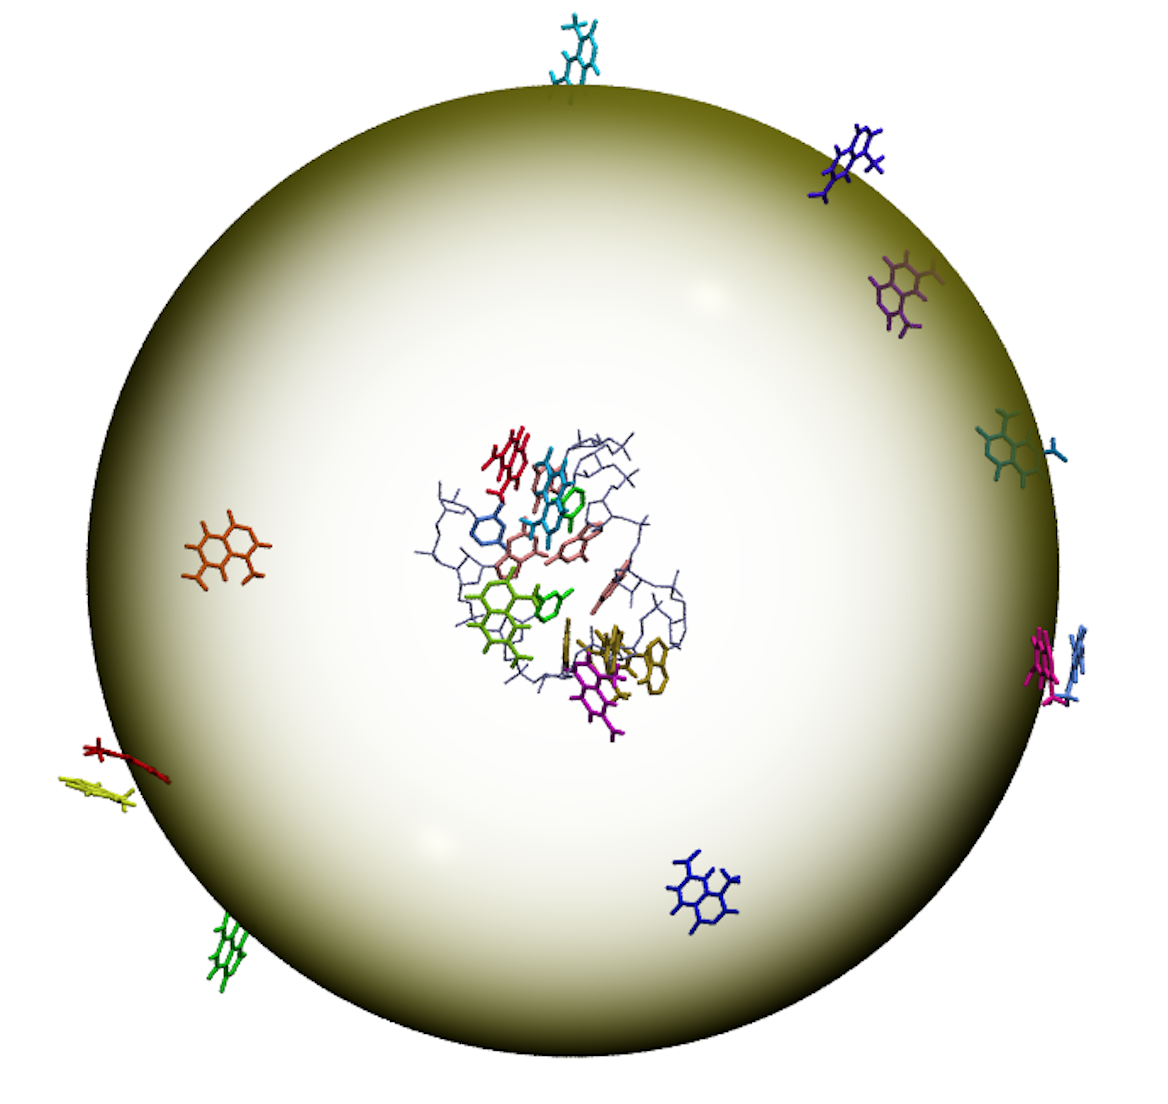
In order to sample a range of different concentrations of 1M7, independent simulations are set up, each featuring a fixed number of probes, from to . For each of them, the center of mass of the tetraloop is taken as origin of the reference frame. A rhombic dodecahedron simulation box is placed at a distance of from the tetraloop. It is important to place the box at this step, before inserting the 1M7 probes, in order to preserve the volume across the simulations with different . Reagents are placed at random points at equal distance from the tetraloop and with random orientation. In particular, the first probe is placed at a random point on the surface of a sphere, centered on the tetraloop and with radius equal to the radius of gyration of the tetraloop plus . The probe is then rotated about its center of mass by a random angle. A check on the distances between every atom pair is made in order to avoid clashes: if one of the atoms of the inserted probe is at a distance lower than from any other atom, the insertion is rejected and another point and orientation are generated. For each of the remaining probes the insertion procedure is repeated. Examples of the resulting conformation are represented in Fig. S5 for and . The resulting complexes are solvated using the OPC water model 44 and sodium counterions are added to neutralize the system 45. For each complex, the potential energy is minimized in order to relax the structures and remove possible clashes and incorrect geometries, through 50000 steps of steepest descent algorithm. The minimization is followed by NVT equilibration of up to a temperature , and NPT equilibration at the same temperature, pressure for another using a Parrinello-Rahman barostat 46. A cutoff of and the particle-mesh Ewald (PME) method 47 are used for computing short-range interactions and long-range interactions, respectively. Temperature is controlled using the stochastic velocity rescaling thermostat 48. Equilibration is run with a time step of with bonds involving hydrogens constrained via the LINCS algorithm 49. Production runs are then carried out in the NPT ensemble at and . Plain MD simulations are performed using version 2018.5 of the GROMACS software 42.
2.6 Statistical uncertainties
To compute statistical uncertainties, we rely on a Bayesian bootstrap procedure 50 where each entire trajectory is treated as a single data point. Specifically, at each bootstrap iteration (total 10000 iterations) we extract 19 weights from a Dirichlet distribution and use the resulting weighted trajectories to (a) estimate the canonical partition functions and , (b) compute the chemical potential corresponding to the desired concentration in region and (c) use the resulting weights to compute the observable of interest. Given that trajectories are independent of each other, and at variance with standard block analysis 51, this estimate of the uncertainty is not subject to errors due to correlation between data points.
2.7 Experimental methods
DNA template corresponding to the GNRA tetraloop containing RNAs used in this study (PDB entries 2GIS32, 1KXK52, 1SCL53, 1CQ554, and 2GV455) with 5′ and 3′ SHAPE cassettes 56 and the T7 promoter sequence was ordered from Eurofins Genomics. The RNA was transcribed and purified as previously described 7. SHAPE experiments were carried out with the 1M7 adduct at three final concentrations (12.5 mM, 6.5 mM, and 3.25 mM) and subsequent analysis of the concentration series was carried out as previously described 7.
3 Results
3.1 Lattice model
In order to highlight the potential limitations of the simulation and reweighting protocol we used our method to reconstruct the grand-canonical distributions for a lattice model. Results are presented in the supporting information, Section S3, and highlight the main limitation of the method, namely the fact that only concentrations that correspond to the number of particles in the set of analyzed simulations can be correctly reproduced. In addition, the model can be used to study the impact of statistical sampling errors on the estimated distributions.
3.2 Molecular dynamics simulations of SHAPE reagents
In order to estimate the reactivity profile and cooperativity matrix of the gcgGAAAcgu tetraloop at different concentrations of 1M7, we first divide the simulation space into two regions: the binding region is spherical, centered at the center of mass of the RNA motif with a fixed radius ; the rest of the simulation space is defined as the buffer region . In the binding region, the reagent copies are in proximity of the tetraloop and can form a relatively stable bound state, preliminary to the formation of the covalent bond that is not modeled here. In the buffer region, there are no direct interactions between reagent copies and RNA, and the formation of a bound state is not possible, as is beyond the range of distances for binding. trajectories are collected, each featuring reagent copies with . Every trajectory contains frames, corresponding to a total simulation length of per trajectory. From the entire set of trajectories, we compute the number of times that each pair of nucleotides and in the tetraloop are in one of four possible pairwise binding states: both unbound, both bound to two different reagent copies, or only one of the two nucleotides bound to a reagent copy. We define binding between a nucleotide and a reagent copy to occur whenever the following two conditions are satisfied: a) the nucleotide is the nearest one to the probe, and b) the distance between the nucleotide and the probe is less than a certain threshold. For both conditions, we measure the distance by considering the atoms involved in the chemical reaction, namely the O atom of the nucleotide and the C atom of the reactive carbonyl of 1M7. We set this threshold to , consistently with Ref. 16.
By accumulating statistics on the trajectories and using the introduced grand-canonical reweighting, we can estimate the partition functions and , the value of the chemical potential that correspond to the target reagent concentration, and the probability for one or two nucleotides to be bound to a reagent in the grand-canonical ensemble. Typically, SHAPE experiments using 1M7 as a probe are carried out at reagent concentrations ranging from to 36. Using a dodecahedral simulation box of volume , the radius of the binding region fixed at and maximum number of reagent copies in the collected trajectories we can only reproduce reagent concentrations that are below a threshold of . Given and , one can obtain the weights for computing averages in the grand-canonical ensemble, which are denoted as since, for each frame, the weight only depends on the number of copies of the reagent seen in region .
3.3 Concentration-dependent reactivities
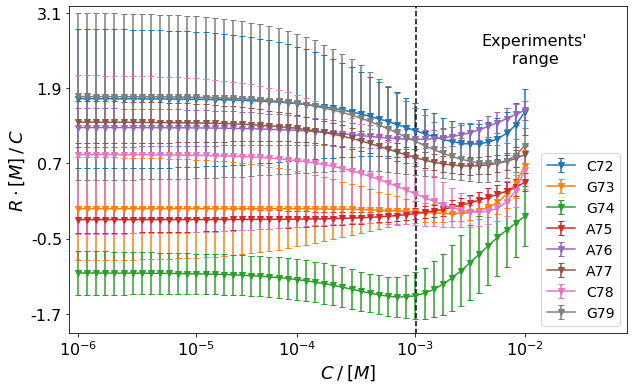
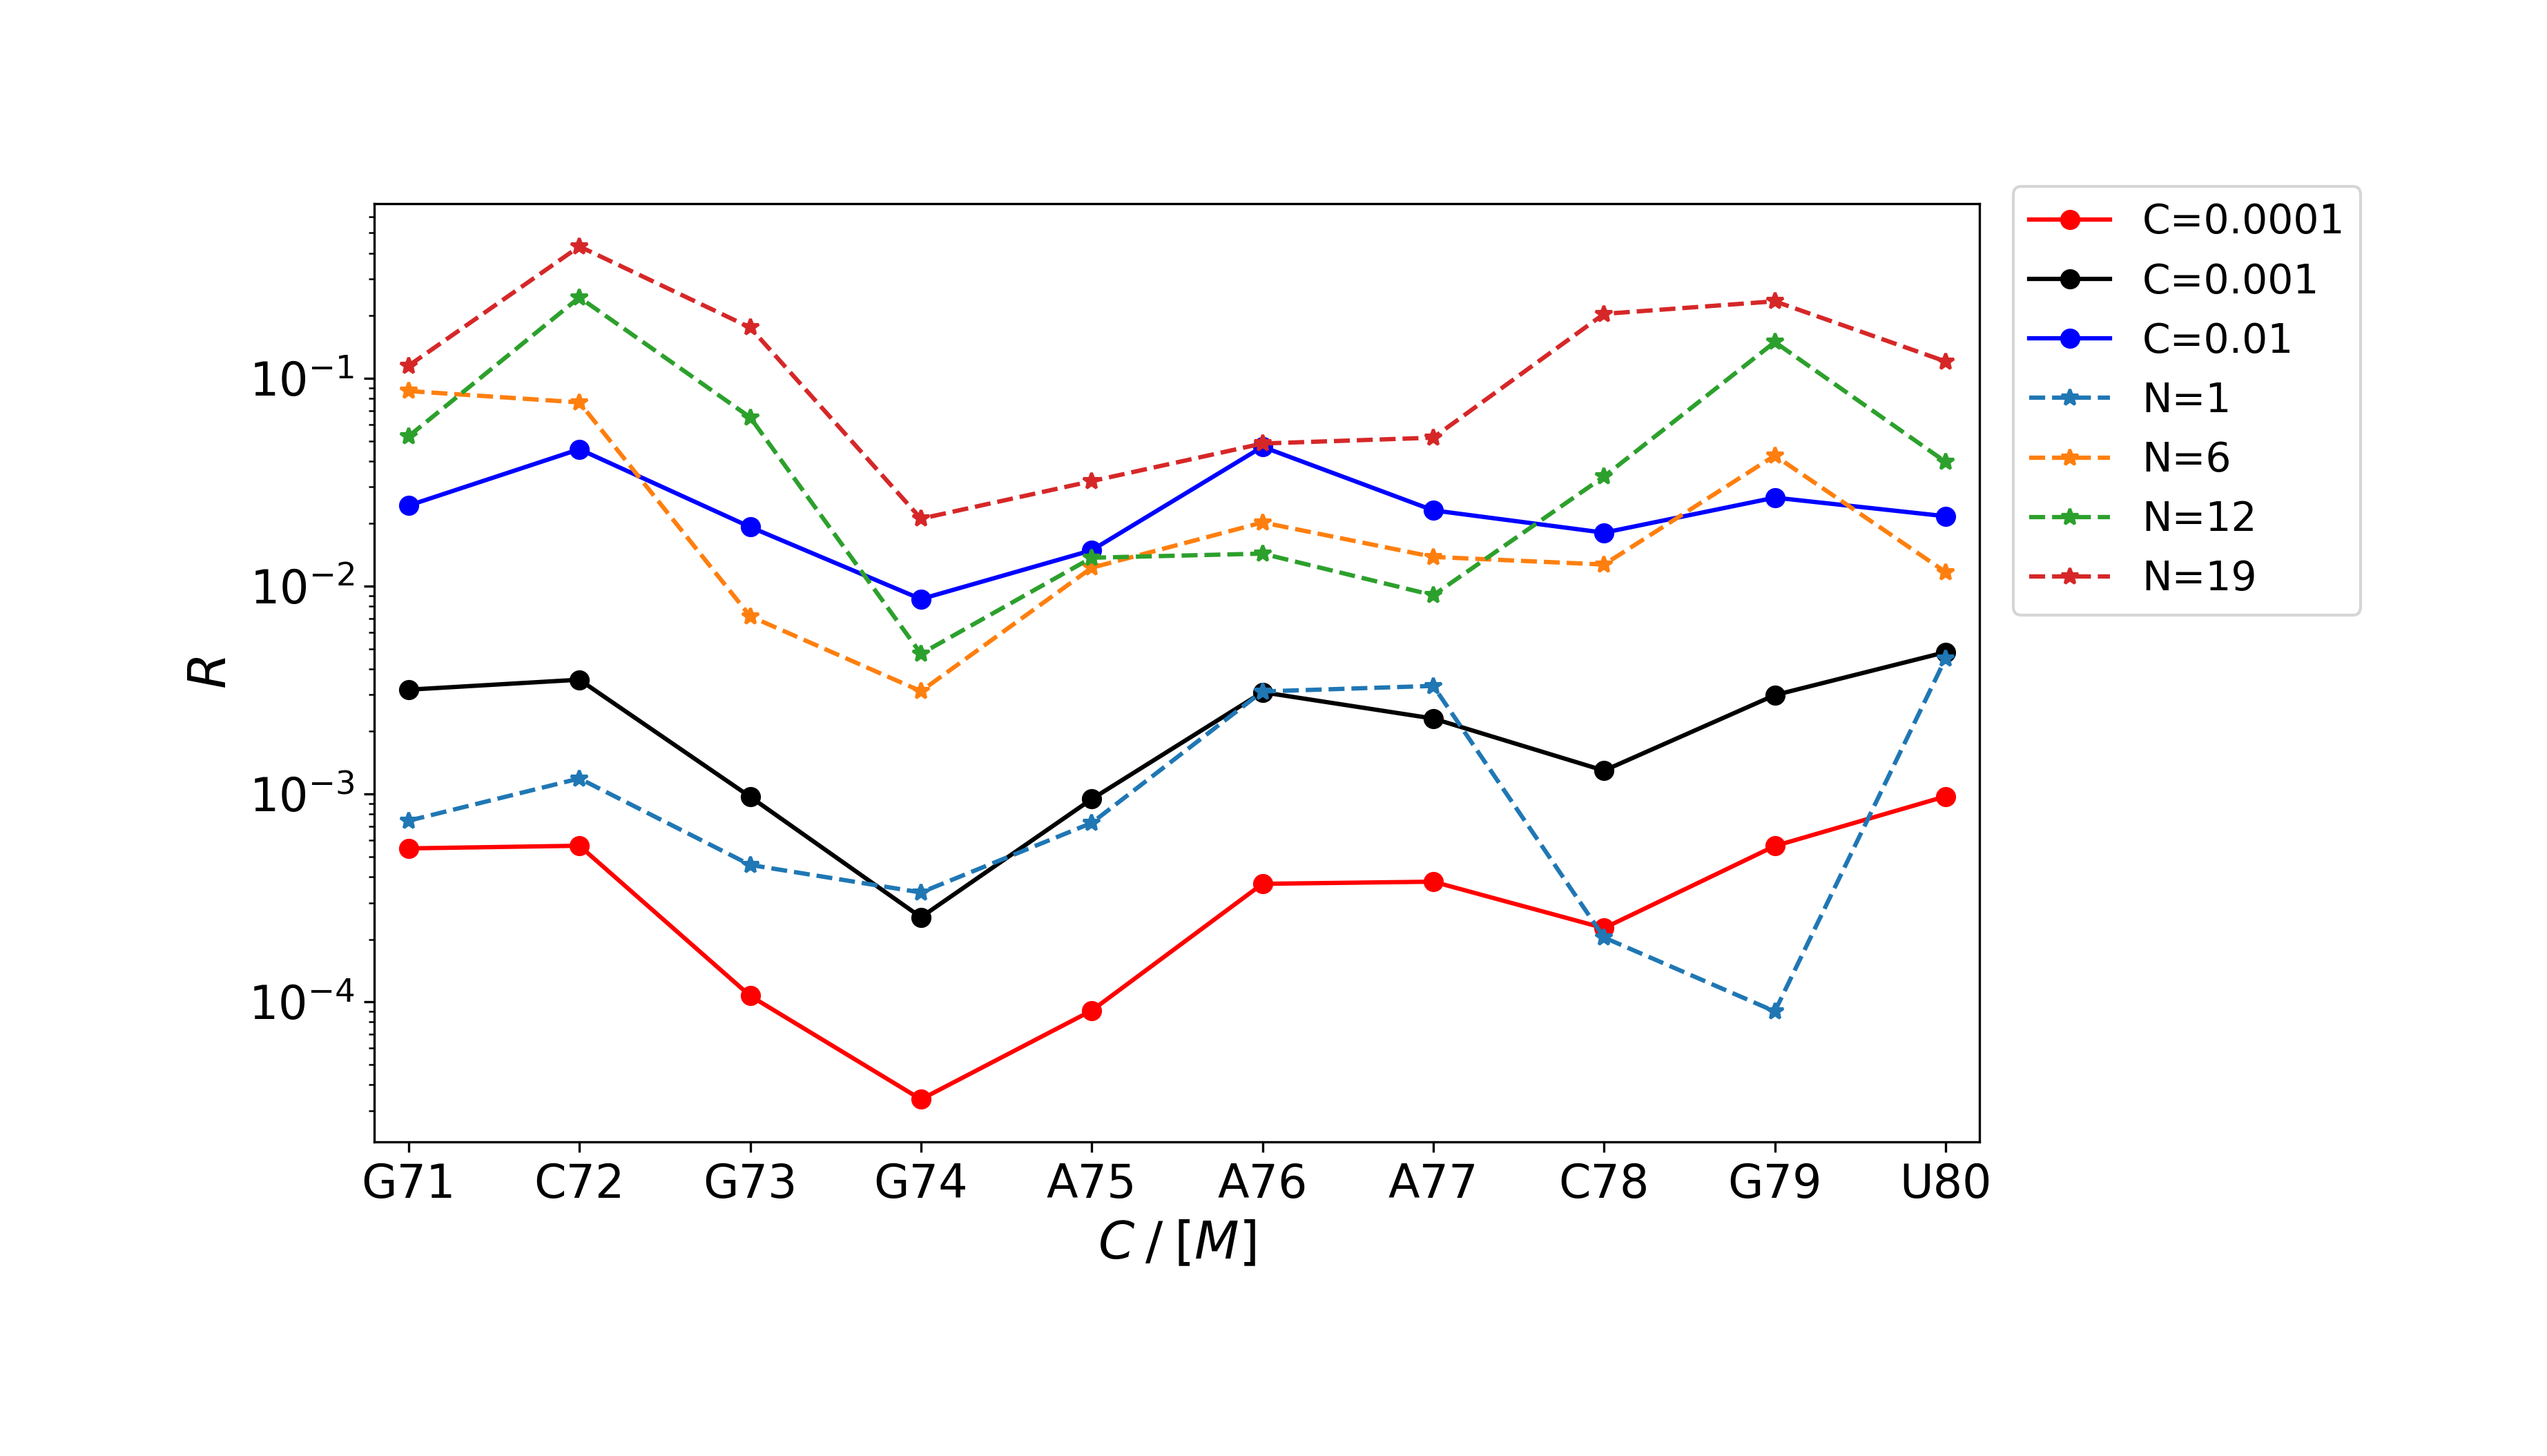
For each nucleotide, we estimate the reactivity from the frequency with which it is observed in a bound state with any one of the reagent copies, and we average it in the grand-canonical ensemble, using the weights . In theory, the relation between the reactivity of a nucleotide and the concentration of reagent can be decomposed in the sum of terms representing the effect of a) the number of available reagent copies, b) the effect of a bound nucleotide on the binding probability of another nucleotide, due to (positive or negative) cooperativity, and c) higher order relations involving more than two nucleotides. The first term is proportional to the concentration while higher-order terms depend on higher powers of the concentration. The dependency on reagent concentration of the binding affinities that we obtain for the simulated RNA motif is represented in Fig. 3. At sufficiently low concentrations, the ratio between reactivity and concentration saturates to a constant, consistently with the expected linear relationship. As reagent concentration is increased, and specifically for , higher-order contributions start to emerge significantly, as some reactivities show a non-linear dependency on concentration. In principle, one nucleotide can exhibit positive cooperativity with some nucleotides and negative cooperativity with others. We attribute a super-linear relation between reactivity and reagent concentration to predominantly cooperative behavior, as binding affinity increases more than proportionally to the number of reagent copies available. As well, we interpret a sub-linear dependency as a signal of predominantly anti-cooperative behavior, and an approximately linear dependency either as absence of cooperative effects or as positive and negative cooperativity behaviors compensating each other. Noticeably, the range of concentrations ( to ) that we identify as affected by cooperative effects, overlaps significantly with the range of concentrations typically adopted in experiments. In this range, we quantify the non-linearity of reactivity as a function of concentration for each nucleotide, by fitting power laws . Fit parameters are reported in Table 1. Uncertainties are computed here by performing the fitting at every bootstrap iteration and computing the standard deviation of the resulting coefficients. Although the statistical uncertainty on the individual points reported in Fig. 3 is relatively high, errors associated to different values of concentration are correlated, resulting in relatively low uncertainty in the estimated power coefficients (Table 1). In particular, for G74 we detect the strongest super-linear dependency.
| Nucleotide | ||
|---|---|---|
| C72 | ||
| G73 | ||
| G74 | ||
| A75 | ||
| A76 | ||
| A77 | ||
| C78 | ||
| G79 | ||
3.4 Free-energy couplings
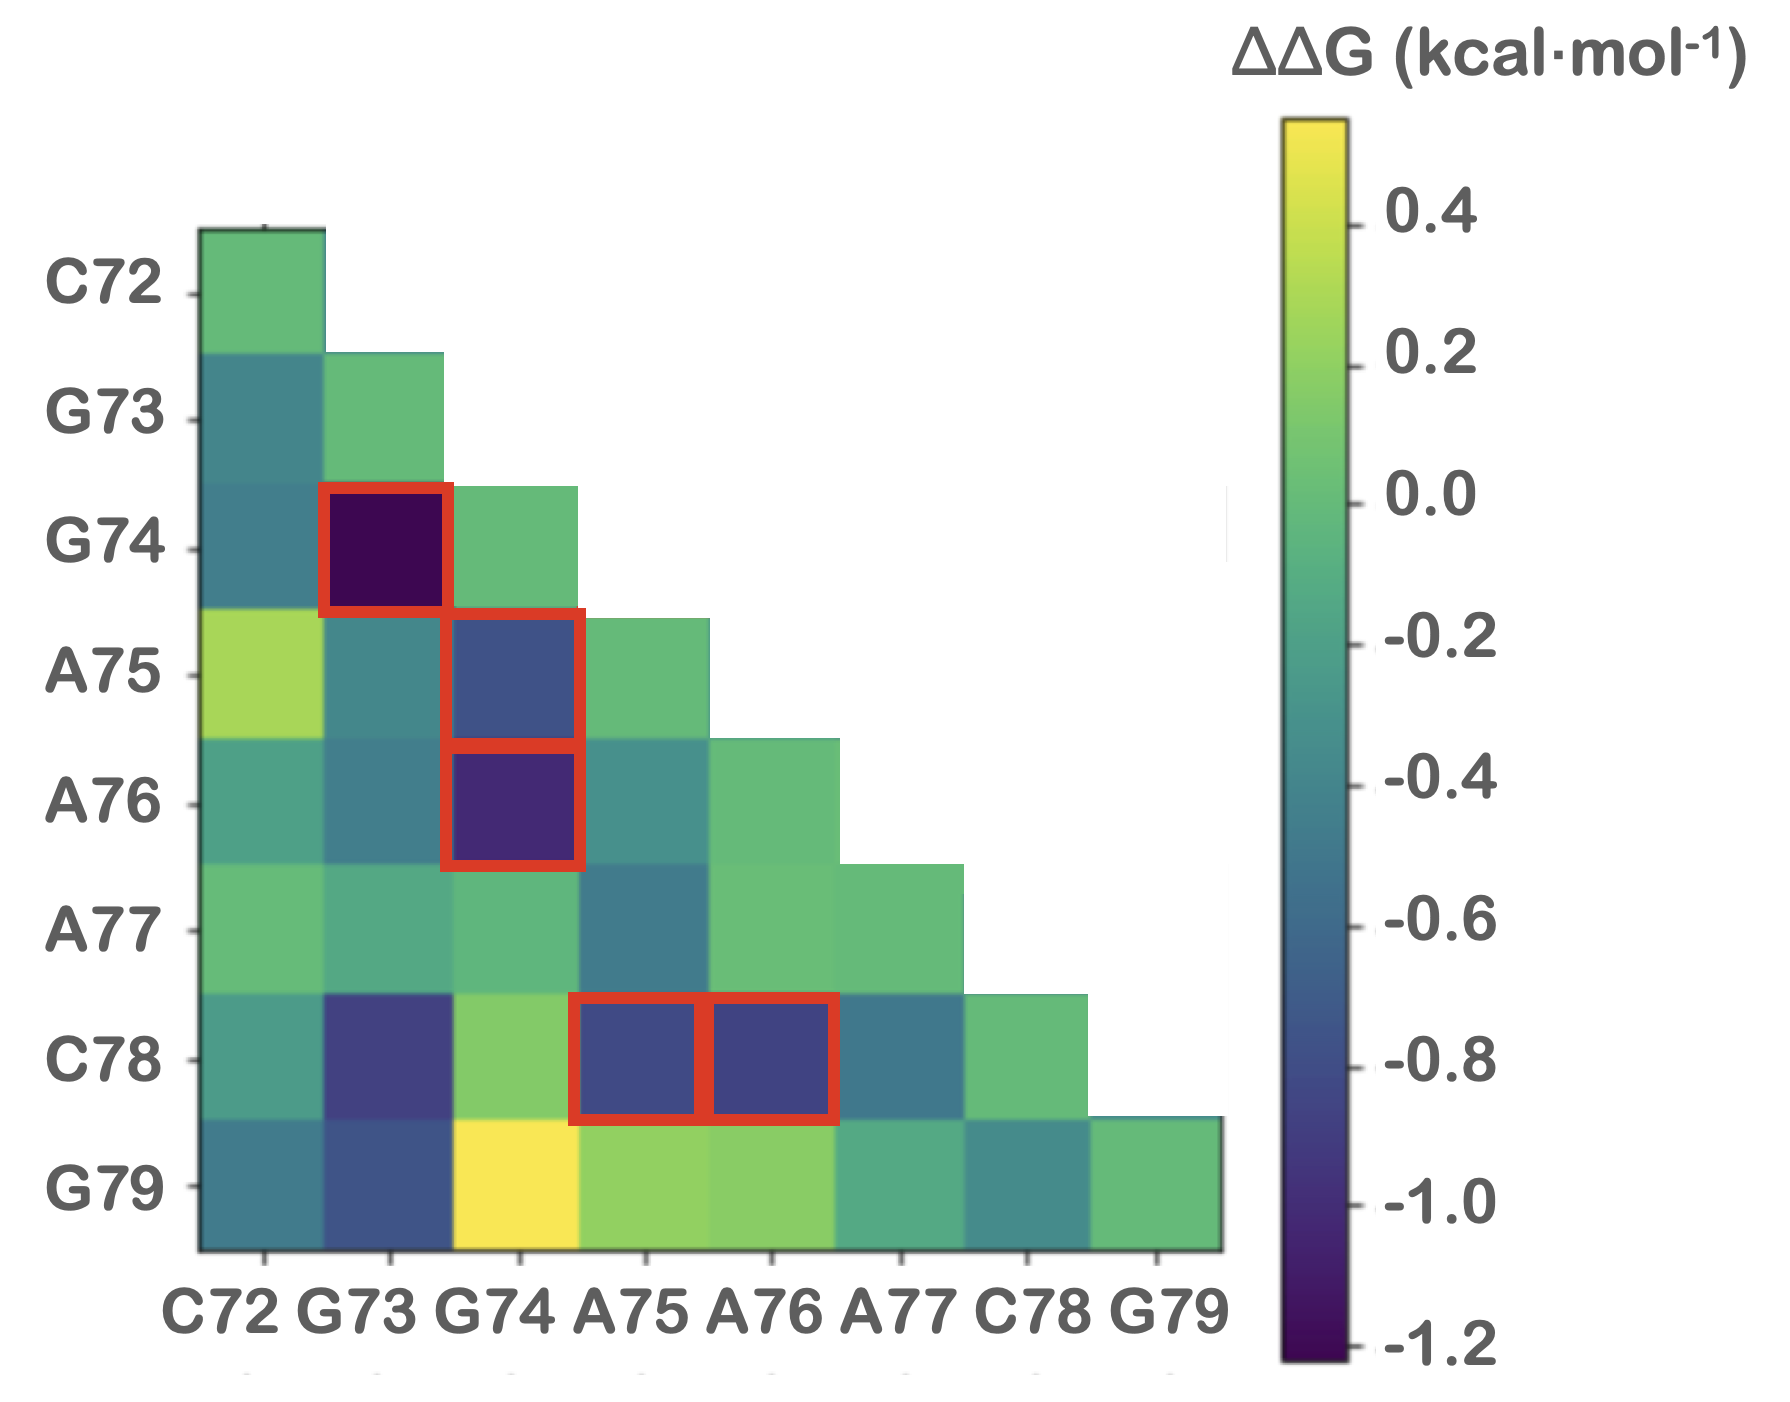
In order to quantify the cooperativity of nucleotides in reagent binding, we rely on the free-energy coupling model 57. Negative free-energy coupling means that the binding affinity of nucleotide is increased if nucleotide is bound to a reagent copy, so they are cooperative. Vice-versa, positive means they are anti-cooperative. From the observed events, we can compute the frequency with which two nucleotides are in the same binding states, and the frequency with which only one of the two is bound. From the ratio between these two frequencies, we compute the free-energy coupling for each pair of nucleotides, reweighted in the grand-canonical ensemble. The estimated values of for an intermediate reagent concentration () among the tested ones are reported in Fig. 4.
To identify pairs of nucleotides for which the cooperativity or anti-cooperativity is significantly different from zero, we check which fraction of the bootstrap samples return a cooperativity or anti-cooperativity larger than zero. We set a significance level of . Since we deal with 28 hypotheses simultaneously, we rely on the Benjamini-Hochberg procedure 58 to keep the false discovery rate of our estimates at level . Pairs of nucleotides with significantly cooperative behavior are G73-G74, G74-A76, A76-C78 , G74-A75 and A75-C78. At the same concentration, no significant anti-cooperative behavior is identified.
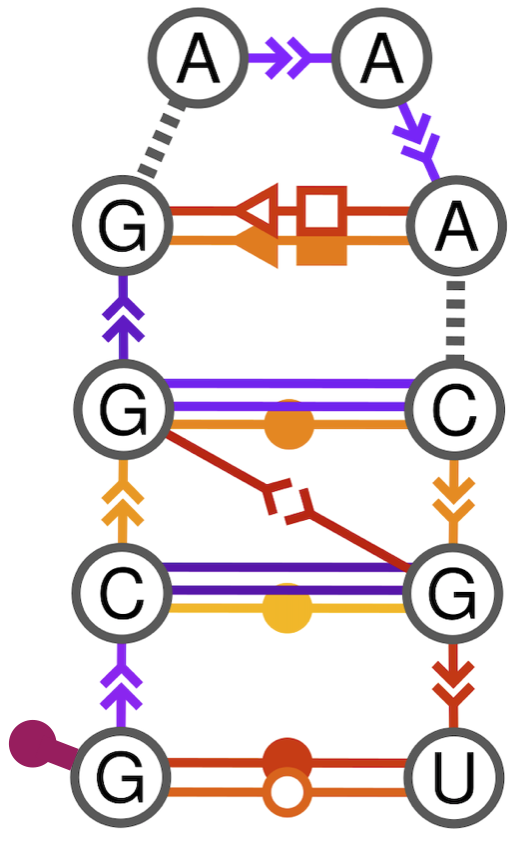
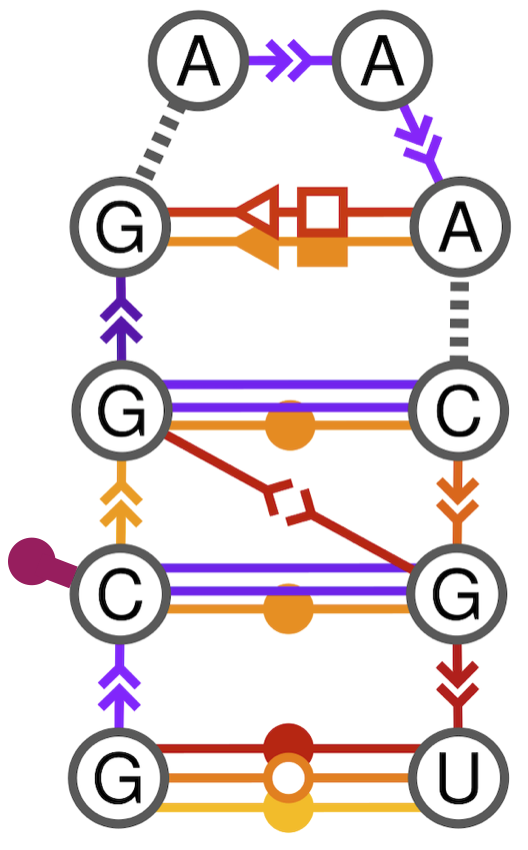
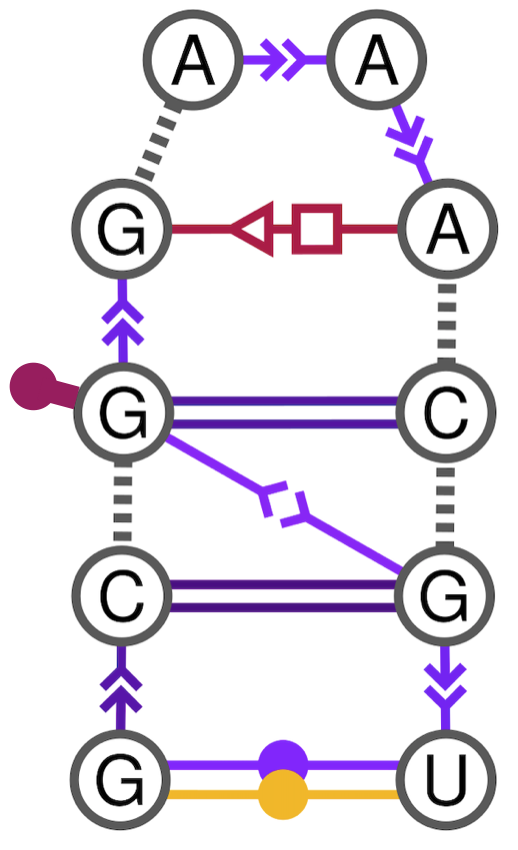
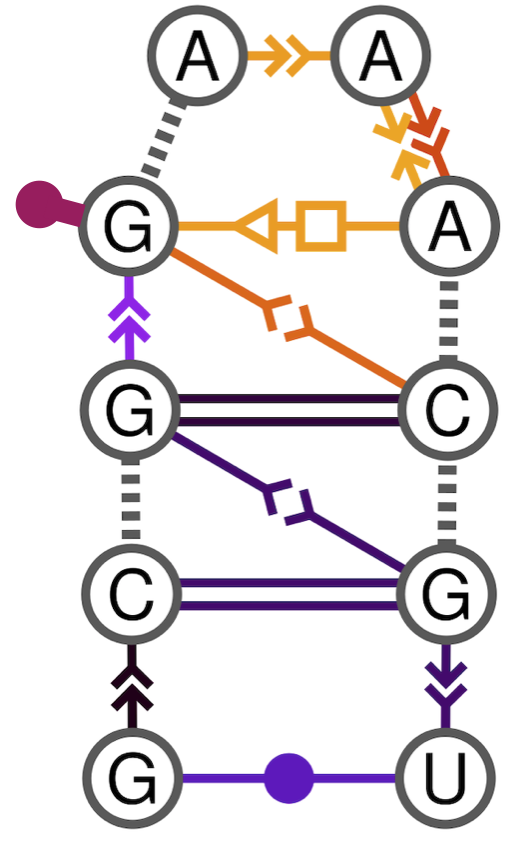

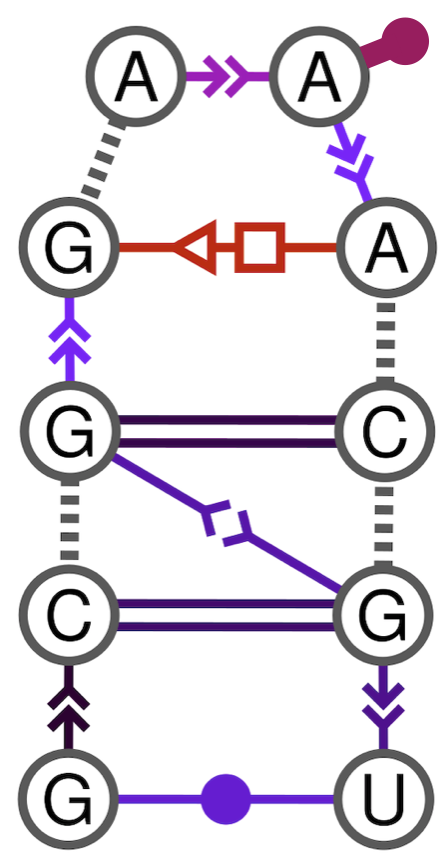
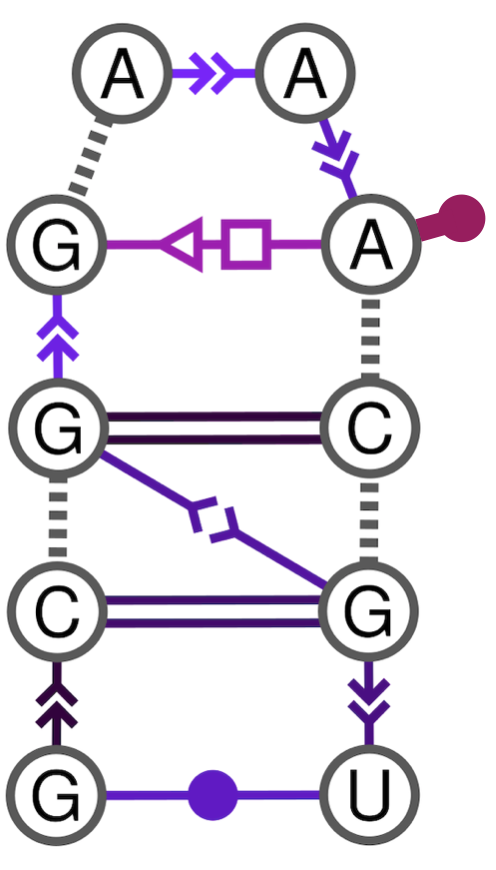
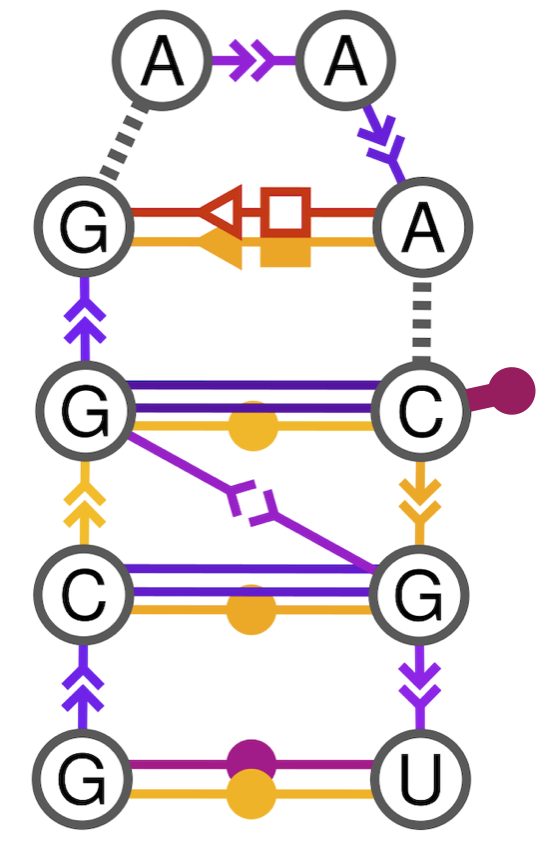
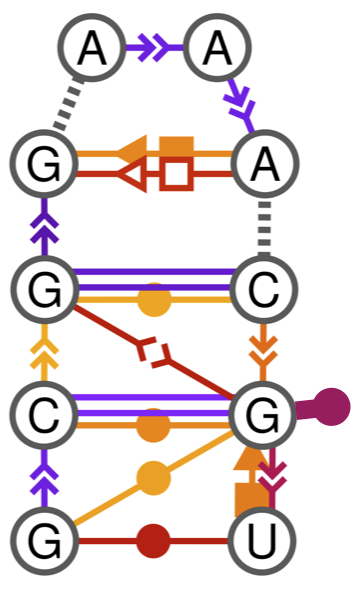
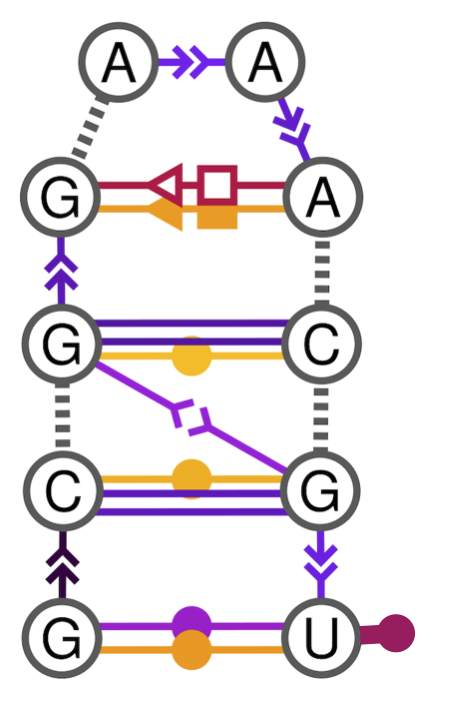
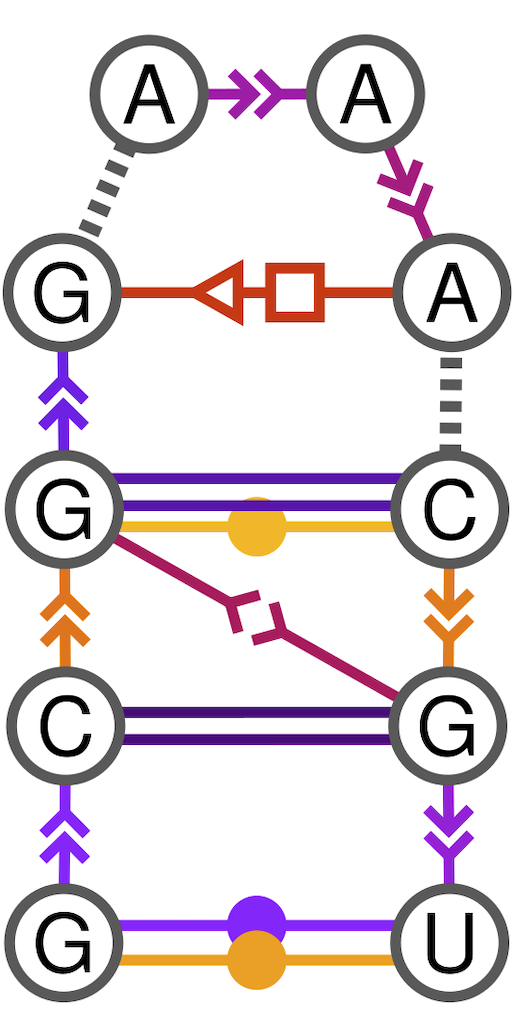
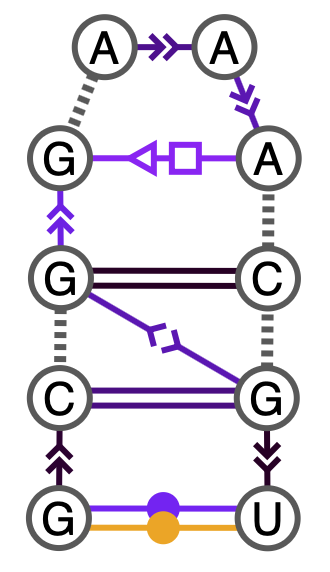
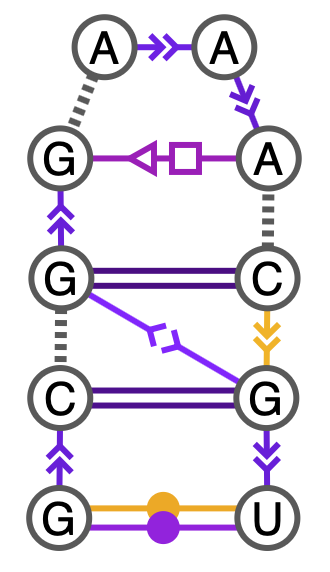
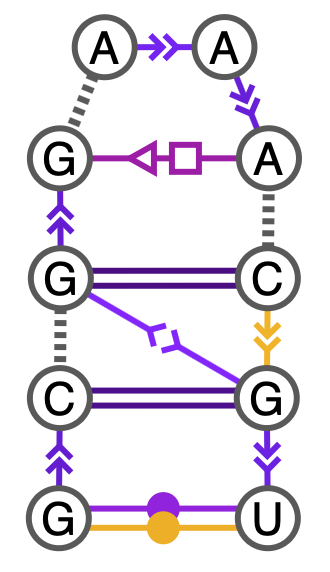
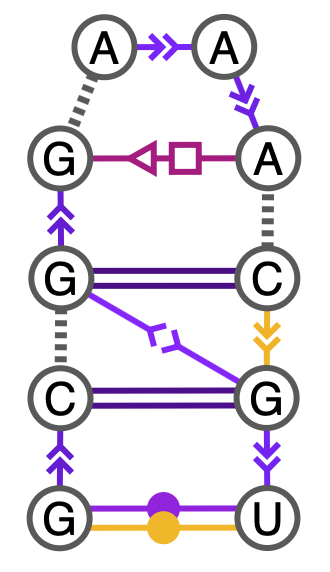
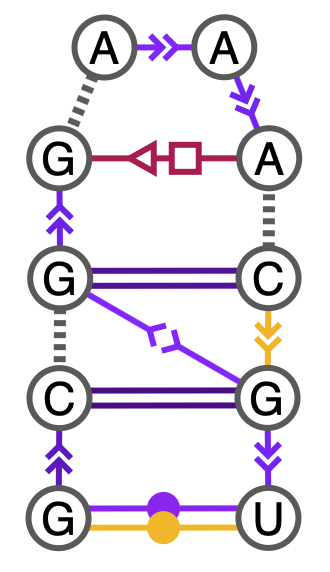
3.5 Structural analysis
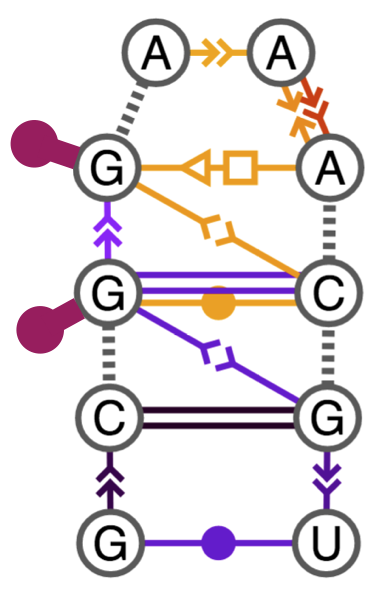
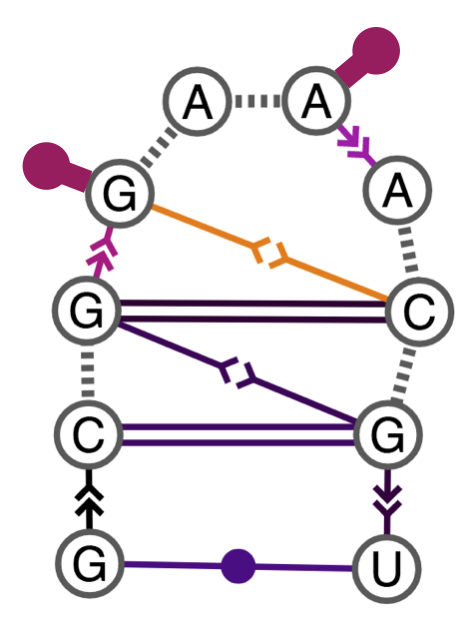
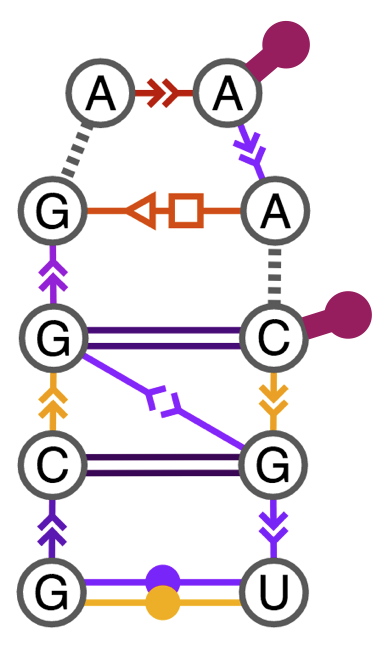
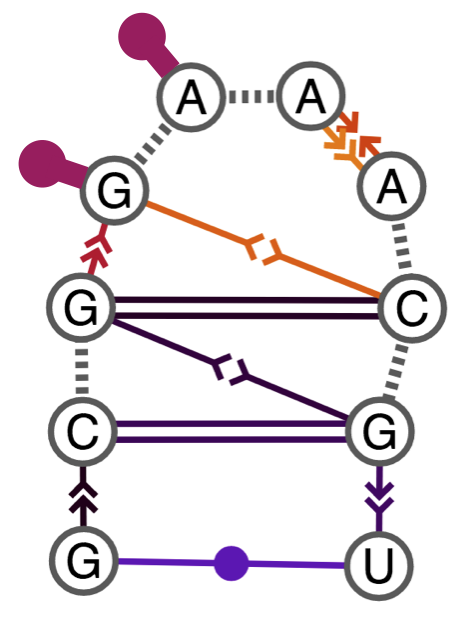
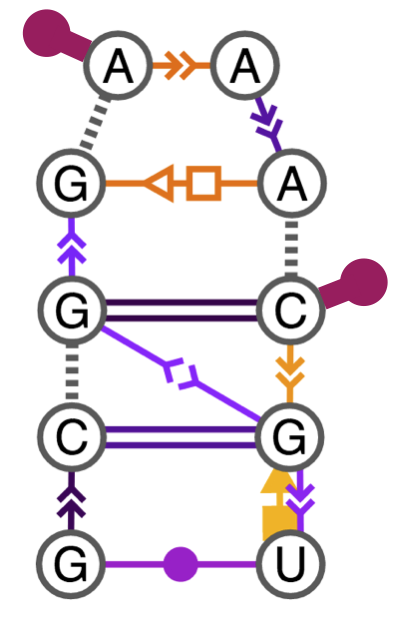
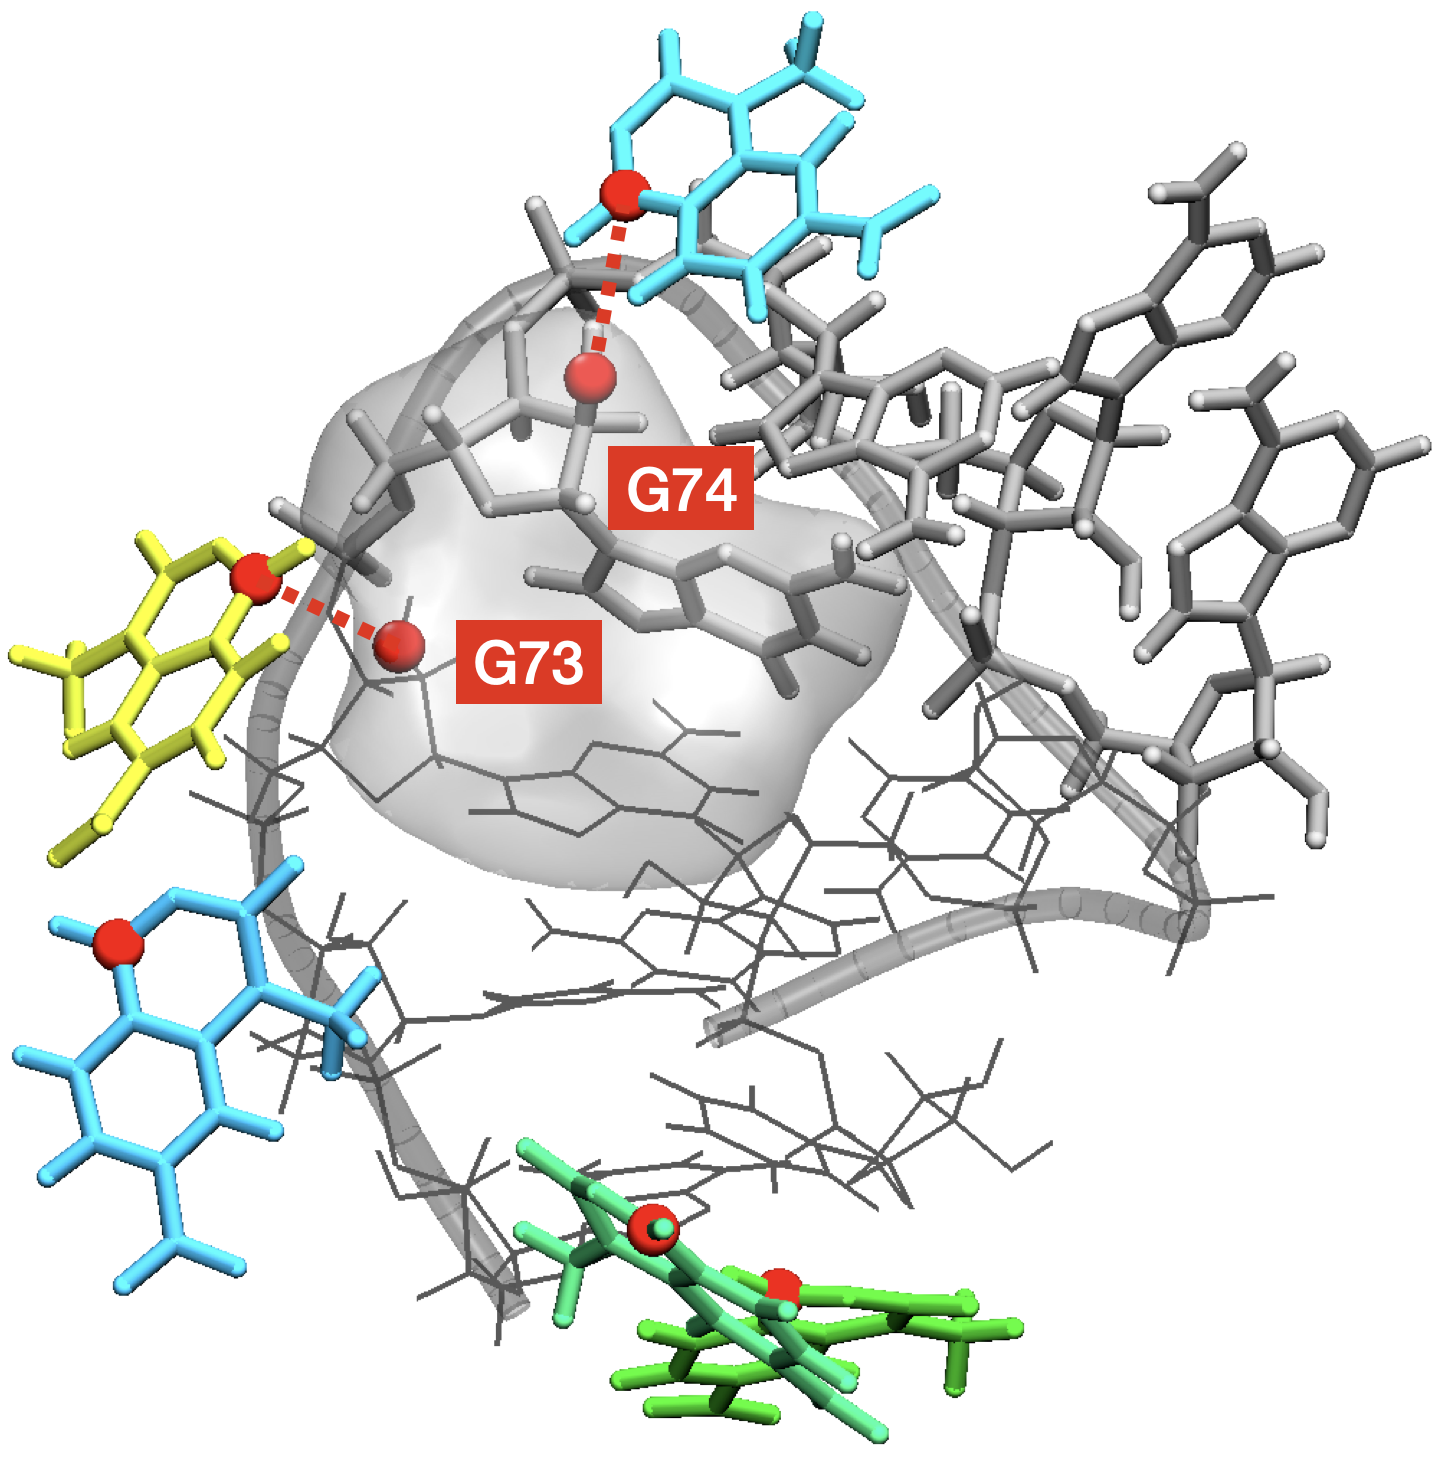
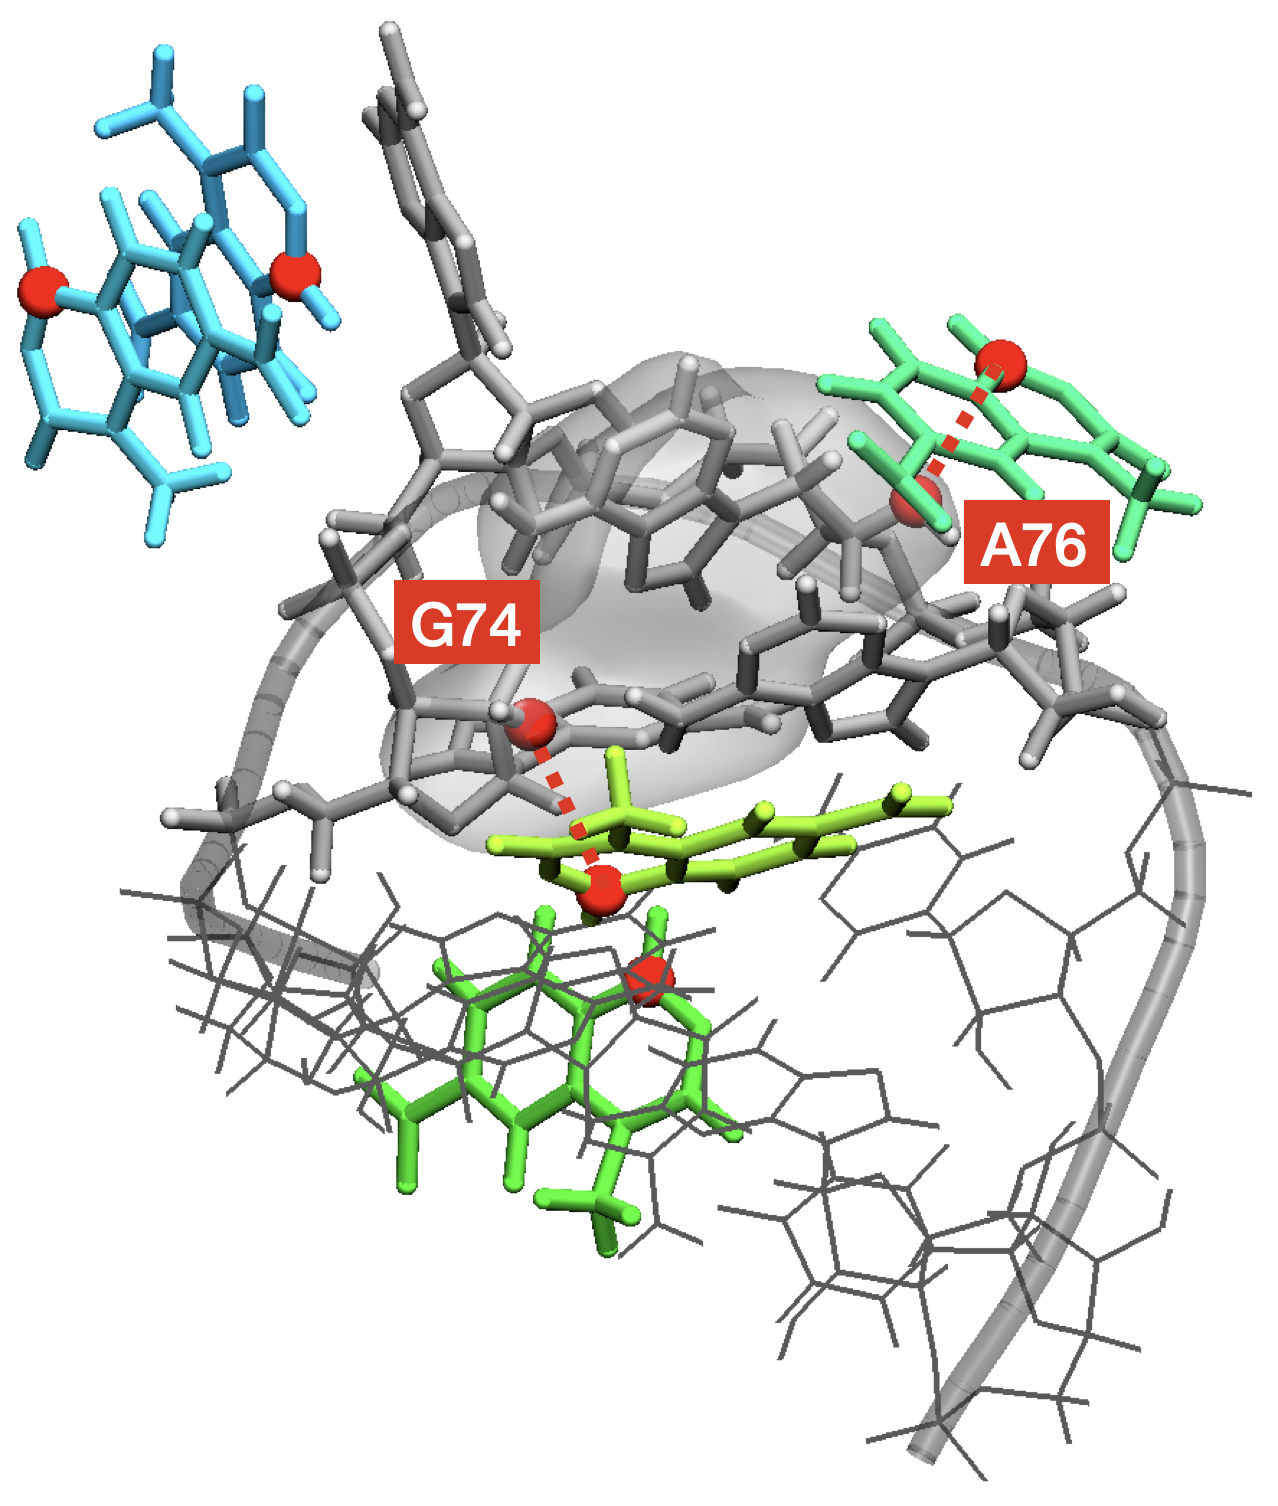
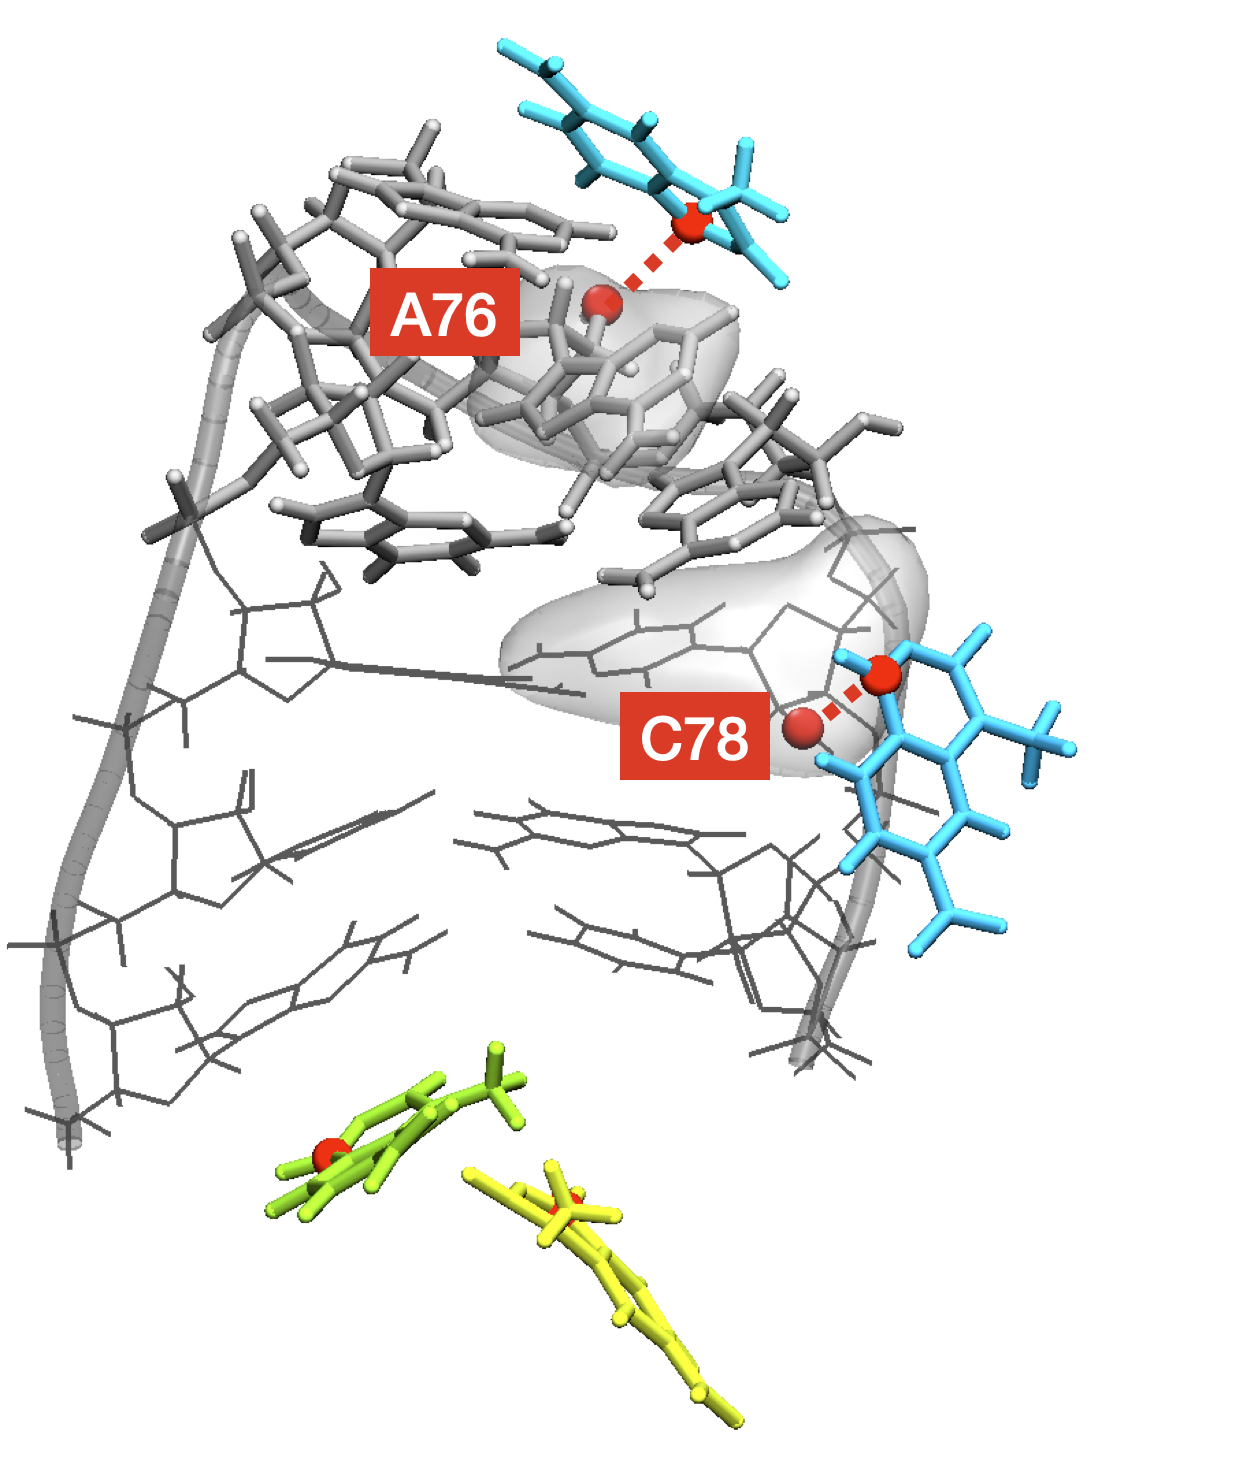

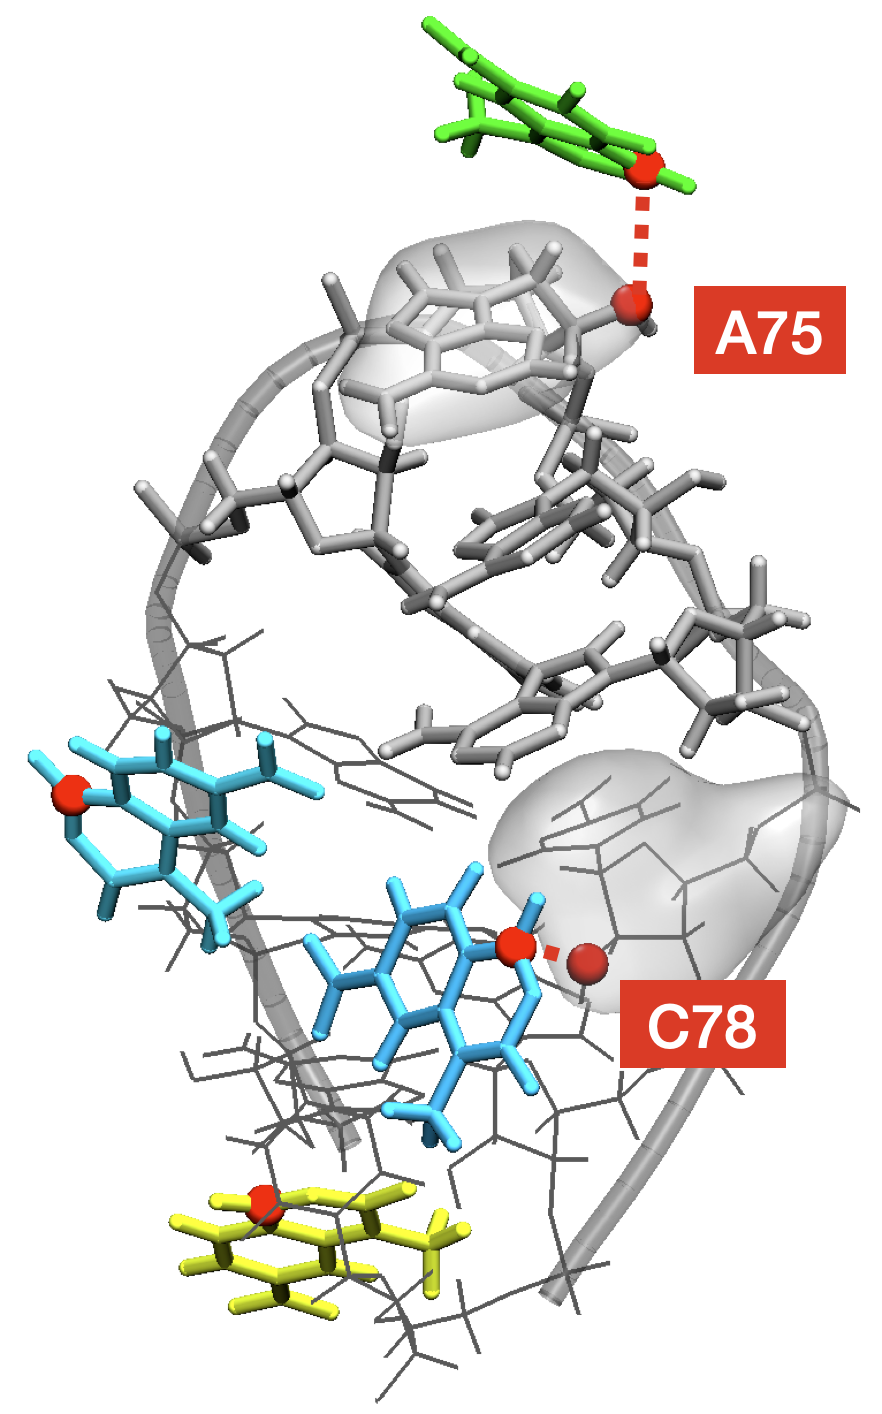
In order to investigate the structural signatures of cooperativity, we analyzed the conformations generated in all the simulated trajectories. In particular, we extracted sets of frames corresponding to specific conditions and analyzed them using the barnaba package60, which allows showing their dynamic secondary structure representation. In this representation, base-stacking and base-pairing interactions between nucleotides are reported accordingly to Leontis-Westhof classification 59, and the population of each interaction is shown by coloring it accordingly to the reported color map. Before analysis, frames were subsampled with weights corresponding to their population at the intermediate concentration . Dynamic secondary structures for frames where individual nucleotides were in bound states are reported in Fig. 5. These secondary structures were similar to those obtained by sampling from the entire trajectory, that are also shown in Fig. 5 as a control, with limited changes in the populations of the pairings close to the bound site. Similarly, dynamic secondary structures computed using all frames with weights that correspond to a range of different values for the reagent concentration did not show significant effects on RNA structure (see Fig. S6), except for a decrease in the population of the G74:A77 pair. Then, for each of the cooperative pairs identified in Fig. 4, we sampled from the set of frames where both nucleotides of the pair where in bound state. Results are shown in Fig. 6. The only significant change in structure occurs when G74 is involved in a binding event simultaneously with another cooperative nucleotide in the loop (A75 and A76). This implies that only when two copies of the reagent are bound to G74 and to one among A75 and A76 the structural ensemble of the tetraloop is significantly perturbed. This perturbation is likely responsible for the cooperative effect reported in Fig. 4. Sample three-dimensional structures corresponding to simultaneous pairs of bound nucleotides are reported in Fig. 7.
3.6 Importance of grand-canonical reweighting
An important advantage of using the grand-canonical reweighting procedure introduced here with respect to simply consider the finite difference between simulations performed at a different number of particles is that smooth concentration-dependent curves can be extracted. In Section S7 we compare reactivities obtained at fixed number of copies, obtained by separately analyzing some of the trajectories discussed above, and reactivities obtained at fixed chemical potentials, obtained by averaging over the entire concatenated trajectory. Behavior as a function of the chemical potential is visibly smoother than behavior as a function of the number of particles, thus making it easier to extract cooperative effects.
3.7 Control simulations
We investigated the robustness of our results with respect to two properties of the simulation settings: helix length and ionic conditions. Since a systematic study of the effects of these properties on binding cooperativity is outside the scope of this work, we only generated two control trajectories, at a fixed representative value of the number of reagent copies, , and checked that reactivity profiles were consistent with those obtained from our study. In one case we simulated a longer part of the SAM-I riboswitch, ranging namely from C69 to G82 (two additional base-pairs); in the other case we increase the ionic strength. Comparisons with the main simulations are reported respectively in Section S9 and S8.
3.8 Comparison with experimental analysis
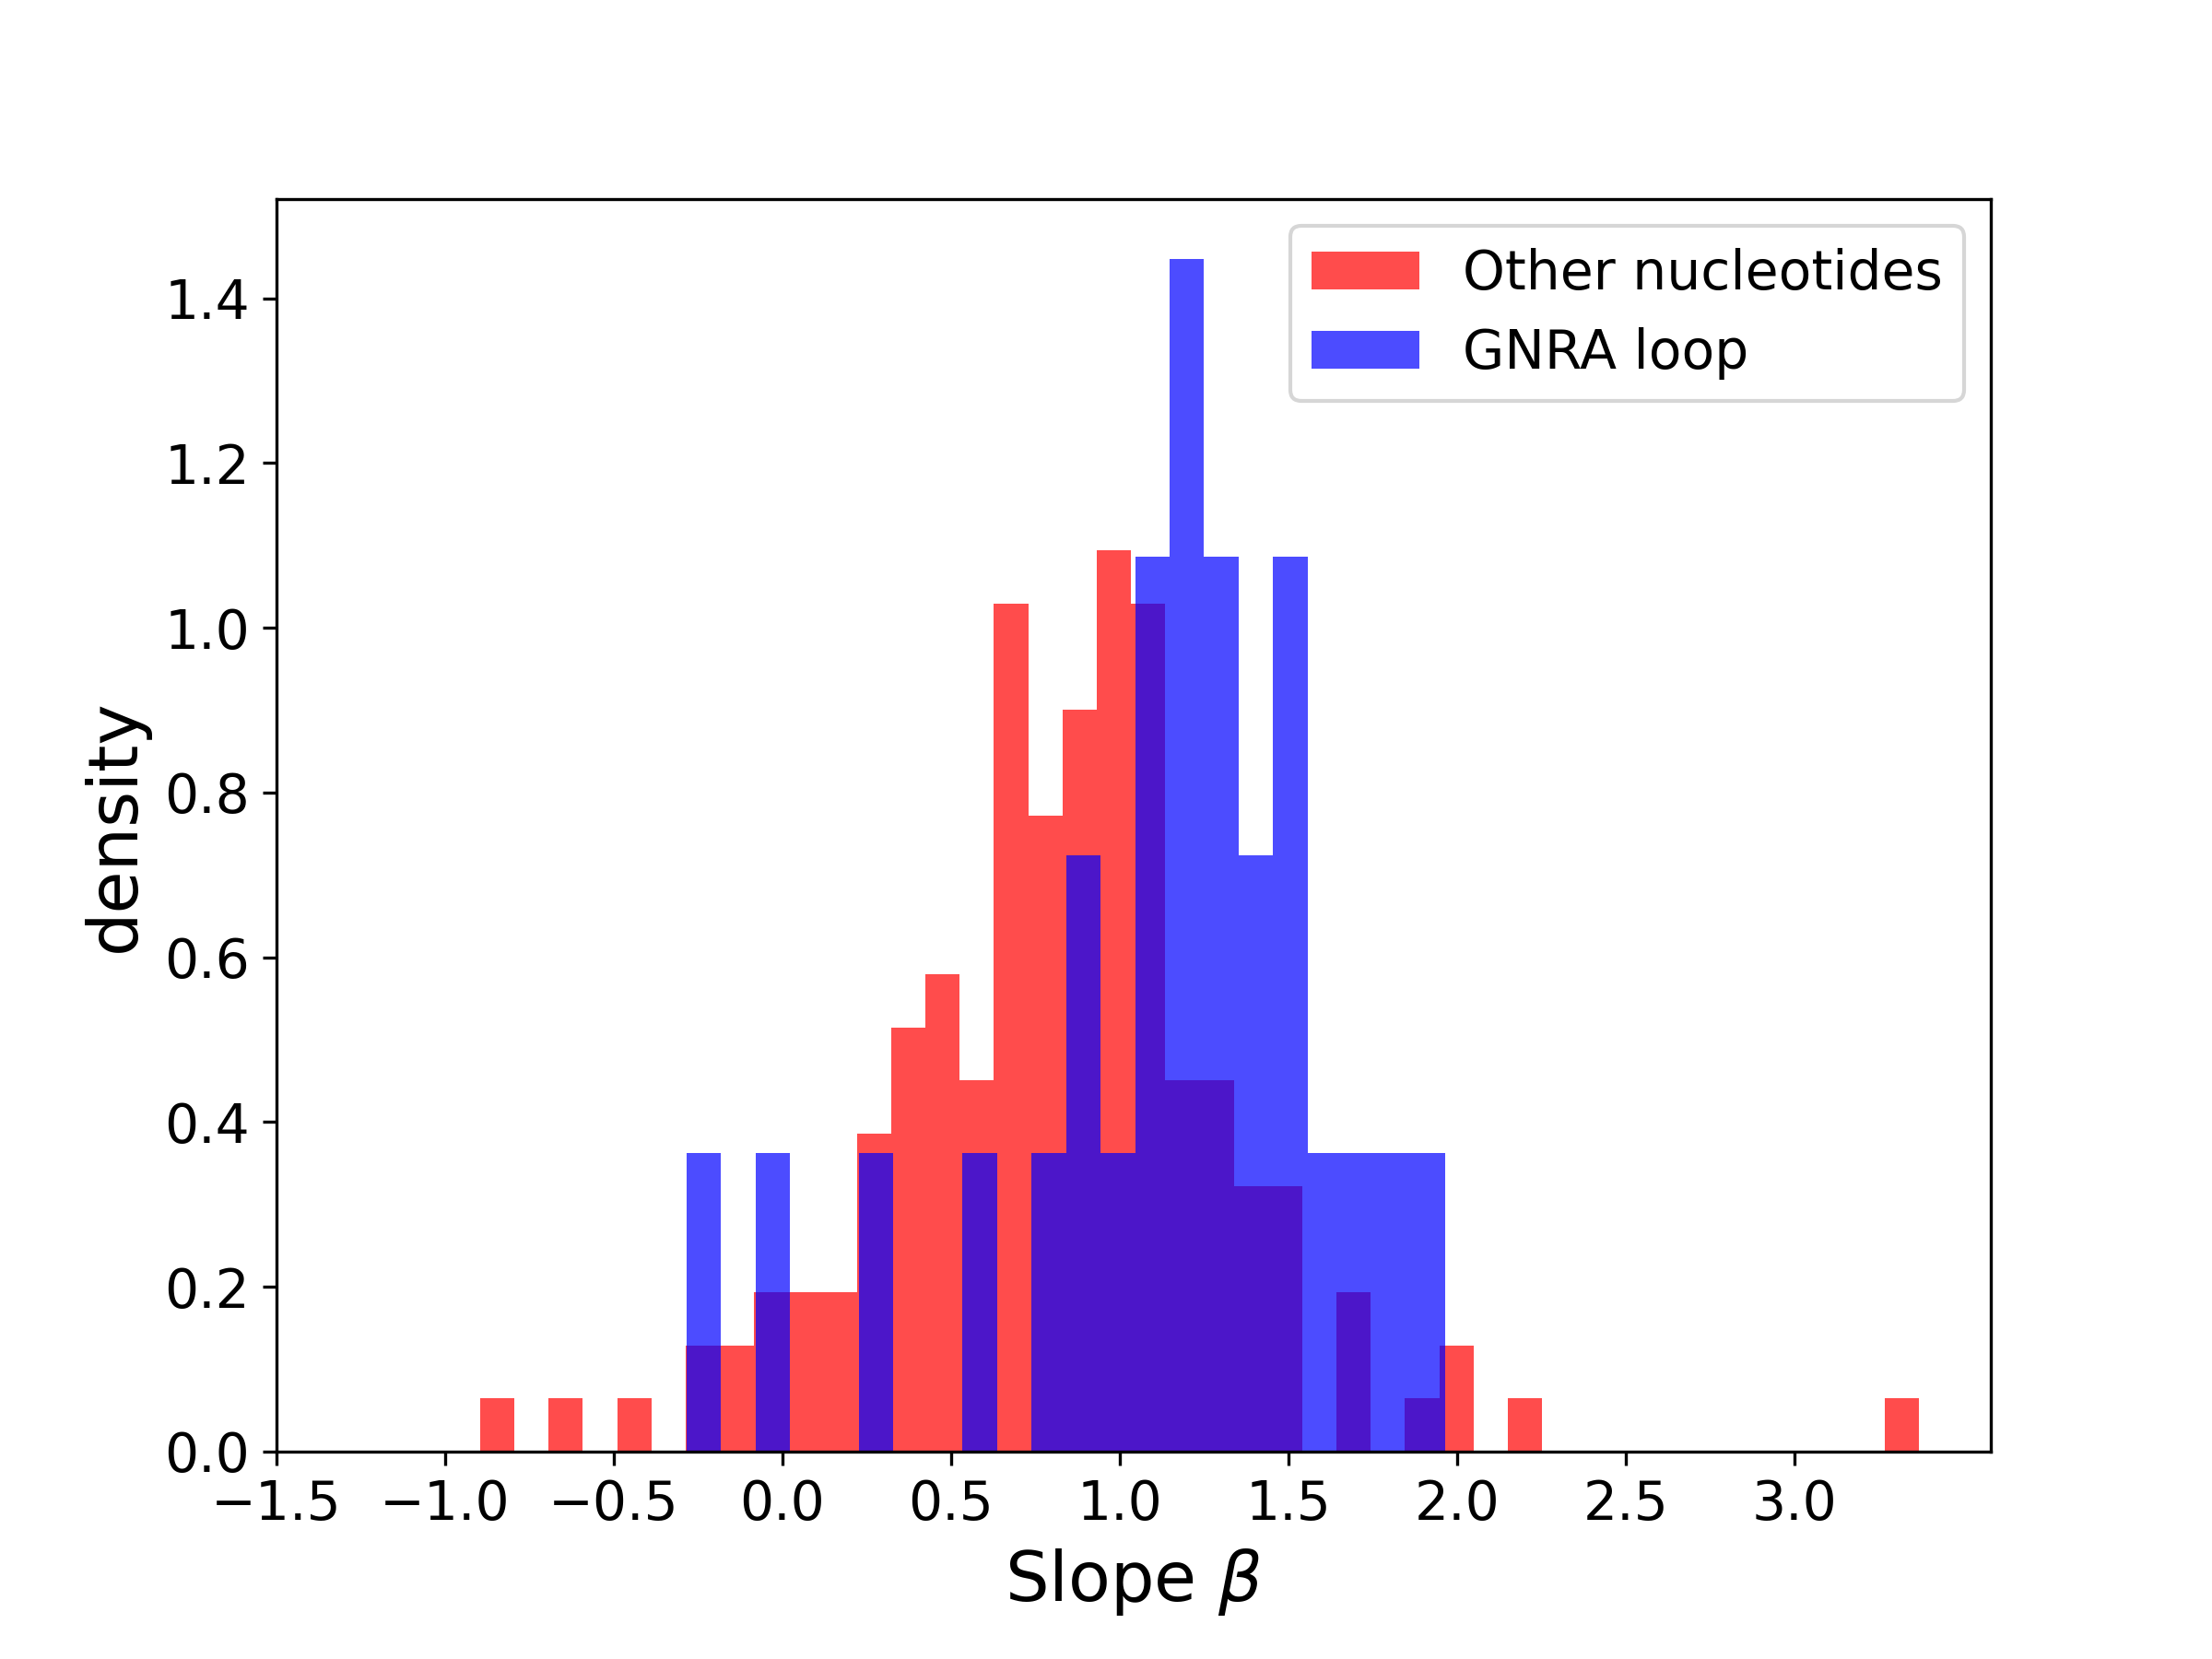
To validate our hypothesis of cooperative effects in the binding process of SHAPE reagents on RNA, we analyzed a limited number of experimental datasets. To the best of our knowledge, chemical probing databases only report results at one concentration (see, e.g., Ref. 61). We thus generated our own dataset. This analysis is limited to a small number of RNA structures and reagent concentrations, but suggests that the effect is experimentally detectable. We considered a set of SHAPE experiments performed at three difference reagent concentration (32, 65 and ) for a set of 5 molecules for which reference crystallographic or NMR structures are available and can be used to identify the position of GNRA tetraloops (2GIS32, 3GAAA loops, 1KXK52, 1 GAAA loop, 1SCL53, 1 GAGA loop, 1CQ554, 1 GGAA loop, and 2GV455, 1GAAA loop). We then performed an analysis equivalent to the one reported above to obtain an exponent associated to each nucleotide. The coefficients for nucleotides located in GNRA loops are systematically larger than the average (Fig. 8) supporting the fact that these nucleotides might be affected by cooperative binding effects.
4 Discussion
In this work, we use molecular dynamics simulations to identify possible cooperative mechanisms in the binding process of SHAPE reagents on RNA. We first develop a method to obtain concentration-dependent averages in the grand-canonical ensemble by combining simulations done with a different number of copies of the reagent. We show how the method works on a lattice model. Finally, we use it to analyze simulations of 1M7 reagents interacting with a typical RNA structural motif.
The introduced method is based on an idea similar to the one used in weighted-histogram analsysis 26, 27, where a maximum likelihood procedure is used to combine statistics obtained simulating a different number of copies of the reagent molecule. We derived and tested our analysis protocol so as to control the chemical potential of a single molecular species. However, the formalism could be easily extended to multiple molecular species, at the price of setting up a multi-dimensional grid of simulations where the number of copies of each species is scanned. With respect to the straightforward comparison of simulations performed at different number of particles, our method has the advantage that it allows to compute properties as smooth functions of the chemical potential and, thus, of the particle concentration.
At variance with methods based on grand-canonical Monte Carlo 21, 22 or position-dependent potentials 23, 24, the introduced procedure only requires analyzing plain MD simulations. This means that any MD code could be used, and that there will be no overhead associated to changing on-the-fly the number of copies of each molecule in the simulation box or to compute thermodynamic forces to control the number of copies in a given region. However, this advantage comes at a price. If the actual concentration of the species is unknown, it might be difficult to set up an appropriate range for the number of copies of molecule to be included in each simulation. Since results will only be reliable for concentrations that have been actually sampled, this might lead to the need to perform further simulations with a different number of copies. However, also in this case, all simulations could be easily combined to maximize the statistical efficiency. Similarly to methods based on position-dependent potentials 23, 24, our approach is based on the approximation that subregions of the simulation cell are sufficiently decoupled. This might limit its applicability in cases where interactions are long ranged, such as electrolyte solutions, unless ion concentration are large enough to provide a significant screening and make interactions effectively short ranged 62. At variance with methods based on position-dependent potentials, however, our procedure allows the region to be selected in the analysis phase. This in principle allows to fine tune its definition a posteriori, without the need to repeat the MD simulations. An advantage of grand-canonical Monte Carlo methods is that they can be used to effectively enhance the conformational sampling of the controlled species, which could appear on both sides of a high free-energy barrier. For instance, this would increase sampling of hidden binding pockets. On the other hand, our method, and methods based on position-dependent potentials, should be explicitly combined with enhanced sampling methods to cross large free-energy barriers 63. Although in this work we only analyzed plain MD simulations, enhanced sampling simulations could be analyzed by considering the bias potential when computing the weighting factors.
The method was then applied to the characterization of the dynamics of an RNA structural motif interacting with SHAPE reagents at various concentrations. Results were obtained by combining 19 independent simulations with a different number of copies of the reagent. Statistical uncertainties were estimated using Bayesian bootstrapping over the 19 independent simulations. Since the simulations were prepared independently of each other, the trajectories can be considered as statistically independent. This procedure allowed us to define confidence intervals for all the examined quantities. We were then able to estimate the concentration-dependent probability with which each nucleotide can be bound to a SHAPE reagent. We also estimated cooperativity effects by analyzing all pairs of nucleotides, showing that pairs of positions located in the RNA tetraloop display a stronger cooperativity. This cooperativity can be explained as a combination of multiple factors, including interaction between copies of the reagent and induced changes in the RNA conformational ensemble. It is worth noting that we didn’t observe any pair of positions with a statistically significant anti-cooperativity. Based on our structural analysis, which shows that reagent binding leads to local RNA destabilization, this is expected. Inter-reagent stacking can also be reasonably expected to lead to cooperative rather than anti-cooperative effects. However, we cannot rule out that anti-cooperative effects might arise in more complex structural motifs where, for instance, physical binding in a position might result in a steric hindrance for binding in a neighboring position, or even to larger conformational changes of the probed RNA.
The observed cooperativity could be directly detected experimentally, by measuring non-linearities in the dependence of the SHAPE reactivity on the reagent concentration. Experimental data collected for this work shows that a systematic effect can be observed where nucleotides located in GNRA tetraloops display a non-linear dependence when compared to the average reactivity, in qualitative agreement with the results of our simulations. Whereas the analyzed set of experimental data is limited, this observation suggests that the effect might be general and could be tested with more systematic experiments performed on a range of reagent concentrations. A technical but important issue that was not considered here is the fact that SHAPE reagents are being inactivated by water, resulting in an effective concentration of active reagents that might be lower than the nominal one. We are not aware of experimental estimates of the concentration of active reagents, and thus we qualitatively used the nominal concentration as a proxy of the effective one. We additionally note that inactivated (hydrolyzed) reagents are negatively charged, and thus are expected to be electrostatically repelled by RNA and less effective than active ones in the crowding effect that is investigated in this work.
An important outcome of this work is that it suggests that different structural motifs might have a different degree of cooperativity. In this sense, more information could be profitably extracted from experiments performed at different reagent concentrations. Many different approaches have been suggested to analyze SHAPE reactivities to improve RNA structure prediction, including the idea of identifying reactivity patterns for known motifs 9 and of combining data obtained with different reagents5, 8. However, we are not aware of any attempt to use concentration-dependent information as it is suggested here. The measurement of concentration-dependent reactivities for a sufficently large number of training RNA systems of known structure is left as a subject for a future work.
David H. Mathews and Karissa Sanbonmatsu are acknowledged for reviewing a very preliminary version of this work, which is available at \urlhttp://hdl.handle.net/20.500.11767/116273, and providing several suggestions.
Derivation of the algorithm with likelihood maximization; relationship between chemical potential and concentration; results on a lattice model; parameters for 1M7; sample initial conformations; structural analysis at various concentrations; effects of grand-canonical reweighting, ionic conditions, and system size.
S1 Likelihood maximization
The likelihood of observing frames from a set of independent simulations, with frames with particles in region and particles in region , is
| (8) |
up to a normalization constant. The normalization coefficients are required to ensure that, for each value of the number of reagent copies
| (9) |
Taking the negative logarithm of the likelihood and adding Lagrangian multipliers to ensure the above normalization requirement yields
| (10) |
The Lagrangian function can be minimized by setting to zero its gradient with respect to the model parameters , , , and to the Lagrangian multipliers . The resulting equations are:
| (11a) | |||
| (11b) | |||
| (11c) | |||
| (11d) | |||
From the equation 11a, we obtain
| (12) |
that we replace in the second term of the equation 11b yielding
| (13) |
We then define: , counting the number of times that, in the whole set of trajectories, a particle was found in region ; , counting the equivalent number for region ; and , the total number of frames accumulated in the trajectory with particles. By substituting Eq. 13 and the definitions of , , and in Equations 11c and 11d we obtain
| (14) | ||||
These equations can be solved iteratively through the algorithm reported in Alg. S1.
Noticeably, line 9 to 12 provide a normalization of and such that and . In this way the free energy of the state with no particle at all is set to zero, as well as the free-energy cost for adding the first particle to region . Since the chemical potential is defined up to a constant, and are invariant with respect to scaling by an arbitrary factor each, and to scaling each -th component of by the -th power of the same factor . By choosing the normalization is fixed and the scaling invariance is removed. This scaling has no impact on the final weights, but can affect the relationship between the chemical potential and the particle concentrations and can be used to assign a physical interpretation to the obtained canonical partition functions.
S2 Fixing reagent concentration through the chemical potential
Once the ML estimates of and are computed, estimates of grand-canonical averages of any function of the number of particles in either region or can be computed as
| (15) |
where is the chemical potential. It is thus straightforward to compute the grand-canonical average of the number of reagent copies in both regions by replacing in the equation above. Since we want to compute averages of quantites such as affinity and cooperativity at varying reagent concentration, we first have to identify the values of corresponding to the desired concentrations, using the algorithm reported in Alg. S2.
S3 Lattice model
The introduced methodology for grand-canonical reweighting of molecular dynamics presented in the Methods section in the main text is first tested on a lattice model. We consider a lattice space divided in two regions, and . Region contains sites and region contains sites. Sites are then populated with a varying number of particles that interact with each other only through mutual exclusion, so that a site cannot be occupied by more than one particle. We first consider two possible scenarios: a purely entropic systems, in which all the sites are equivalent and the free energy depends only on the entropic contribution of the number of possible combinations of up to particles occupying the sites; and a system in which the presence of a stabilizing site in the lattice region brings in an additional energetic contribution to the free energy. In both cases, the partition functions of region and of region can be computed analitically. These functions are normalized as explained in Section S1, that is by setting , and , so that the zero of free energy corresponds to the empty lattice and the free-energy cost for insertion of the first particle in region B is set to zero. The normalization is accomplished by scaling each by a factor , where .
In the purely entropic system, the two partition functions are related to the number of different combinations in which particles can be distributed in the sites:
| (16) |
If the number of sites in and is equal, then populating a site in has the same free-energy cost of populating one in .
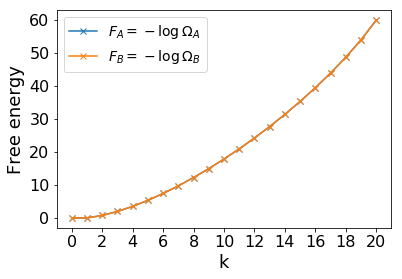
The free-energy contributions of the two regions for numbers of sites is shown in Fig. S1a.
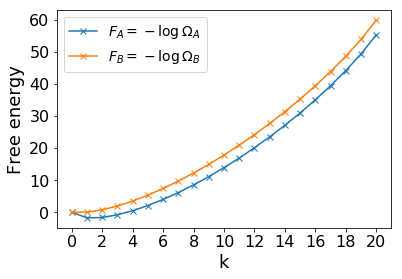
In the second scenario, regions and differ for the presence of a single stabilizing site in , for which the probability to be populated is 100 times larger than the other sites, which corresponds to a stabilization of .
| (17) |
As shown in Fig. S1b, when at least one particle is present in the lattice, the presence of the stabilizing site systematically contributes with a free-energy gain (). Since the second case is more representative of a molecular system where particles can interact with a a solute molecule in region , we consider only this case for the following tests, but similar results could be obtained for the purely entropic system.
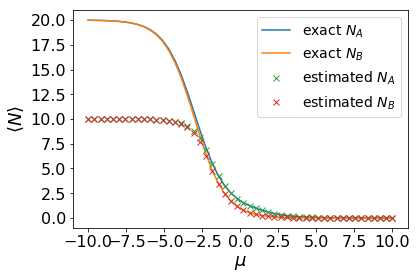
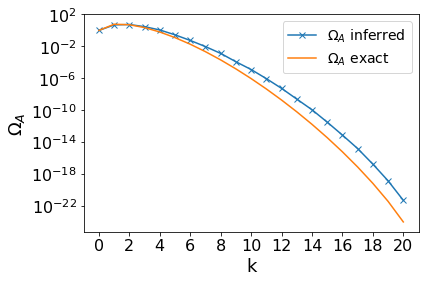
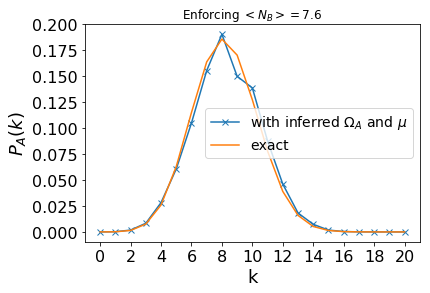
We first address the limitations of the method arising from the fact that a finite is used. We assume to be able to collect the information about the probability of observing a given number of particles in region or from a set of simulations performed with a fixed number of particles ranging from 1 to . These probabilities are and for regions and , respectively. These probabilities, which correspond to the histogram that one could accumulate in a set of infinitely long (perfect sampling) simulations at fixed number of particles, are then used to infer estimates for and using Algorithm S1. Figure S2 shows the exact and inferred for the two regions. The inference is exact when . However, since we are in a regime where none of the analyzed simulations has more than particles, the method has no way to infer the partition function of .


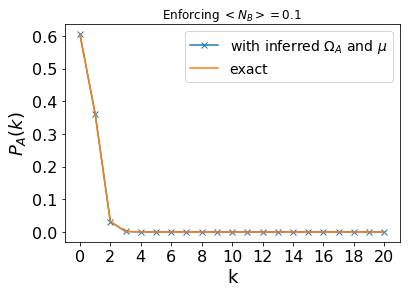
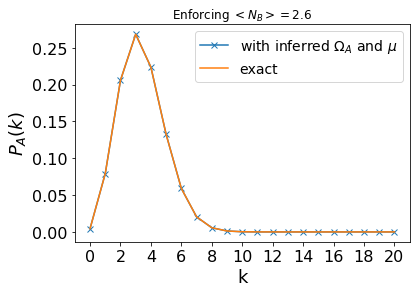
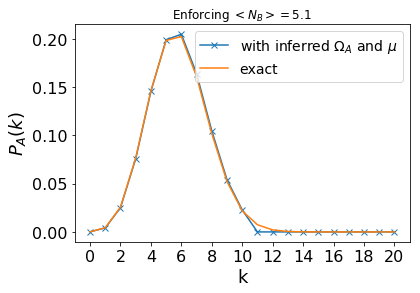
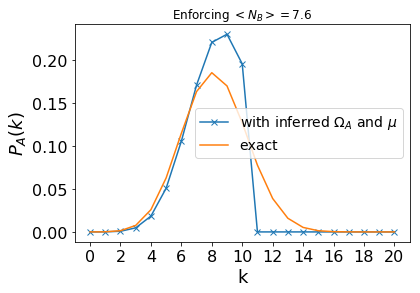
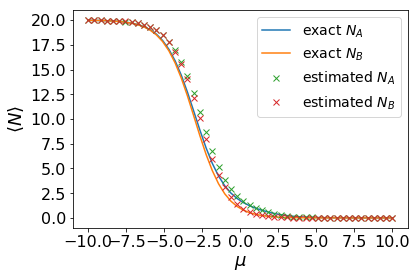
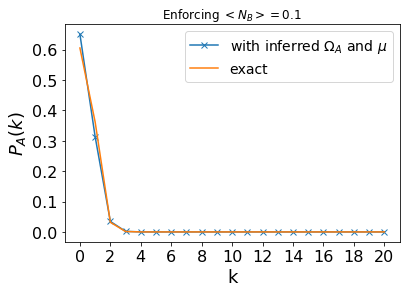
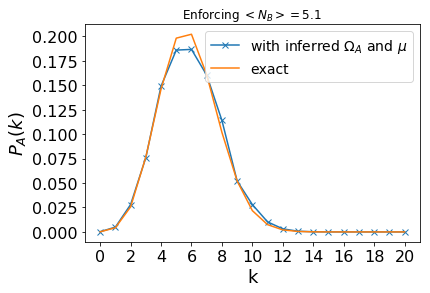
We then use the inferred partition functions to compute the distribution of particles in region at fixed concentration of particles in region . This requires to first estimate the chemical potential associated to the concentration in region using Algorithm S2, and then computing the probability to observe particles in region using the grand-canonical weights at that chemical potential. Figure S3a shows the estimated average number of particles in each region at fixed chemical potential. The inferred number of particles agrees very well with the analytical solution for values of corresponding to a number of particles smaller than . However, at a chemical potential low enough to lead to more than 10 particles per region, the inference is incorrect and predicts only 10 particles per region at most. The inferred partition functions are then used to compute the distribution of the number of particles in region for a list of 5 different concentrations, which correspond to a growing average number of particles in region (Figure S3, panels b–f). When the concentration corresponds to an average number of particles in significantly smaller than (panels b–d), the agreement between the inferred and exact solution is virtually perfect. The limitations of the method are clear in cases where the exact distribution would imply a non neglibigle probability to observe more than 10 particles in region (panel e). Panel f represents the extreme case, where the inferred chemical potential is and the inferred distribution only allows 10 particles in region . This test highlights that results can only be reweighted to concentrations that are compatible with the number of particles included in the analyzed simulations.


Next, we address the issue of obtaining histograms using a finite number of samples. To this aim, instead of assuming to have access to the exact and , we estimate them by drawing samples from the exact probability distributions. In other words, we consider simulations accumulating 100 independent samples. To remove the limitation associated to the finite value of discussed above, we here consider . We first show the inferred partition functions (Figure S4a and b). Since the number of simulated particles is sufficient to cover all cases, no discontinuity is observed. However, the inferred does not match anymore the exact reference. To have an idea of how much this error on the inference of would affect the final result, we use the inferred to estimate the dependence of the average number of particles on (Figure S4c). The impact is minimal now, since a sufficient number of particles have been included. The resulting estimates for the population of region at different particle concentrations are only slightly affected (panels d–h). Clearly, this effect would be larger if the number of samples per simulation was chosen to be smaller.
S4 Parametrization of 1M7
The partial charges of 1-methyl-7-nitroisatoic anhydride (1M7) computed through RESP as described in the main text, are reported in Table S1
| Atom | Charge (e) |
|---|---|
| C1 | 0.013677 |
| H1 | 0.165938 |
| C2 | -0.301276 |
| H2 | 0.214747 |
| C3 | 0.213481 |
| N2 | 0.680265 |
| O4 | -0.418660 |
| O5 | -0.418660 |
| C4 | -0.403042 |
| H3 | 0.221441 |
| C5 | 0.431676 |
| N1 | -0.308580 |
| C8 | 0.913611 |
| O2 | -0.562770 |
| C9 | -0.336386 |
| H4 | 0.158142 |
| H5 | 0.158142 |
| H6 | 0.158142 |
| C6 | -0.413908 |
| C7 | 0.925472 |
| O3 | -0.538891 |
| O1 | -0.552561 |
S5 Initial conformations
Examples of the initial conformation for simulations with and are reported in Fig. S5.
S6 Structural variability at varying reagent concentration
We here report an analysis similar to the one reported in Figs. 5 and 6. Here, no assumption is done on reagent binding.


S7 Effect of grand-canonical reweighting
Here we compare results obtained estimating the reactivities from simulations at constant number of particles with reactivities obtained from the reweighting of the concatenated trajectories according to the grand-canonical ensemble. Figure S7 shows that results are qualitatively comparable in a range where the number of reagent copies has been chosen consistently with the enforced reagent concentration. However, an important advantage of the grand-canonical reweighting procedure is that the behavior as a function of concentration is much smoother than the behavior as a function of the number of reagent copies. This is expected, since individual trajectories are subject to statistical errors. The possibility to compute weighted averages from a single set of trajectories thus makes the estimation of concentration-dependent quantities more statistically robust.
S8 Effect of ionic conditions
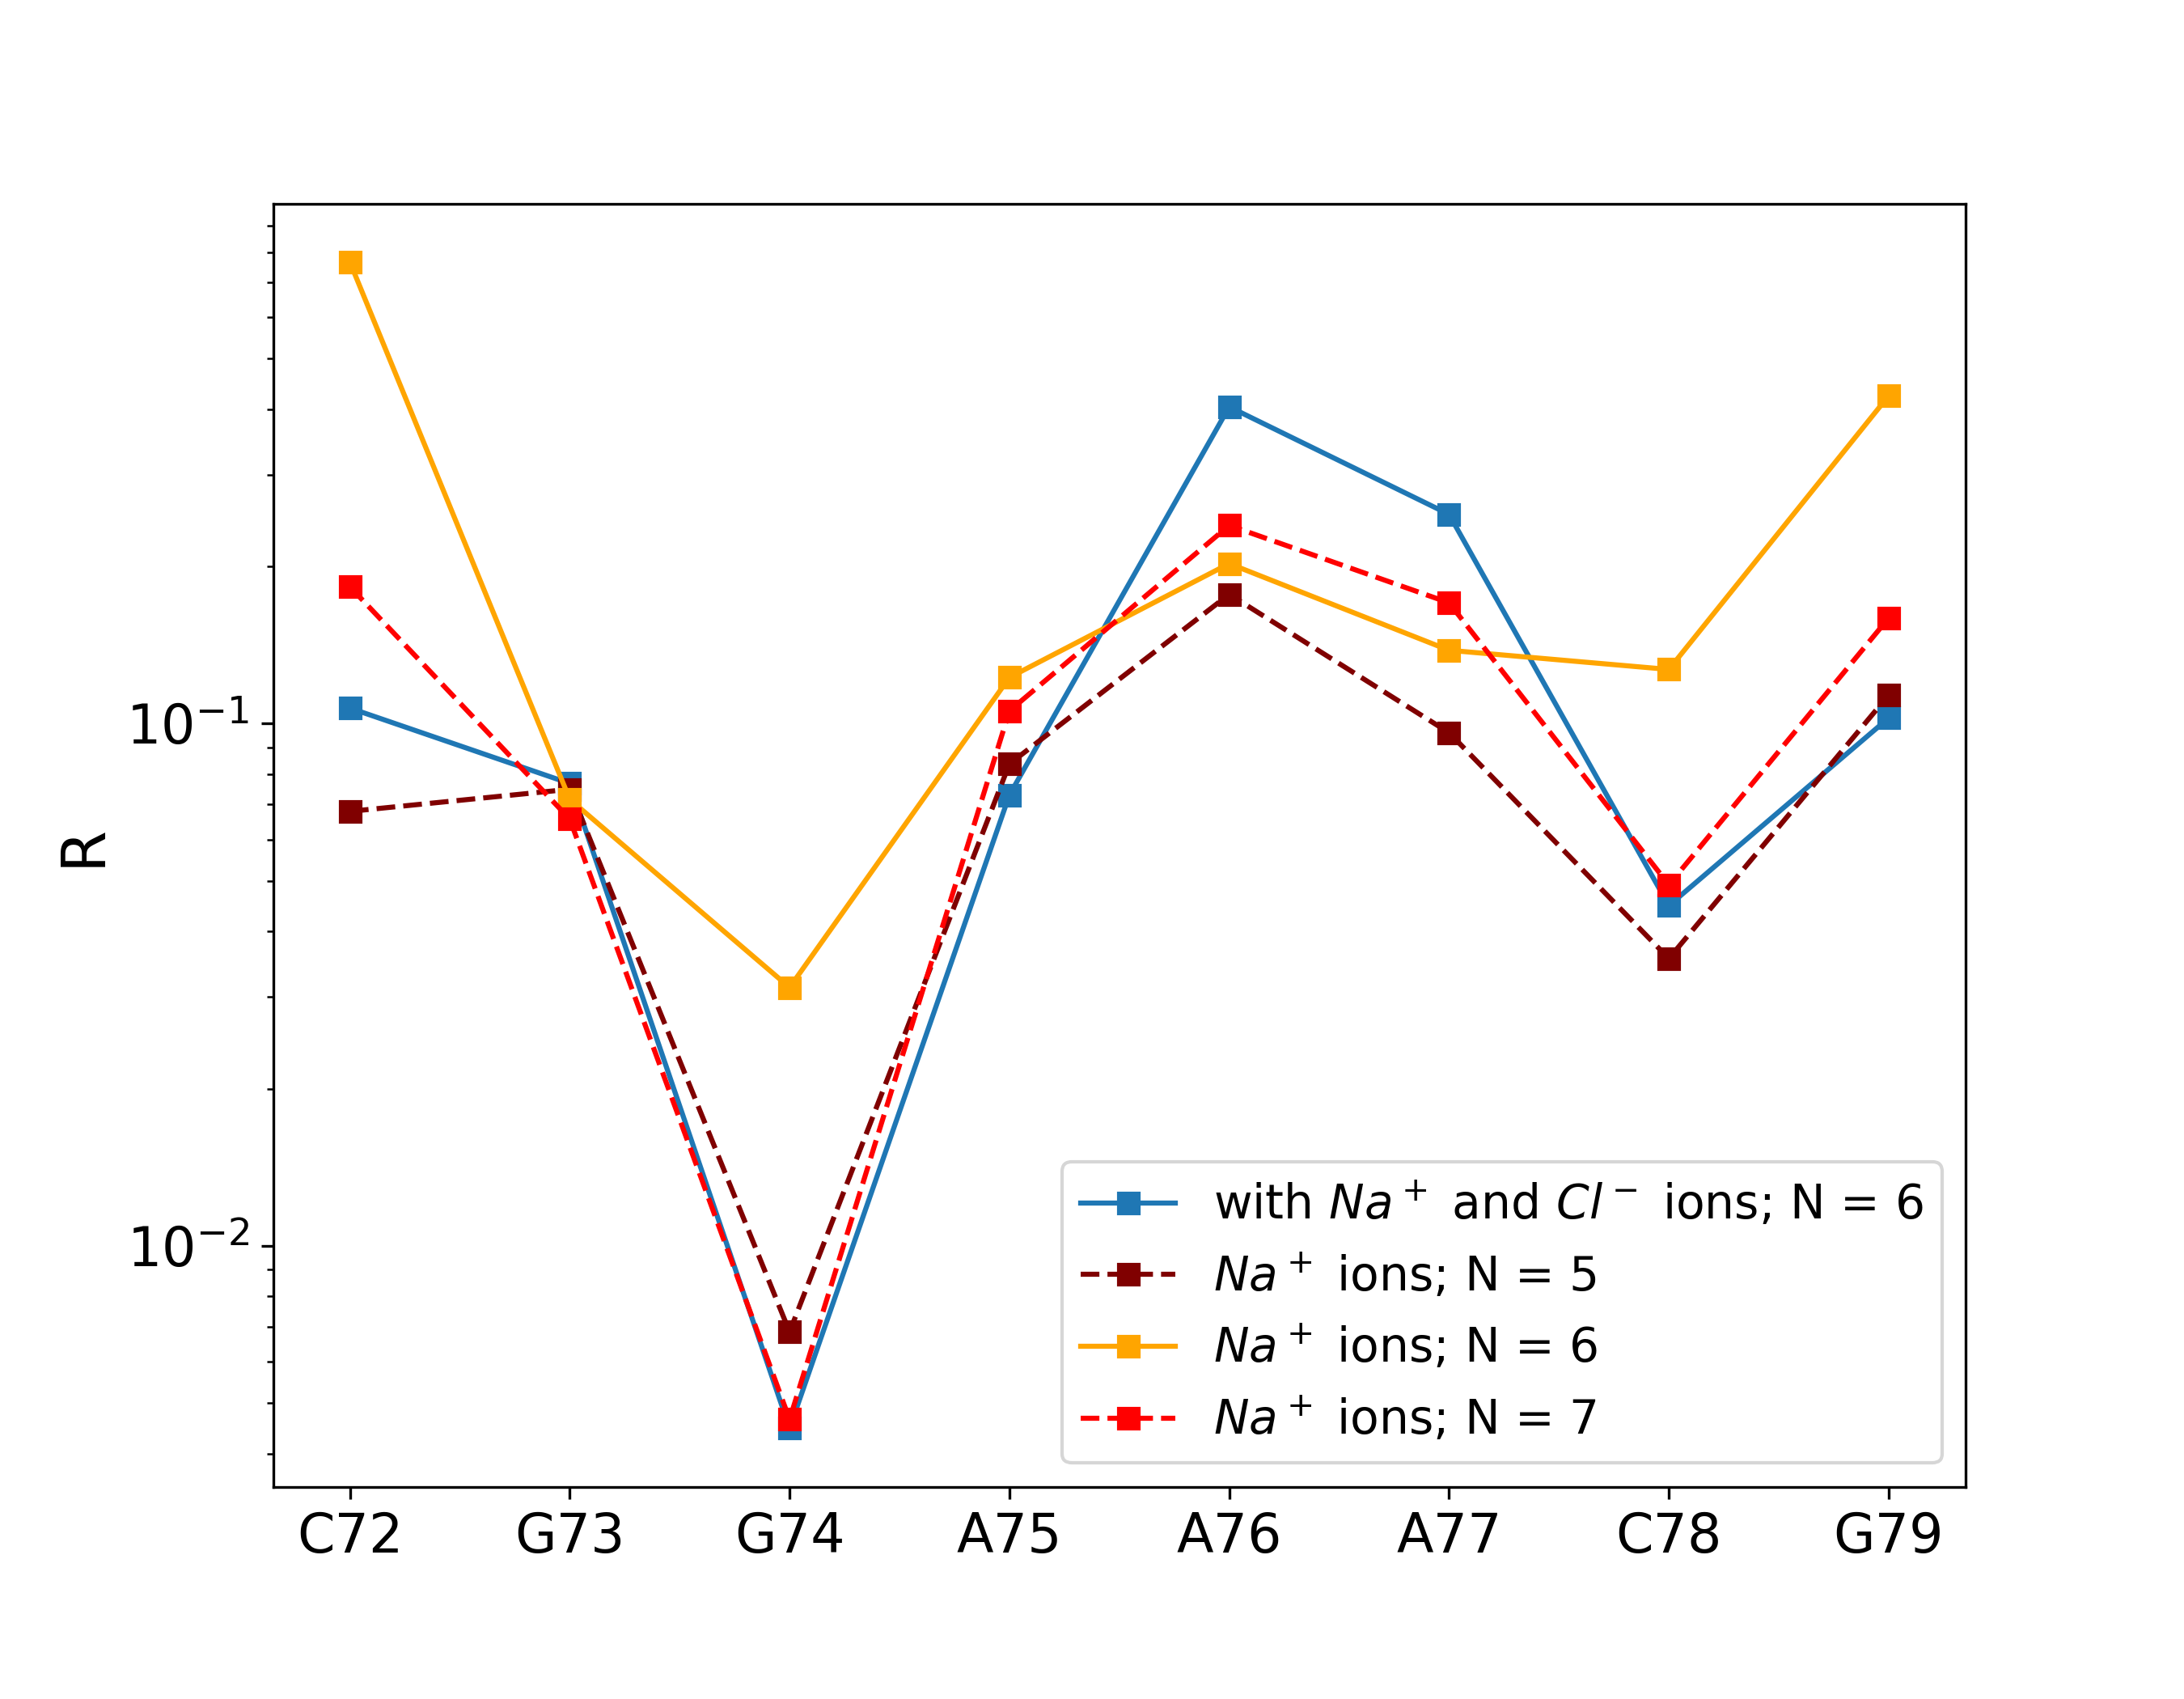
As a control of the possible effects of different ionic conditions on the cooperative binding dynamics of RNA with 1M7, we generated a trajectory at number of reagent copies fixed to a representative value of , in which the simulation environment contained additional 26 Cl-/Na+ ion pairs, corresponding to a nominal concentration of , in such a way that the total charge of the system was preserved. As shown in Fig. S8, changes in the reactivity profile obtained from the control simulation were of the order of differences associated with small () variations of the number of reagent copies. This result is expected since SHAPE reagents are neutral, hence their distribution around RNA should not be highly affected by the effective electrostatic screening.
S9 Effect of helix length
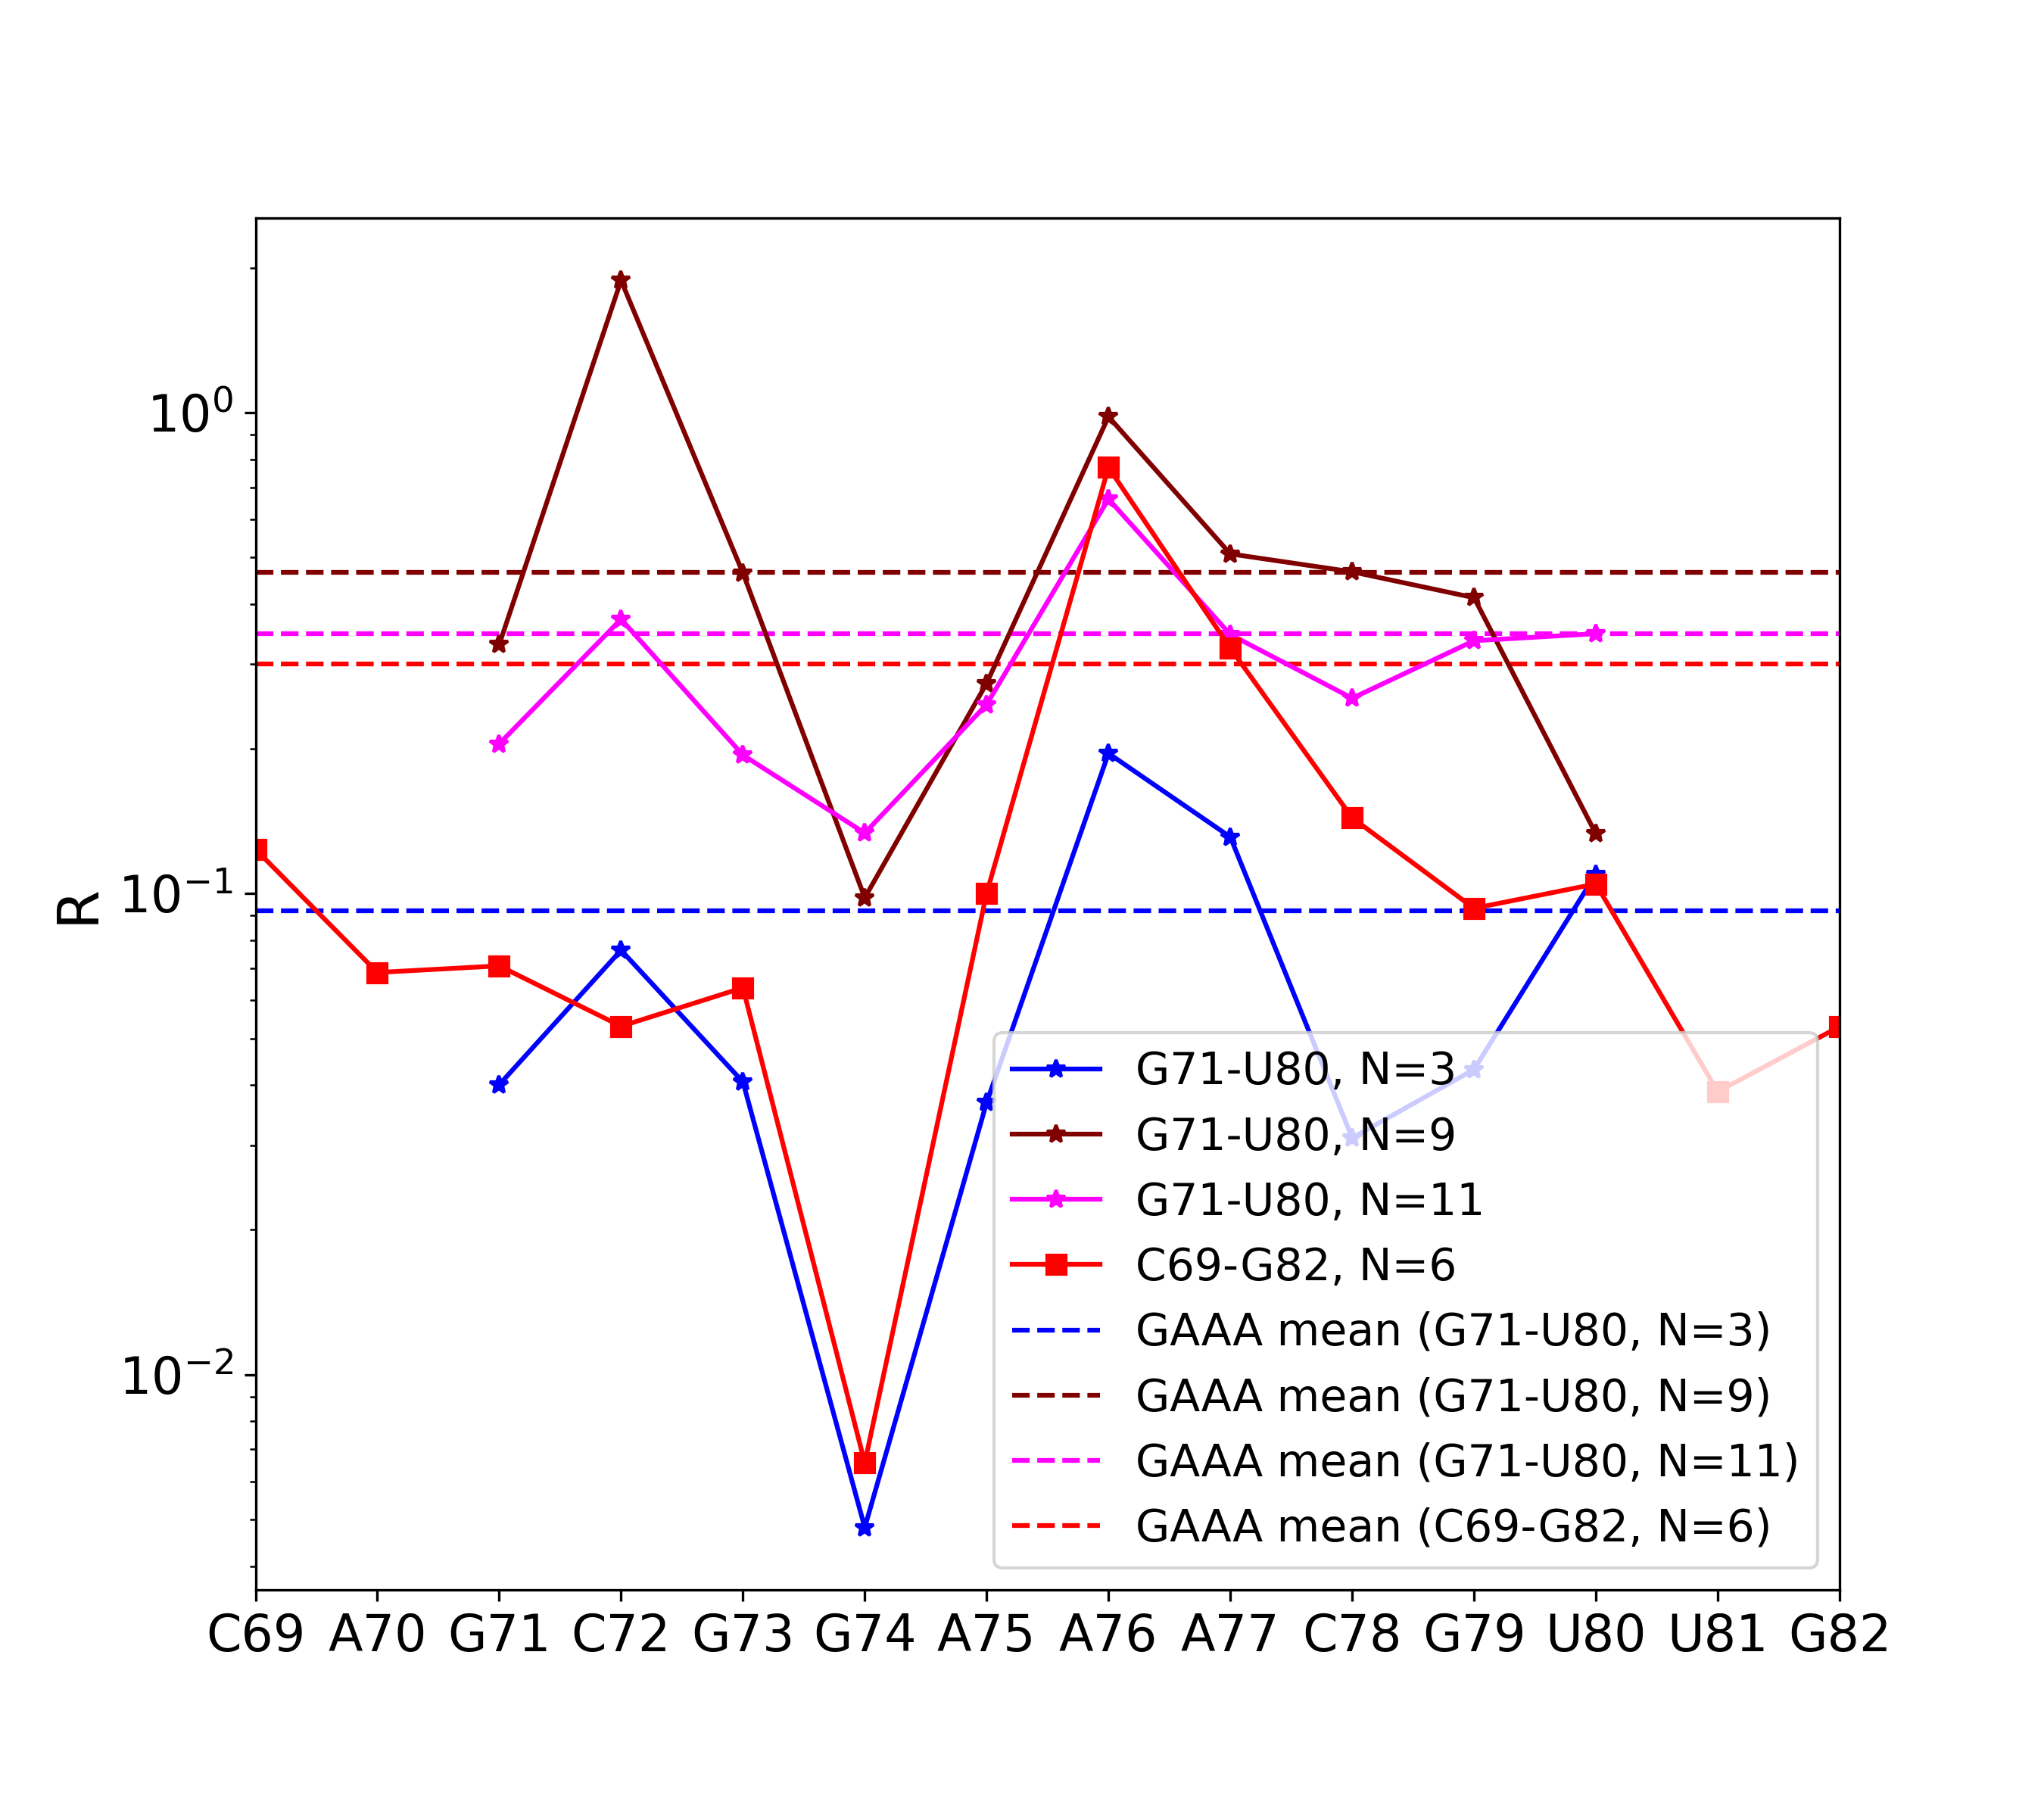
As a control on the possible bias introduced by the specific choice of the length of the simulated helix, we generated a trajectory with an extended portion of the SAM-I riboswitch gcgGAAAcgu tetraloop, namely ranging from C69 to G82 (two additional base-pairs C69-G82 and A70-U81), fixing the number of reagent copies to the representative value . We thus compared the reactivity profile computed from this control simulation with those reported in our main study. As shown in Fig. S9, the reactivity profile of the longer helix was consistent with the fluctuactions associated with the varying number of reagent copies when simulating the shorter helix, as well as the average reactivity of nucleotides in the loop.
References
- Weeks 2010 Weeks, K. M. Advances in RNA structure analysis by chemical probing. Curr. Opin. Struct. Biol. 2010, 20, 295–304
- Merino et al. 2005 Merino, E. J.; Wilkinson, K. A.; Coughlan, J. L.; Weeks, K. M. RNA structure analysis at single nucleotide resolution by selective 2′-hydroxyl acylation and primer extension (SHAPE). J. Am. Chem. Soc. 2005, 127, 4223–4231
- Weeks and Mauger 2011 Weeks, K. M.; Mauger, D. M. Exploring RNA structural codes with SHAPE chemistry. Acc. Chem. Res. 2011, 44, 1280–1291
- Deigan et al. 2009 Deigan, K. E.; Li, T. W.; Mathews, D. H.; Weeks, K. M. Accurate SHAPE-directed RNA structure determination. Proc. Natl. Acad. Sci. U.S.A. 2009, 106, 97–102
- Rice et al. 2014 Rice, G. M.; Leonard, C. W.; Weeks, K. M. RNA secondary structure modeling at consistent high accuracy using differential SHAPE. RNA 2014, 20, 846–854
- Lorenz et al. 2016 Lorenz, R.; Luntzer, D.; Hofacker, I. L.; Stadler, P. F.; Wolfinger, M. T. SHAPE directed RNA folding. Bioinformatics 2016, 32, 145–147
- Calonaci et al. 2020 Calonaci, N.; Jones, A.; Cuturello, F.; Sattler, M.; Bussi, G. Machine learning a model for RNA structure prediction. NAR Genom. Bioinform. 2020, 2, lqaa090
- Saaidi et al. 2020 Saaidi, A.; Allouche, D.; Regnier, M.; Sargueil, B.; Ponty, Y. IPANEMAP: integrative probing analysis of nucleic acids empowered by multiple accessibility profiles. Nucleic Acids Res. 2020, 48, 8276–8289
- Cao and Xue 2021 Cao, J.; Xue, Y. Characteristic chemical probing patterns of loop motifs improve prediction accuracy of RNA secondary structures. Nucleic Acids Res. 2021, 49, 4294–4307
- De Bisschop et al. 2021 De Bisschop, G.; Allouche, D.; Frezza, E.; Masquida, B.; Ponty, Y.; Will, S.; Sargueil, B. Progress Toward SHAPE Constrained Computational Prediction of Tertiary Interactions in RNA Structure. Non-coding RNA 2021, 7, 71
- Aviran et al. 2011 Aviran, S.; Trapnell, C.; Lucks, J. B.; Mortimer, S. A.; Luo, S.; Schroth, G. P.; Doudna, J. A.; Arkin, A. P.; Pachter, L. Modeling and automation of sequencing-based characterization of RNA structure. Proc. Natl. Acad. Sci. U.S.A. 2011, 108, 11069–11074
- Nakano et al. 2014 Nakano, S.-i.; Miyoshi, D.; Sugimoto, N. Effects of molecular crowding on the structures, interactions, and functions of nucleic acids. Chem. Rev. 2014, 114, 2733–2758
- Šponer et al. 2018 Šponer, J.; Bussi, G.; Krepl, M.; Banáš, P.; Bottaro, S.; Cunha, R. A.; Gil-Ley, A.; Pinamonti, G.; Poblete, S.; Jurečka, P.; Walter, N. G.; Otyepka, M. RNA structural dynamics as captured by molecular simulations: a comprehensive overview. Chem. Rev. 2018, 118, 4177–4338
- Pinamonti et al. 2015 Pinamonti, G.; Bottaro, S.; Micheletti, C.; Bussi, G. Elastic network models for RNA: a comparative assessment with molecular dynamics and SHAPE experiments. Nucleic Acids Res. 2015, 43, 7260–7269
- Hurst et al. 2018 Hurst, T.; Xu, X.; Zhao, P.; Chen, S.-J. Quantitative understanding of SHAPE mechanism from RNA structure and dynamics analysis. J. Phys. Chem. B 2018, 122, 4771–4783
- Mlýnský and Bussi 2018 Mlýnský, V.; Bussi, G. Molecular dynamics simulations reveal an interplay between SHAPE reagent binding and RNA flexibility. J. Phys. Chem. Lett. 2018, 9, 313–318
- Frezza et al. 2019 Frezza, E.; Courban, A.; Allouche, D.; Sargueil, B.; Pasquali, S. The interplay between molecular flexibility and RNA chemical probing reactivities analyzed at the nucleotide level via an extensive molecular dynamics study. Methods 2019, 162, 108–127
- Hurst and Chen 2021 Hurst, T.; Chen, S.-J. Sieving RNA 3D Structures with SHAPE and Evaluating Mechanisms Driving Sequence-Dependent Reactivity Bias. J. Phys. Chem. B 2021, 125, 1156–1166
- Frenkel and Smit 2002 Frenkel, D.; Smit, B. Understanding Molecular Simulation, 2nd ed.; Academic Press: London, 2002
- Papadopoulou et al. 1993 Papadopoulou, A.; Becker, E. D.; Lupkowski, M.; van Swol, F. Molecular dynamics and Monte Carlo simulations in the grand canonical ensemble: Local versus global control. J. Chem. Phys. 1993, 98, 4897–4908
- Lakkaraju et al. 2014 Lakkaraju, S. K.; Raman, E. P.; Yu, W.; MacKerell Jr, A. D. Sampling of organic solutes in aqueous and heterogeneous environments using oscillating excess chemical potentials in grand canonical-like Monte Carlo-molecular dynamics simulations. J. Chem. Theory Comput. 2014, 10, 2281–2290
- Melling et al. 2022 Melling, O.; Samways, M.; Ge, Y.; Mobley, D.; Essex, J. Enhanced Grand Canonical Sampling of Occluded Water Sites Using Nonequilibrium Candidate Monte Carlo. ChemRxiv 2022, https://doi.org/10.26434/chemrxiv-2022-7w90m
- Wang et al. 2013 Wang, H.; Hartmann, C.; Schütte, C.; Delle Site, L. Grand-canonical-like molecular-dynamics simulations by using an adaptive-resolution technique. Phys. Rev. X 2013, 3, 011018
- Perego et al. 2015 Perego, C.; Salvalaglio, M.; Parrinello, M. Molecular dynamics simulations of solutions at constant chemical potential. J. Chem. Phys. 2015, 142, 144113
- Tribello et al. 2014 Tribello, G. A.; Bonomi, M.; Branduardi, D.; Camilloni, C.; Bussi, G. PLUMED 2: New feathers for an old bird. Comput. Phys. Commun. 2014, 185, 604–613
- Ferrenberg and Swendsen 1989 Ferrenberg, A. M.; Swendsen, R. H. Optimized Monte Carlo data analysis. Phys. Rev. Lett. 1989, 63, 1195
- Kumar et al. 1992 Kumar, S.; Rosenberg, J. M.; Bouzida, D.; Swendsen, R. H.; Kollman, P. A. The weighted histogram analysis method for free-energy calculations on biomolecules. I. The method. J. Comput. Chem. 1992, 13, 1011–1021
- Shirts and Chodera 2008 Shirts, M. R.; Chodera, J. D. Statistically optimal analysis of samples from multiple equilibrium states. J. Chem. Phys. 2008, 129, 124105
- Heus and Pardi 1991 Heus, H. A.; Pardi, A. Structural features that give rise to the unusual stability of RNA hairpins containing GNRA loops. Science 1991, 253, 191–194
- DePaul et al. 2010 DePaul, A. J.; Thompson, E. J.; Patel, S. S.; Haldeman, K.; Sorin, E. J. Equilibrium conformational dynamics in an RNA tetraloop from massively parallel molecular dynamics. Nucleic Acids Res. 2010, 38, 4856–4867
- Hall 2015 Hall, K. B. Mighty tiny. RNA 2015, 21, 630–631
- Montange and Batey 2006 Montange, R. K.; Batey, R. T. Structure of the S-adenosylmethionine riboswitch regulatory mRNA element. Nature 2006, 441, 1172–1175
- Cornell et al. 1995 Cornell, W. D.; Cieplak, P.; Bayly, C. I.; Gould, I. R.; Merz, K. M.; Ferguson, D. M.; Spellmeyer, D. C.; Fox, T.; Caldwell, J. W.; Kollman, P. A. A second generation force field for the simulation of proteins, nucleic acids, and organic molecules. J. Am. Chem. Soc. 1995, 117, 5179–5197
- Pérez et al. 2007 Pérez, A.; Marchán, I.; Svozil, D.; Šponer, J.; Cheatham III, T. E.; Laughton, C. A.; Orozco, M. Refinement of the AMBER force field for nucleic acids: improving the description of / conformers. Biophys. J. 2007, 92, 3817–3829
- Zgarbová et al. 2011 Zgarbová, M.; Otyepka, M.; Šponer, J.; Mládek, A.; Banáš, P.; Cheatham, T. E.; Jurečka, P. Refinement of the Cornell et al. nucleic acids force field based on reference quantum chemical calculations of glycosidic torsion profiles. J. Chem. Theory Comput. 2011, 7, 2886–2902
- Mortimer and Weeks 2007 Mortimer, S. A.; Weeks, K. M. A Fast-Acting Reagent for Accurate Analysis of RNA Secondary and Tertiary Structure by SHAPE Chemistry. J. Am. Chem. Soc. 2007, 129, 4144–4145
- Wang et al. 2004 Wang, J.; Wolf, R. M.; Caldwell, J. W.; Kollman, P. A.; Case, D. A. Development and testing of a general AMBER force field. J. Comput. Chem. 2004, 25, 1157–1174
- Wang et al. 2006 Wang, J.; Wang, W.; Kollman, P. A.; Case, D. A. Automatic atom type and bond type perception in molecular mechanical calculations. J. Mol. Graph. Model. 2006, 25, 247–260
- Case et al. 2005 Case, D. A.; Cheatham III, T. E.; Darden, T.; Gohlke, H.; Luo, R.; Merz Jr., K. M.; Onufriev, A.; Simmerling, C.; Wang, B.; Woods, R. J. The Amber biomolecular simulation programs. J. Comput. Chem. 2005, 26, 1668–1688
- 40 Schrödinger, LLC, New York, NY, Schrödinger Release 2019-4: Maestro
- Cornell et al. 1993 Cornell, W. D.; Cieplak, P.; Bayly, C. I.; Kollman, P. A. Application of RESP charges to calculate conformational energies, hydrogen bond energies, and free energies of solvation. J. Am. Chem. Soc. 1993, 115, 9620–9631
- Abraham et al. 2015 Abraham, M. J.; Murtola, T.; Schulz, R.; Pàll, S.; Smith, J. C.; Hess, B.; Lindahl, E. GROMACS: High performance molecular simulations through multi-level parallelism from laptops to supercomputers. SoftwareX 2015, 1-2, 19–25
- Bernardi et al. 2019 Bernardi, A.; Faller, R.; Reith, D.; Kirschner, K. N. ACPYPE update for nonuniform 1–4 scale factors: Conversion of the GLYCAM06 force field from AMBER to GROMACS. SoftwareX 2019, 10, 100241
- Izadi et al. 2014 Izadi, S.; Anandakrishnan, R.; Onufriev, A. V. Building Water Models: A Different Approach. J. Phys. Chem. Lett. 2014, 5, 3863–3871
- Joung and Cheatham III 2008 Joung, I. S.; Cheatham III, T. E. Determination of alkali and halide monovalent ion parameters for use in explicitly solvated biomolecular simulations. J. Phys. Chem. B 2008, 112, 9020–9041
- Parrinello and Rahman 1981 Parrinello, M.; Rahman, A. Polymorphic transitions in single crystals: A new molecular dynamics method. J. Appl. Phys. 1981, 52, 7182–7190
- Essmann et al. 1995 Essmann, U.; Perera, L.; Berkowitz, M. L.; Darden, T.; Lee, H.; Pedersen, L. G. A smooth particle mesh Ewald method. J. Chem. Phys. 1995, 103, 8577–8593
- Bussi et al. 2007 Bussi, G.; Donadio, D.; Parrinello, M. Canonical sampling through velocity rescaling. J. Chem. Phys. 2007, 126, 014101
- Hess et al. 1997 Hess, B.; Bekker, H.; Berendsen, H. J. C.; Fraaije, J. G. E. M. LINCS: A linear constraint solver for molecular simulations. J. Comput. Chem. 1997, 18, 1463–1472
- Rubin 1981 Rubin, D. B. The Bayesian bootstrap. Ann. Stat. 1981, 9, 130–134
- Flyvbjerg and Petersen 1989 Flyvbjerg, H.; Petersen, H. G. Error estimates on averages of correlated data. J. Chem. Phys. 1989, 91, 461–466
- Zhang and Doudna 2002 Zhang, L.; Doudna, J. A. Structural insights into group II intron catalysis and branch-site selection. Science 2002, 295, 2084–2088
- Szewczak et al. 1993 Szewczak, A. A.; Moore, P. B.; Chang, Y.; Wool, I. G. The conformation of the sarcin/ricin loop from 28S ribosomal RNA. Proc. Natl. Acad. Sci. U.S.A. 1993, 90, 9581–9585
- Schmitz et al. 1999 Schmitz, U.; Behrens, S.; Freymann, D. M.; Keenan, R. J.; Lukavsky, P.; Walter, P.; James, T. L. Structure of the phylogenetically most conserved domain of SRP RNA. RNA 1999, 5, 1419–1429
- Zoll et al. 2007 Zoll, J.; Tessari, M.; Van Kuppeveld, F. J.; Melchers, W. J.; Heus, H. A. Breaking pseudo-twofold symmetry in the poliovirus 3’–UTR Y–stem by restoring Watson–Crick base pairs. RNA 2007, 13, 781–792
- Wilkinson et al. 2006 Wilkinson, K. A.; Merino, E. J.; Weeks, K. M. Selective 2′-hydroxyl acylation analyzed by primer extension (SHAPE): quantitative RNA structure analysis at single nucleotide resolution. Nat. Protoc. 2006, 1, 1610–1616
- Forsén and Linse 1995 Forsén, S.; Linse, S. Cooperativity: over the Hill. Trends Biochem. Sci. 1995, 20, 495–497
- Benjamini and Hochberg 1995 Benjamini, Y.; Hochberg, Y. Controlling the False Discovery Rate: A Practical and Powerful Approach to Multiple Testing. J. R. Stat. Soc. Ser. B Methodol. 1995, 57, 289–300
- Leontis and Westhof 2001 Leontis, N. B.; Westhof, E. Geometric nomenclature and classification of RNA base pairs. RNA 2001, 7, 499–512
- Bottaro et al. 2019 Bottaro, S.; Bussi, G.; Pinamonti, G.; Reißer, S.; Boomsma, W.; Lindorff-Larsen, K. Barnaba: software for analysis of nucleic acid structures and trajectories. RNA 2019, 25, 219–231
- Cordero et al. 2012 Cordero, P.; Lucks, J. B.; Das, R. An RNA Mapping DataBase for curating RNA structure mapping experiments. Bioinformatics 2012, 28, 3006–3008
- Finney et al. 2021 Finney, A. R.; McPherson, I. J.; Unwin, P. R.; Salvalaglio, M. Electrochemistry, ion adsorption and dynamics in the double layer: a study of NaCl (aq) on graphite. Chem. Sci. 2021, 12, 11166–11180
- Hénin et al. 2022 Hénin, J.; Lelièvre, T.; Shirts, M. R.; Valsson, O.; Delemotte, L. Enhanced sampling methods for molecular dynamics simulations. arXiv preprint arXiv:2202.04164 2022,