Can We Automate the Analysis of Online Child Sexual Exploitation Discourse?
Abstract
Social media’s growing popularity raises concerns around children’s online safety. Interactions between minors and adults with predatory intentions is a particularly grave concern. Research into online sexual grooming has often relied on domain-experts to manually annotate conversations, limiting both scale and scope. In this work, we test how well automated methods can detect conversational behaviors and replace an expert human annotator. Informed by psychological theories of online grooming, we label chat messages sent by child-sex offenders with one of eleven predatory behaviors. We train bag-of-words and natural language inference models to classify each behavior, and show that the best performing models classify behaviors in a manner that is consistent, but not on-par, with human annotation.
1 Introduction
Social media’s growing popularity amongst children and young adults raises serious concerns for their safety. The threat of online sexual grooming is an increasing problem in the digital age (Greene-Colozzi et al., 2020). In 2021 alone, UK police forces recorded over 5000 offences relating to sexual communications with a child, with social media apps such as Instagram and Snapchat popular amongst online predators (NSPCC, 2021). Minors who fall victim to offenders suffer considerably, with many abusers seeking to establish physical contact offline (Shelton et al., 2016). To assist law enforcement, academics have been trying to identify in advance those predators that steer the relationship towards physical encounters (Briggs et al., 2011; Winters et al., 2017; O’Connell, 2003; Williams et al., 2013). This important work predominantly relies on time-consuming human-effort to manually annotate conversations involving child sex offenders. In this work, we explore the extent to which automated annotation can mimic an expert human annotator.
Automatically detecting predatory behavior is a challenging task. Offenders use a variety of subtle behaviors to manipulate the flow of the conversation. Predators may use flattery to build trust (Barber and Bettez, 2021), make threats or bribe a child as a coercion tactic (Joleby et al., 2021). Whilst human experts can identify these contextual psychological behaviors in text, their implicitness can be problematic for machines (Buckingham and Alali, 2020). In computational social sciences, dictionary-based approaches (Tausczik and Pennebaker, 2010) are often used to identify psychological characteristics such as neuroticism (Bogdanova et al., 2014). However, these methods heavily rely on the included vocabulary, causing a large numbers of false positives for some behaviors (Kaur et al., 2021) while overlooking others (Broome et al., 2020). Prior work utilising machine learning has focused on identifying predators from a mixed corpus of illicit and everyday conversations (Inches and Crestani, 2012; Pendar, 2007; Miah et al., 2011; Ebrahimi et al., 2016; Gupta et al., 2012). While valuable in its own right, this line of research does not offer significant value to grooming experts as it identifies grooming behavior after-the-fact (Razi et al., 2021) and does not link or contribute to psychological insight.
This work is novel in its use of supervised and deep learning methods to analyse an expert-annotated corpus of real conversations between sexual predators and decoys pretending to be early teens. We report results and highlight the performance possible without incurring the cost of expert-labelling. The paper is organised as follows: the methods and experimental setup are described in Section 2; Section 3 then summarises results (with further details provided in the appendices) before Section 4 concludes the paper.
2 Method and Experimental Setup
| Region | Num. Msgs | % of Corpus |
|---|---|---|
| Train | 4712 | 70% |
| Test | 1355 | 20% |
| Validation | 704 | 10% |
| Category | Coverage (%) | Model | Precision | Recall | F1 |
|---|---|---|---|---|---|
| Communication/Coordination | 73.1 | NLI (1) | () | () | () |
| Rapport Building | 15.2 | NLI (5) | () | () | () |
| Control | 20.8 | NLI (5) | () | () | () |
| Challenge | 4.5 | NLI (5) | () | () | () |
| Negotiation | 20.9 | NLI (5) | () | () | () |
| Use of Emotions | 16.4 | NLI (5) | () | () | () |
| Testing Boundaries | 31.2 | NLI (5) | () | () | () |
| Use of Sexual Topics | 18.3 | NLI (5) | () | () | () |
| Mitigation | 3.0 | NLI (3) | () | () | () |
| Encouragement | 8.0 | NLI (1) | () | () | () |
| Risk Management | 4.6 | NLI (1) | () | () | () |
Dataset and Labelling.
The Perverted-Justice (n.d) website is an online repository of real, chat-based conversations between adults who were later convicted of grooming offences and decoys posing as children. Twenty-four chats, comprising of 12,942 messages, were labelled by a domain-expert with a background in forensic psychology. Chats were annotated in concordance with a theory of child grooming known as “self-regulation” (Elliott, 2017) – the notion that online predation contains a potentiality phase, where the predator attempts to form a positive relationship with the victim; and a disclosure phase, where the predator becomes more explicitly goal-oriented. The following behaviors were identified and applied to the offender messages: (1) communication/coordination, (2) rapport building, (3) control, (4) challenges, (5) negotiation, (6) use of emotions, (7) testing boundaries, (8) use of sexual topics, (9) mitigation, (10) encouragement, (11) risk management. A qualitative description of these behaviors is given in Section A of the Appendix. Overall 6,772 messages sent by the offender were labelled, with each message assigned a ‘Yes’ or ‘No’ for each of the above categories, based on the annotator’s judgment. Due to the subjective nature of this assessment, labelling performed by different expert annotators may not be in complete agreement.
We construct binary classification tasks and predict whether each message is an example of each behavior category. Offender messages were split into training, testing, and validation regions (see Table 1 for information on data splits), and were stratified to ensure equal distribution of behaviors per region. To increase model confidence, we cross validated each experiment three times through random re-sampling. In our results, we report the average () scores for precision, recall and F1 as evaluation metrics.
Supervised Machine Learning.
Offender messages were tokenized, part-of-speech (POS) tagged, and lemmatized with spaCy. We removed stop-words (i.e., the, a, am, at, be, is), and used the frequency counts of the remaining unigrams as input features. Consistent with previous work (Miah et al., 2011; Bogdanova et al., 2014), we compared the performance of four classifiers: Random Forest, Logistic Regression, Support Vector Machines, and Naive Bayes. For each algorithm, we optimized hyperparameters111Hyperparameters and the range of values explored are included in Section B of the Appendix. using the GridSearch class in Scikit-learn (Pedregosa et al., 2011) with 3-fold cross validation.
Deep Learning.
To make predictions using transformer-based deep learning, we formulate the problem as a natural language inference (NLI) task. In NLI, the objective is to determine whether two sentences logically complement or contradict one another (Bowman et al., 2015). For our purposes, we compare each message with a standardized sentence crafted from each behavior label (i.e., “This message is an example of building rapport”). Each message/label sentence pair is then used as an input to the deep learning model, where a softmax activation function calculates the probability the two sentences are logically related. For training222We used a Tesla P100 GPU for training., we use RoBERTa-large (Liu et al., 2019) with an implementation built in Pytorch. This model has been fine-tuned for NLI tasks using the Multi-Genre Natural Language Inference corpus (Williams et al., 2018). We ran both zero-shot and few-shot training setups. For the zero-shot model, predictions were made on the test set without any domain-specific training. In few-shot settings, we experiment with different amounts of positive training examples up to the full training set. As per (Wang et al., 2021), models were trained for 10 epochs with batch size 32 and a learning rate of .
Multi-Message Input.
To explore whether the surrounding messages increase the contextual understanding of the transformer, we repeat full-shot experiments but expand the message window to include multiple prior messages sent by both speakers. To do this, we concatenate multiple messages into a single input which is then passed to the transformer. We compare the performance of NLI models with an input of 1, 3, and 5 messages.
Human-in-the-Loop Validation.
To establish how comparable the model’s output is to labelling performed by a human annotator, we scored the predictions made by the best performing model for of the corpus ( predator messages). Each message was scored on a 1-3 scale of agreement (1=disagree, 2=uncertain, 3=agree). Sections of chats were chosen at random. To mitigate potential bias, annotations generated during the initial labelling were shielded from view.
We use Cohen’s (Cohen, 1960) to measure pairwise agreement between the two human raters and the predictions generated by the best performing model for each behavior. We report the mean of these scores as an index of overall agreement.
3 Results
Transfomer-based deep learning models achieved best performance across all categories, with the 5 message input NLI model performing best for most categories. Evaluation metrics for the highest performing model for each behavior are shown in Table 2. The performance of all models on all categories is reported in Section E of the Appendix. Eight of the eleven behaviors obtain a maximum F1 score above 50%, with the most prevalent category, communication/coordination, performing best with F1=. Automatically labelling encouragement and challenge was least successful, with a maximum F1 score of for both. For all eleven categories, a transformer-based model, trained on the full training set, was more successful than the traditional supervised machine learning algorithms. Averaging across behaviors, transformers improved performance of single message classification from to compared to the best performing supervised model. In 8 out of 11 cases, the supervised models, trained on the full training set, outperformed the zero-shot transformer. However, in 10 out of 11 cases, only 50 labelled instances were required by the transformer to exceed the best performing bag-of-words models. As many of the behaviors rely on contextual understanding, we increased the input size from a single message to 3 and 5 messages. The first contains two messages sent by the offender and one by the decoy, and the latter contains three by the offender and two by the decoy. Increasing the window size indeed improved performance for all behaviors333The majority of messages () were labelled as communication/coordination. As a result, this behavior was not tested in a multi-message setting as grouping messages meant that all inputs would be positively labelled. except for encouragement and risk management. On average, while 3-message classification did not improve single-message performance, 5-message classification improved on single-message F1 from to .
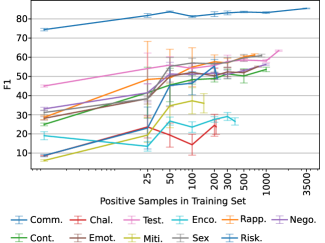
Figure 1 shows the change in F1 for single message classification as the number of training samples increases. Whilst predictions for all behaviors improved with additional training, large variation in performance between the categories remains even for a fixed amount of positive training examples. To better understand this variation, we manually examined the predictions made by the best performing single message model for of the corpus. We observed that the transformer has learned some rules that caused a number of false positives. For example, the testing boundaries model correctly predicted a number of questions aimed at assessing the victim’s willingness to engage, e.g., "what are you looking for?", but also included several logistical questions, e.g., "how about i come by at 8pm?". The rapport building model correctly recognised complements and sweet talk as positive examples, but missed more everyday examples of rapport building, e.g., "how was your spring break?". Some aspects of control required coverage over longer ranges than we have focused on. For example, persistently asking the same question is a sub-category of control that was often misclassified. In this case, increasing the the message window to 3 messages was not enough to improve performance, however, the larger 5 message window did notably improve performance, with the F1 increasing from to due to better recall. In trying to predict encouragement, the worst performing category, the transformer appeared to overfit on short verbal nods (i.e., "kool" and "sure", which appeared in the corpus either as evidence of encouragement or simple linguistic fillers) which increased the false positive rate. Over-reliance on this simple rule would explain why the model did not utilise the additional information provided in the multi-message setting. Risk management achieved reasonable performance (F1=) despite being one of the rarest behaviors in the corpus. This was largely a consequence of the transformer recognising instances where the offender attempts to establish the presence of a parent, e.g., “when are they getting home?”.
In addition to drawing qualitative observations on the ability of the transformer-based model to recognise different offender behaviors, we quantify how comparable the best performing single-message model is to a human annotator. We compare the labelled classes between the original labels (Rater 1), with the predictions made by the best performing models (Model), and the labels verified during post-validation (Rater 2). We report a mean score of 0.68, indicating ‘substantial agreement’ between raters (McHugh, 2012). Pairwise agreement is reported in Table 3. Agreement was highest between the two human raters (). The average agreement between each rater and the predictions generated by the model was (see Section D in the Appendix for pairwise agreement per behavior).
| Rater 1 | Rater 2 | Model | |
|---|---|---|---|
| Rater 1 | - | 0.8 (0.78) | 0.59 |
| Rater 2 | - | 0.65 (0.66) |
4 Conclusion
Manually labeling the 24 chat logs used in this work took over 600 hours. Given that the full Perverted-Justice corpus contains 850 chat logs, it would be infeasible to label the entire corpus without the help of automated methods. We find that a transformer-based deep learning approach yields promising results when applied to the detection of online predatory behavior. However, even with training, the agreement between the model and a human annotator is not comparable to the agreement between two human annotators. The model’s success in predicting behaviors varies significantly between the categories. Performance is better for more common behaviors, however, we show that the variation is not only due to the number of positive examples in the training data. Extending the prediction task to include multiple messages, increasing the contextual window, boosted detection for certain behaviors. The F1 score for rapport building, for example, increased from for single messages to when classification was based on five-messages. Performing post-validation on the automatic classifications allowed us to gain qualitative insight about the model’s performance, which may be used to design better prompts and improve performance further. Overall, our results are an encouraging step towards building an automated, psychology-informed model to detect online sexual exploitation.
References
- Greene-Colozzi et al. (2020) Emily A Greene-Colozzi, Georgia M Winters, Brandy Blasko, and Elizabeth L Jeglic. Experiences and perceptions of online sexual solicitation and grooming of minors: a retrospective report. Journal of child sexual abuse, 29(7):836–854, 2020. doi:10.1080/10538712.2020.1801938.
- NSPCC (2021) NSPCC. Record high number of recorded grooming crimes lead to calls for stronger online safety legislation, 2021. URL https://www.nspcc.org.uk/about-us/news-opinion/2021/online-grooming-record-high.
- Shelton et al. (2016) Joy Shelton, Jennifer Eakin, Tia Hoffer, Yvonne Muirhead, and Jessica Owens. Online child sexual exploitation: An investigative analysis of offender characteristics and offending behavior. Aggression and violent behavior, 30:15–23, 2016. doi:10.1016/j.avb.2016.07.002.
- Briggs et al. (2011) Peter Briggs, Walter T Simon, and Stacy Simonsen. An exploratory study of internet-initiated sexual offenses and the chat room sex offender: Has the internet enabled a new typology of sex offender? Sexual Abuse, 23(1):72–91, 2011. doi:10.1177/1079063210384275.
- Winters et al. (2017) Georgia M Winters, Leah E Kaylor, and Elizabeth L Jeglic. Sexual offenders contacting children online: an examination of transcripts of sexual grooming. Journal of sexual aggression, 23(1):62–76, 2017. doi:10.1080/13552600.2016.1271146.
- O’Connell (2003) Rachel O’Connell. A typology of child cybersexploitation and online grooming practices, 2003. URL http://image.guardian.co.uk/sys-files/Society/documents/2003/07/17/Groomingreport.pdf.
- Williams et al. (2013) Rebecca Williams, Ian A Elliott, and Anthony R Beech. Identifying sexual grooming themes used by internet sex offenders. Deviant Behavior, 34(2):135–152, 2013. doi:10.1080/01639625.2012.707550.
- Barber and Bettez (2021) Connie S Barber and Silvia Cristina Bettez. Exposing patterns of adult solicitor behaviour: towards a theory of control within the cybersexual abuse of youth. European Journal of Information Systems, 30(6):591–622, 2021. doi:10.1080/0960085x.2020.1816146.
- Joleby et al. (2021) Malin Joleby, Carolina Lunde, Sara Landström, and Linda S Jonsson. Offender strategies for engaging children in online sexual activity. Child Abuse & Neglect, 120:105214, 2021. doi:10.1016/j.chiabu.2021.105214.
- Buckingham and Alali (2020) Louisa Buckingham and Nusiebah Alali. Extreme parallels: a corpus-driven analysis of isis and far-right discourse. Kōtuitui: New Zealand Journal of Social Sciences Online, 15(2):310–331, 2020. doi:10.1080/1177083x.2019.1698623.
- Tausczik and Pennebaker (2010) Yla R Tausczik and James W Pennebaker. The psychological meaning of words: Liwc and computerized text analysis methods. Journal of language and social psychology, 29(1):24–54, 2010. doi:10.1177/0261927x09351676.
- Bogdanova et al. (2014) Dasha Bogdanova, Paolo Rosso, and Thamar Solorio. Exploring high-level features for detecting cyberpedophilia. Computer speech & language, 28(1):108–120, 2014. doi:10.1016/j.csl.2013.04.007.
- Kaur et al. (2021) Simrat Kaur, Sarbjeet Singh, and Sakshi Kaushal. Abusive content detection in online user-generated data: A survey. Procedia Computer Science, 189:274–281, 2021. doi:10.1016/j.procs.2021.05.098.
- Broome et al. (2020) Laura Jayne Broome, Cristina Izura, and Jason Davies. A psycho-linguistic profile of online grooming conversations: A comparative study of prison and police staff considerations. Child Abuse & Neglect, 109:104647, 2020. doi:10.1016/j.chiabu.2020.104647.
- Inches and Crestani (2012) Giacomo Inches and Fabio Crestani. Overview of the international sexual predator identification competition at pan-2012. In CLEF (Online working notes/labs/workshop), volume 30, 2012.
- Pendar (2007) Nick Pendar. Toward spotting the pedophile telling victim from predator in text chats. In International Conference on Semantic Computing (ICSC 2007), pages 235–241. IEEE, 2007. doi:10.1109/icsc.2007.32.
- Miah et al. (2011) Md Waliur Rahman Miah, John Yearwood, and Sid Kulkarni. Detection of child exploiting chats from a mixed chat dataset as a text classification task. In Proceedings of the Australasian Language Technology Association Workshop 2011, pages 157–165, 2011.
- Ebrahimi et al. (2016) Mohammadreza Ebrahimi, Ching Y. Suen, and Olga Ormandjieva. Detecting predatory conversations in social media by deep convolutional neural networks. Digital Investigation, 18:33–49, 2016. ISSN 1742-2876. doi:https://doi.org/10.1016/j.diin.2016.07.001. URL https://www.sciencedirect.com/science/article/pii/S1742287616300731.
- Gupta et al. (2012) Aditi Gupta, Ponnurangam Kumaraguru, and Ashish Sureka. Characterizing pedophile conversations on the internet using online grooming. arXiv preprint arXiv:1208.4324, 2012. doi:https://doi.org/10.48550/arXiv.1208.4324.
- Razi et al. (2021) Afsaneh Razi, Seunghyun Kim, Ashwaq Alsoubai, Gianluca Stringhini, Thamar Solorio, Munmun De Choudhury, and Pamela J Wisniewski. A human-centered systematic literature review of the computational approaches for online sexual risk detection. Proceedings of the ACM on Human-Computer Interaction, 5(CSCW2):1–38, 2021. doi:10.1145/3479609.
- Perverted-Justice (n.d) Perverted-Justice. http://perverted-justice.com/, n.d.
- Elliott (2017) Ian A Elliott. A self-regulation model of sexual grooming. Trauma, Violence, & Abuse, 18(1):83–97, 2017. doi:10.1177/1524838015591573.
- Pedregosa et al. (2011) Fabian Pedregosa, Gaël Varoquaux, Alexandre Gramfort, Vincent Michel, Bertrand Thirion, Olivier Grisel, Mathieu Blondel, Peter Prettenhofer, Ron Weiss, Vincent Dubourg, et al. Scikit-learn: Machine learning in python. Journal of machine learning research, 12(Oct):2825–2830, 2011.
- Bowman et al. (2015) Samuel R Bowman, Gabor Angeli, Christopher Potts, and Christopher D Manning. A large annotated corpus for learning natural language inference. arXiv preprint arXiv:1508.05326, 2015. doi:10.18653/v1/d15-1075.
- Liu et al. (2019) Yinhan Liu, Myle Ott, Naman Goyal, Jingfei Du, Mandar Joshi, Danqi Chen, Omer Levy, Mike Lewis, Luke Zettlemoyer, and Veselin Stoyanov. Roberta: A robustly optimized bert pretraining approach. arXiv preprint arXiv:1907.11692, 2019. doi:10.48550/arXiv.1907.11692.
- Williams et al. (2018) Adina Williams, Nikita Nangia, and Samuel Bowman. A broad-coverage challenge corpus for sentence understanding through inference. In Proceedings of the 2018 Conference of the North American Chapter of the Association for Computational Linguistics: Human Language Technologies, Volume 1 (Long Papers), pages 1112–1122. Association for Computational Linguistics, 2018. doi:10.18653/v1/n18-1101. URL http://aclweb.org/anthology/N18-1101.
- Wang et al. (2021) Sinong Wang, Han Fang, Madian Khabsa, Hanzi Mao, and Hao Ma. Entailment as few-shot learner. arXiv preprint arXiv:2104.14690, 2021. doi:10.48550/arXiv.2104.14690.
- Cohen (1960) Jacob Cohen. A coefficient of agreement for nominal scales. Educational and psychological measurement, 20(1):37–46, 1960. doi:10.1177/001316446002000104.
- McHugh (2012) Mary L McHugh. Interrater reliability: the kappa statistic. Biochemia medica, 22(3):276–282, 2012. doi:10.11613/bm.2012.031.
Appendix A Content Label Descriptions
Communication/Coordination
Description:
“Communication Coordination” is used to start and maintain communication as offenders: (i) exchange and clarify information with their intended victim, (ii) present reason/excuses, (iii) assess the level of engagement of the victim, (iv) find new ways to communicate (i.e., media exchange), (v) strategically use humour or linguistic fillers (i.e., “lol”, “hehe”), and (vi) redirect the flow of conversation. One of the offenders’ main purposes of this category is to maximize gain and potentially minimize time spent on non-compliant victims.
Rapport Building
Description:
Offenders use positive behavior to mimic romantic relationships, making it easier to introduce sexual topics [Elliott, 2017]. Offenders use ‘Rapport’ to infiltrate victims’ offline/online social and emotional life to create an illusion of exclusivity, reinforcing the offender as a trusted other. This is achieved through compliments/sweet talk, showing interest, and shared experiences. This special connection or bond is usually created in a short amount of time through excessive saturation and exposure to constant positive statements [Elliott, 2017].
Control/Regulation
Description:
Control/Regulation’ occurs when offenders use power to direct the flow of communication by influencing or directing the victim’s behavior. Controlling the conversation can occur through subtle (e.g., illusion of control, rhetorical questions, checking for willingness to engage, or permissive behavior) or direct strategies (e.g., making demands, persistence, use of coercion). Offenders may attempt to take control of the conversation through patronizing language, persistence, frequently checking for engagement, making demands, or by asking questions that give the illusion of consent - giving the impression that victims have control over what happens during an exchange.
Challenges
Description:
An offender may challenge a victim when opposing motivations appear. As a result, confrontation ensues directly (e.g., offence, control, aggression) or indirectly (e.g., joke, mockery, irony). Offenders often challenge the victim as a way of authenticating identity, or to exert more control.
Negotiation
Description:
“Negotiation” can occur at any time during the exchange and is the process where offenders attempt to make decisions, compromise, incentivize continued interaction, or reach goal achievement (e.g., confirming a plan to meet). “Negotiations” can be brief or extensive depending on what goals the offender is trying to achieve. Incentives are particularly important when negotiating goals, and can be either financial or emotional.
Use of Emotion
Description:
Offenders use emotive language to manipulate the victim’s emotions in order to influence their behavior. “Use of emotions” can be positive or negative, and include sub-behaviors such as manipulation, expressing empathy, guilt tripping, vilifying third parties, offering reassurance, or by playing the victim. Offenders may employ positive strategies to isolate victims, and use negative emotions increase compliance.
Testing Boundaries
Description:
“Testing Boundaries” determines whether the conversation continues or ends. Offenders seek to test boundaries directly or indirectly to determine whether it is possible to desensitize victims through exposure to sexual topics [Elliott, 2017].
Use of Sexual Topics
Description:
Offenders intentionally use sex to desensitize victims. This is done by directing conversation toward the victim’s prior sexual experiences, discussing fantasies, use of explicit language, determining sexual preferences, suggesting media production, alluding to traveling for sex, and acting as a sexual mentor.
Mitigation
Description:
“Mitigation” is a strategy that aims to soften or downgrade the intensity or seriousness of what is being expressed to convince the victim to participate. Offenders may use this technique in an attempt to normalize the sexual exchange by lessening the idea of harm or criminality. Specific sub-behaviors include indirectly stating a sexual preference for children, implicating oneself in a previous crime, normalizing sexual conversations, or discussing differences in age. Normalization occurs by talking about sex often without reservation and is the process of desensitizing the victim to sexual topics or acts.
Encouraging
Description:
Offenders use encouragement to comply with the victims requests, or to show support by acting as a mentor/trusted other.
Risk Management
Description:
“Risk Management” occurs when offenders assess risk and take steps to prevent discovery. This may be through incentivizing secrecy using emotional manipulation, asking the decoy to delete messages/images, enquiring after third parties (e.g., the location of parents), acknowledge previous wrongdoing, and discussing the consequences of getting caught.
Appendix B Hyperparameter Tuning
| Algorithm | Parameter | Value Range |
|---|---|---|
| Random Forest | n_estimators | , *, |
| max_depth | , , | |
| Logistic Regression | solver | liblinear, saga |
| penalty | l1, l2* | |
| Support Vector Machine | C | , , * |
| kernel | linear, poly, rbf* | |
| Naive Bayes | alpha | , * |
| fit_prior | True*, False |
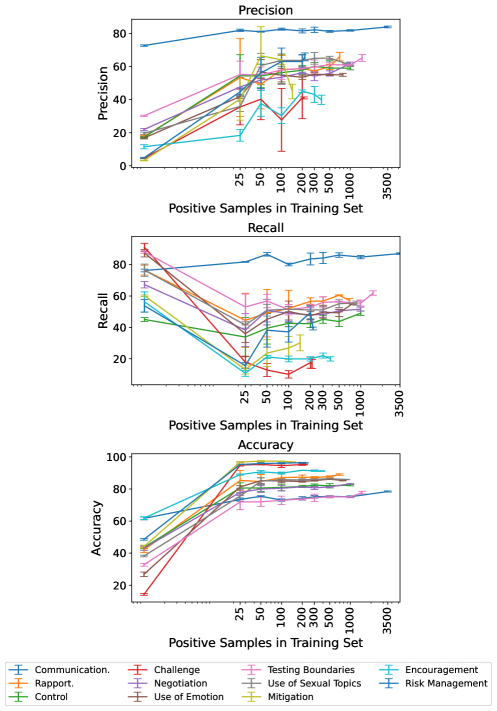
Appendix C Precision, Recall, and Accuracy Plots for Full-Shot Single-Classification Models
Appendix D Inter-Rater Agreement Scores for Each Behavior
| Behavior | Rater 1/Rater 2 | Rater 1/Model | Rater 2/Model | Overall |
|---|---|---|---|---|
| Communication/Coordination | () | () | () | |
| Rapport Building | () | () | () | |
| Control | () | () | () | |
| Challenge | () | () | () | |
| Negotiation | () | () | () | |
| Use of Emotions | () | () | () | |
| Testing Boundaries | () | () | () | |
| Use of Sexual Topics | () | () | () | |
| Mitigation | () | () | () | |
| Encouragement | () | () | () | |
| Risk Management | () | () | () | |
| Total | () | () | () |
Appendix E Full Model Results
| Model | Accuracy | Precision | Recall | F1 |
|---|---|---|---|---|
| Supervised - Bag of Words | ||||
| Random Forest | () | () | () | () |
| Logistic Regression | () | () | () | () |
| Support Vector Machine | () | () | () | () |
| Naive Bayes | () | () | () | () |
| Transformer | ||||
| 0-shot | () | () | () | () |
| 25-shot | () | () | () | () |
| 50-shot | () | () | () | () |
| 100-shot | () | () | () | () |
| 200-shot | () | () | () | () |
| 300-shot | () | () | () | () |
| 500-shot | () | () | () | () |
| 1000-shot | () | () | () | () |
| Full-shot (3466) | () | () | () | () |
| Model | Accuracy | Precision | Recall | F1 |
|---|---|---|---|---|
| Supervised - Bag of Words | ||||
| Random Forest | () | () | () | () |
| Logistic Regression | () | () | () | () |
| Support Vector Machine | () | () | () | () |
| Naive Bayes | () | () | () | () |
| Transformer | ||||
| 0-shot | () | () | () | () |
| 25-shot | () | () | () | () |
| 50-shot | () | () | () | () |
| 100-shot | () | () | () | () |
| 200-shot | () | () | () | () |
| 300-shot | () | () | () | () |
| 500-shot | () | () | () | () |
| 1000-shot* | ||||
| Full-shot (721) | () | () | () | () |
| Transformer - Multi-Message Input | ||||
| Full-shot 3 Msg | () | () | () | () |
| Full-shot 5 Msg | () | () | () | () |
* The number exceeds the total number of positive examples in the dataset and therefore results are analogous to full-shot
| Model | Accuracy | Precision | Recall | F1 |
|---|---|---|---|---|
| Supervised - Bag of Words | ||||
| Random Forest | () | () | () | () |
| Logistic Regression | () | () | () | () |
| Support Vector Machine | () | () | () | () |
| Naive Bayes | () | () | () | () |
| Transformer | ||||
| 0-shot | () | () | () | () |
| 25-shot | () | () | () | () |
| 50-shot | () | () | () | () |
| 100-shot | () | () | () | () |
| 200-shot | () | () | () | () |
| 300-shot | () | () | () | () |
| 500-shot | () | () | () | () |
| 1000-shot* | ||||
| Full-shot (986) | () | () | () | () |
| Transformer - Multi-Message Input | ||||
| Full-shot 3 Msg | () | () | () | () |
| Full-shot 5 Msg | () | () | () | () |
* The number exceeds the total number of positive examples in the dataset and therefore results are analogous to full-shot
| Model | Accuracy | Precision | Recall | F1 |
|---|---|---|---|---|
| Supervised - Bag of Words | ||||
| Random Forest | () | () | () | () |
| Logistic Regression | () | () | () | () |
| Support Vector Machine | () | () | () | () |
| Naive Bayes | () | () | () | () |
| Transformer | ||||
| 0-shot | () | () | () | () |
| 25-shot | () | () | () | () |
| 50-shot | () | () | () | () |
| 100-shot | () | () | () | () |
| 200-shot | () | () | () | () |
| 300-shot* | ||||
| 500-shot* | ||||
| 1000-shot* | ||||
| Full-shot (211) | () | () | () | () |
| Transformer - Multi-Message Input | ||||
| Full-shot 3 Msg | () | () | () | () |
| Full-shot 5 Msg | () | () | () | () |
* The number exceeds the total number of positive examples in the dataset and therefore results are analogous to full-shot
| Model | Accuracy | Precision | Recall | F1 |
|---|---|---|---|---|
| Supervised - Bag of Words | ||||
| Random Forest | () | () | () | () |
| Logistic Regression | () | () | () | () |
| Support Vector Machine | () | () | () | () |
| Naive Bayes | () | () | () | () |
| Transformer | ||||
| 0-shot | () | () | () | () |
| 25-shot | () | () | () | () |
| 50-shot | () | () | () | () |
| 100-shot | () | () | () | () |
| 200-shot | () | () | () | () |
| 300-shot | () | () | () | () |
| 500-shot | () | () | () | () |
| 1000-shot* | ||||
| Full-shot (991) | () | () | () | () |
| Transformer - Multi-Message Input | ||||
| Full-shot 3 Msg | () | () | () | () |
| Full-shot 5 Msg | () | () | () | () |
* The number exceeds the total number of positive examples in the dataset and therefore results are analogous to full-shot
| Model | Accuracy | Precision | Recall | F1 |
|---|---|---|---|---|
| Supervised - Bag of Words | ||||
| Random Forest | () | () | () | () |
| Logistic Regression | () | () | () | () |
| Support Vector Machine | () | () | () | () |
| Naive Bayes | () | () | () | () |
| Transformer | ||||
| 0-shot | () | () | () | () |
| 25-shot | () | () | () | () |
| 50-shot | () | () | () | () |
| 100-shot | () | () | () | () |
| 200-shot | () | () | () | () |
| 300-shot | () | () | () | () |
| 500-shot | () | () | () | () |
| 1000-shot* | ||||
| Full-shot (777) | () | () | () | () |
| Transformer - Multi-Message Input | ||||
| Full-shot 3 Msg | () | () | () | () |
| Full-shot 5 Msg | () | () | () | () |
* The number exceeds the total number of positive examples in the dataset and therefore results are analogous to full-shot
| Model | Accuracy | Precision | Recall | F1 |
|---|---|---|---|---|
| Supervised - Bag of Words | ||||
| Random Forest | () | () | () | () |
| Logistic Regression | () | () | () | () |
| Support Vector Machine | () | () | () | () |
| Naive Bayes | () | () | () | () |
| Transformer | ||||
| 0-shot | () | () | () | () |
| 25-shot | () | () | () | () |
| 50-shot | () | () | () | () |
| 100-shot | () | () | () | () |
| 200-shot | () | () | () | () |
| 300-shot | () | () | () | () |
| 500-shot | () | () | () | () |
| 1000-shot | () | () | () | () |
| Full-shot (1479) | () | () | () | () |
| Transformer - Multi-Message Input | ||||
| Full-shot 3 Msg | () | () | () | () |
| Full-shot 5 Msg | () | () | () | () |
| Model | Accuracy | Precision | Recall | F1 |
|---|---|---|---|---|
| Supervised - Bag of Words | ||||
| Random Forest | () | () | () | () |
| Logistic Regression | () | () | () | () |
| Support Vector Machine | () | () | () | () |
| Naive Bayes | () | () | () | () |
| Transformer | ||||
| 0-shot | () | () | () | () |
| 25-shot | () | () | () | () |
| 50-shot | () | () | () | () |
| 100-shot | () | () | () | () |
| 200-shot | () | () | () | () |
| 300-shot | () | () | () | () |
| 500-shot | () | () | () | () |
| 1000-shot* | ||||
| Full-shot (867) | () | () | () | () |
| Transformer - Multi-Message Input | ||||
| Full-shot 3 Msg | () | () | () | () |
| Full-shot 5 Msg | () | () | () | () |
* The number exceeds the total number of positive examples in the dataset and therefore results are analogous to full-shot
| Model | Accuracy | Precision | Recall | F1 |
|---|---|---|---|---|
| Supervised - Bag of Words | ||||
| Random Forest | () | () | () | () |
| Logistic Regression | () | () | () | () |
| Support Vector Machine | () | () | () | () |
| Naive Bayes | () | () | () | () |
| Transformer | ||||
| 0-shot | () | () | () | () |
| 25-shot | () | () | () | () |
| 50-shot | () | () | () | () |
| 100-shot | () | () | () | () |
| 200-shot* | ||||
| 300-shot* | ||||
| 500-shot* | ||||
| 1000-shot* | ||||
| Full-shot (144) | () | () | () | () |
| Transformer - Multi-Message Input | ||||
| Full-shot 3 Msg | () | () | () | () |
| Full-shot 5 Msg | () | () | () | () |
* The number exceeds the total number of positive examples in the dataset and therefore results are analogous to full-shot
| Model | Accuracy | Precision | Recall | F1 |
|---|---|---|---|---|
| Supervised - Bag of Words | ||||
| Random Forest | () | () | () | () |
| Logistic Regression | () | () | () | () |
| Support Vector Machine | () | () | () | () |
| Naive Bayes | () | () | () | () |
| Transformer | ||||
| 0-shot | () | () | () | () |
| 25-shot | () | () | () | () |
| 50-shot | () | () | () | () |
| 100-shot | () | () | () | () |
| 200-shot | () | () | () | () |
| 300-shot | () | () | () | () |
| 500-shot* | ||||
| 1000-shot* | ||||
| Full-shot (380) | () | () | () | () |
| Transformer - Multi-Message Input | ||||
| Full-shot 3 Msg | () | () | () | () |
| Full-shot 5 Msg | () | () | () | () |
* The number exceeds the total number of positive examples in the dataset and therefore results are analogous to full-shot
| Model | Accuracy | Precision | Recall | F1 |
|---|---|---|---|---|
| Supervised - Bag of Words | ||||
| Random Forest | () | () | () | () |
| Logistic Regression | () | () | () | () |
| Support Vector Machine | () | () | () | () |
| Naive Bayes | () | () | () | () |
| Transformer | ||||
| 0-shot | () | () | () | () |
| 25-shot | () | () | () | () |
| 50-shot | () | () | () | () |
| 100-shot | () | () | () | () |
| 200-shot | () | () | () | () |
| 300-shot* | ||||
| 500-shot* | ||||
| 1000-shot* | ||||
| Full-shot (218) | () | () | () | () |
| Transformer - Multi-Message Input | ||||
| Full-shot 3 Msg | () | () | () | () |
| Full-shot 5 Msg | () | () | () | () |
* The number exceeds the total number of positive examples in the dataset and therefore results are analogous to full-shot