BioKlustering: a web app for semi-supervised learning of maximally imbalanced genomic data
Abstract
Summary: Accurate phenotype prediction from genomic sequences is a highly coveted task in biological and medical research. While machine-learning holds the key to accurate prediction in a variety of fields, the complexity of biological data can render many methodologies inapplicable. We introduce BioKlustering, a user-friendly open-source and publicly available web app for unsupervised and semi-supervised learning specialized for cases when sequence alignment and/or experimental phenotyping of all classes are not possible. Among its main advantages, BioKlustering 1) allows for maximally imbalanced settings of partially observed labels including cases when only one class is observed, which is currently prohibited in most semi-supervised methods, 2) takes unaligned sequences as input and thus, allows learning for widely diverse sequences (impossible to align) such as virus and bacteria, 3) is easy to use for anyone with little or no programming expertise, and 4) works well with small sample sizes.
Availability and Implementation: BioKlustering (https://bioklustering.wid.wisc.edu) is a freely available web app implemented with Django, a Python-based framework, with all major browsers supported. The web app does not need any installation, and it is publicly available and open-source (https://github.com/solislemuslab/bioklustering)
Contact: solislemus@wisc.edu
Keywords Supervised learning Unsupervised learning Kmers Unaligned sequences Clustering
1 Introduction
Background. The accurate prediction of biological features from genomic data is paramount for precision medicine, sustainable agriculture and climate change research. Yet some characteristics of big biological data render most out-of-the-box methodologies inaccurate or inapplicable. In particular, here we focus on 1) the high complexity (and sometimes impossibility) to align genomic sequences for certain organisms, and 2) the difficulty to obtain labeled samples to use in supervised learning.
First, while the growing interest of the biological community in machine-learning methods is undeniable, many existing methods [1, 2, 3, 4, 5, 6, e.g.] need DNA or RNA alignments as input. Fast evolving organisms like virus or bacteria – especially when big sample sizes are needed – muddle the alignment process with their heterogeneity and genomic diversity to the point that aligning the sequences becomes extremely challenging or impossible [7, 8].
Second, supervised learning models are the most accurate options for phenotype prediction. However, these methods rely on large samples of labeled data. In reality, many biological experiments produce partially observed labels given the money and time constraints to phenotype organisms or strains. One example that motivated our work is the case of mycovirus. Mycoviruses infect fungi and can be used as biocontrol of crop pests given that they induce hypovirulence on plant fungal pathogens. Not all mycoviruses cause hypovirulence in the fungal host, and thus, a standard mycovirus dataset will be partially labeled with some labeled sequences that have been tested in planta for their hypovirulence potential, and many more unlabeled sequences that have never been tested in laboratory, and thus, have unknown hypovirulence potential.
Semi-supervised methods [9, 10] allow for partially observed labels, but existing methods require that we observe labels for all classes – albeit in smaller frequencies than the unobserved labels. This condition is not met in the mycovirus dataset, for example, where negative controls (class of mycoviruses that do not cause host hypovirulence) are not available as observed labels only correspond to mycoviruses tested in the lab for their hypovirulence-induced potential. Thus, the use of most semi-supervised methods is prohibited for this maximally imbalanced dataset.
Main contributions. We present BioKlustering (https://bioklustering.wid.wisc.edu) a user-friendly open-source web app to cluster unaligned genomic sequences based on maximally imbalanced partially observed labels. Unlike most semi-supervised learning methods, our web app does not require all classes to be observed or has any requirements on class balance. Also, unlike most machine-learning methods, our web app does not require large sample sizes. While designed for a semi-supervised setup, our web app can also be used when no labels are measured (unsupervised case).
One of the main purposes of our web app is to allow easy and fast clustering of sequences that could inform future biological experiments. Indeed, we see our web app as a hypothesis-generating tool that will allow biological users, for example, to identify clusters of mycovirus sequences that could be either negative controls (from the unobserved class of mycovirus that do not serve as biocontrol and that have never been tested in planta) or new mycovirus sequences that could serve as biocontrol for further experimentation.
We highlight that even when our work is visualization-driven, not inferential, we believe that it fills a important gap for biological scientists who need to identify similar sequences for experiments when sequence alignment is prohibited and when in vitro or in planta phenotyping of all labels is not possible.
2 Methods
Input data. Sequences are input as FASTA files and are internally converted to kmer counts. For example, if a sequence is “ACTGG", then its 3-mers are [“ACT", “CTG", “TGG"]. The user can select the length of the kmer and sequences can be aligned or unaligned. Labels are input as an optional separate csv file. The matching is done by assuming that the rows in both files are in the same order. The labels file should assign a value of to the sequences of unknown label.
Models. We implement three unsupervised clustering methods which are extended to the case of partially observed labels by internally optimizing the kmer length and other parameters until we reach maximum consensus with the observed labels.
K-means clustering. The algorithm [11] groups the data into clusters each formed around a centroid. Each data point is assigned to the nearest centroid, and these centroids are formed by minimizing the squared Euclidian distances within each cluster. The mean shift algorithm is used to identity locations of high density within the kmer space of the data, and then the unsupervised k-means model is run with these locations as the initial centroid coordinates. Parameters of this model include the minimum and maximum kmer length, the random seed, and the number of clusters. Since the mean-shift algorithm does not allow an input number of clusters, when the number of clusters predicted by mean-shift exceeds the number of clusters requested, Algorithm 1 (Appendix) is used to assign output labels.
The unsupervised k-means model can incorporate known labels to create an effective semi-supervised model. The mean shift algorithm is again used to identity locations of high density within the kmer space of the data, and then the unsupervised k-means model is run with these locations as the initial centroid coordinates. Known labels are then compared against predicted labels and these clusters are reassigned into groups that minimize the prediction error.
Gaussian Mixture Model. The algorithm fits a probabilistic model [12] that estimates the underlying multiple Gaussian distributions that best describe the clusters in the data. Starting with a random initialization model parameters, the Expectation-Maximization algorithm runs iteratively until convergence. Parameters of this model include the minimum and maximum kmer length, the random seed, the number of classes, and the covariance type (which determines the shape of the clusters).
The semi-supervised GMM differs from a unsupervised one in the initialization and parameter selection process. A semi-supervised GMM starts with initializing means of the known data by their actual means and the rest with random numbers. A parameter selection process is implemented to compare models with different parameter combinations (kmer length and four covariance types), and the model with high accuracy calculated from known labels will be returned. Finally, for the semi-supervised case only, we use Algorithm 2 (Appendix) to assign output labels from running the GMM to the input labels.
Spectral clustering. This algorithm [13] exploits the potential of eigenvalues of the matrix derived from the input data. In spectral clustering, the input data will be treated as a graph, and each sequence will represent a vertex in the graph. Then, the vertices in the graph will be partitioned based on their similarities. Parameters of this model are the minimum and maximum kmer length, the random seed, the number of classes, and the manner in which we assign labels when the input is projected to a lower dimension space (denoted label assignment option).
The semi-supervised version of spectral clustering will find the optimal parameter values (kmer length and label assignment option) that maximizes the predictive accuracy of the observed labels. We again use Algorithm 2 (Appendix) to assign output labels from running the spectral clustering algorithm to the input labels.
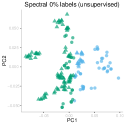
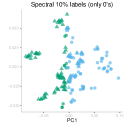
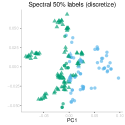
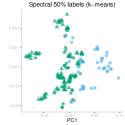
For all three algorithms, the predicted labels and embedded kmer data can be used to visualize the clusters using principle component analysis (PCA) or t-distributed stochastic neighbor embedding (t-SNE).
3 Validation with Influenza data
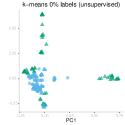
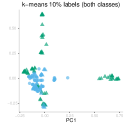
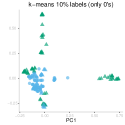
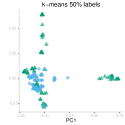
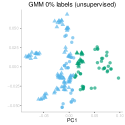
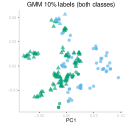
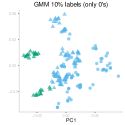
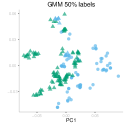
We test our three semi-supervised algorithms with Influenza data from two classes: bats and cats [14]. We run four settings: totally unsupervised, semi-supervised with 50% of observed labels (both classes observed), semi-supervised with 10% observed labels (both classes observed) and semi-supervised with 10% observed labels (only one class observed). Table 1 shows the prediction accuracy of the three learning algorithms in BioKlustering. See the Supplementary Material for clustering figures and more information about the data.
| k-means | GMM | Spectral | |
|---|---|---|---|
| Unsupervised | 71.3 | 75.3 | 75.8 |
| Semi-supervised (50%) | 82.6 | 93.8 | 87.1 |
| Semi-supervised (10%) | 73.6 | 90.4 | 75.3 |
| Semi-supervised (10% 0’s) | 71.3 | 51.1 | 70.2 |
4 Web app interface
BioKlustering is an open-source web application developed with Django, a Python-based framework (Figure 1). The users will be able to predict clusters in genomic data by 1) uploading FASTA files with (aligned/unaligned) genome sequences, 2) selecting a clustering algorithm, and 3) choosing in its corresponding parameters.
BioKlustering provides semi-supervised and unsupervised options depending on the presence of known labels. For each algorithm, the web app presents a description to aid users in the choice of parameters. The selected algorithm will generate prediction results which include an interactive plot (built with Plotly Dashboard [15]) and a table with predicted labels. Users can download a static version of the plot, the table, and the parameter information in a zip file which can also be sent via email.
Open-source code. All of our code is open source in the following GitHub repository https://github.com/solislemuslab/bioklustering.
Acknowledgements. This work was supported by the Department of Energy [DE-SC0021016 to CSL]. We thank Dr. Aurelie Rakotondrafara and Helena Jaramillo Mesa for the motivation on the mycovirus data. We also want to thank Ben Huebner from the WID IT team who helped with the public deployment of the web app. Finally, we acknowledge the work in [16] which helped us improve the scientific writing of this manuscript.
References
- [1] Vishal Agarwal, N Jayanth Kumar Reddy, and Ashish Anand. Unsupervised representation learning of DNA sequences. arXiv, (1906.03087), June 2019.
- [2] Wenjie Pei and David M J Tax. Unsupervised learning of sequence representations by autoencoders. April 2018.
- [3] Kamil Wnuk, Jeremi Sudol, Kevin B Givechian, Patrick Soon-Shiong, Shahrooz Rabizadeh, Christopher Szeto, and Charles Vaske. Predicting dna accessibility in the pan-cancer tumor genome using rna-seq, wgs, and deep learning. bioRxiv, page 229385, 2018.
- [4] Peyton Greenside, Tyler Shimko, Polly Fordyce, and Anshul Kundaje. Discovering epistatic feature interactions from neural network models of regulatory dna sequences. Bioinformatics, 34(17):i629–i637, 2018.
- [5] Yi Zhang, Xinan Liu, James N MacLeod, and Jinze Liu. Deepsplice: Deep classification of novel splice junctions revealed by rna-seq. In 2016 IEEE international conference on bioinformatics and biomedicine (BIBM), pages 330–333. IEEE, 2016.
- [6] Hai Thanh Nguyen, Toan Bao Tran, Huong Hoang Luong, Trung Phuoc Le, Nghi C. Tran, and Quoc-Dinh Truong. K-means clustering for features arrangement in metagenomic data visualization. In Marcin Hernes, Krystian Wojtkiewicz, and Edward Szczerbicki, editors, Advances in Computational Collective Intelligence, pages 74–86, Cham, 2020. Springer International Publishing.
- [7] Jie Ren, Xin Bai, Yang Young Lu, Kujin Tang, Ying Wang, Gesine Reinert, and Fengzhu Sun. Alignment-free sequence analysis and applications. Annual Review of Biomedical Data Science, 1:93–114, 2018.
- [8] Julie D Thompson, Benjamin Linard, Odile Lecompte, and Olivier Poch. A comprehensive benchmark study of multiple sequence alignment methods: current challenges and future perspectives. PloS one, 6(3):e18093, 2011.
- [9] Abolfazl Doostparast Torshizi and Linda R Petzold. Graph-based semi-supervised learning with genomic data integration using condition-responsive genes applied to phenotype classification. Journal of the American Medical Informatics Association, 25(1):99–108, 2018.
- [10] Nitin Bhardwaj, Mark Gerstein, and Hui Lu. Genome-wide sequence-based prediction of peripheral proteins using a novel semi-supervised learning technique. BMC bioinformatics, 11(1):1–8, 2010.
- [11] James MacQueen et al. Some methods for classification and analysis of multivariate observations. In Proceedings of the fifth Berkeley symposium on mathematical statistics and probability, volume 1, pages 281–297. Oakland, CA, USA, 1967.
- [12] Lars Buitinck, Gilles Louppe, Mathieu Blondel, Fabian Pedregosa, Andreas Mueller, Olivier Grisel, Vlad Niculae, Peter Prettenhofer, Alexandre Gramfort, Jaques Grobler, Robert Layton, Jake Vanderplas, Arnaud Joly, Brian Holt, and Gaël Varoquaux. API design for machine learning software: experiences from the scikit-learn project. arXiv, (1309.0238), 2013.
- [13] William Pentney and Marina Meila. Spectral clustering of biological sequence data. In AAAI, volume 5, pages 845–850, 2005.
- [14] https://www.ncbi.nlm.nih.gov/genomes/FLU/Database/. Influenza virus database. 2020 (accessed July 24, 2020).
- [15] Mark Gibbs. django-plotly-dash 1.5.0 https://pypi.org/project/django-plotly-dash/, Date accessed: December 2020.
- [16] Scott Hotaling. Simple rules for concise scientific writing. Limnology and Oceanography Letters, 5(6):379–383, 2020.
![[Uncaptioned image]](/html/2209.11730/assets/Website_Upload.png)
![[Uncaptioned image]](/html/2209.11730/assets/Website_Predict.png)
![[Uncaptioned image]](/html/2209.11730/assets/Website_Result.png)
5 Supplementary Material
5.1 Algorithms
5.2 Validation with Influenza data
We downloaded 64 unaligned nucleotide sequences for bat Influenza virus with lengths between 844 and 2339 bp and 114 unaligned nucleotide sequences for cat Influenza virus with lengths between 538 and 2341 bp from the NCBI database [14]. We use the whole dataset as training given the small sample size.
For this data, we have the labels for all sequences, but we run our learning algorithms under four settings: 1) unsupervised (ignored all labels), 2) semi-supervised with 50% of observed labels randomly selected, 3) semi-supervised with 10% of observed labels randomly selected, and 4) semi-supervised with 10% of observed labels from one class only. Out of the 50% observed labels, 36% of them correspond to the class of bats and 64% to the class of cats. Out of the 10% observed labels, 41% of them correspond to the class of bats and 59% to the class of cats when both classes are observed, and 100% correspond to the class of bats when only one class is observed.
Table 1 (main text) shows the prediction accuracy of the three methods in BioKlustering: k-means, GMM and spectral clustering.
For the k-means method, the chosen parameters that maximize the agreement with the observed labels are in all four cases.
For the GMM method, the chosen parameters that maximize the agreement with the observed labels are
-
•
with covariance type as “full" for the unsupervised case,
-
•
with covariance type as “diagonal" for the semi-supervised case with 10% labels observed (both classes),
-
•
with covariance type as “full" for semi-supervised case with 10% observed labels (only 0’s),
-
•
with covariance type as "tied" for the semi-supervised case with 50% labels observed.
For the spectral clustering, the chosen parameters that maximize the agreement with the observed labels are
-
•
with k-means label assign option for the unsupervised case,
-
•
with discretize label assign option for the semi-supervised case with 10% labels observed (both classes),
-
•
and label assign option as discretize for when only 0’s are observed,
-
•
there were two setups with the same accuracy for the semi-supervised case with 50% observed labels: with k-means label assign option and with discretize label assign option.
In all cases, the true number of classes is selected (2) and we do not test the performance when the number of clusters is not known in advance.
Table 2 shows the prediction accuracy of the three clustering methods comparing only the observed labels. Even when we always return the observed labels, they are used internally to modify the parameters to maximize agreement between predicted labels and observed labels.
| k-means | GMM | Spectral | |
| Semi-supervised (50%) | 77.5 | 100 | 74.2 |
| Semi-supervised (10%) | 76.5 | 100 | 76.5 |
| Semi-supervised (10% 0’s) | 100 | 100 | 100 |
Finally, Figure 2 shows the clustering visualization via PCA of the spectral clustering (top), the k-means clustering (middle), and the GMM clustering (bottom).