Valuation of Music Catalogs
Abstract
We propose a risk neutral approach to forecast the cashflows of music catalogs, based on historical revenue data. We use a discounted cashflows formula to produce reasonable ranges of multipliers for these assets, based on the age of the catalog, the last-twelve-months revenue and the duration of the contract. We compare the multipliers implied by the cashflows of top, median and bottom performing songs on the Royalty Exchange platform. We find that ask prices are close to the multipliers justified by median song cashflows. The best bids are near the multipliers justified by the bottom decile of song cashflows.
1 Introduction
Nowadays, when new music is released, streaming revenues look small relative to what the sale of CDs used to generate. This has had a profound impact on the timing and magnitude of musicians’ revenues [4]. The slow trickle of cashflows in the early years after a release may be helpful in predicting the long term streaming revenues for a song or album. This has opened the possibility for financial instruments that allow investors to participate in the future cashflows of music, an activity that has grown to an estimated US$5bn in music rights transactions in 2021 [8]. The structure of these instruments have been debated from a legal perspective [6]. From a practical perspective, musicians may want to sell their rights to receive payments upfront, based on the revenue they are expected to generate over a future time period. The money raised this way can provide a lump sum to fund music production, marketing and help artists diversify their assets.
At the fundamental level, the value of these rights depends on:
-
•
The Last Twelve Month (LTM) revenues. Prices are usually quoted in terms of multipliers of the LTM.
-
•
The duration of the rights. This may be a fixed horizon, say 10 or 30 years, or life-of-rights assets that last 70 years after the death of the artist.
- •
-
•
The expected future cashflows , where is a value-weighted average of the ages of the songs in a catalog and are the future dates of the cashflows. Other metadata such as the the genre, the sources of revenue, the nature of the rights (recording or publishing copyrights), the artist’s language, country and gender may also be considered. The overall outlook of the the music streaming business may also be an important factor (see the latest ”Music in the Air” report by Goldman Sachs [8]).
The fair price can be expressed as a sum of expected discounted cashflows,
where the main challenge is estimating the cashflows . Cashflows are notoriously hard to estimate, as hits tend to emerge in very unpredictable ways. Effectively, rights buyers are buying a form of high dividend stock, which pays steady cashflows most of the time and occasionally offers significant upside when a positive event occurs.
In Section 2, we illustrate this cashflow behavior with revenue data from Royalty exchange. We compute 3 revenue growth curves, for the top songs (top decile), median songs and bottom songs (lowest decile), based on cashflows collected on Royalty Exchange. In Section 3, we use discounted cashflow formulas using these top, median and bottom revenue curves to derive a range of reasonable multipliers for fixed duration assets.
2 Revenue Data
We collected data on catalogs on Royalty exchange, where each item may comprise of a single song, albums, or collections of songs (referred to as ”assets”). For each asset, we had a history of either monthly or quarterly cashflows as well as a value-weighted age of the asset (referred to as the ”dollar age”).
We processed the data in two ways - first comparing the age of the oldest cashflow with the dollar age of the assets, and then filtering dollar age outliers. In the first step, we transformed all cashflows into annual cashflows and threw away songs with years of zero revenue. In the second step, we retained songs with dollar ages within a 30% margin of the age of the oldest cashflow. This ensured that we only work with assets comprising of one song or collections of songs released at approximately the same time.
Since asset prices are typically quoted in multipliers of the , we express the multiplier of asset with age and duration as
where
is an estimate of revenues in year expressed as a share of the revenues in year .
To do so, we:
-
•
Gather all the songs in our data of dollar age at or above
-
•
Compute an observed share that is calculated for each song as
-
•
For each pair of dates and , compute the median, 90th percentile, and 10th percentile of the variable over all songs . The result of these computations is:
-
–
- revenue share for year for asset of dollar age using median approach
-
–
- revenue share for year for asset of dollar age using 90th percentile approach
-
–
- revenue share for year for asset of dollar age using 10th percentile approach
-
–
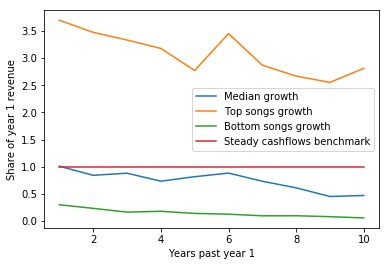
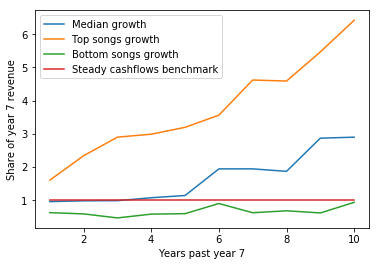
These normalized revenue shares are displayed in Figure 1 for . We find that the cashflows of very new songs (dollar age = 1) decay for the top, median and bottom performing songs. However, for older songs (dollar age = 7) only bottom performing songs decay, while top performing songs grow significantly. This illustrates the idea that investors who pick top performing songs can see significant upside, when the dollar age is higher.
3 Computing multipliers
From these cashflow growth and decay rates, we may compute the multiplier for top decile assets
median assets
and bottom assets
and compare them to bid and ask prices in the market.
To evaluate the fit of our model, we observed multipliers from real buyers and sellers on the Royalty Exchange for assets of duration 10 years or less. The market mechanism on Royalty Exchange is similar to that of Ebay, where a single sellers may post an ask price, while multiple buyers compete with their bids. For each song, we gathered the implied multiplier of the most recent bid (by dividing the most recent bid by revenue of the last year) as well as the ask multiplier the seller offers as a ”Buy Now” option. As expected, bids are lower than asks, but we added an additional filter - removed observations where the bid multipliers are less than half the ask multipliers.
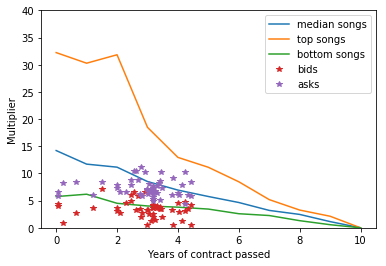
We observe in Figure 2 that bids are close to the bottom 10th percentile of songs. The asks are close to those justified by a median song. These low values seem to imply buyers assume that the cashflows will decay fast, while sellers assume that they will remain stable. This gap between the bids and the asks may be justified by the inherently asymmetric information between the buyer and the seller.
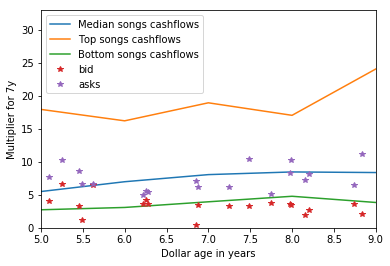
We observe in Figure 3 that the dollar age has a very modest effect on the multipliers. Consistently with the behavior in Figure 2, bids are near the bottom decile and asks are near the median songs.
4 Conclusion
We show that a discounted cashflow model estimated on historical revenue data on Royalty Exchange fit the market data quite well. We find that the ask multipliers are near the value justified by median song cashflows, while the bid multipliers are close to the bottom decile. This market outcome resembles the work of [1] which examines how the quality of goods traded in a market can degrade in the presence of information asymmetry between buyers and sellers. In particular, the seller of music rights may have information that is not available to the buyer, such as the costs associated with the success of songs in a catalog. The mixture of assets that have had organic growth and those that have had significant marketing budgets may make buyers reluctant to buy music rights at their median value.
We see three main directions in which this research could be developed further:
-
1.
Accounting for risk-averse investors
-
2.
Adjusting multiplier based on other factors than dollar age
-
3.
Adding more revenue data sources for more accurate calculations
The first concern may be addressed by taking a Markowitz optimal investment approach, where both means and variance impact the pricing formula.
The two last concerns may be addressed by studying a larger set of songs and their associated streaming cashflows. Since we expect a strong correlation between revenue and streaming counts, historical song streaming data may yield less biased and tighter ranges of reasonable multipliers.
References
- [1] George A. Akerlof “The Market for Lemons: Quality Uncertainty and the Market Mechanism” In The Quarterly Journal of Economics, 1970 URL: https://www.jstor.org/stable/1879431
- [2] Adrian Ashford “Artist Know your Value: Lawyers look Beyond Multiples” In MRD Advisors, 2021 URL: https://16b29b83-9b81-4a9d-931d-31c69242f35a.usrfiles.com/ugd/16b29b_eb5106c087cc4368b14a0c824349e153.pdf
- [3] Emma Griffiths “Money Moves - Barry Massarsky on Data-Driven Catalog Valuations and Drivers of Growth in the Music investment Market” In Synchtank, 2020 URL: https://www.synchtank.com/blog/money-moves-barry-massarsky-on-data-driven-catalog-valuations-and-drivers-of-growth-in-the-music-investment-market/
- [4] David Hesmondhalgh, Richard Osborne, Hyojung Sun and Kenny Barr “Music Creators’ Earnings in the Digital Era” In Intellectual Property Office Research Paper Forthcoming, 2021 URL: https://ssrn.com/abstract=4089749
- [5] Tim Ingham “The Fed Just Raised Interest Rates. So Did the Bank of England. A Leading Music Asset Valuer Explains Why it Isn’t Worrying.” In Music Business Worldwide, 2022 URL: https://www.musicbusinessworldwide.com/the-fed-just-raised-interest-rates-so-did-the-bank-of-england-this-leading-music-asset-valuer-isnt-worrying/
- [6] James Hicks Kristelia Garcia and Justin McCrary “Copyright and Economic Viability: Evidence from the Music Industry” In Journal of Empirical Legal Studies 17.4, 2020, pp. 696–721
- [7] LLC Kroll Bond Rating Agency “Hipgnosis Music Assets 2022-1 L.P.” In Music Business Worldwide, 2022 URL: https://www.musicbusinessworldwide.com/files/2022/08/Hipgnosis1.pdf
- [8] Rod Hall Stephen Laszczyk Ronald Keung Lincoln Kong Brett Feldman James Tate Lisa Yang and Manish Adukia “Music in the Air” In Goldman Sachs, 2022 URL: https://www.goldmansachs.com/insights/pages/gs-research/music-in-the-air/report.pdf