5pt {textblock}0.8(0.1,0.02) If you cite this paper, please use the ACM IMC reference: Said Jawad Saidi, Srdjan Matic, Oliver Gasser, Georgios Smaragdakis, and Anja Feldmann. 2022. Deep Dive into the IoT Backend Ecosystem. In Proceedings of the 22nd ACM Internet Measurement Conference (IMC ’22), October 25–27, 2022, Nice, France. ACM, New York, NY, USA, 16 pages. https://doi.org/10.1145/3517745.3561431
Deep Dive into the IoT Backend Ecosystem
Abstract.
Internet of Things (IoT) devices are becoming increasingly ubiquitous, e.g., at home, in enterprise environments, and in production lines. To support the advanced functionalities of IoT devices, IoT vendors as well as service and cloud companies operate IoT backends—the focus of this paper. We propose a methodology to identify and locate them by (a) compiling a list of domains used exclusively by major IoT backend providers and (b) then identifying their server IP addresses. We rely on multiple sources, including IoT backend provider documentation, passive DNS data, and active scanning. For analyzing IoT traffic patterns, we rely on passive network flows from a major European ISP.
Our analysis focuses on the top IoT backends and unveils diverse operational strategies—from operating their own infrastructure to utilizing the public cloud. We find that the majority of the top IoT backend providers are located in multiple locations and countries. Still, a handful are located only in one country, which could raise regulatory scrutiny as the client IoT devices are located in other regions. Indeed, our analysis shows that up to 35% of IoT traffic is exchanged with IoT backend servers located in other continents. We also find that at least six of the top IoT backends rely on other IoT backend providers. We also evaluate if cascading effects among the IoT backend providers are possible in the event of an outage, a misconfiguration, or an attack.
1. Introduction
Internet of Things (IoT) devices are increasingly deployed at home, office, retails, and production lines to enable rich and complex applications, including smart home, video surveillance, voice assistance, content recommendation, and logistics, to just name a few. Many of these applications rely on functionalities that cannot be fully deployed on IoT devices directly.
Given that IoT devices simply lack the required computing, memory, and energy resources for computationally demanding applications or additional data, it is common to offload part of the application to a backend in the “cloud”. For example, applications that rely on machine learning are often easier to operate in the cloud, which is computationally more powerful and has access to readily available machine learning libraries (Google, 2022; AWS, 2022c), rather than on the IoT device itself. A low-cost IoT camera typically streams its video to the cloud, where the main computation takes place, e.g., to identify suspicious activity and trigger an alarm in real-time. Moreover, many companies that use IoT devices commercially, e.g., within a production line or for logistics, collect all data in the cloud for analytics and operational decisions (Kappel et al., 2022). Thus, these clouds act as the backend of IoT applications.
IoT devices also lack the storage required, e.g., for content-centric applications. Thus, such IoT devices need IoT backend servers to download or upload content required by the application. For example, content recommendations require the user’s profile and have to merge it against the available content (AWS, 2022a), which may not be possible on the IoT device itself. Moreover, IoT device security and functionality often depend on an IoT backend. One prominent example is software updates—many IoT devices periodically check if software updates are available. Other IoT vendors or application providers push notifications to the IoTs when such updates are available.
As the number of deployed IoTs and their functionality increases rapidly, the demands for the IoT backend—in terms of capabilities and traffic—increase as well. During the last years, we have observed a shift toward building special-purpose clouds to support IoT applications and cope with the increasing demand. Recently, big technology giants, such as Amazon (Amazon, 2022), Google (Google, 2022), and Microsoft (Azure, 2022) started to offer IoT backend solutions as-a-service. Such companies are IoT backend providers and enable third-party IoT application providers to scale up and deliver their solutions to potentially billions of IoTs deployed around the globe.
Despite the critical role that these IoT backend providers play in the operation and security of IoT applications (Alrawi et al., 2019; He et al., 2022; Zhou et al., 2019; Jia et al., 2020), little is known about their locations, strategies, and volume share. Indeed, much of the work in the IoT area has focused on the inference of IoT clients (Saidi et al., 2020; Perdisci et al., 2020; D. Kumar and K. Shen and B. Case and D. Garg and G. Alperovich and D. Kuznetsov and R. Gupta and Z. Durumeric, 2019) or general-purpose cloud providers or content delivery networks (Arnold et al., 2020; Dang et al., 2021; Gigis et al., 2021) that may also support IoT services. In this paper, we turn our attention to the IoT backend providers. We develop new methods to identify their footprints and gain insights into their modus operandi.
We also investigate if IoTs and IoT backend servers are in the same geographic location and jurisdiction. Indeed, data sovereignty and protecting private user data leaked by IoTs are at the heart of the current debate. The European Union General Data Protection Regulation (GDPR) (European Union, 2018) was put into effect on May 25, 2018 to protect user privacy and regulate the transfer of personal data only under strict conditions and with user consent. The GDPR levies fines against those who violate users’ privacy and security standards, with penalties reaching twenty million euros or up to 4% of the annual worldwide turnover of the preceding financial year in the case of an enterprise, whichever is greater. Moreover, the EU is currently working on a new regulation targeting smart devices, e.g., IoTs, with cybersecurity and privacy risks (Reuters, 2002; European Commission, 2021, 2022). Thus, it is important to better understand the interaction of IoT devices with remote backend providers.
Our contributions can be summarized as follows:
-
•
We develop a methodology to infer the network and physical location of major IoT backend providers. Our methodology relies on a fusion of information from public documentation, passive DNS, and active measurements.
-
•
We analyze the IoT backend ecosystem with regard to deployment, operation, and dependencies. While most popular IoT backend providers have footprints that cover multiple locations and countries, our analysis shows that some of them operate only in one country or rely on infrastructure from other IoT backend providers.
-
•
Our analysis shows that it is not unusual for IoT protocols, e.g., MQTT, to use non-standard ports or reuse Web ports. The latter makes the identification of IoT backend infrastructure as well as IoT traffic challenging using traditional methods—our proposed methodology resolves this issue.
-
•
Using passive data from a major European ISP, we examine the IoT traffic patterns of multiple providers at scale. We notice that a substantial fraction (around 35%) of IoT traffic is exchanged with IoT backend servers outside Europe, which raises both performance and regulatory concerns.
-
•
Our traffic analysis highlights that both the IoT population and activity per application differ vastly. While some applications behave more like the typical user-generated traffic, i.e., diurnal patterns, peak evening hours, and downstream-heavy; this is not the case for all IoT applications.
-
•
We comment on shortcomings of the current IoT backend ecosystem and assess the impact of a large-scale outage in one of the major IoT backend providers on IoT connectivity to backend servers.
-
•
To enable follow-up research in the area, we make the tools, scripts, and artifacts for extracting the regular expressions and IoT backend domains publicly available (Saidi et al., 2022).
Scope of the paper: Our study is curiosity-driven, and we try to understand the evolving IoT backend ecosystem to inform future studies by computer scientists, economists, and policymakers. As we are not aware of the companies’ business strategies, we do not take a position regarding their deployment decisions and operation. Rather, we characterize the current state of the IoT ecosystem. This study is not a head-to-head comparison of different and possibly competing IoT companies.
2. Scenario and related work
We first describe the setting of our measurement study and introduce terminology. Then, we summarize related work.
2.1. IoT Backend Providers
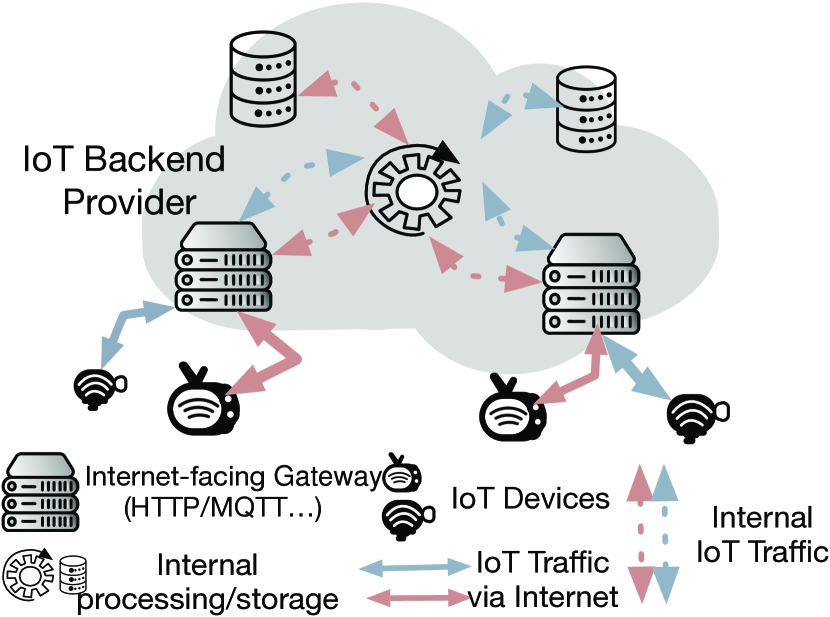
Today, many of the IoT vendors (Bosch, 2022; Fujitsu, 2022; Siemens, 2022b; Huawei, 2022), technology giants (Google, 2022; IBM, 2022b; Oracle, 2022b; SAP, 2022a; Alibaba, 2022b; Baidu, 2022b), and cloud providers (Amazon, 2022; Azure, 2022) offer sophisticated IoT platform solutions. These solutions allow developers to deploy new services, support existing applications, collect data, or remotely manage and configure IoT devices. Typically, these IoT platforms have three major components: software/hardware on IoT devices, Internet-facing gateway servers, and the internal storage/processing systems, e.g., for machine learning. Figure 1 depicts the main components of a generic IoT platform.
In this paper, we identify and characterize the public part of IoT platforms, i.e., the Internet-facing gateway servers, that we refer to as IoT backend, see Figure 1. IoT backends facilitate the data exchange between IoT devices, internal systems, and possibly other platforms. We refer to companies that operate such gateway infrastructures as IoT backend providers.
Note that IoT platforms are sophisticated entities. Thus, our study focuses on their public IPs—the gateways that enable the exchange and flow of data between the IoT devices and the internal systems of the IoT platforms. Thus, the following aspects are out of scope: the software and hardware installed on IoT devices, internal processing and storage systems of IoT platforms, in particular, since these are typically not publicly accessible, and private interconnections between cloud providers and IoT platforms (Yeganeh et al., 2019).
In this paper, we consider devices that contact IoT backends, which are dedicated to supporting functionalities of IoT devices, as IoT devices. IoT devices range from smart meters at home to smart TVs, voice assistants, and logistics monitors. What they have in common is that they contact IoT backend providers that support their functionalities.
2.2. Related Work
Most of the related work in this area focused on identifying either IoT devices
themselves or their vendors in the wild rather than the IoT backend.
Instrumented Testbeds.
Previous
work (Huang
et al., 2020; Dubois et al., 2020; Ren et al., 2019; Haddadi et al., 2018; Alrawi et al., 2019)
uses sophisticated testbeds or home environments to collect full packet captures
to generate IoT device signatures. Other studies (Hamza et al., 2018) use
hints, e.g., IETF Manufacturer Usage Description (MUD), to identify IoT
devices. While these methods are powerful and accurate, they do not scale with
new IoT vendors and devices which are constantly added to the market.
Analysis of Passive Data.
Signatures derived by instrumented testbeds have been leveraged to infer the
presence of IoT devices within homes and enterprises using data from a
residential ISP and an IXP (Saidi et al., 2020). Machine learning techniques
have been used to generate IoT signatures and infer their presence in traffic
flows of IoT
devices (Sivanathan et al., 2019b, a; Trimananda et al., 2020).
Recent work by Perdisci et al. (Perdisci et al., 2020) leverages
distributed passive DNS data collections combined with machine learning to
identify a variety of IoT devices based on their DNS fingerprints.
User agents have also been used to infer IoT devices in network
flows (DeKoven et al., 2019) or server logs (Rula
et al., 2020). Feng
et al. (.Feng
et al., 2018) uses machine learning to label IoT devices based on
information extracted from websites (vendors, Wikipedia, product reviews). Yu
et al. (Yu
et al., 2020) propose to use deep learning to identify mobile and IoT
devices as well as their manufacturer and model by extracting features from
structural and textual information embedded in passively observed broadcast and
multicast packets from public WiFi networks. All of the above work focuses
on identifying IoT devices.
Active Scanning. Izhikevich et al. (Izhikevich et al., 2021, 2022) perform active scanning campaigns and include IoT services that are often reachable on non-IoT ports. Kumar et al. (D. Kumar and K. Shen and B. Case and D. Garg and G. Alperovich and D. Kuznetsov and R. Gupta and Z. Durumeric, 2019) utilize data from an antivirus software that scans home networks to discover IoT devices at home and assess their level of security. This study—one of the largest of its kind—shows that IoT adoption differs substantially across regions. It is widespread in North America, where nearly half of the homes host at least one IoT device, typically an Internet-connected television or streaming device. On the contrary, in South Asia, only around three percent of the homes host IoTs, typically surveillance cameras. In total, the study discovered more than 83 million devices deployed in roughly 16 million households. It also identified weak default credentials and showed vulnerabilities to known attacks.
Companies periodically scan the Internet using a wide range of ports, including IoT standard ports, and offer annotated datasets (Durumeric
et al., 2013; Durumeric et al., 2015; Shodan, 2022).
Active measurement campaigns are used by, e.g., Srinivasa et
al. (Srinivasa et al., 2021) to detect IoT clients in the wild and characterize IoT
device misconfigurations. Note that they explicitly look for devices and not IoT
backends. The same is true for work that tries to identify IoT devices that
participate in attacks, e.g., the Mirai
attack (Antonakakis
et al., 2017). We conclude that most work using active scans focuses on IoT devices and their
security properties.
IoT Platforms. We are aware of a small number of studies that focus on IoT platforms, whereby their main focus is also on security. Alrawi et al. (Alrawi et al., 2019) perform a security evaluation of home-based IoT deployments and highlight the need to understand IoT platforms, i.e., IoT backend providers. He et al. (He et al., 2022) develop fingerprinting techniques to classify traffic that is exchanged with the cloud as IoT-related or non-IoT-related traffic. A study by Zhou et al. (Zhou et al., 2019) investigates five popular IoT platforms that enable smart home IoT applications. The study shows that these platforms are vulnerable to a number of removal attacks, including device substitution, device hijacking, device denial of service, illegal device occupation, and firmware theft. Jia et al. (Jia et al., 2020) report on the vulnerabilities of defense mechanisms used by popular IoT platforms for IoT-specific protocols, e.g., MQTT. We note that none of the prior works characterizes IoT backend provider footprints or their traffic flows.
3. Methodology
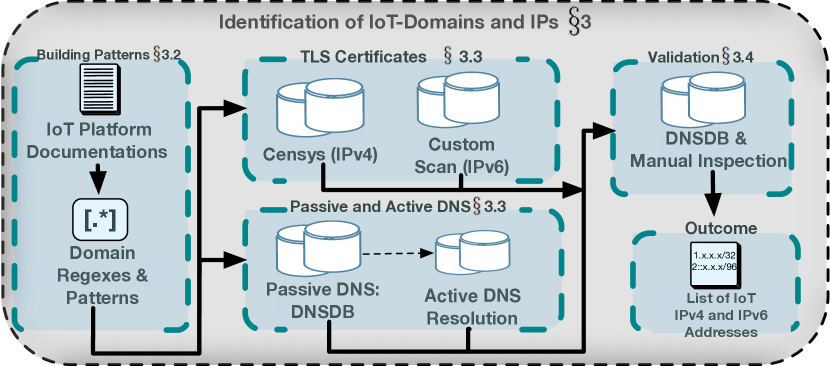
In this section, we discuss how we use a diverse set of sources, including documentation by IoT providers, active and passive DNS measurements, and IPv4/IPv6 scans to identify the set of backend IPs of each IoT backend provider, see Figure 2.
3.1. Selection of IoT Backend Providers and Study Periods
To compile a list of IoT backend providers, we consider the popular ones that were mentioned in previous studies (Jia et al., 2020). We also expand this list by considering IoT backends operated by other major manufacturers, e.g., Cisco, Huawei, and Siemens, and cloud providers, e.g., Oracle, Tencent, and SAP. The complete list of the IoT backend providers in our study is presented in Table 1. By some accounts, for example, the IoT platform market research report by IoT analytics (Analytics, 2021), these IoT backend providers are in the top 17 in terms of estimated revenue and are responsible for more than 90% of the total revenue.111Note that these reports are not peer-reviewed and we use their reported IoT backend revenue only for a rough estimation of their market share. We use neither the ranking nor or the revenue of these companies in our methodology.
We focus on the week starting from February 28 at midnight and ending on March 7, 2022. We also collect preliminary results (only IPv4) for December 3 to 10, 2021. Since the results are consistent, we focus on the week starting in February for all but Section 6.1.
3.2. Identification of IoT Domain Patterns
For each IoT backend provider, we start by identifying the domain names and the
IP prefixes that are used for the backend. This information is often contained in their publicly available documentation since IoT vendors and device programmers need it. When a backend provider explicitly discloses their IPs, we
use them for our validation (see Section 3.4). Typically,
IoT backend domains follow a well-defined form
<subdomain>.<region>.<secondlevel-domain>,
where:
- •
-
•
<region> indicates the full name or code of a city, a country, a region, or a continent;
-
•
<second-level-domain> is either the second-level domain name of the parent company of the IoT backend provider or a special domain name allocated for the IoT backend.
However, some providers, e.g., Google, use the same fully qualified domain names (FQDNs) for all of their customers. In such cases, we use these FQDNs. In Table 1 we report the 16 IoT platforms for which we were able to generate regular expressions for their IoT backend domain names using their official documentation.
We leverage the structure of the IoT backend domain names to generate the regular expressions. If the ¡subdomain¿ part of the IoT domain is a unique value, e.g., a hash or a random string, we replace it with a regex wildcard. Similarly, we replace the ¡region¿ part of the IoT domains with appropriate regex terms that match the naming scheme of the different regions of the provider. Note that we also obtain the naming schemes for the regions of the providers from their documentation. Finally, we concatenate the regex terms with the ¡second-level-domain¿ to create the regular expressions. See Appendix A for examples.
| Backend Provider Name [Source] | # AS | # IPv4 /24 (IPv6 /56) | # Locations | # Countries | Protocols (Ports) | Strategy |
|---|---|---|---|---|---|---|
| Alibaba IoT (Alibaba, 2022b, d, c) | 2 | 73 (2) | 27 | 13 | MQTT(1883), HTTPS(443), CoAP(5682) | DI |
| Amazon IoT (Amazon, 2022; AWS, 2022b, d) | 4 | 9,000 (20) | 18 | 15 +Anycast | MQTT(8883, 443), HTTPS(443, 8443) | DI |
| Baidu IoT (Baidu, 2022b, a, 2022) | 2 | 26 (1) | 2 | 1 | MQTT(1883, 1884, 443), HTTP(80, 443), CoAP(5682, 5683) | DI |
| Bosch IoT Hub (Bosch, 2022) | 1 | 290 (0) | 1 | 1 | MQTT(8883), HTTPS(443), AMQP(5671), CoAP(5684) | PR |
| Cisco Kinetic (Cisco, 2022; Cisco Kinetic, 2022) | 2 | 14 (0) | 4 | 2 | MQTT(8883, 443), TCP(9123, 9124) | PR |
| Fujitsu IoT (Fujitsu, 2022) | 1 | 2 (0) | 2 | 1 | MQTT(8883), HTTPS(443) | DI |
| Google IoT core (Google, 2022, 2022) | 1 | 114 (11) | 77 | 14 | MQTT(8883,443), HTTPS(443) | DI |
| Huawei IoT (Huawei, 2022) | 1 | 26 (0) | 2 | 1 | MQTT(8883, 443), HTTPS(8943), CoAP(NA) | DI |
| IBM IoT (IBM, 2022b, a) | 2 | 116 (0) | 12 | 8 | MQTT(8883, 1883), HTTP(S)(80,443) | DI |
| Microsoft Azure IoT Hub (Azure, 2022; Microsoft Azure, 2022) | 1 | 282 (0) | 39 | 16 | MQTT(8883), HTTPS(443), AQMP(5671), | DI |
| Oracle IoT (Oracle, 2022b, a) | 3 | 67 (0) | 10 | 8 | MQTT(8883), HTTPS(443) | DI+PR |
| PTC ThingWorx (PTC, 2022) | 3 | 881 (0) | 10 | 8 | Protocol Agnostic | PR |
| SAP IoT (SAP, 2022a, b) | 6 | 2.929 (0) | 7 | 5 | MQTT(8883), HTTPS(443) | PR |
| Siemens Mindsphere (Siemens, 2022b, a) | 4 | 126 (1) | 3 | 3 +Anycast | MQTT(8883), HTTPS(443), OPC-UA | PR |
| Sierra Wireless (Sierra Wireless, 2022a, c, b) | 4 | 7 (2) | 4 | 4 | MQTT(8883,1883), HTTP(S)(80,443), CoAP(5682,5686) | PR |
| Tencent IoT (Tencent, 2022b, a) | 5 | 47 (2) | 5 | 4 | MQTT(8883,1883), HTTP(S)(80,443), CoAP(5684) | DI |
3.3. Identification of Server IPs
Next, we use the above regular expressions to identify the IPs of possible IoT backend servers. Hereby, we rely on two complementary techniques. First, we take advantage of the information available in TLS certificates. Second, we use passive DNS data, namely, DNSDB (Farsight Security, 2017; Weimer, 2005). Finally, we complement the data with an additional active DNS dataset.
TLS Certificates. Censys (Durumeric et al., 2015) continuously scans the IPv4 address space. In addition to scanning for open ports across a wide range of port numbers, it performs protocol-specific handshakes to collect banners; and it provides metadata, e.g., geolocation. These results are published on a daily basis. Motivated by the previous results (Gigis et al., 2021), we use daily snapshots matching our study period to identify certificates with domains that match our regular expressions. The corresponding IPs are IoT backend provider IPs. Note, we only use certificates (Cangialosi et al., 2016; Chung et al., 2016) that are valid during the study period.
During our study period, Censys scans only IPv4 addresses. To identify IPv6 addresses, we run active measurements using various IPv6 hitlists (Gasser et al., 2018). Our hitlists include IPv6 addresses that showed activity for popular IoT ports, i.e., 443 (HTTPS), 8883 (MQTT), 1883 (MQTT), and 5671 (AMQP). We add support for these IoT protocols to ZGrab2 (Durumeric, 2018) and we use it to collect TLS certificates from these IPv6 addresses. We perform this data collection from a server located in Europe. For a discussion on ethical considerations, we refer to Section 3.7.
DNS. We complement the above data with DNS data because scanning services typically only download the default certificates. In some cases, scanning services may not even be able to download the certificates, i.e., if the IoT backend provider (e.g., Google) requires to supply the domain name via the Server Name Indication (SNI) extension. In addition, other IoT backend providers, such as Amazon, require the installation of a client certificate, in particular, for IoT protocols. In the absence of this certificate, the TLS handshake will fail.
DNS is another source of data for mapping domain names to IPs. DNSDB is a passive DNS database that contains historical DNS queries and replies for both IPv4 and IPv6 from multiple resolvers around the globe. We choose DNSDB as it supports regular expressions and time-range queries. For each IoT platform, we use DNSDB to collect all IPv4/IPv6 addresses in the response for queries where the domain name matches the regular expressions for the IoT platform, and the query was issued within our study period. In addition, during our study period, we also performed daily active DNS resolutions for all domains identified via DNSDB (see Section 3.7 for ethical considerations). To perform these resolutions, we use three locations: two in Europe and one in the United States. Compared to a single location, using three vantage points increases our IP address coverage by 17%.
3.4. Validation of Server IPs
At this point, we have identified IPs related to IoT backend services. However, we do not know if they are used exclusively for IoT services or if they also host other services, e.g., Web services. In addition, we validate the accuracy and coverage of discovered IP addresses against ground truth for three IoT backend providers.
Shared vs. Dedicated IPs: To identify IP addresses in our candidate sets that also provide services unrelated to IoT, we use a methodology similar to the one by Saidi et al. (Saidi et al., 2020) and Iordanou et al. (Iordanou et al., 2018). For each candidate IP, we use DNSDB to identify all the domain names that resolve to that particular IP. Next, we count the number of domains that do not match the IoT domain pattern, but map to the IP. If this count exceeds a threshold, we assume that it is not exclusively used to offer IoT backend services. Through this process, we detect IoT backend providers that use CDNs or host non-IoT services. While choosing the threshold, we discover that Google uses two different sets of IPs: one exclusively for IoT MQTT traffic and another for HTTPS traffic that is also used for other Google services. In our IoT traffic flow analysis (Section 5) we focus only on those parts of the infrastructure that are exclusively used for IoT.
Validation Against Ground Truth: While not all IoT backend providers publicly share their used IP ranges, three of them do this at least partially. Our methodology identified all the publicly listed IP addresses for Cisco and Siemens. Microsoft lists network prefixes for its IoT backend service, which correspond to more than 12,000 IPv4 addresses. Using our methodology, we identify 484 of these IPs. All of them are within the listed prefixes. We conduct a study using traffic data from a large European ISP, see Section 5, and check the traffic to the listed prefixes. We only identify 52 IPs that are active. Out of these, our methodology misses only 4 IPs which leads to an underestimation of the IoT traffic volume of less than 1%.
3.5. Contribution of Each Dataset
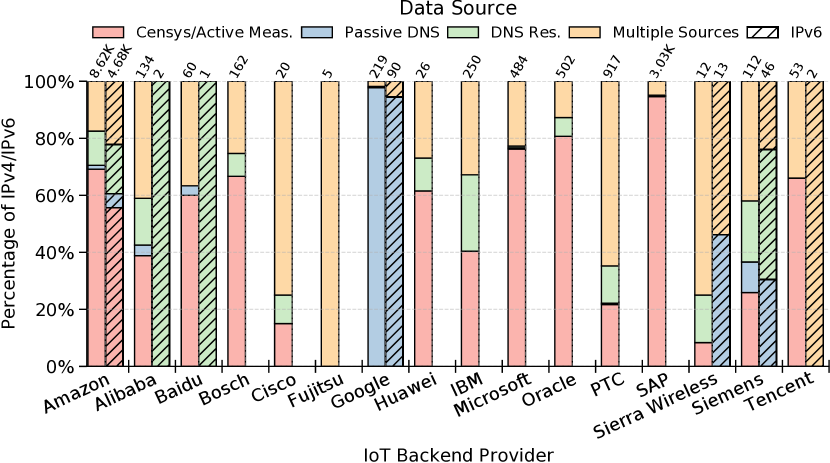
Using as baseline the data collected on February 28, 2022, in Figure 3 we show the contribution of each data source grouped per IoT provider. The plot includes both IPv4 and IPv6 backends—the bar for IPv6 is shaded. We distinguish IPs extracted from “TLS Certificates” (discovered via Censys), our IPv6 scans, “Passive DNS” (discovered via DNSDB), “Active DNS” (identified via our active resolutions), and “Multiple Sources” (addresses discovered by at least two methods).
First, we notice that some of the IoT backend providers only support IPv4 addresses. Second, there is no consistency regarding a preferred data source. For example, when using only Censys data, we detect all IPs of the IoT backends for Microsoft, SAP, and Tencent. But, we identify less than 2% of the Google IPs. The reason for this is that Google is using TLS SNI. Thus, a majority of Google’s IoT platform IPs are discovered using passive DNS. The contribution of passive DNS is also substantial (more than 5%) for Siemens, Alibaba, and Sierra Wireless (IPv6). Our active DNS resolution is able to discover close to 20% of Alibaba (IPv4), Amazon AWS, Huawei, Bosch, Cisco, IBM, PTC, Siemens, and Sierra Wireless, as well as the few Alibaba IPv6 server addresses. For the rest of this paper, except if noted otherwise, we use the combined results of all techniques.
3.6. Limitations
The first limitation of our methodology relates to the stability of the IoT domain patterns. IoT backend providers constantly update their service infrastructure. This means that the patterns need to be regularly updated. Moreover, not all providers publicly release their documentation. When the documentation is not available, we do not try to identify those IPs due to ethical concerns.
The second limitation is that some providers might not use TLS for their services (Alibaba, 2022a). This might heavily impact the usefulness of TLS scans, such as the Censys dataset. This limitation motivated us to augment the scan data with DNS data. Still, even DNSDB has its own limitations, e.g., it does not have full coverage of all DNS requests.
Third, we leverage passive traffic data from an ISP in Europe to analyze IoT traffic in the wild. Naturally, the vantage point’s location might influence the overall IoT traffic that we see.
3.7. Ethical Considerations
Active IPv6 Scanning. During the design and application of our methodology, we took care to minimize any potential harm to the operation of routers and networks. First, the load measurement is very low, i.e., a single packet per destination. We also performed a randomized spread of load at each target IPv6 in the hitlist. Moreover, we coordinated with our local network administrators to ensure that our scanning did not harm the local or upstream network.
For the active scanning, we use best current practices (Durumeric et al., 2013; Partridge and Allman, 2016; Dittrich et al., 2012) to ensure that our prober IP address has a meaningful DNS PTR record. We run a Web server with experiment and opt-out information that responds to DNS resolution of the DNS PTR domain. During our active experiments, we did not receive any complaints or opt-out requests.
DNS Resolution. We perform daily active DNS resolutions for all domains identified via DNSDB. We make sure that the load in the DNS resolvers is low, i.e., we allow ten seconds before subsequent resolution, and we utilize all the available resolvers. To perform these resolutions, we used three locations, two in Europe and one in the United States. All the locations were well-connected to the Internet, and our resolutions added negligible additional load to the network.
External Data. We applied for research accounts to both Censys and DNSDB. The accounts allowed us to query and download the data that had been collected, i.e., active IP and port scans, TLS certificates, and passive DNS requests and responses. We also read the public documentation of IoT backend companies without using any automatic download or web scraping tool.
ISP Data. The ISP’s NetFlow setup explicitly captures header data only and no payload for operational purposes. The data is processed in situ and on the ISP’s premise. Following best operational practices, the NetFlow data is deleted at an expiration date set at the data collection time. For our analysis, no data is copied, transferred, or stored outside the dedicated servers that the ISP uses for NetFlow analysis.
Since parts of the NetFlow data can be used as Personal Identifiable Information (PII) for subscriber lines they are anonymized. More specifically, the data is anonymized by the BGP prefix before the data hits the disc. We also note that to minimize spoofing, the ISP uses best common practices, including network ingress filtering according to BCP 38 (P. Ferguson and D. Senie, 2000). To avoid IoT backend provider blocklisting and any leakage of information related to traffic or the number of served subscriber lines, we agree to the terms for data analysis proposed by the European ISP, and therefore we anonymize the names of all IoT backend providers when discussing ISP traffic.
4. IoT Backend Characterization
In this section, we provide insights regarding the deployment strategies of IoT backend providers for their Internet-facing gateways that enable the communication between the IoT devices and the backend’s internal systems.
4.1. Stability of IoT Backends
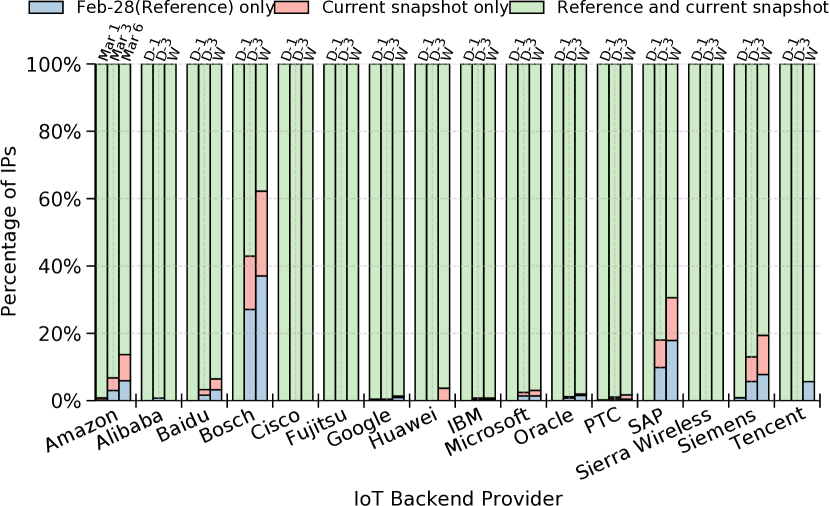
Before we dive into the characterization of the IoT backend deployments, we evaluate how stable the set of discovered IoT backend server IPs—the gateways—is across time. This gives us information on how frequently we have to repeat our measurements. Using our weekly dataset, in Figure 4, we highlight changes in the daily IoT backend server addresses per IoT backend. Our reference date is the first day, February 28, 2022. The first bar for each backend compares it to the next day, namely, March 1. We distinguish between IPs that are in both sets (green bar), that are newly discovered (red), and those that are only in the first set (blue). The other two bars are for March 3 and March 6.
We find hardly any change between the first two days. For most IoT backends, there is also hardly any change within one week. This indicates that a weekly measurement suffices. However, there are some exceptions, i.e., Amazon AWS, Bosch, SAP, and Siemens. This is because these, at least partially, rely on shared public cloud infrastructure, as we show later. Their IP set is more volatile, e.g., due to service scaling or service migration. However, this is not necessarily the case as some cloud providers (Amazon, 2022) offer static IPs. As such, the IoT backend IP usage also depends on the IoT company strategy. We use all IPs discovered during the weekly study period for the remainder of this section.
4.2. Footprint
For the following reasons, it may be important for an IoT backend provider to have a presence in multiple physical locations. First, having a footprint in multiple datacenters and points of presence (PoPs) minimizes the impact of outages, physical disasters, or attacks on a subset of them (.Yap et al., 2017). Second, datacenters from different regions are useful for coping with regional demands and can improve application performance. Third, it is increasingly important that datacenters for IoT backends are available in different regions to comply with regulations regarding transferring, processing, and storing data. For example, in the EU, the General Data Protection Regulation (GDPR) poses constraints regarding data leaving EU borders.
We use a number of heuristics to infer the footprint of each IoT backend. Many of the IoT backends, e.g., Google (Google, 2022) and Baidu (Baidu, 2022), encode the location in the domain name. Typically they use either city level, e.g., two or three letters, or airport codes. Others, e.g., Amazon (AWS, 2022d), Alibaba (Alibaba, 2022), and Huawei (Huawei, 2022), use region codes in the domain name that can be mapped to cities using their documentation. Using such hints, we are able to determine the footprint of all IoT backends, except Oracle and a small subset of IPs. For these, we use multiple sources, including the location of prefix announcements from Hurricane Electric, Censys geolocation information, and pings from traceroute looking glasses to locate each IoT backend server IP. Typically, all alternatives point to the same location. In less than 7% of cases, these sources report different locations, in which case we use the majority vote.
The results, see Table 1, show that the large majority of the IoT backend providers use multiple locations in at least two countries. However, there are exceptions: Baidu’s and Huawei’s backends are located only in China. This is surprising given that Baidu and Huawei operate datacenters around the world. Still, our extensive analysis allows no other conclusion.
Bosch offers a diverse range of IoT-related products, including machine learning, data analysis, and device management. These components rely on multiple public cloud providers in multiple locations around the globe, and each component has to be purchased individually. The Bosch IoT Hub component is the only one that offers a frontend for IoT devices. Therefore, we restrict our study to the locations and affiliated servers of the Bosch IoT hub, and it has a single location.
IoT backend providers use different deployment strategies ranging from using Dedicated Infrastructure (DI) to Public Cloud Resources (PR). We say that an IoT backend uses DI if all its identified IP addresses are announced by an Autonomous System that is managed by the backend. If the IP addresses are announced by a cloud provider or CDN, we refer to it as PR. Of our sixteen IoT backend providers, nine rely on dedicated infrastructure while six rely on public cloud providers. Bosch IoT Hub, Cisco Kinetic, and Sierra Wireless on Amazon Web Services (AWS). PTC relies on the AWS and Microsoft clouds. SAP IoT and Siemens Mindsphere rely on AWS, Microsoft, as well as Alibaba. Such diversity enables providers to improve their footprint and offer services in many regions around the globe. The last IoT backend provider—Oracle—expands his own dedicated infrastructure by leasing resources from Akamai (we label this as DI+PR).
4.3. Network Diversity
First of all, we notice that the use of IPv6 is relatively low. We discover IPv6 IoT backend server addresses for only seven of the 16 IoT backend providers. Hereby, Alibaba offers IPv6 only in China, and Microsoft explicitly states in its documentation that it does not yet support IPv6. Overall, the number of discovered addresses is substantially smaller for IPv6 than IPv4, see Table 1.
Network diversity, i.e., reachability of IoT backends via multiple ASes or prefix diversity, is important to circumvent congestion, blocking, and network misconfiguration, to enable fast reroute, and improve performance. We use the RouteViews Prefix to AS mapping dataset from CAIDA (University of Oregon, 2022) to map IP addresses to prefixes and AS numbers. Our analysis shows that all IoT backend providers in our study use multiple, in some cases tens of prefix advertisements, typically from more than one AS. Thus, we can expect that short-term routing or availability disruption lead to minor service degradations. Indeed, given the many available IPs and prefixes, it should be possible to use DNS to redirect IoT requests to available and well-performing IoT backend servers. In Section 6, we revisit this hypothesis when studying a large-scale outage of one of the largest cloud providers.
Six IoT backend providers, Bosch, PTC, Siemens, SAP, Sierra Wireless, and Cisco, rely on one or more public cloud providers. This enables them to cope with the short-term unavailability of outages. Also, as mentioned earlier, Oracle uses its own dedicated infrastructure as well as that of a CDN. At least two IoT backend providers, Amazon IoT and Siemens, also use anycast or, more specifically, the Amazon Global Accelerator service (Amazon AWS, 2022). Anycast services aim to map IoT requests servers close to the client and cope with disruptions. This highlights that IoT backend providers care about reliability and diversity.
4.4. Protocol Support
In Table 1, we also report—per IoT backend provider—the supported protocols as listed in their documentation. They all claim to support MQTT, an often used protocol for IoT messaging. The protocol is lightweight, follows the publish-subscribe paradigm, and is designed for machine-to-machine communication. However, the IoT backend providers use different MQTT ports. Some use the default unencrypted MQTT port 1883. The majority uses the encrypted MQTT port 8883. Other providers also use non-standard ports, i.e., non-IANA assigned to a protocol. For example, for MQTT Baidu listens on port 1884. At least three IoT backends, i.e., Amazon, Baidu, and Google, use the secure Web port 443 for MQTT.
In addition, they often offer support for other IoT-specific protocols, including CoAP and AMQP. The ports vary, e.g., include 5682 and 5684 for CoAP. Baidu supports CoAP requests on multiple ports, i.e., 5682 and 5683. AMQP is the least popular protocol among our IoT backend providers and is offered on port 5671. We also observe some application-specific protocols, e.g., Siemens offers OPC-UA, while PTC offers a protocol-agnostic communication platform. The majority of the IoT backend providers also support Web protocols, namely HTTP on port 80 and/or HTTPS on port 443.
We conclude that IoT backend providers quite often use non-expected ports. Thus, purely probing the expected ports can be misleading. This is in line with recent results that observed unexpected applications running on servers (Izhikevich et al., 2021). The motivation for offering different ports even for the same IoT protocol, e.g., MQTT, may be to circumvent port blocking. This is likely the reason why MQTT service is offered on port 443 by some of the providers (Google, 2022).
5. IoT Traffic Flows
So far, we have used our methodology to understand the footprint of the IoT backends. Next, we use traffic information from a large European Internet Service Provider (ISP) to study IoT traffic patterns.
5.1. Vantage Point
Our vantage point is a major European ISP offering residential Internet IPv4 and IPv6 connectivity to more than fifteen million broadband subscriber lines. The ISP uses NetFlow (Cisco, 2012) to monitor the traffic flows at all border routers of its network, using a consistent sampling rate across all routers. This data is needed to support daily operations as well as network planning. For the ISP analysis, we anonymize all IoT company names (cf. Section 3.7).
Study Periods. For our IoT traffic flow analysis, we match the study periods for which we identify the footprint of the IoT platform providers, i.e., February 28 to March 7, 2022. In addition, we do a focused study during an outage, see Section 6, for December 3–10, 2021.
5.2. IoT Backend Platforms: Visibility
Our characterization of IoT backend providers has shown that they often rely on a global footprint to offer their services globally. Our first analysis, thus, focuses on the visibility of the IoT backend servers from our vantage point, i.e., the European residential ISP.
Our first validation check is whether any servers are within the address space of the residential ISP. This applies to none, which is expected as we study the traffic of subscriber lines. Our next check is for IoT backend infrastructure visibility from our vantage point, i.e., which fraction of the identified backend server IPs are contacted by subscriber lines of the ISP. Hereby, we do not expect that all servers are contacted as traffic localization, and other operational criteria within the IoT backends should map the ISP subscriber lines to a subset of their servers.
Exclusion of Scanners—Global Visibility. However, before proceeding, we have to exclude potential scanners within the ISP since their scan traffic may bias our estimation of the visible part of the IoT backend infrastructure. Scanners typically scan all or a substantial fraction of all IPv4 IPs, resp. IPv6 IPs of the IPv6 hitlist. Therefore, a subscriber line with a scanner is expected to send traffic to all IoT backend servers. Therefore, we exclude scanners from our analysis which is possible as the ISP uses spoofing prevention according to BCP 38 (P. Ferguson and D. Senie, 2000).
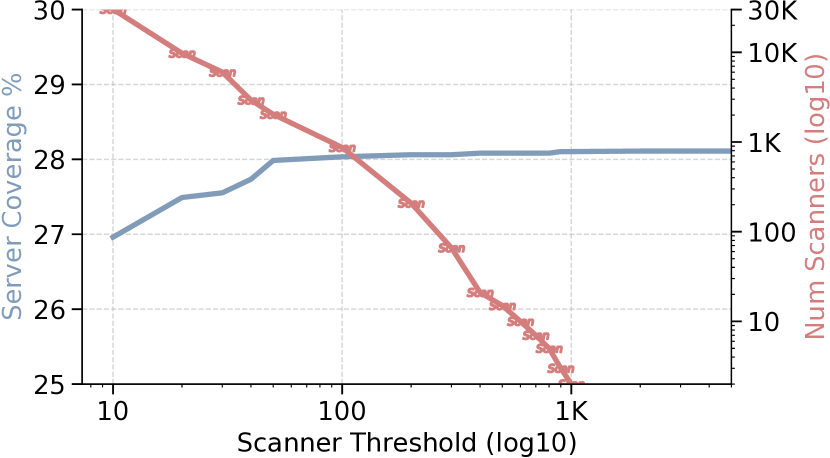
To identify scanners, we follow the method proposed by Richter et al. (Richter and Berger, 2019). For each day during our study period, we compute the fraction of IoT backend server IPs that a subscriber line contacts. A subscriber line is said to host a scanner if it contacts more than a threshold of the server IPs. Figure 5 shows the results both for server coverage as well as ISP subscriber lines with scanners for February 28, 2022. More precisely, we show how this fraction changes as we increase the strictness of our criteria for identifying scanners—the scanner threshold (x-axis). Hereby, our minimum scanner threshold is 10 IoT backend server IPs—a very strict selection criteria. We see that as we increase the scanner threshold, the number of scanners (red line and right y-axis) decreases substantially. Yet, the percentage of IoT backend servers that are visible does not increase drastically (blue line and left y-axis).
We consider some baseline numbers: with a scanner threshold of 10 roughly 27% of all identified IoT backend servers are visible while removing about 30k subscriber lines. Using a threshold of 100 leads to the removal of less than 800 subscriber lines per day while resulting in a visibility of IoT backend servers of approximately 28%. As households often deploy multiple IoT devices contacting 10 backend IoT IPs is still reasonable, as underlined by the large number of subscriber lines. However, 100 server IPs are unlikely. As such, for the rest of the paper, we use a scanner threshold of 100, which results in a daily visibility of roughly 28% of the identified IoT backend server IPs for IPv4 and 51% for IPv6 during our study period. Using this data, we identify more than 2.32 million IPv4 and 202k IPv6 ISP subscriber lines with IoT activity per day.
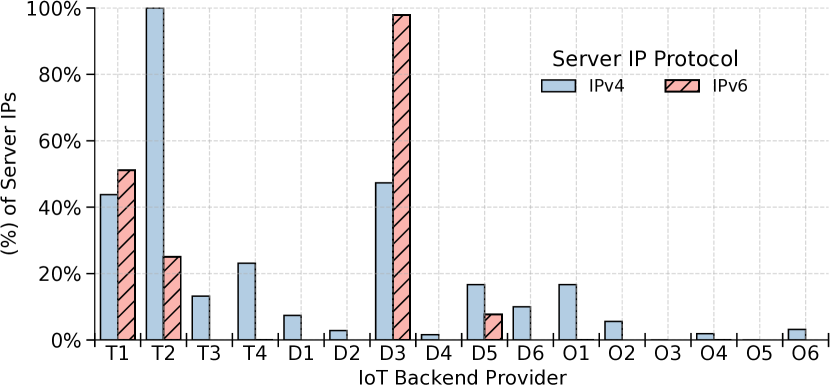
Visibility per IoT Backend Provider. Next, we investigate if the visibility of IoT backend server IPs is uniform across IoT platform providers. In Figure 6, we plot the percentage of visible servers for each platform for IPv4 as well as IPv6. As expected, the visibility varies substantially across the IoT backend providers. For most, it is relatively small, between 5% to 20%. As remote IoT backend servers should not be contacted by subscriber lines from a European residential ISP, this is to be expected. Recall our insights from Section 5.7 about the locations of the discovered IoT server IPs. Surprisingly, for two IoT backend providers, namely T1 and D3, we observe around half of the discovered IoT backend server IPs. Moreover, for one IoT backend provider, namely T2, almost all IoT backend server IPs are visible. This provider is also among the top-4 popular providers. On the other hand for two other platform providers, namely O5 and O3, we hardly find any activity. Since they are not focusing on the European residential market, we exclude them from our analysis in this section.
5.3. ISP Subscriber Line Activity by IoT Backend Platform
We find that a substantial fraction of ISP subscriber lines contact IoT backend platforms. This underlines that the residential ISP is a suitable vantage point.
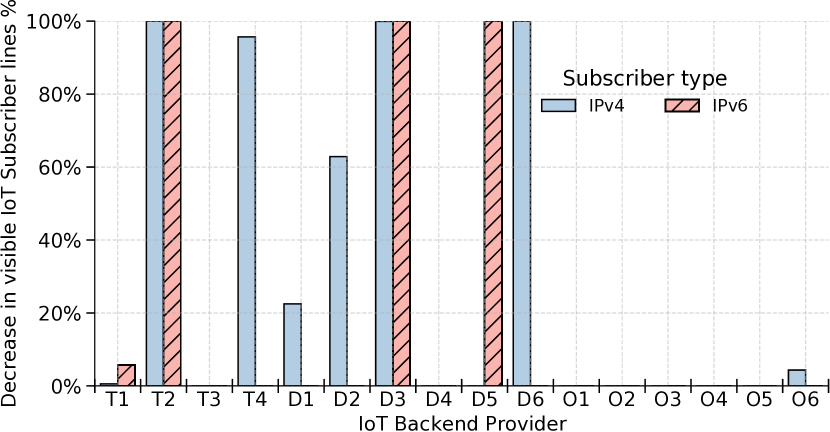
ISP Subscriber Lines—Visibility by Data Source. While we know that our different data sources increase the discovery of IoT platform server IPs, we do not yet know how important this is for discovering IoT traffic. Thus, we check the necessity of using different data sources, namely TLS certificates vs. passive and active DNS data. For this, we plot, in Figure 7, the decrease in discovered subscriber lines with IoT traffic when we rely only on TLS certificate information gathered by active IP scans (the Censys data set). For some IoT platform providers, e.g., T4, D6, T2, and D3, almost none of the subscriber lines would have been detectable. Note that two of these are providers that rely on SNI.
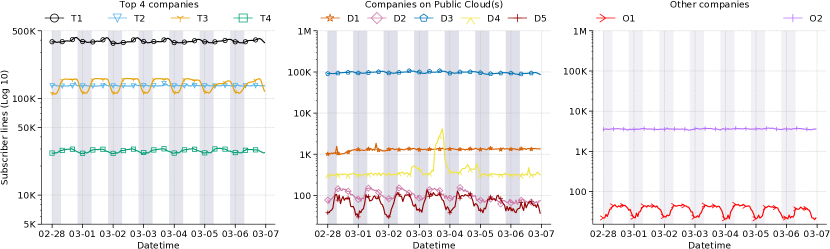
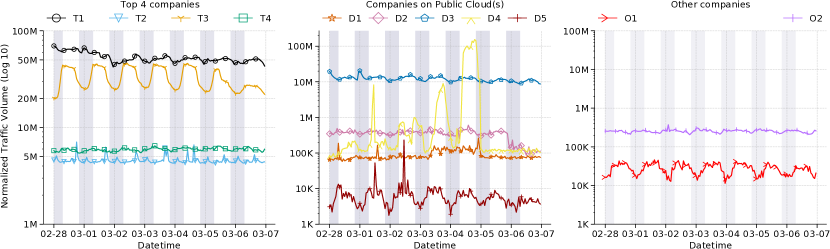
ISP Subscriber Lines—Activity across Time. Next, we explore how ISP subscriber line activity changes during our study, see Figure 8. It plots the hourly number of subscriber lines for each IoT backend provider across the week. To plot the subscriber line activity, we consider three subgroups of IoT backend providers, namely, the top-4 per revenue, the ones that depend on cloud providers, and the remaining ones. We only include those with at least 15 subscriber lines per hour.
Figure 8 (left) shows the activity of the top-4 IoT backend providers. We use light shading for the night—8 pm to 8 am local time—to help in identifying the time of day effects. First, the level of subscriber line activity differs substantially—in fact, by orders of magnitude. Some have a clear diurnal pattern, e.g., T3, while others, e.g., T2, are more or less constant. We also observe that the peak time differs among these IoT backend providers. The peak time for T1 and T4 is during prime time, i.e., between 6–10 pm, while for T3, it is constant during the day, i.e., between 8 am and 8 pm. We attribute this to the type of services that IoT devices offer and how often they communicate with their IoT backend providers. For example, some IoT devices are likely to be used at home for entertainment during prime time, while others offer services that are used at any point in time.
Next, we move to those IoT backend providers that rely on the public clouds, see Figure 8 (center). Again, we see a large difference in their usage across the board. Moreover, their activity does not correlate to the one of the platform providers (plot not shown). Similar observations hold for the remaining IoT backend providers, see Figure 8 (right).
5.4. IoT Backend Traffic
Next, we look at traffic levels. Here, we observe similar patterns as in the IoT subscriber lines analysis which is expected as many of the IoT applications are triggered by subscriber lines activity.
IoT Backend Traffic—Downstream Volume. We find that the relative traffic volume level changes substantially, see Figure 9. It shows the normalized downstream traffic volume for the same groups of IoT backend providers as before, namely, top-4, public cloud dependent, and others. We notice that the traffic volume per subscriber line differs substantially. On the one hand, even though the number of observed subscriber lines differs by an order of magnitude for T1 and T3 their total traffic levels are relatively close to each other. On the other hand, even though T2 and T3 are serving a similar number of subscriber lines, their traffic volume differs by more than a magnitude. The reason for this is that the traffic demands of IoT devices depend on the applications. Thus, we conclude that the number of subscriber lines served by IoT backend providers is not a good indicator for the downstream traffic volume level of the provider. This holds for all IoT backend providers that we study.
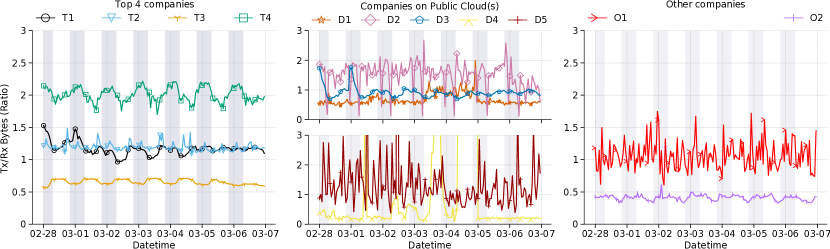
IoT Backend Provider Traffic—Traffic Ratio. We also notice that the downstream and the upstream traffic demands of IoT applications differ. Some of the IoT applications are heavy upstream, e.g., video surveillance, while others are heavy-downstream, e.g., online media streaming. This is reflected in the IoT backend traffic. In Figure 10, we plot the ratio of downstream vs. upstream traffic for the IoT backend providers of our study. Values above 1 indicate that the IoT backend provider sends more traffic to the IoT devices than it receives. Our analysis highlights that IoT backend providers differ. In all three groups, namely, top-4, public cloud dependent, and the rest, we can find heavy downstream as well as heavy upstream ones. Indeed, there is no particular pattern to it. The ratios range from less than 0.33 to more than 3, which shows that there is substantial asymmetry in the downstream vs. upstream ratio. Moreover, we do not notice correlations between the ratios and the number of observed subscriber lines nor the downstream traffic level.
5.5. IoT backend provider—Port Usage
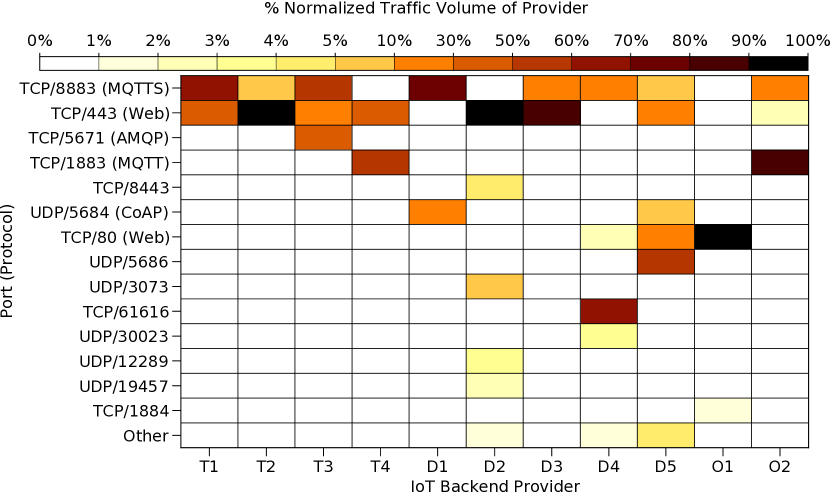
Next, we explore which network ports the IoT devices are using. Are they relying on general-purpose application layer network protocols such as HTTP or HTTPS, or are they using IoT-specific application protocols? Accordingly, Figure 11 shows the application layer protocol mix as identified by IANA assigned port numbers for each IoT backend provider, i.e., the percentage of traffic for each application protocol. Again, there is no single pattern that describes all IoT backend providers.
Many utilize the popular Web secure ports, e.g., 443, typically over TCP. Its usage varies from 5% up to 90%. IoT-specific protocols, e.g., MQTT, are also popular. However, which MQTT port is used differs across IoT backend providers. IANA assigns port 1883 for the non-secure version and port 8883 for MQTT over TLS. However, recall that some IoT backend providers, as per their documentations, also offer MQTT service over non-standard ports such as 1884 or even 443. The reasons for serving MQTT over non-standard ports include the reduction of attack surface by reducing discovery probability via scans and circumvention of firewalls that block standard MQTT.
We find that secure MQTT over its standard port is quite popular and used by more than 50% of all studied IoT backend providers. Other popular IoT protocols include CoAP and AMQP. Similar to MQTT, some providers offer CoAP over non-standard ports, e.g., the neighboring ports 5686 and 5682. For UDP/5686, we do observe activity. For one provider, namely D4, we see that it exchanges substantial traffic volume over port TCP/61616. This port number is the default port number of the popular messaging software, Apache ActiveMQ (Apache ActiveMQ, 2022), which processes messages sent via IoT-specific protocols such as MQTT and AMQP. We further observe a number of UDP ports above 10000 in use by various IoT backend providers.
Overall, this diverse port usage confirms previous insights (Izhikevich et al., 2021) that port scanning and protocol handshake do not suffice to uncover IoT backend server infrastructure. In addition, to capture IoT-related protocols, it is not sufficient to aggregate traffic of IoT-specific protocols, as this misses a substantial part of the IoT traffic, e.g., the one served using HTTP(s) ports.
5.6. Traffic Characteristics
We also investigate the characteristics of the traffic exchanged between subscriber lines and IoT backend providers. This is an important test to validate that this traffic is not generic Web traffic or video streaming of popular applications that can be misinferred as IoT-related traffic.
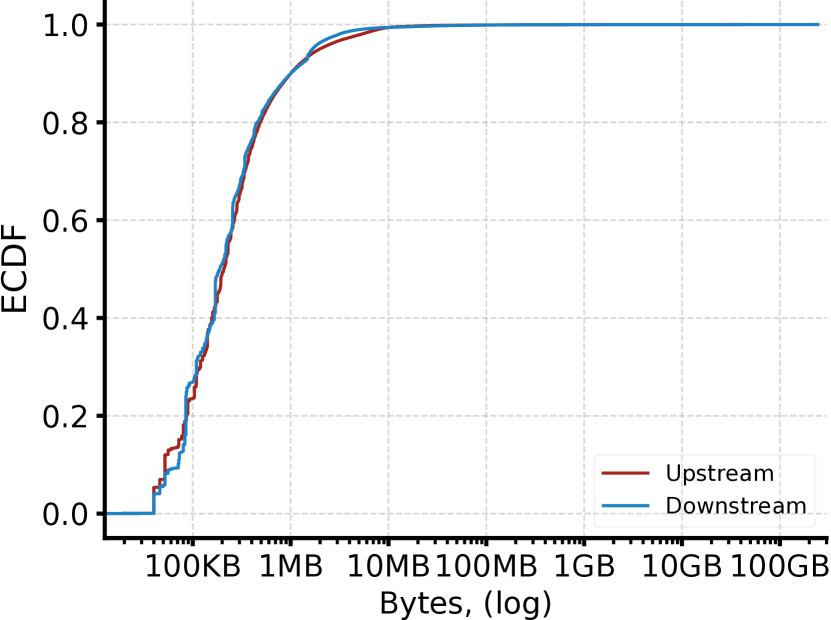
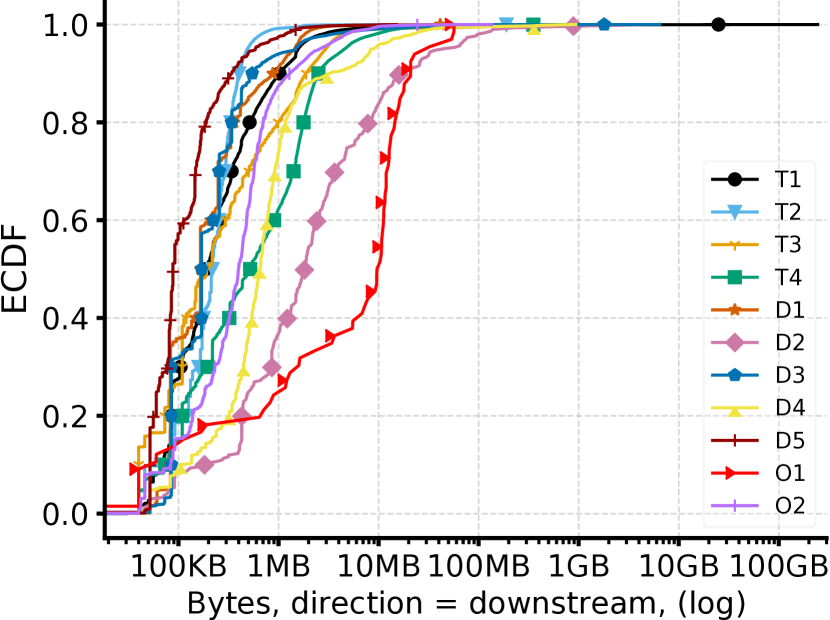
In Figure 12(a), we plot the empirical cumulative distribution function (ECDF) of the estimated traffic exchanged in a day between a subscriber line and all the IoT backend providers we consider in our study. We estimate the exchanged traffic considering the sampling rate. We plot both the download and upload traffic exchanged, as some applications may be download-dominant or upload-dominant. Our analysis shows that for the vast majority (more than 99%) of the subscriber lines, both the upload and download traffic exchanged with all the IoT providers is less than 10 MB per day. This value is substantially lower than the reported traffic consumed by smart TVs or residential users, which is no less than 1 GB per day (Varmarken et al., 2020, 2022; Mazhar and Shafiq, 2020). Thus, we conclude that the traffic exchanged between subscriber lines and IoT providers is unlikely to be general Web or popular application video traffic.
Then, we investigate if any of the IoT providers we consider in our study deviates from the above mentioned behavior and offers general Web or popular video streaming applications in the identified prefixes. In Figure 12(b), we plot the empirical CDF for the estimated traffic exchanged in a day between a subscriber line and each of the IoT backends we consider in our study for the download traffic volume. Although there are differences across IoT providers, the general observation is that the vast majority of the exchanged traffic is relatively low, i.e., less than 10 MB per day. Thus, the IoT backend servers for each of the IoT backend providers we consider in our study are unlikely to be used for general Web or popular video traffic. Similar observations are made when we analyze the upstream traffic.
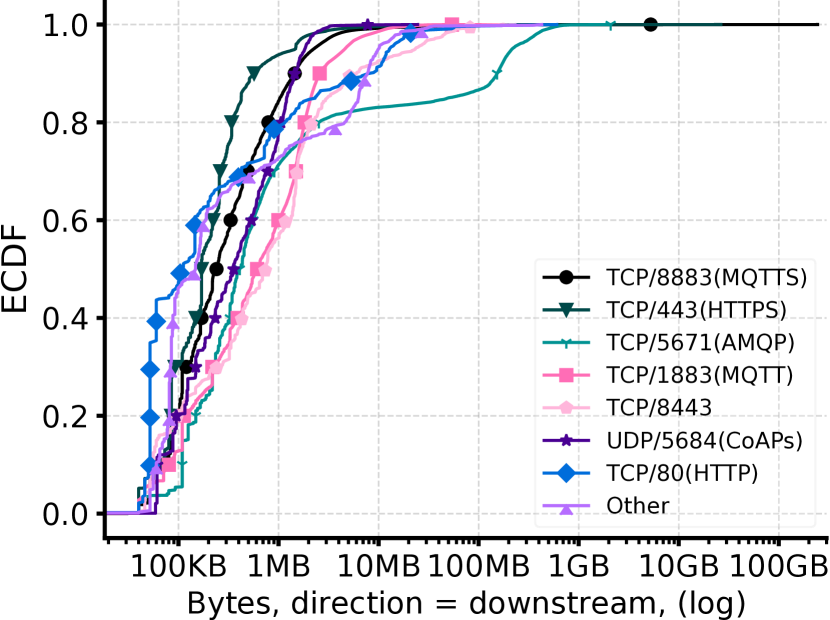
Finally, we investigate if the traffic exchanged using specific ports indicates the exchange of heavy traffic. In Figure 12(c) we plot the traffic exchanged between subscriber lines and IoT backend providers for the most popular ports in our study. We consider the downstream direction and the top-7 ports that contribute to more than 95% of the exchanged traffic and the aggregation of the rest of the ports. Our analysis shows that there is only one port, namely, port 5671 (this port is registered with IANA for the secure version of the AMQP protocol), where around 18% of the subscriber lines exchange between 100 MB and 1 GB per day. The high traffic volume exchanged is observed only in one of the IoT providers, and it is a very small fraction of the overall traffic we observe in our measurements. Similar observations are made when we analyze the upstream traffic. We conclude that the vast majority of the traffic exchanged at different ports between the subscriber lines and IoT backend providers do not resemble the general Web or popular video traffic.
5.7. Crossing Region Borders
Since the recent EU General Data Protection Regulation (GDPR) poses restrictions on the transfer of data outside the EU, and since the transfer of data to remote servers may impact the performance of delay-sensitive applications, we next study how many of the European ISP’s subscriber lines with IoTs contact IoT servers outside of Europe. Hereby, we take advantage of the location information collected for each IoT backend server IP.
In Figure 13 we visualize the percentage of IoT-hosting subscriber lines, see left-side of plot, that exchange traffic with IoT backend servers in different regions, namely, Europe, the US, Asia, and others. Our analysis shows that slightly less than half, i.e., around 47% of the IoT-hosting subscriber lines communicate exclusively with IoT backend servers located in Europe. Around 40% of the IoT-hosting subscriber lines contact IoT backend servers in the US. Around 10% of the IoT-hosting subscriber lines contact a mix of locations from the EU and US. Around 3% of the IoT-hosting subscriber lines are contacting only IoT backend servers in Asia or other regions.
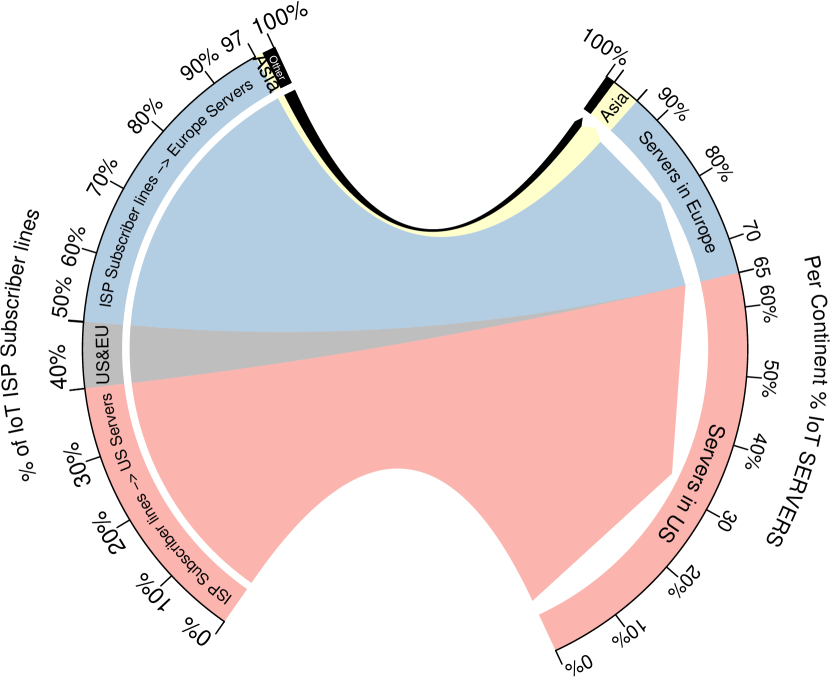
On the right-hand side of the plot, we visualize the percentage of IoT servers that are hosted per continent. We see that the IoT backend servers in Europe are a minority of contacted servers, only around 30%. Indeed, the majority of the IoT backend servers, i.e., around 65%, are located in the US. Around 5% of the IoT backend servers are located in Asia, and a very small fraction elsewhere. We conclude that around half of the IoT-hosting subscriber lines in the European ISP contact IoT backend servers located in Europe, although they account for less than one-third of the IoT backend servers identified in our study.
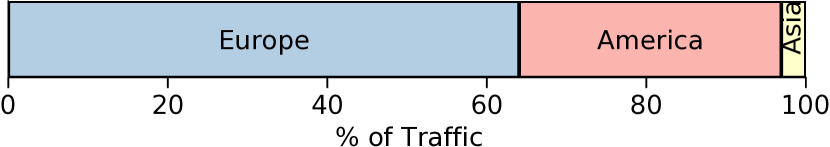
With regard to exchanged traffic volume between subscriber lines and IoT backend servers, we notice that the majority of the traffic stays in Europe. In Figure 14, we plot the percentage of traffic exchanged between subscriber lines and IoT backend servers annotated by location. The largest traffic fraction, more than 62%, is exchanged between subscriber lines in Europe with servers in Europe. However, around 35%—a substantial fraction—is exchanged with servers in the US (where the majority of the IoT backend servers are located). As such, IoT traffic is less localized than one may have expected given the regulations of GDPR.
6. IoT Backend Disruptions
In this section, we consider actual as well as potential disruptions to IoT backend providers.
6.1. AWS Outage
During the time when we collected preliminary results (Dec. 3–10, 2021), a major outage happened within the infrastructure of one of the major cloud providers. More precisely, on December 7, 2021, Amazon Web Services, a cloud provider that is heavily used by the IoT backend providers we study, experienced a large-scale outage (Amazon AWS, 2021; Soper and Gillum, 2021; Villemez, 2021; Greene, 2021) of its US-East-1 service region (located in Northern Virginia). This outage affected many popular websites and Internet services. Thus, we examine the effect of this outage on the traffic flows of the IoT backend providers.
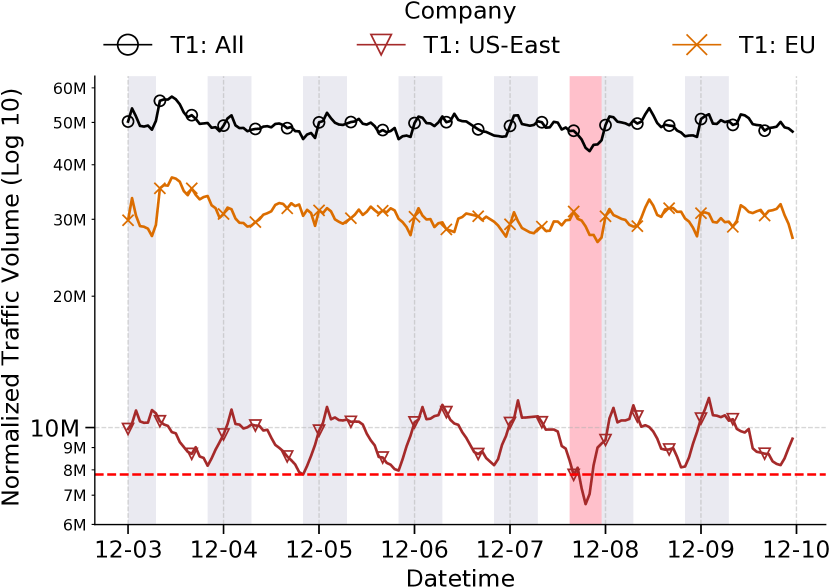
Impact on T1 ISP traffic flows. First, we analyze the outage’s effect on the traffic from the T1 IoT platform to the ISP’s subscribers. Figure 15 shows T1’s normalized downstream traffic volume towards the ISP as well as the normalized volume for two different AWS service regions, namely US east and EU—aggregating the traffic of all US east resp. EU availability zones. During the outage (highlighted with red background) there is a substantial traffic drop—more than 14.5% for the US east coast region. Indeed, the total traffic volume is substantially lower than the minimum observed traffic volume of the previous week (red line). This highlights that cloud outages such as the one by AWS do not only affect Web services (Soper and Gillum, 2021; Villemez, 2021; Greene, 2021) but also IoT services (Steger, 2021; Akhtar, 2021). When looking at the total traffic as well as the traffic from the EU sites, we notice only slight dips. One reason is that the EU region services more than three times more traffic than the US east coast region. Still, the fact that there is a drop even for traffic in the EU region indicates some interdependencies between the regions.
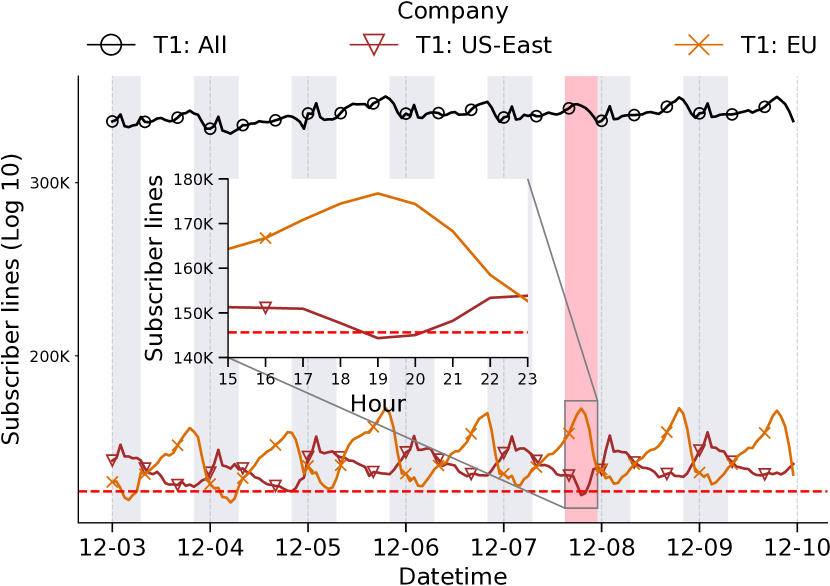
Impact on T1 subscriber lines. Next, we check how these traffic volumes relate to the number of ISP subscriber lines that contact IoT servers in these AWS regions, see Figure 16. Again the red background highlights the outage, and the horizontal line corresponds to the minimum number of subscriber lines of the previous week. We see no impact for the EU region but a slight decrease for the US East coast region. One may ask why this decrease is so small. The reason is that we still observe the attempts of the IoT devices to contact the servers in their assigned AWS regions. Thus, the downstream traffic is lower, but the number of subscriber lines does not change drastically. Still, it decreases, which indicates that some of them stopped trying, we did not observe them due to their decreased traffic volume or because they are remapped to other regions.
Impact on D1–D6. Next, we explore if the outage also affected the IoT backend providers that rely on AWS or the T1 IoT platform. We find hardly any effect, as the subscriber lines of these platforms are mainly mapped to the EU AWS regions.
6.2. Potential Disruptions
Possible disruptions that we study for the week starting in Feb. 2022 are connectivity problems due to routing and or IP filtering based on blocklists.
Connectivity problems. Such problems include routing problems such as BGP leaks, or BGP hijacks as well as AS outages. We rely on Cisco’s BGPStream service, which provides historical information about BGP hijacks, leaks, and outages (Cloud, 2022). It identified 10 BGP leaks, 40 possible BGP hijacks, and 166 AS outages. None of these affected any of the identified IoT backend server IPs nor the ASes they are hosted in.
IP Filtering. Next, we check how likely it is that a backend becomes unreachable as a consequence of appearing in a blocklist. Here, we take advantage of the FireHOL project(Porject, 2022), which generates a list of suspicious addresses, by combining information from popular blocklists. In Feb. 2022, the FireHOL blocklist contained over 610M IPv4 addresses extracted from 67 blocklists222We excluded one of the blocklists as it is known that it is not carefully maintained, see https://github.com/pushinginertia/ip-blacklist/issues/9, and is, thus, likely to produce false positives.. Using daily blocklists matching our study period, we check if the server IPs are included in any of the blocklists. We identified 16 such IPs. The non-exclusive reason for their inclusion in the blocklist are: Four are associated with open-proxies and anonymizing services, one is linked to malware, and five are associated with network attacks/spam. Moreover, nine originate from a personal blocklist333https://graphiclineweb.wordpress.com/tech-notes/ip-blacklist/. These IPs belong to 6 of our IoT backend providers, namely, Baidu (5 IPs), Microsoft (4 IPs), SAP (4 IPs), Google (3 IPs), Amazon (2 IPs), and Alibaba (1 IP).
7. Concluding Remarks
IoT device population, as well as application complexity, have increased substantially over the last decade. An ecosystem of IoT backend providers has been established to cope with the IoT-specific demand. Our study takes advantage of the significant market consolidation (Wegner, 2021)—less than twenty IoT backend providers are responsible for more than 90% of the market share. These IoT backend providers are either IoT vendors or large cloud providers offering services tailored to IoT developer needs. Our study focuses on 16 IoT backend providers, including the top 10.
Discovery of the Internet-facing part of the IoT backends is a challenging task, as pure IP-port scanning misses a significant share of the addresses for many IoT backend providers. Indeed, we find that the port usage differs substantially across IoT providers. It is not unusual for IoT protocols, e.g., MQTT, to use non-standard ports or to reuse Web ports. The latter makes the identification of IoT backend infrastructure as well as IoT traffic challenging. However, fusing data from publicly available documentation, certificate data from active scanning, with passive and active DNS data allows us to unveil a detailed map of IoT backend servers.
Our study shows that IoT backend providers’ deployment strategies differ substantially. While the footprints of most of them cover many geographical regions, some are present in only one location. Yet, others are utilizing anycast. Since this impacts service performance, it should impact IoT backend provider selection. Moreover, regulatory compliance (e.g., GDPR and data sovereignty compliance monitoring) related to IoT data transfer, storage location, and processing also plays an increasingly important role when selecting an appropriate IoT backend. Surprisingly, around a third of the IoT traffic in our study is exchanged with servers in different continents, although it could have been served from within the region of the IoTs. This raises questions regarding the configuration of applications and best practices when developing IoT applications, and it also raises questions regarding reliability. We find that a major outage of a cloud provider impacted some IoT services.
We also observe that six providers rely on another IoT backend provider to expand their footprint or outsource IoT backend functionalities. Thus, outages that occur unexpectedly can have cascading effects. For the one outage we studied in detail, this did not happen as these providers used the regional service, which was not affected by the outage. Still, it is a wake-up call to add flexibility and re-routing opportunities to handle IoT backend disruptions, e.g., outages, attacks, misconfigurations, blocklists.
Our methodology also offers a scalable and lightweight approach to estimate the popularity of IoTs and shed light on IoT application activity. This is possible without the need to derive per IoT device/manufacturer signatures using, e.g., instrumented testbeds. However, the methodology may also misclassify the traffic that goes beyond the IoT if the IoT backend providers reuse this infrastructure for other purposes and is not detectable by our DNS-based method. Moreover, the IoT backend providers’ customers may also use this infrastructure, e.g., the MQTT servers, for non-IoT applications. Our traffic analysis highlights that the IoT population and activity per application differ vastly. While some applications behave more like the typical user-generated traffic, i.e., diurnal patterns, peak evening hours, and are downstream-heavy, this is not the case for all IoT applications. In fact, some popular IoT applications’ traffic peaks during the day.
Looking ahead, we expect that the importance of IoT backend providers will continue to increase as new IoT devices are constantly being added to the Internet. As such, continuous monitoring of their footprint and related traffic flows is crucial not just for compliance reasons but also to understand how IoT is changing the Internet.
Acknowledgments
We thank the anonymous reviewers and our shepherd Lorenzo De Carli for their constructive feedback. We are grateful to Censys (Durumeric et al., 2015) and Farsight Security (Farsight Security, 2022) for providing us research access to their datasets. This work was supported in part by the European Research Council (ERC) Starting Grant ResolutioNet (ERC-StG-679158), the Atracción de Talento grant (Ref. 2020-T2/TIC-20184), funded by Madrid regional government, and by the SCUM Project (RTI2018-102043-B-I00) MCIN/AEI/10.13039/ 501100011033/ERDF.
References
- (1)
- Akhtar (2021) A. Akhtar. 2021. Furious customers blast Amazon as an outage knocks Ring doorbells, baby monitors, and Alexa products offline. https://www.businessinsider.com/ring-home-monitoring-services-down-aws-outage-2021-12.
- Alibaba (2022a) Alibaba. 2022a. Access IoT Platform by using HTTP. https://www.alibabacloud.com/help/en/iot-platform/latest/access-iot-platform-by-using-http.
- Alibaba (2022b) Alibaba. 2022b. IoT Platform. https://www.alibabacloud.com/product/iot.
- Alibaba (2022c) Alibaba. 2022c. IPv6-based MQTT connections. https://partners-intl.aliyun.com/help/en/iot-platform/latest/ipv6-based-mqtt-connections.
- Alibaba (2022d) Alibaba. 2022d. Protocols for connecting devices . https://partners-intl.aliyun.com/help/en/iot-platform/latest/protocols-for-connecting-devices.
- Alibaba (2022) Alibaba. 2022. Regions and zones. https://www.alibabacloud.com/help/en/basics-for-beginners/latest/regions-and-zones.
- Alrawi et al. (2019) O. Alrawi, C. Lever, M. Antonakakis, and F. Monrose. 2019. SoK: Security Evaluation of Home-Based IoT Deployments. In IEEE S&P.
- Amazon (2022) Amazon. 2022. AWS IoT Platform. https://aws.amazon.com/iot/.
- Amazon (2022) Amazon. 2022. Elastic IP addresses. https://docs.aws.amazon.com/AWSEC2/latest/UserGuide/elastic-ip-addresses-eip.html.
- Amazon AWS (2021) Amazon AWS. 2021. Summary of the AWS Service Event in the Northern Virginia (US-EAST-1) Region. https://aws.amazon.com/message/12721/.
- Amazon AWS (2022) Amazon AWS. 2022. AWS Global Accelerator. https://aws.amazon.com/global-accelerator/.
- Analytics (2021) IoT Analytics. 2021. 2020 List of IoT Platforms Companies. https://iot-analytics.com/product/list-of-iot-platform-companies.
- Antonakakis et al. (2017) M. Antonakakis, T. April, M. Bailey, M. Bernhard, E. Bursztein, J. Cochran, Z. Durumeric, J. A. Halderman, L. Invernizzi, M. Kallitsis, D. Kumar, C. Lever, Z. Ma, J. Mason, D. Menscher, C. Seaman, N. Sullivan, K. Thomas, and Y. Zhou. 2017. Understanding the Mirai Botnet. In USENIX Security Symposium.
- Apache ActiveMQ (2022) Apache ActiveMQ. 2022. Apache ActiveMQ Artemis. https://activemq.apache.org/components/artemis/documentation/1.4.0/.
- Arnold et al. (2020) T. Arnold, J. He, W. Jiang, M. Calder, I. Cunha, V. Giotsas, and E. Katz-Bassett. 2020. Cloud Provider Connectivity in the Flat Internet. In ACM IMC.
- AWS (2022a) Amazon AWS. 2022a. Amazon Personalize. https://aws.amazon.com/personalize/.
- AWS (2022b) Amazon AWS. 2022b. Device communication protocols. https://docs.aws.amazon.com/iot/latest/developerguide/protocols.html.
- AWS (2022c) Amazon AWS. 2022c. Machine Learning on AWS. https://aws.amazon.com/machine-learning/.
- AWS (2022d) Amazon AWS. 2022d. Regions and Zones. https://docs.aws.amazon.com/AWSEC2/latest/UserGuide/using-regions-availability-zones.html.
- Azure (2022) Microsoft Azure. 2022. Azure IoT Hub. https://azure.microsoft.com/en-us/services/iot-hub.
- Baidu (2022a) Baidu. 2022a. IoT Core. https://cloud.baidu.com/doc/IOT/index.html.
- Baidu (2022b) Baidu. 2022b. IoT Platform. https://intl.cloud.baidu.com/product/iot.html.
- Baidu (2022) Baidu. 2022. Region - IoT services related product area information. https://intl.cloud.baidu.com/doc/Reference/s/2jwvz23xx-en.
- Bosch (2022) Bosch. 2022. Bosch IoT Hub: protocol-adapters. https://docs.bosch-iot-suite.com/hub/how-to/protocol-adapters/.
- Cangialosi et al. (2016) F. Cangialosi, T. Chung, D. Choffnes, D. Levin, B. M. Maggs, A. Mislove, and C. Wilson. 2016. Measurement and analysis of private key sharing in the https ecosystem. In ACM CCS.
- Chung et al. (2016) T. Chung, Y. Liu, D. Choffnes, D. Levin, B. M. Maggs, A. Mislove, and C. Wilson. 2016. Measuring and applying invalid SSL certificates: The silent majority. In ACM IMC.
- Cisco (2012) Cisco. 2012. Introduction to Cisco IOS NetFlow - A Technical Overview. https://www.cisco.com/c/en/us/products/collateral/ios-nx-os-software/ios-netflow/prod_white_paper0900aecd80406232.html.
- Cisco (2022) Cisco. 2022. Cisco Kinetic. https://developer.cisco.com/site/kinetic/.
- Cisco Kinetic (2022) Cisco Kinetic. 2022. IoT Platform. https://developer.cisco.com/docs/GMM/#!requirements/requirements.
- Cloud (2022) Cisco Crosswork Cloud. 2022. BGPStream. https://bgpstream.crosswork.cisco.com/.
- D. Kumar and K. Shen and B. Case and D. Garg and G. Alperovich and D. Kuznetsov and R. Gupta and Z. Durumeric (2019) D. Kumar and K. Shen and B. Case and D. Garg and G. Alperovich and D. Kuznetsov and R. Gupta and Z. Durumeric. 2019. All Things Considered: An Analysis of IoT Devices on Home Networks. In USENIX Security Symposium.
- Dang et al. (2021) T. K. Dang, N. Mohan, L. Corneo, . Zavodovski, J. Ott, and J. Kangasharju. 2021. Cloudy with a Chance of Short RTTsAnalyzing Cloud Connectivity in the Internet. In ACM IMC.
- DeKoven et al. (2019) L. F. DeKoven, A. Randall, A. Mirian, G. Akiwate, A. Blume, L.K. Saul, A. Schulman, G.M. Voelker, and S. Savage. 2019. Measuring Security Practices and How They Impact Security. In ACM IMC.
- Dittrich et al. (2012) D. Dittrich, E. Kenneally, et al. 2012. The Menlo Report: Ethical Principles Guiding Information and Communication Technology Research. U.S. Department of Homeland Security (2012).
- Dubois et al. (2020) D. J. Dubois, R. Kolcun, A. M. Mandalari, M. T. Paracha, D. Choffnes, and H. Haddadi. 2020. When Speakers Are All Ears: Characterizing Misactivations of IoT Smart Speakers. In Privacy Enhancing Technologies Symposium (PETS).
- Durumeric (2018) Z. Durumeric. 2018. ZGrab2. https://github.com/zmap/zgrab2.
- Durumeric et al. (2015) Z. Durumeric, D. Adrian, A. Mirian, M.Bailey, and J. A. Halderman. 2015. A Search Engine Backed by Internet-Wide Scanning. In ACM CCS.
- Durumeric et al. (2013) Z. Durumeric, E. Wustrow, and J. A. Halderman. 2013. ZMap: Fast Internet-Wide Scanning and its Security Applications. In USENIX Security Symposium.
- European Commission (2021) European Commission. 2021. Commission strengthens cybersecurity of wireless devices and products. https://single-market-economy.ec.europa.eu/news/commission-strengthens-cybersecurity-wireless-devices-and-products-2021-10-29_en.
- European Commission (2022) European Commission. 2022. State of the Union: New EU cybersecurity rules ensure more secure hardware and software products. https://ec.europa.eu/commission/presscorner/detail/en/ip_22_5374.
- European Union (2018) European Union. 2018. Data protection in the EU, The General Data Protection Regulation (GDPR); Regulation (EU) 2016/679. https://ec.europa.eu/info/law/law-topic/data-protection/.
- Farsight Security (2017) Farsight Security. 2017. DNSDB. https://www.dnsdb.info/.
- Farsight Security (2022) Farsight Security. 2022. https://www.farsightsecurity.com/.
- .Feng et al. (2018) X. .Feng, Q. Li, H. Wang, and L. Sun. 2018. Acquisitional Rule-based Engine for Discovering Internet-of-Things Devices. In USENIX Security.
- Fujitsu (2022) Fujitsu. 2022. Fujitsu IoT. https://iot-docs.jp-east-1.paas.cloud.global.fujitsu.com/en/manual/v7/apireference_en.pdf.
- Gasser et al. (2018) O. Gasser, Q. Scheitle, P. Foremski, Q. Lone, M. Korczynski, S. D. Strowes, L. Hendriks, and G. Carle. 2018. Clusters in the Expanse: Understanding and Unbiasing IPv6 Hitlists. In ACM IMC.
- Gigis et al. (2021) P. Gigis, M. Calder, L. Manassakis, G. Nomikos, V. Kotronis, X. Dimitropoulos, E. Katz-Bassett, and G. Smaragdakis. 2021. Seven Years in the Life of Hypergiants’ Off-Nets. In ACM SIGCOMM.
- Google (2022) Google. 2022. AI and machine learning products. https://cloud.google.com/products/ai.
- Google (2022) Google. 2022. Google Cloud IoT solutions. https://cloud.google.com/solutions/iot.
- Google (2022) Google. 2022. Google Cloud Locations. https://cloud.google.com/about/locations.
- Google (2022) Google. 2022. Publishing over the MQTT: MQTT Server. https://cloud.google.com/iot/docs/how-tos.
- Greene (2021) J. Greene. 2021. Amazon’s cloud-computing unit problems take down websites, services. https://www.washingtonpost.com/technology/2021/12/07/aws-outage-websites-offline/.
- Haddadi et al. (2018) H. Haddadi, V. Christophides, R. Teixeira, K. Cho, S. Suzuki, and A. Perrig. 2018. SIOTOME: An edge-ISP collaborative architecture for IoT security. In IoTSec.
- Hamza et al. (2018) A. Hamza, D. Ranathunga, H. H. Gharakheili, M. Roughan, and V. Sivaraman. 2018. Clear as MUD: Generating, Validating and Applying IoT Behavioral Profiles. In ACM SIGCOMM 2018 Workshop on IoT Security and Privacy.
- He et al. (2022) X. He, Y. Yang, W. Zhou, W. Wang, P. Liu, and Y. Zhang. 2022. Fingerprinting Mainstream IoT Platforms Using Traffic Analysis. IEEE Internet of Things Journal 9, 3 (2022), 2083–2093.
- Huang et al. (2020) D. Y. Huang, N. Apthorpe, G. Acar, F. Li, and N. Feamster. 2020. IoTInspector: Crowdsourcing Labeled Network Traffic from Smart Home Devices at Scale. In ACM IMWUT / Ubicomp.
- Huawei (2022) Huawei. 2022. Huawei Cloud Regions and Endpoints. https://developer.huaweicloud.com/intl/en-us/endpoint.
- Huawei (2022) Huawei. 2022. IoTDA. https://www.huaweicloud.com/product/iothub.html.
- IBM (2022a) IBM. 2022a. Connect your device to Watson IoT Platform. https://cloud.ibm.com/docs/IoT/index.html#step2.
- IBM (2022b) IBM. 2022b. IoT Solutions. https://www.ibm.com/cloud/internet-of-things.
- Iordanou et al. (2018) C. Iordanou, G. Smaragdakis, I. Poese, and N. Laoutaris. 2018. Tracing Cross Border Web Tracking. In ACM IMC.
- Izhikevich et al. (2021) L. Izhikevich, R. Teixeira, and Z. Durumeric. 2021. LZR: Identifying Unexpected Internet Services. In USENIX Security Symposium.
- Izhikevich et al. (2022) L. Izhikevich, R. Teixeira, and Z. Durumeric. 2022. Predicting IPv4 Services Across All Ports. In ACM SIGCOMM.
- Jia et al. (2020) Y. Jia, L. Xing, Y. Mao, D. Zhao, X. Wang, S. Zhao, and Y. Zhang. 2020. Burglars’ IoT Paradise: Understanding and Mitigating Security Risks of General Messaging Protocols on IoT Clouds. In IEEE S&P. 465–481.
- Kappel et al. (2022) G. Kappel, C. Brecher, M. Brockmann, and I. Koren. 2022. Internet of Production: Entering Phase Two of Industry 4.0. Comm. of the ACM (2022).
- Mazhar and Shafiq (2020) M. H. Mazhar and Z. Shafiq. 2020. Characterizing Smart Home IoT Traffic in the Wild. In IEEE/ACM IoTDI.
- Microsoft Azure (2022) Microsoft Azure. 2022. IoT Hub IP addresses. https://docs.microsoft.com/en-us/azure/iot-hub/iot-hub-understand-ip-address.
- Oracle (2022a) Oracle. 2022a. About the IoT Connectivity Protocols. https://docs.oracle.com/en/cloud/paas/iot-cloud/develop/iot-connectivity-protocols.html.
- Oracle (2022b) Oracle. 2022b. Oracle Internet of Things Cloud Service. https://docs.oracle.com/en/cloud/paas/iot-cloud/index.html.
- P. Ferguson and D. Senie (2000) P. Ferguson and D. Senie. 2000. Network Ingress Filtering: Defeating Denial of Service Attacks which employ IP Source Address Spoofing. Internet Requests for Comments (RFC) 2827.
- Partridge and Allman (2016) C. Partridge and M. Allman. 2016. Ethical Considerations in Network Measurement Papers. Commun. ACM (2016).
- Perdisci et al. (2020) R. Perdisci, T. Papastergiou, O. Alrawi, and M. Antonakakis. 2020. IoTFinder: Efficient Large-Scale Identification of IoT Devices via Passive DNS Traffic Analysis. In IEEE European Symposium of Security and Privacy.
- Porject (2022) FireHOL Porject. 2022. FireHOL IP Lists — IP Blacklists — IP Blocklists — IP Reputation. https://iplists.firehol.org/.
- PTC (2022) PTC. 2022. ThingWorx IIoT Solutions Platform. https://www.ptc.com/en/products/thingworx.
- Ren et al. (2019) J. Ren, D. J. Dubois, D. Choffnes, A. M. Mandalari, R. Kolcun, and H. Haddadi. 2019. Information Exposure From Consumer IoT Devices: A Multidimensional, Network-Informed Measurement Approach. In ACM IMC.
- Reuters (2002) Reuters. 2002. Draft EU rules target smart devices with cybersecurity risks. https://www.reuters.com/technology/draft-eu-rules-target-smart-devices-with-cybersecurity-risks-2022-09-08/.
- Richter and Berger (2019) P. Richter and A. Berger. 2019. Scanning the Scanners: Sensing the Internet from a Massively Distributed Network Telescope. In ACM IMC.
- Rula et al. (2020) J. P. Rula, P. Richter, G. Smaragdakis, and A. Berger. 2020. Who’s left behind? Measuring Adoption of Application Updates at Scale. In ACM IMC.
- Saidi et al. (2020) S. J. Saidi, A. M. Mandalari, R. Kolcun, H. Haddadi, D. J. Dubois, D. Choffnes, G. Smaragdakis, and A. Feldmann. 2020. A Haystack Full of Needles: Scalable Detection of IoT Devices in the Wild. In ACM IMC.
- Saidi et al. (2022) S. J. Saidi, S. Matic, O. Gasser, G. Smaragdakis, and A. Feldmann. 2022. Deep Dive into the IoT Backend Ecosystem artifacts. https://github.com/saidjawad/iot-backend.
- SAP (2022a) SAP. 2022a. SAP Internet of Things. https://www.sap.com/products/iot-data-services.html.
- SAP (2022b) SAP. 2022b. SAP IoT Device Connectivity. https://help.sap.com/docs/SAP_IoT/226d46a15bb245b7bf8126604bd6f0fb/9c7273450a874772ad2db007ce212a79.html?version=2112b.
- Shodan (2022) Shodan. 2022. Search Engine for the Internet of Everything. https://www.shodan.io/.
- Siemens (2022a) Siemens. 2022a. MindConnect API. https://documentation.mindsphere.io/MindSphere/apis/connectivity-mindconnect/api-mindconnect-overview.html#access.
- Siemens (2022b) Siemens. 2022b. MindSphere Documentation. https://siemens.mindsphere.io/en/docs/documentation-overview.
- Sierra Wireless (2022a) Sierra Wireless. 2022a. Getting Started with AirVantage Platform. https://source.sierrawireless.com/airvantage/av/howto/gettingstarted/.
- Sierra Wireless (2022b) Sierra Wireless. 2022b. How to configure my infrastructure when devices are in a private APN? https://source.sierrawireless.com/airvantage/av/reference/register/howtos/configureInfrastructureForPrivateAPN/.
- Sierra Wireless (2022c) Sierra Wireless. 2022c. Introduction to MQTT. https://source.sierrawireless.com/airvantage/av/reference/hardware/protocols/mqtt/.
- Sivanathan et al. (2019b) A. Sivanathan, H. H. Gharakheili, F. Loi, A. Radford, C. Wijenayake, A. Vishwanath, and V. Sivaraman. 2019b. Classifying IoT Devices in Smart Environments Using Network Traffic Characteristics. IEEE Transactions on Mobile Computing 18, 8 (2019).
- Sivanathan et al. (2019a) A. Sivanathan, H. H. Gharakheili, and V. Sivaraman. 2019a. Inferring IoT Device Types from Network Behavior Using Unsupervised Clustering. In IEEE Conference on Local Computer Networks (LCN).
- Soper and Gillum (2021) S. Soper and J. Gillum. 2021. Amazon says software problem was at root of huge Internet outage this week. https://fortune.com/2021/12/10/amazon-software-problem-cloud-outage-cause/.
- Srinivasa et al. (2021) S. Srinivasa, J. M. Pedersen, and E. Vasilomanolakis. 2021. Open for hire: attack trends and misconfiguration pitfalls of IoT devices. In ACM IMC.
- Steger (2021) I. Steger. 2021. How Amazon Outage Left Smart Homes Not So Smart After All. https://www.bloomberg.com/news/articles/2021-12-08/amazon-outage-sparks-anger-as-fridges-stop-people-locked-out.
- Tencent (2022a) Tencent. 2022a. Device Connection Regions. https://intl.cloud.tencent.com/document/product/1105/42712.
- Tencent (2022b) Tencent. 2022b. IoT Hub. https://intl.cloud.tencent.com/document/product/1105.
- Trimananda et al. (2020) R. Trimananda, J. Varmarken, A. Markopoulou, and B. Demsky. 2020. Packet-Level Signatures for Smart Home Devices. In NDSS.
- University of Oregon (2022) University of Oregon. 2022. Routeviews Project. http://www.routeviews.org/.
- Varmarken et al. (2022) J. Varmarken, J. Al Aaraj, R. Trimananda, and A. Markopoulou. 2022. FingerprinTV: Fingerprinting Smart TV Apps. Privacy Enhancing Technologies Symposium (PETS).
- Varmarken et al. (2020) J. Varmarken, H. Le, A. Shuba, A. Markopoulou, and Z. Shafiq. 2020. The TV is Smart and Full of Trackers:Measuring Smart TV Advertising and Tracking. Privacy Enhancing Technologies Symposium (PETS).
- Villemez (2021) C. Villemez. 2021. AWS Outage Analysis: December 7, 2021. https://www.thousandeyes.com/blog/aws-outage-analysis-dec-7-2021.
- Wegner (2021) W. Wegner. 2021. IoT Platform Companies Landscape 2021/2022: Market consolidation has started. https://iot-analytics.com/iot-platform-companies-landscape/.
- Weimer (2005) F. Weimer. 2005. Passive DNS Replication. In 17th Annual FIRST Conference.
- .Yap et al. (2017) K .Yap, M. Motiwala, J. Rahe, S. Padgett, M. Holliman, G. Baldus, M. Hines, T. Kim, A. Narayanan, A. Jain, V. Lin, C. Rice, B. Rogan, A. Singh, B. Tanaka, M. Verma, P. Sood, M. Tariq, M. Tierney, D. Trumic, V. Valancius, C. Ying, M. Kallahalla, B. Koley, and A. Vahdat. 2017. Taking the Edge off with Espresso: Scale, Reliability and Programmability for Global Internet Peering. In Proceedings of the Conference of the ACM Special Interest Group on Data Communication (Los Angeles, CA, USA) (SIGCOMM ’17). Association for Computing Machinery, New York, NY, USA, 432–445. https://doi.org/10.1145/3098822.3098854
- Yeganeh et al. (2019) B. Yeganeh, R. Durairajan, R. Rejaie, and W. Willinger. 2019. How Cloud Traffic Goes Hiding:A Study of Amazon’s Peering Fabric. In ACM IMC.
- Yu et al. (2020) L. Yu, B. Luo, J. Ma, Z. Zhou, and Q. Liu. 2020. You Are What You Broadcast: Identification of Mobile and IoT Devices from (Public) WiFi. In USENIX Security.
- Zhou et al. (2019) W. Zhou, Y. Jia, Y. Yao, L. Zhu, L. Guan, Y. Mao, P. Liu, and Y. Zhang. 2019. Discovering and Understanding the Security Hazards in the Interactions between IoT Devices, Mobile Apps, and Clouds on Smart Home Platforms. In USENIX Security.
- Zirngibl et al. (2022) J. Zirngibl, L. Steger, P. Sattler, O. Gasser, and G. Carle. 2022. Rusty Clusters? Dusting an IPv6 Research Foundation. In ACM IMC.
| Provider Name | Data Source | Api Type | Regular Expression/Query |
|---|---|---|---|
| Huawei | DNSDB | Flexible Search | ..(iot-(coaps—mqtts—https—amqps—api—da).).+.myhuaweicloud.com.$/A |
| Amazon | DNSDB | Flexible Search | (.+)(.iot.)([[:alnum:]]+(-[[:alnum:]]+)+)?(.amazonaws.com.$)/A |
| Oracle | DNSDB | Flexible Search | (.+.—)(iot.)([[:alnum:]]+(-[[:alnum:]]+).)?(oraclecloud.com.$)/A |
| Baidu | DNSDB | Flexible Search | ..(iot.)([[:alnum:]]+(-[[:alnum:]]+).)?(baidubce.com.$)/A |
| Siemens | DNSDB | Flexible Search | .(.eu1.mindsphere.io.$)/A |
| Sierra Wireless | DNSDB | Flexible Search | (.+.—)(na.airvantage.net.$)/A |
| Bosch | DNSDB | Flexible Search | (.+.—)(bosch-iot-hub.com.$)/A |
| IBM | DNSDB | Flexible Search | (.+.—)(internetofthings.ibmcloud.com.$)/A |
| Microsoft | DNSDB | Flexible Search | (.+.—)(azure-devices.net.$)/A |
| Tencent | DNSDB | Flexible Search | (.+.—)(tencentdevices.com.$)/A |
| Tencent | DNSDB | Basic Search | rrset/name/.tencentdevices.com./A |
| DNSDB | Basic Search | rrset/name/mqtt.googleapis.com./A | |
| Cisco | DNSDB | Basic Search | rrset/name/.ciscokinetic.io./A |
| Amazon | Censys | String Search | .iot.us-east-2.amazonaws.com |
| Amazon | Censys | String Search | .iot.us-east-1.amazonaws.com |
| Amazon | Censys | String Search | .iot.us-west-1.amazonaws.com |
| Amazon | Censys | String Search | .iot.us-west-2.amazonaws.com |
| Huawei | Censys | String Search | .iot-mqtts.cn-north-4.myhuaweicloud.com |
| Alibaba | Censys | String Search | .iot-amqp.cn-shanghai.aliyuncs.com |
| Alibaba | Censys | String Search | .iot-as-http.cn-shanghai.aliyuncs.com |
| SAP | Censys | String Search | .iot.sap |
Appendix A IoT Backend Regular Expressions
This section provides an excerpt (i.e., less than 5%) of regular expressions for a subset of IoT Backend providers in Table 2. For working with DNS records, DNSDB offers two types of APIs, namely Flexible Search and Basic Search. A few sample queries that use our regular expressions are provided for each API type. For the full set of regular expressions, please see our released data (Saidi et al., 2022).