Measurement of AGN dust extinction based on the near-infrared flux variability of WISE data
Abstract
We present the measurement of the line-of-sight extinction of the dusty torus for a large number of obscured active galactic nuclei (AGNs) based on the reddening of the colour of the variable flux component in near-infrared (NIR) wavelengths. We collected long-term monitoring data by Wide-field Infrared Survey Explorer (WISE) for 513 local AGNs catalogued by the Swift/BAT AGN Spectroscopic Survey (BASS) and found that the multi-epoch NIR flux data in two different bands (WISE and ) are tightly correlated for more than 90% of the targets. The flux variation gradient (FVG) in the and bands was derived by applying linear regression analysis, and we reported that those for unobscured AGNs fall in a relatively narrow range, whereas those for obscured AGNs are distributed in a redder and broader range. The AGN’s line-of-sight dust extinction () is calculated using the amount of the reddening in the FVG and is compared with the neutral hydrogen column density () of the BASS catalogue. We found that the ratios of obscured AGNs are greater than those of the Galactic diffuse interstellar medium (ISM) and are distributed with a large scatter by at most two orders of magnitude. Furthermore, we found that the lower envelope of the of obscured AGNs is comparable to the Galactic diffuse ISM. These properties of the can be explained by increase in the attributed to the dust-free gas clouds covering the line of sight in the broad-line region.
keywords:
infrared: galaxies – galaxies: nuclei – galaxies: Seyfert – quasars: general – galaxies: evolution1 Introduction
The unified model (e.g. Antonucci, 1993) has been interpreted as the structure of an active galactic nucleus (AGN) in which the dusty torus surrounds the supermassive black hole and accretion disc. The dusty torus is important for explaining the differences in optical spectra of AGNs, i.e., the Seyfert type, caused by a difference at the viewing angle to the AGN with the common structure.
The dusty torus can function as a mass reservoir for the central engine, supplying dust and gas. However, the radiation from the central engine will blow out most of the accreting materials into the circumnuclear region or intergalactic space as the AGN feedback (Fabian, 2012, for review). This radiation is considered to blow out not only the accreting material but also the interstellar medium in its host galaxy and finally suppress its star formation activity (Combes, 2017; Harrison, 2017), in addition to the growth of the central black hole. The feeding and feedback processes between the AGN and its host galaxy may account for their co-evolution over cosmic time, thus resulting in correlations between AGN and host–galaxy properties (e.g., Kormendy & Richstone, 1995; Magorrian et al., 1998; Kormendy & Ho, 2013).
Fabian et al. (2009) suggested that radiation pressure on dusty gas in an AGN depends on the dust abundance, hence it is one of the important parameters to yield some hints about the co-evolution. The optical extinction characterises the amount of dust in the line of sight, which is commonly attributed to the dusty torus. Optical spectroscopic analyses based on the flux ratios of two or more optical emission lines (e.g., Balmer decrement, Baker & Menzel, 1938; Ward et al., 1987; Gaskell, 2017) or the luminosity ratio of the broad H line and the hard X-ray (Shimizu et al., 2018) have been performed to measure the of the dusty torus for more than ten thousands of less-obscured AGNs (e.g., Jun et al., 2021, and citation therein). However, because of strong obscuration in the optical band, these methods based on optical observations are difficult to apply to obscured AGNs.
Emission lines in the near-infrared (NIR) band (e.g., the Paschen series) have been used to estimate the of several dozens of obscured AGN targets (e.g. Ward et al., 1987; Maiolino et al., 2001a; Schnorr-Müller et al., 2016). Alternatively, Burtscher et al. (2016) measured the colour temperature of NIR continuum emission for 29 AGNs—about a half of which are obscured AGNs—by the spectral fitting for the -band spectrum. They considered the average temperature measured for type-1–1.9 AGNs as the "intrinsic" value, without any intervening dust extinction, and estimated the of AGN samples by measuring the temperature decrease from the intrinsic value. They examined the ratio of the neutral hydrogen column density that was derived from X-ray spectral analysis (see Section 2.1) and the , and reported that is usually larger than the typical value of the Galactic diffuse interstellar medium (ISM) with large scatters, by at most two orders of magnitude, as has been presented in other studies (e.g. Maiolino et al., 2001a, b; Imanishi, 2001). Xu et al. (2020) derived the of 175 AGNs using the strength of the 9.7 m silicate feature and presented that the silicate strength is weakly correlated with with large scatters.
Winkler et al. (1992) presented the optical flux time variation of an AGN as another clue for measuring the without spectroscopic analyses. They calculated the flux variation gradient (FVG) using the monitoring data from bands, which is the ratio of the amplitude of flux variations in two different bands. They used regression analysis on the flux–flux plot to measure the FVG, which takes the flux data from two bands at the same epoch on the vertical and horizontal axes. They found that the FVGs for unobscured AGNs are nearly \textcolorblackthe same value in every target, which can be considered as the intrinsic FVG. The for each target was then calculated by measuring the reddening of the FVG relative to the intrinsic FVG. This method has the advantage of ignoring host-galaxy emission because it only uses the variable components of the optical flux that are attributed to the AGN.
The flux of the NIR continuum emission is also time variable, responding to that of the UV-optical continuum emission from the accretion disc (e.g., Suganuma et al., 2006; Koshida et al., 2014; Minezaki et al., 2019; Lyu et al., 2019; Yang et al., 2020). Such NIR emission is considered to be emitted particularly from the innermost region of the dusty torus, in which hot dust is heated to 1000–2000 K by the strong emission from the central engine (e.g., Barvainis, 1987; Lyu et al., 2017; Baskin & Laor, 2018). Glass (2004) investigated the colours of the variable NIR flux components of 41 AGNs—six are obscured AGNs—using monitoring data in JHKL bands. He demonstrated that the intrinsic NIR FVGs fall within moderately narrow ranges as for the optical FVG reported by Winkler et al. (1992). Accordingly, Glass (2004) mentioned that the FVG in NIR bands may be useful to estimate the dust extinction due to the outer torus for obscured AGNs, and applied his method to NGC1068.
In this study, we used NIR monitoring data from two bands to obtain the NIR FVGs of nearby obscured and unobscured AGNs. We estimated their line-of-sight optical extinction from the reddening of the NIR FVGs. Furthermore, by comparing these to determined using X-ray spectral analyses (Koss et al., 2017), we examined the correlation between them and compared it with the typical of the Galactic diffuse ISM. This paper is organised as follows: We describe the data, the AGN catalogue, and our sample selection in Section 2. Section 3 presents the flux–flux plot and the derivation of the NIR FVG in detail. We also present the results of our samples’ NIR FVG properties here. Section 4 explains how to convert the NIR FVG to the and demonstrates the results for our samples. We compare our results with the typical of the Galactic diffuse ISM in Sections 3 and 4. In Section 5, after comparing our estimate with other studies, the possible scenarios for explaining the distribution of the are discussed. We then provided our summary in Section 6. Throughout this study, we adopted the cosmology , , and .
2 targets and data
2.1 BASS AGN catalogue
Our targets are obtained from the catalogue of the BAT AGN Spectroscopic Survey (BASS, Koss et al., 2017; Ricci et al., 2017), which was originally provided in the Swift/BAT 70-month catalogue (Baumgartner et al., 2013). This catalogue contains 836 nearby AGNs detected using the Swift/BAT 14–195 keV band with a redshift peak of .
Koss et al. (2017) analysed the optical spectra of about 77% of the BASS AGNs and classified almost all of them as Seyfert galaxies. They classified 539 of them into Seyfert types, whereas the BASS website111https://www.bass-survey.com affords the Seyfert types of 594 AGNs. The latter’s Seyfert types are used in this study.
In the BASS AGN catalogue, the values of were primarily obtained by X-ray spectral analysis using not only 14–195 keV data but also soft X-ray data at 0.3–10 keV, which was obtained from XMM-Newton (Jansen et al., 2001), Chandra (Weisskopf et al., 2000), Suzaku (Mitsuda et al., 2007), or Swift/XRT (Burrows et al., 2005). In the measurement, the Galactic absorption was considered in advance using the value from the Hi maps of Kalberla et al. (2005). The of AGNs were then measured in which photoelectric absorption and Compton scattering were considered using the ZPHABS and CABS models, respectively (Ricci et al., 2017). The lower limit measured by the analysis was a (Koss et al., 2017; Ricci et al., 2017), which is lower than the typical value of the Galactic diffuse ISM. Ricci et al. (2017) estimated the of 75 Compton-thick AGNs using torus modelling to precisely determine them. We note that Burtscher et al. (2016) used the in the BASS AGN catalogue for their investigation as in this study.
2.2 Details about WISE data
We used the NIR photometric data obtained by the Wide-field Infrared Survey Explorer (WISE, Wright et al., 2010). WISE was launched in 2009 and performed its cryogenic all-sky survey for about a year in four bands: (m), (m), (m), and (m). This all-sky survey is called the ALLWISE programme. WISE was reactivated without cryogen after a two-year hibernation period to conduct an all-sky monitoring survey in the and bands to examine near-Earth objects (NEOWISE, Mainzer et al., 2011, 2014). Currently, WISE provides the all-sky monitoring data in and bands spanning for more than ten years, which comprises at most three epoch data from ALLWISE and typically 15 epoch data from NEOWISE. Each epoch data comprises typically a few dozen of single-exposure data.
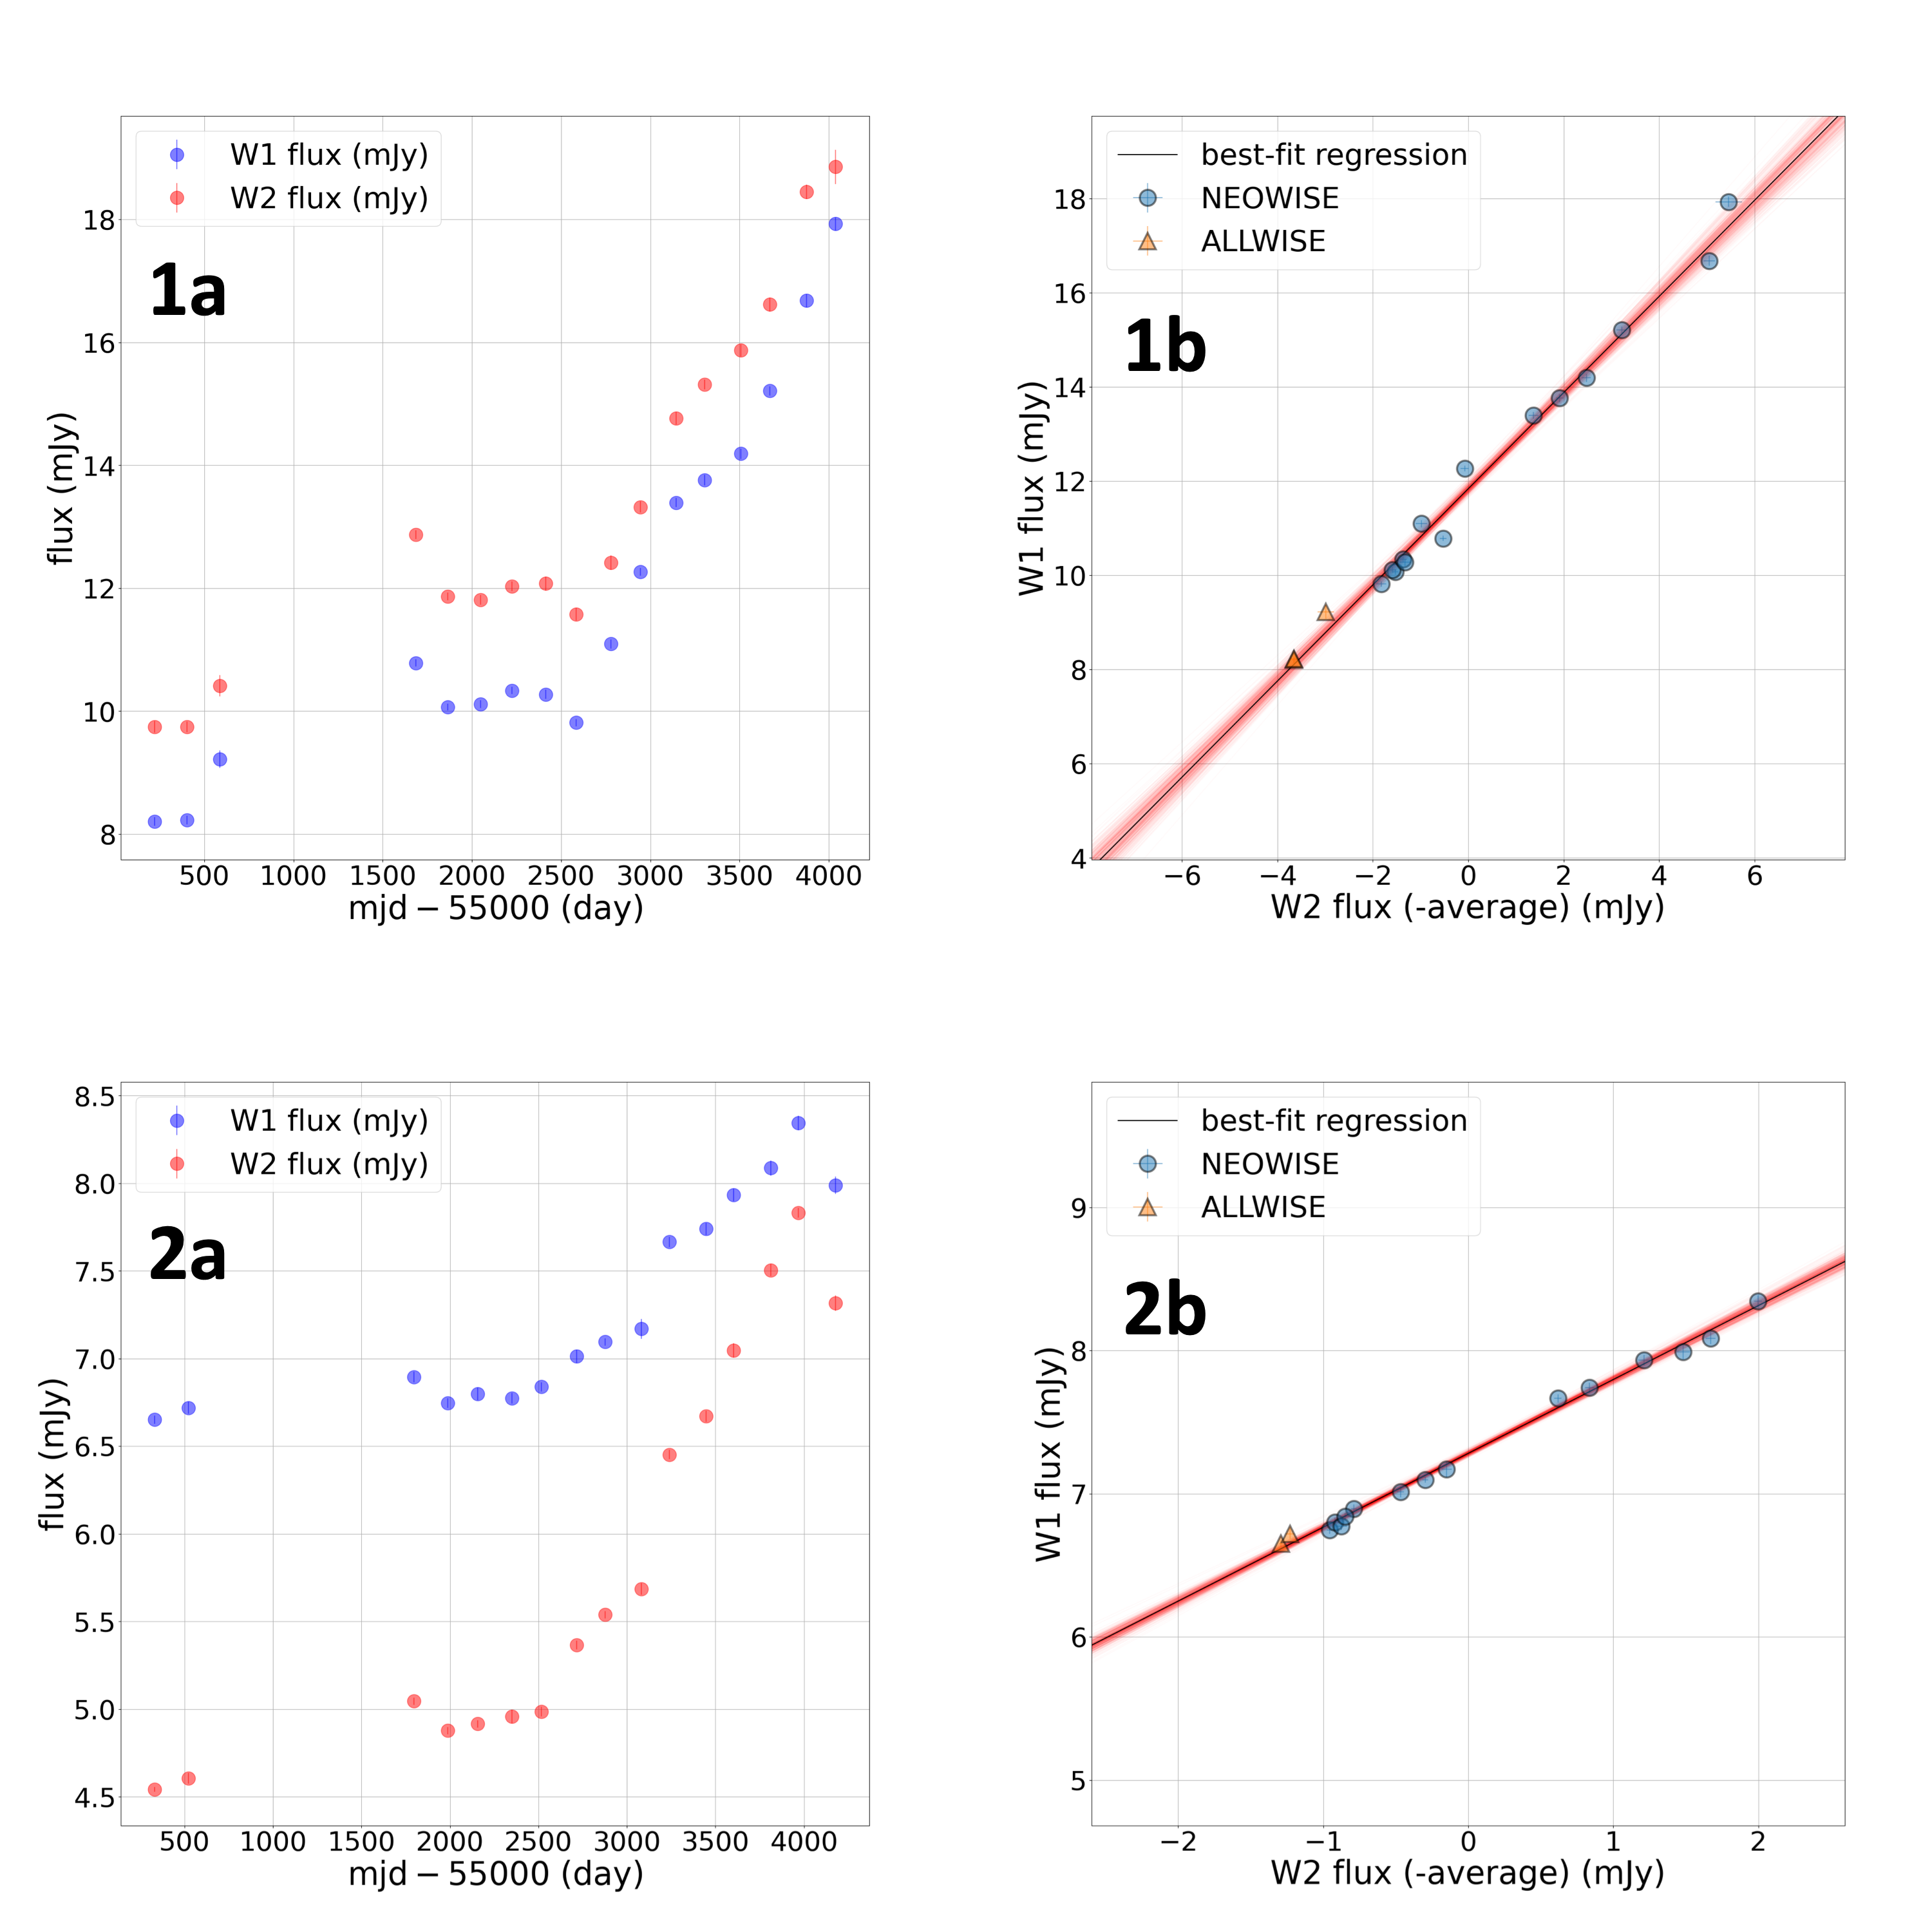
Typically, WISE observes each target once every six months. We averaged the photometric data in each epoch after excluding outliers that deviated from the average by more than of the distribution of the other flux data in the same epoch. We excluded monitoring data points from the epoch that did not have - or -band photometric data. The analysis of the NIR FVG described in the following sections demonstrates that it falls in the range corresponding to the power-law spectrum of with . We, therefore, adopt the zero magnitude flux densities of 306.682 and 170.663 Jy for the and bands, respectively, which are those for (Wright et al., 2010). In this study, the uncertainty of the derived flux density because of the difference of zero magnitude flux density is at most about 3% (Wright et al., 2010; Jarrett et al., 2011), which is smaller than the typical uncertainty of the NIR FVG in this study. We corrected for the Galactic extinction in the flux calculation. We adopted the Galactic extinction for each target from NASA/IPAC Extragalactic Database (NED), which is based on Schlafly & Finkbeiner (2011). We demonstrate examples of the light curve using the WISE data in Fig. 1 (1a) and (2a) for the typical type-1 and type-2 AGNs, respectively.
2.3 Target selection
First, we selected 594 AGNs in the BASS catalogue with the Seyfert type. We then excluded 25 AGNs that are classified as blazars in the Roma Blazar Catalogue (BZCAT, Massaro et al., 2009). Targets with the Galactic extinction mag were excluded to decrease the uncertainty of the estimated caused by that of the Galactic extinction. Typically, obscured AGNs have , which corresponds to mag assuming the typical of the Galactic diffuse ISM (Predehl & Schmitt, 1995; Nowak et al., 2012). We excluded 26 targets here.
Next, we set the target redshift to so that the thermal emission from the hot dust in the innermost region of the dusty torus dominated the NIR observed fluxes. Because most of the BASS AGNs are nearby sources, only two AGNs were excluded.
We then selected targets with good-quality WISE data, which are defined by the data quality flags as good frame quality (qual_frame), good signal-exposure image (qi_fact), no charged particle hits (saa_sep), no moon effect (moon_masked), and no effect from artifacts (cc_flags’0000’). Here we excluded the targets with no good-quality data from our samples. Moreover, we excluded targets that had at least one saturated pixel in more than 10% of the observational data across all epochs, whereas we used WISE profile-fitting photometry, which used only unsaturated pixels. We excluded 28 targets here in total. Therefore, we selected 513 AGNs for subsequent analysis. Although some targets lacked usable data from the ALLWISE programme, we did not exclude them because our NIR FVG analysis could be adequately conducted only with the data from the NEOWISE programme.
Figs. 1 (1b) and (2b) show the -band flux to -band flux plot for the targets, LEDA 126226 and LEDA 2730634, as examples of typical type-1 and type-2 AGNs, respectively. In the horizontal axis of the flux–flux plot, we consider the difference from the mean flux value to approximately minimise the uncertainty of the intercept of the vertical axis. The data points spread in the flux–flux plot were then fitted using the linear relation,
| (1) |
where and are - and -band fluxes, respectively, and is the average of the -band fluxes. We set the intercept and slope as free parameters, and the NIR FVG for the target is estimated as of the best-fit linear regression.
Before performing linear regression analysis, we calculated the correlation coefficient between the and flux data to evaluate the strength of the correlation between flux variations in and bands. We reported that the flux variations in the two NIR bands were highly correlated for the majority of the targets ( for 83% of the 513 targets), which is consistent with the results of Glass (2004). Moreover, our result is based on an order of magnitude larger sample, including multiple obscured AGNs.
The targets having a high correlation coefficient were subjected to linear regression analysis. However, there are some targets with high correlation coefficients for which the NEOWISE programme data points are clustered in a small area on the flux–flux plot, thus suggesting small flux variation and weak correlation for the NEOWISE data. A few data points from the ALLWISE programme located separately may produce a strong correlation in such cases. In this study, we focus on the flux variation of the thermal radiation on a timescale of a few to ten years; hence, our suitable targets should demonstrate the clear flux variation even in the NEOWISE data alone. Consequently, we excluded targets with weak correlation for the NEOWISE data based on the correlation coefficient, calculated using only data from the NEOWISE programme (). 466 AGNs were selected for which both and were larger than 0.7 because 0.64 is the value of the correlation coefficient indicating a 99% confidence level for a sample size of 15. Many targets eliminated here show not only the small flux variation but also the large with the peak of . This indicates that these targets may be heavily obscured sources.
3 near-infrared flux variation gradient
3.1 Linear regression analysis of the flux–flux plot
We performed linear regression analysis on the flux–flux plots of the 466 targets. Because data points in the flux–flux plot have errors on both axes, we used a Python port of a Bayesian linear regression routine called Linmix_err in IDL developed by Kelly (2007), called Linmix222Linmix: http://linmix.readthedocs.org/, which normally incorporates distributed errors in dependent and independent variables. Linmix assumes the distribution of independent variables with multiple Gaussians, and we herein set the number of Gaussian as , which is the smallest number we can set to make Linmix work properly. In this study, we included the intrinsic scatter in our calculation.
Figs. 1 (1b) and (2b) show the best-fit regression line and samples from the posterior distribution of the regression for each target. We estimated the NIR FVGs with the good precision of the FVG error () being smaller than 0.2 for the 463 targets. This represents more than 90% (463/513) of the local non-blazar BASS AGNs with known Seyfert type, small Galactic extinction, and good WISE data. We selected these 463 targets to estimate the line-of-sight dust extinction using the NIR FVG described in the following sections. Table 1 lists the estimated NIR FVGs and errors for the target AGNs.
3.2 Results on the near-infrared FVG
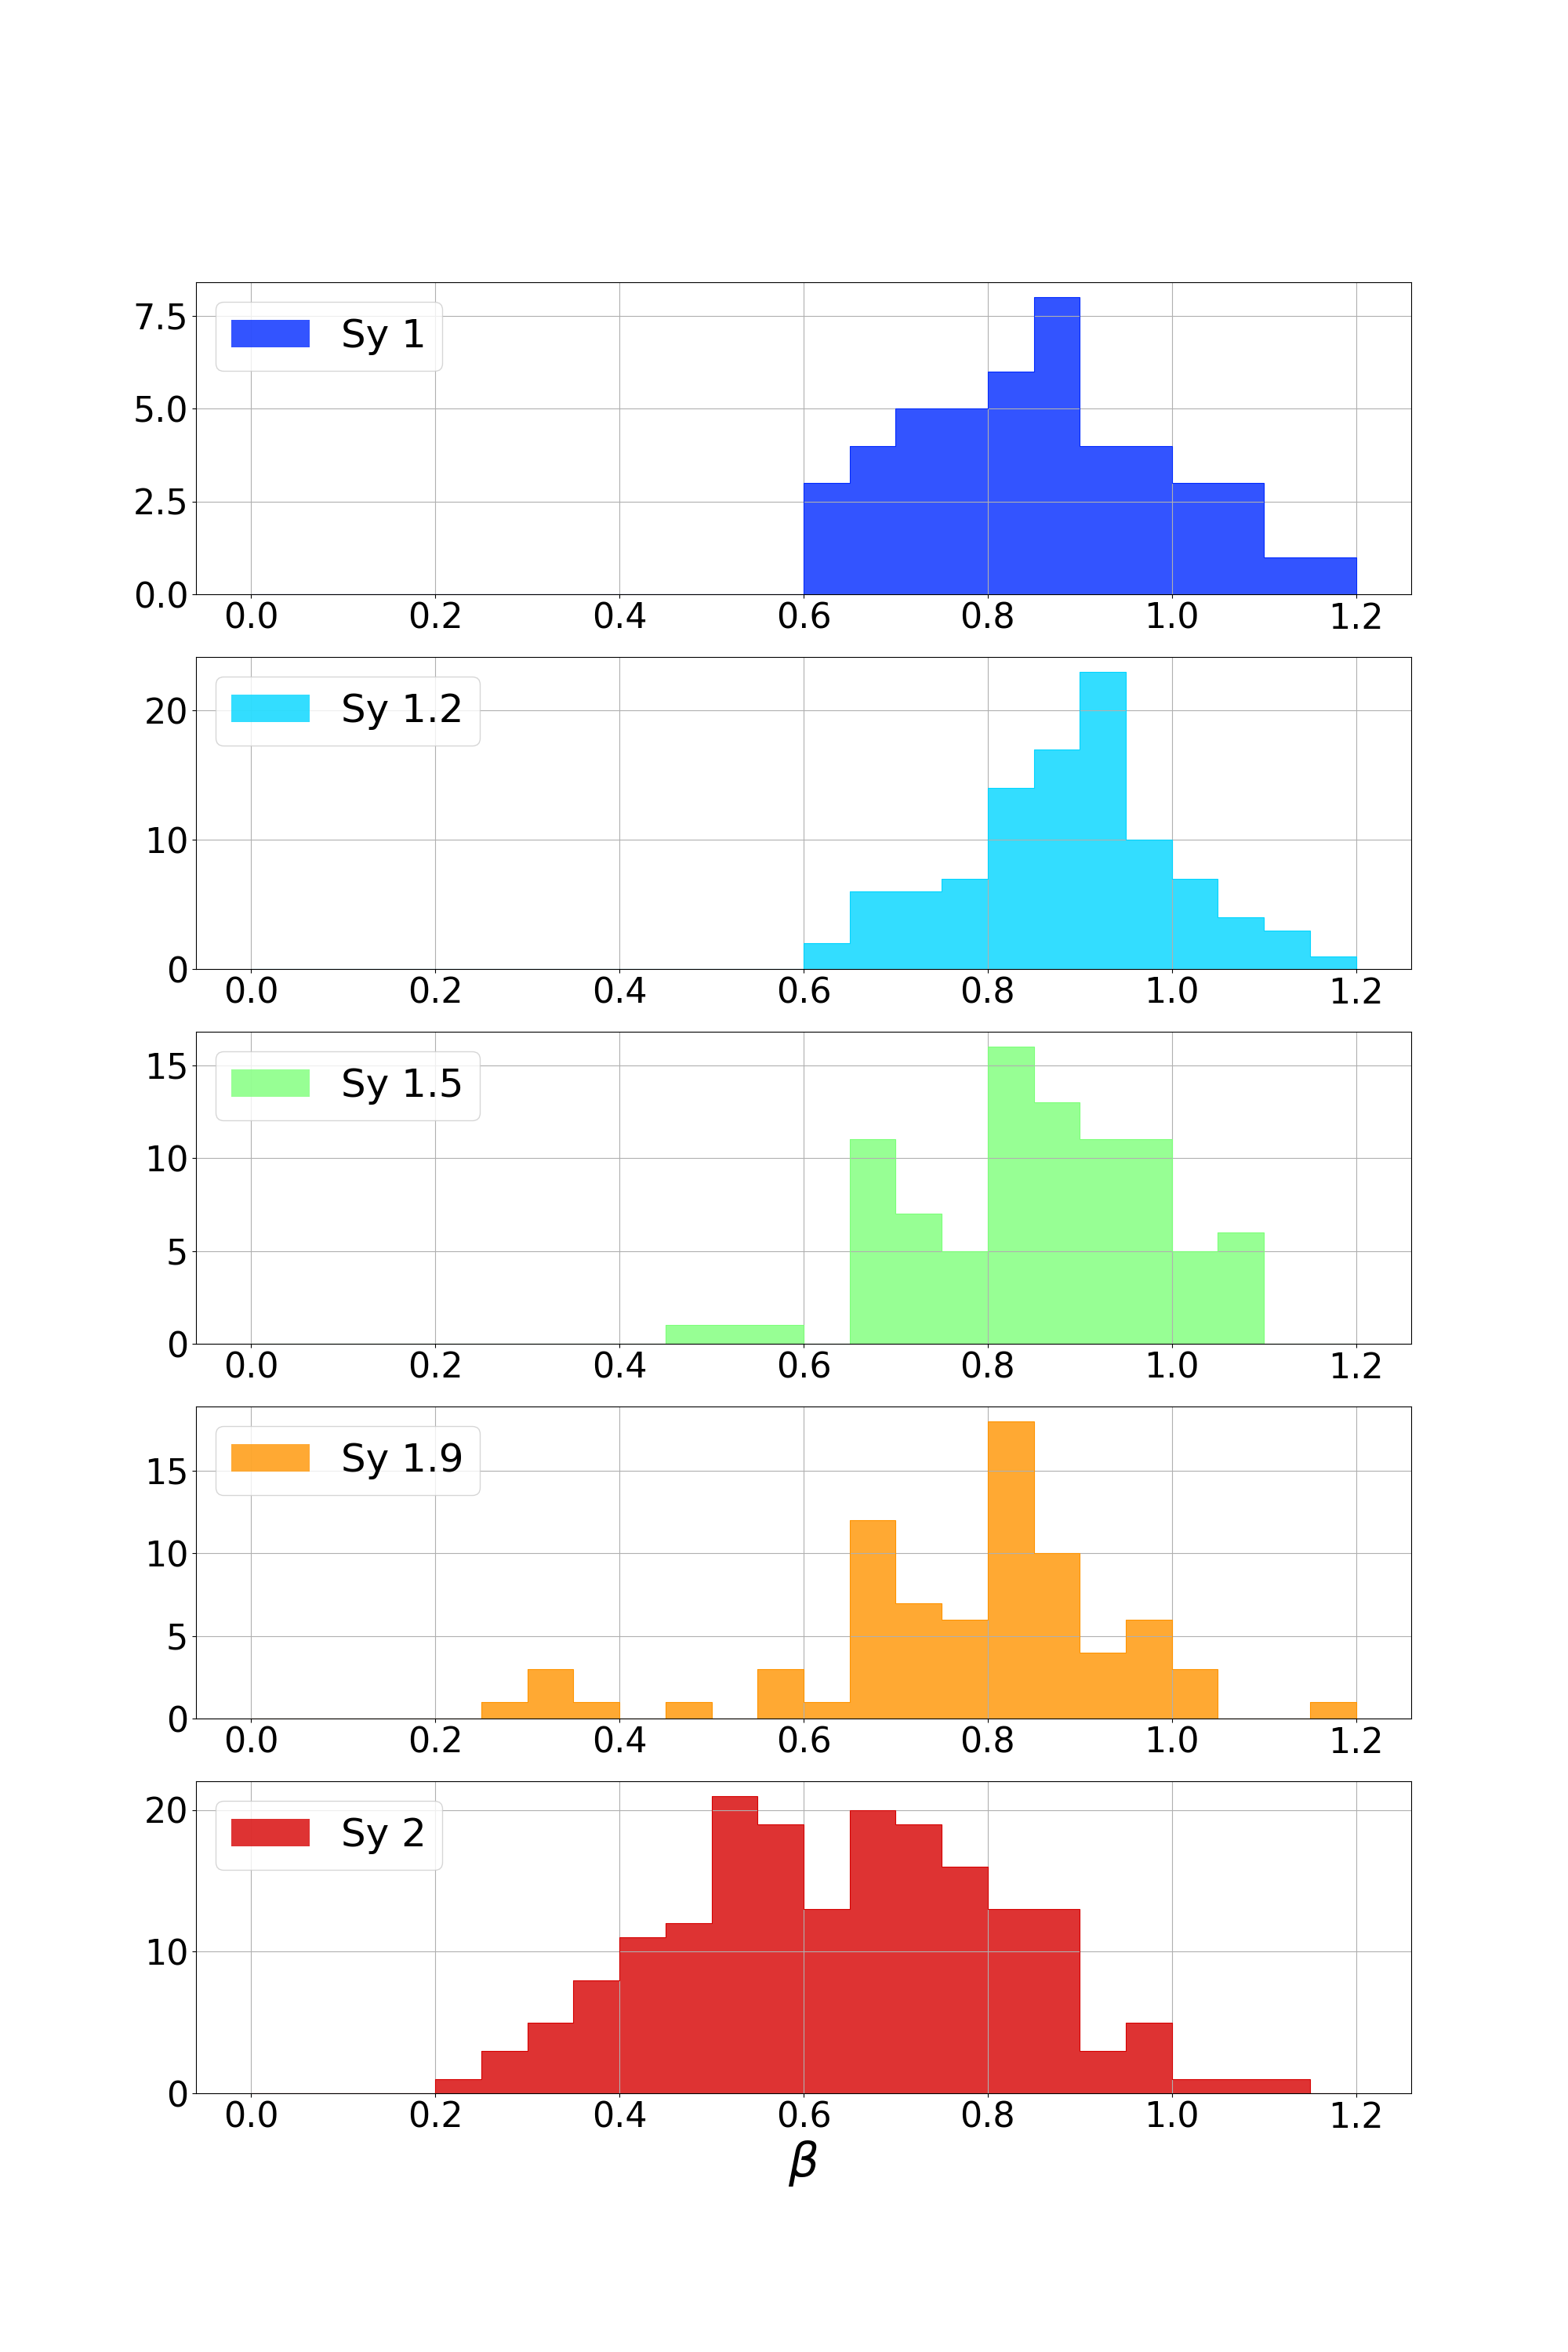
Fig. 2 shows the distribution of the NIR FVG (the left panel) for the 463 targets in a sequence by Seyfert type. These targets comprise 40, 93, 83, 70, and 177 targets of Seyfert type 1, 1.2, 1.5, 1.9, and 2, respectively. We found that the NIR FVGs for less obscured (type-1–1.5) AGNs were distributed around in a relatively narrow range as reported by Glass (2004). However, we found a clear reddening trend of the NIR FVGs for type-2 AGNs. They were broadly distributed in a range of –0.9 with many targets at . Observed flux time variation in the band is more likely to be suppressed than that in the band because of dust extinction, which makes the regression line flatter or smaller in obscured AGNs. The NIR FVG of type-1.9 AGNs is distributed around with a small number of the targets at .
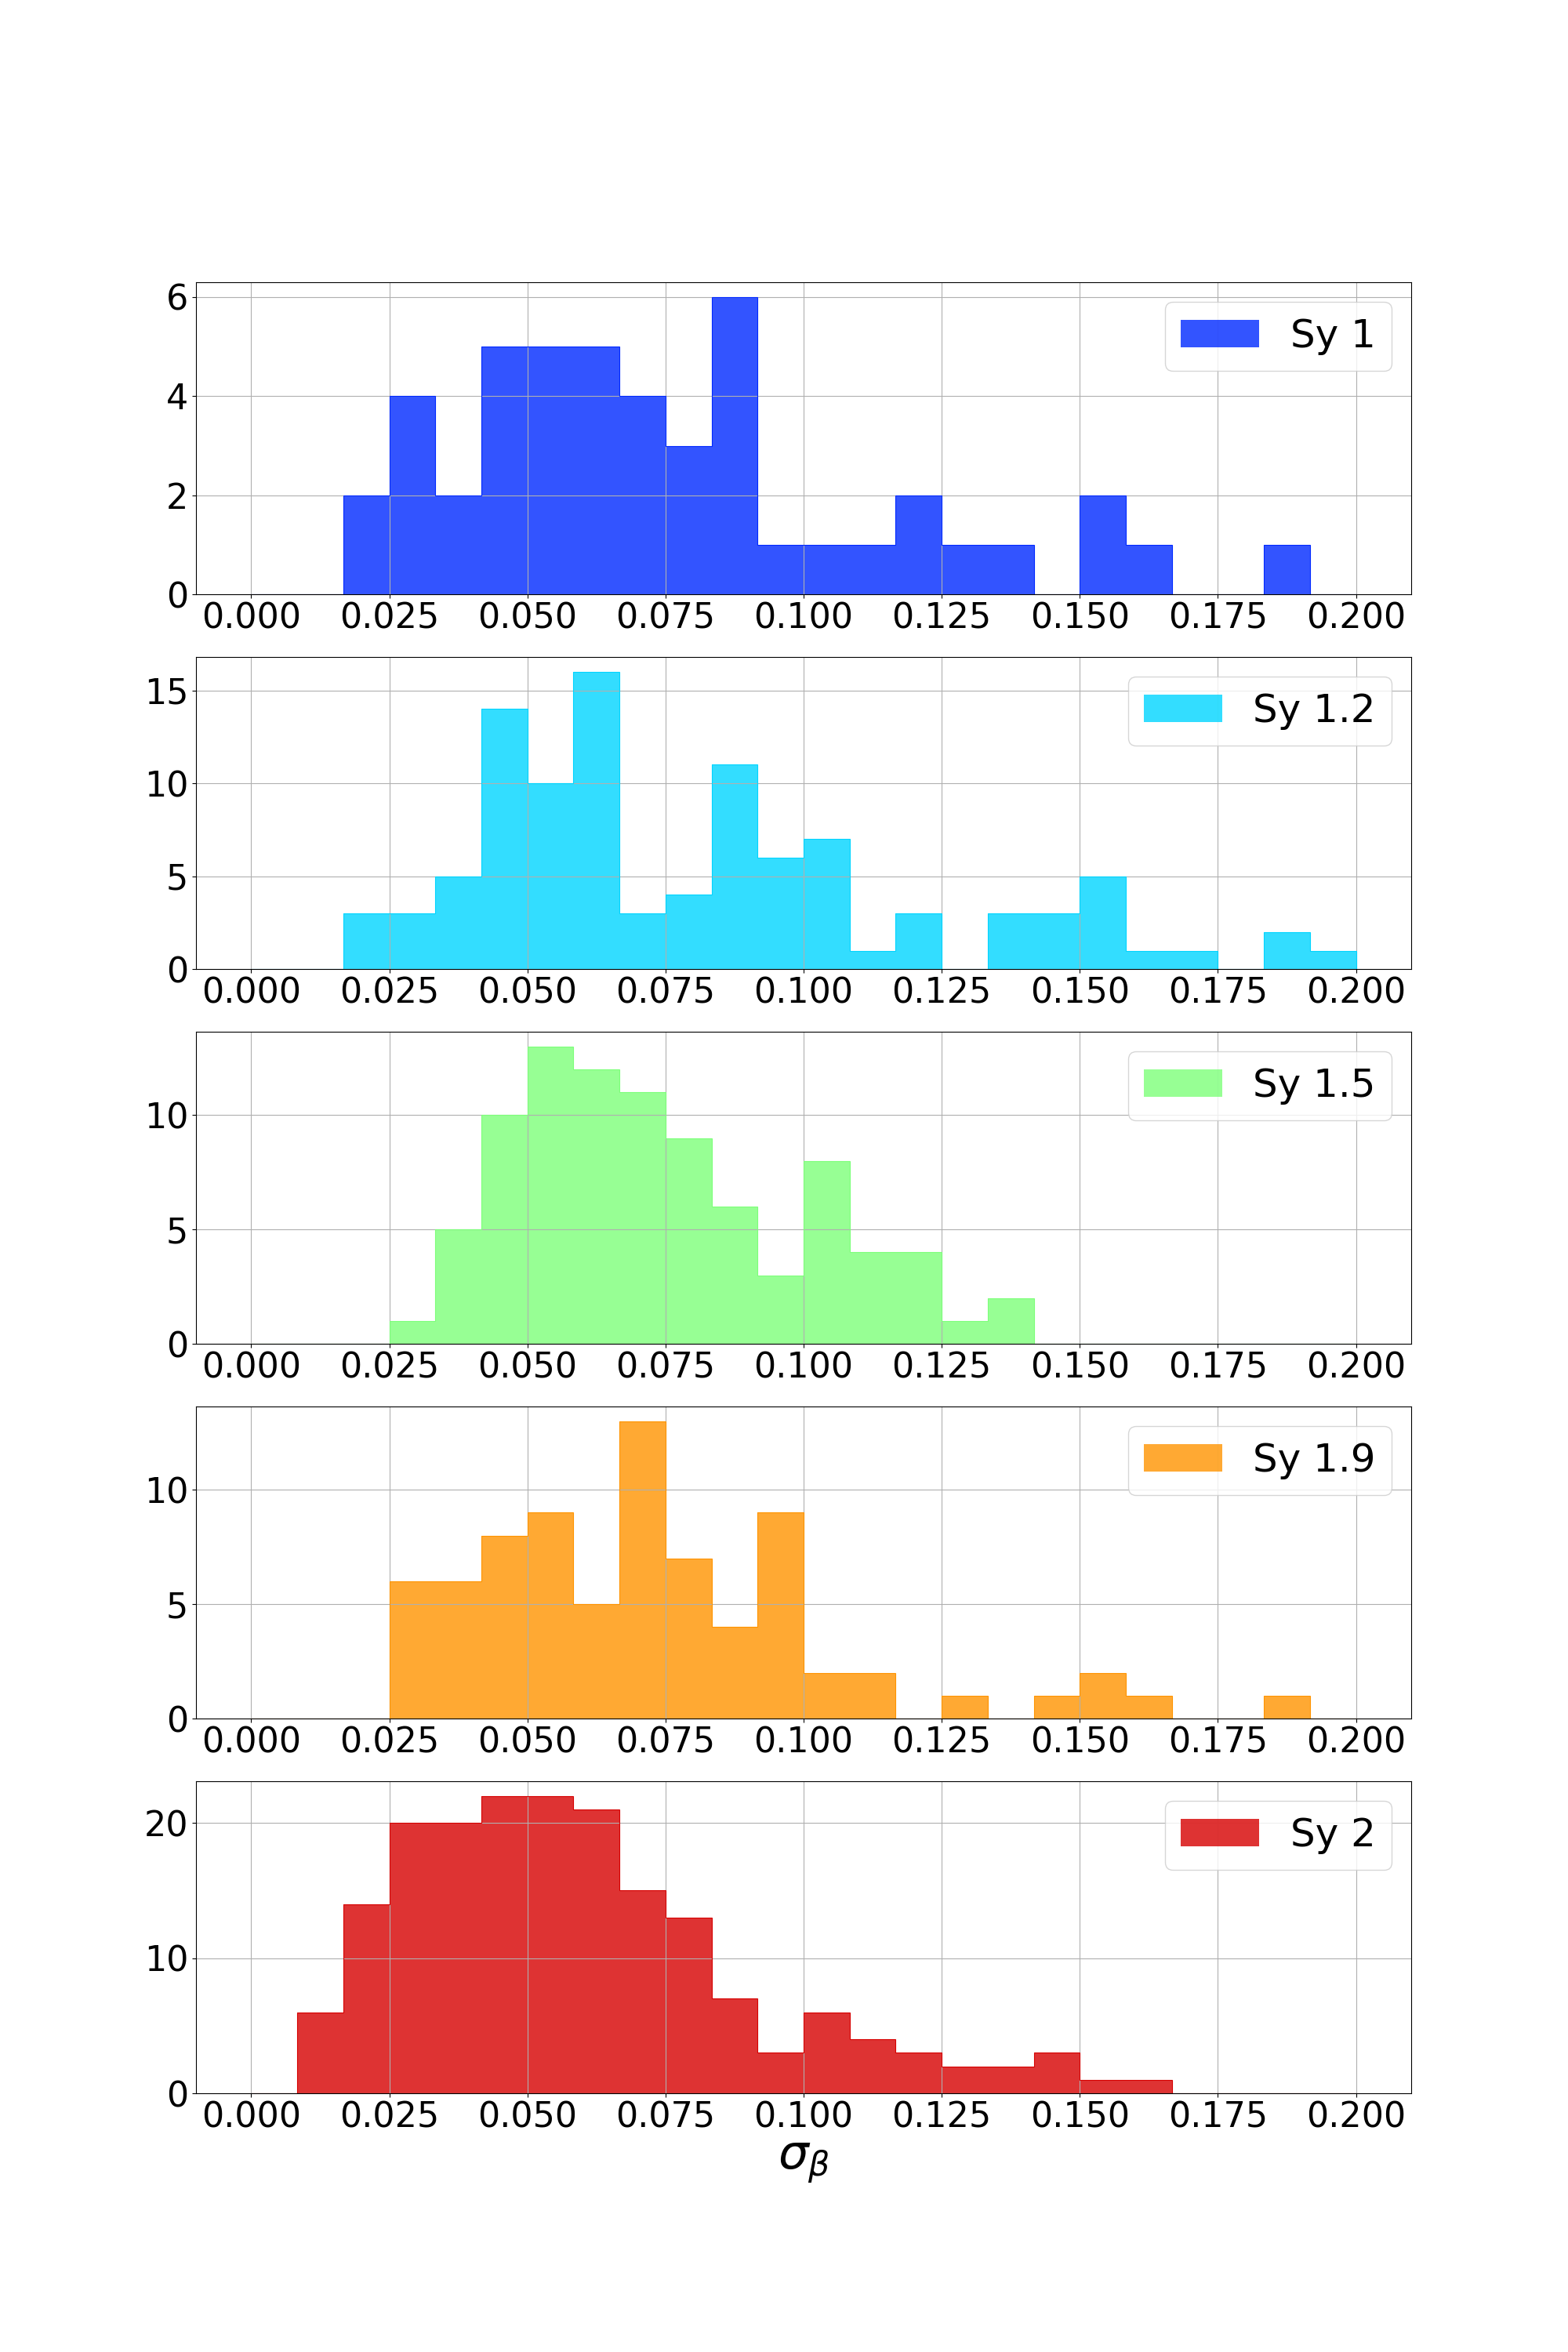
Fig. 2 shows the distribution of the FVG error (the right panel). The distribution of the FVG error differs little between the targets of different Seyfert types. The average FVG error for all targets is with only 18% (84/463) of targets having relatively large FVG errors of .
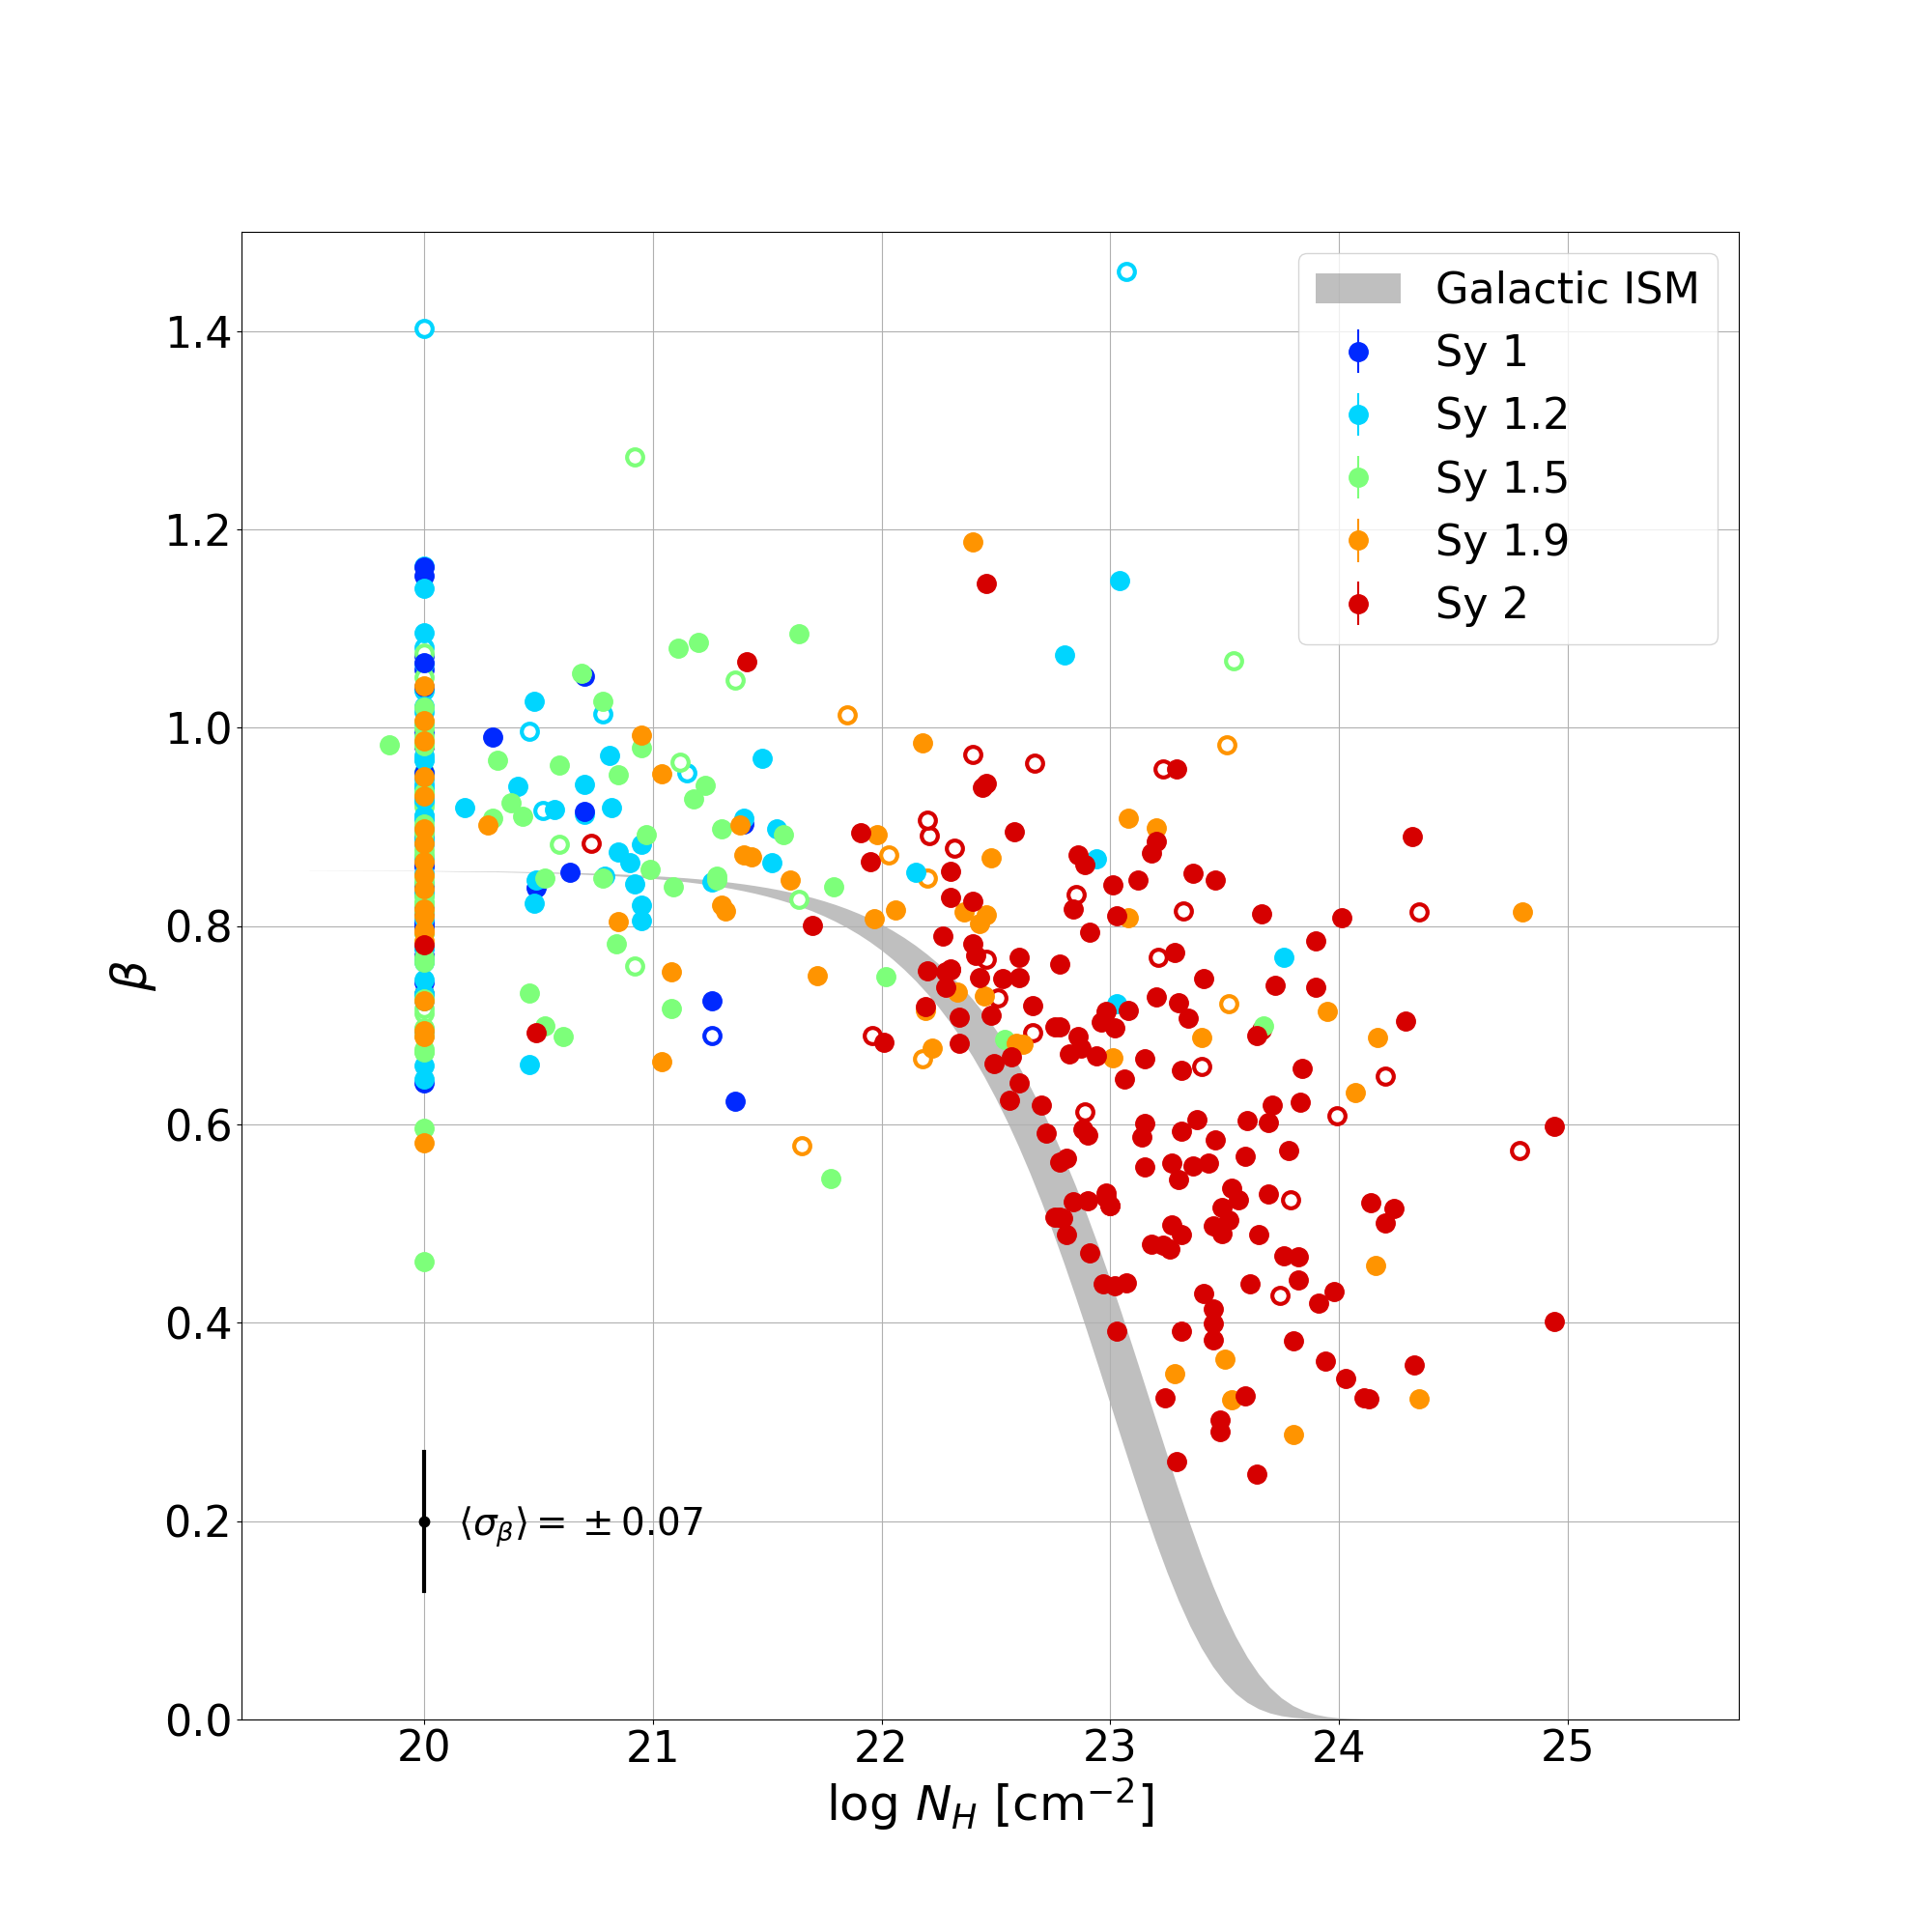
In Fig. 3, the NIR FVG is compared with measured by X-ray absorption. The colours of the data points are coded in a sequence by Seyfert types. We successfully obtained the NIR FVGs for both unobscured and obscured AGNs whose hydrogen column densities ranged from (lower limit of the measurement) to . We found that the NIR FVGs for less obscured AGNs of fall in a relatively narrow range. These AGNs are dominated by type-1–1.5 AGNs. However, we found that the NIR FVGs show clear reddening for obscured AGNs of , which are dominated by Seyfert type-1.9–2 AGNs.
We note that there is a large difference in the NIR FVG at fixed for obscured AGNs of ; accordingly, there is a large difference in by at most two orders of magnitude at fixed NIR FVG for obscured AGNs of Seyfert type 1.9–2. This indicates that there is a significant scatter in the ratio of dust reddening to the hydrogen column density for obscured AGNs as has been reported (e.g., Maiolino et al., 2001a; Burtscher et al., 2016). This will be discussed in the following sections.
4 LINE-OF-SIGHT DUST EXTINCTION
4.1 Calculation of dust extinction from near-infrared FVG
The clear trends of reddening of the NIR FVG for obscured AGNs in Figs. 2 and 3 show that the line-of-sight dust extinction of AGNs can be estimated from the amount of reddening of the NIR FVG. Here we explain the formula for estimating the dust extinction from the NIR FVG.
The time-variable components of - and -band fluxes, and , respectively, are expressed as follows:
| (2) |
| (3) |
where and are the - and -band time-variable fluxes without extinction, respectively, and and are the magnitudes of extinction in the and bands, respectively. Taking the logarithm of the ratio of Equations (2) and (3), \colorblack the relationship between the -band to -band FVG , , and can be expressed as follows:
| (4) |
where is the -band to -band FVG for the AGNs without extinction. Equation (4) can be expressed using the magnitude of the -band dust extinction and the dust extinction curve as follows:
| (5) |
where and . We assumed the as the rest-frame -band extinction in the AGN, while and are the extinction at the rest-frame wavelengths of and at the target redshift of , respectively, where m and m. Finally, we can calculate the amount of dust extinction in the AGN based on the reddening of the NIR FVG by using the following equation,
| (6) |
We assumed the standard extinction curve of the Galactic diffuse ISM (Fitzpatrick, 1999) for and , and to obtain and , respectively, when . We assumed a foreground screen geometry for the obscurer because the NIR emitting region is much smaller than the parsec-scale outer torus (Burtscher et al., 2015, 2016; Lyu et al., 2019; Minezaki et al., 2019; Noda et al., 2020; Gravity Collaboration et al., 2020; Gámez Rosas et al., 2022).
The uncertainty of the NIR FVG for each target and that for the AGN without extinction are transferred to that of for the target as follows:
| (7) |
4.2 Near-infrared FVG for unobscured AGNs
As discussed in Section 3.2, the NIR FVGs for less obscured AGNs fall in a relatively narrow range. Then, we estimated the NIR FVG for unobscured AGNs to investigate the dust extinction of obscured AGNs. We selected the NIR FVGs of 95 optically- and X-ray-unobscured AGN targets. They have Seyfert types of type 1–1.5 and their hydrogen column densities are . They have relatively small uncertainties of the NIR FVG ().
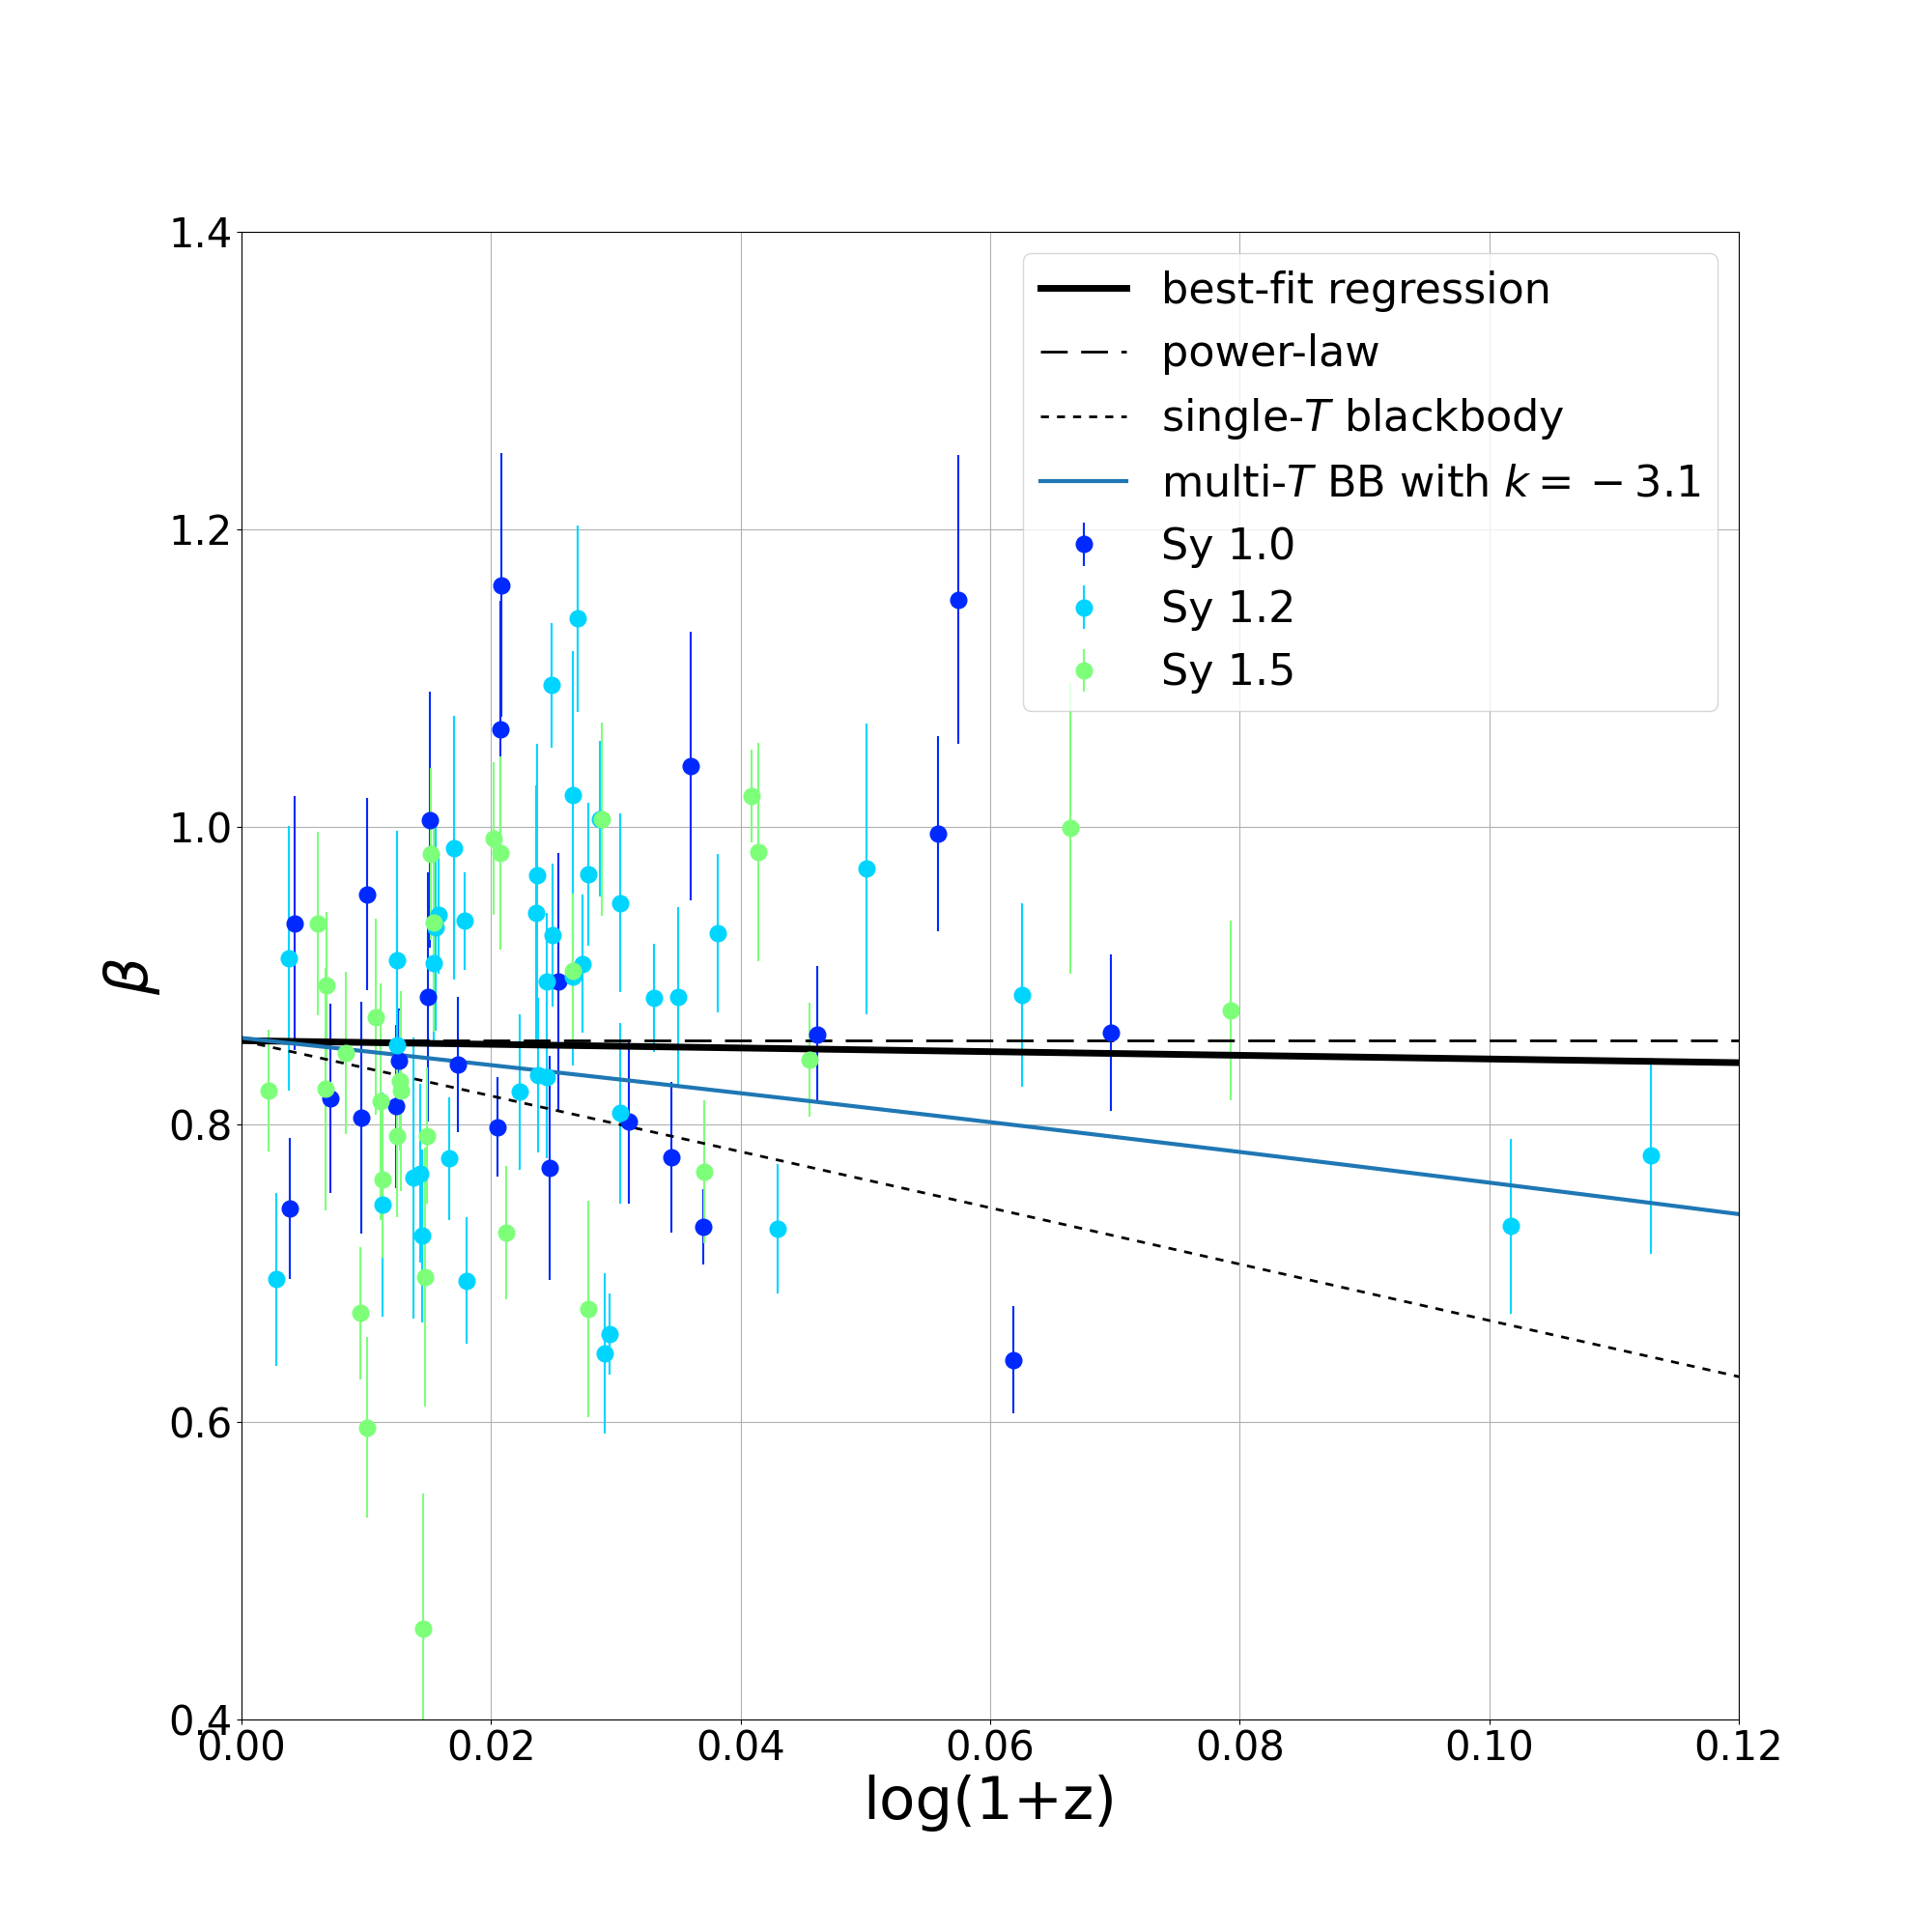
Fig. 4 shows the NIR FVGs against the redshifts for these unobscured targets. Their NIR FVGs fall in a relatively narrow range regardless of Seyfert type but appear to be spread more than expected from the measurement errors, indicating some amount of the target-to-target variation in the NIR FVGs for unobscured AGNs, or the intrinsic scatter . To incorporate the possible redshift dependence, we assumed the following relation:
| (8) |
and we fitted Equation (8) to the data by the weighted least squares method, adding the intrinsic scatter of the NIR FVG to the error of the NIR FVG by root-sum-square, , so that the reduced reaches unity. The best fit parameters are obtained as and with . Accordingly, we used
| (9) |
| (10) |
for calculating the dust extinction and its error from the NIR FVG in the following sections.
Assuming a blackbody spectrum, and corresponds to the colour temperature of , which is consistent with that of hot dust considered to be located in the innermost dusty torus (e.g., Mor et al., 2009; Netzer, 2015; Hönig, 2019; Lyu & Rieke, 2021). is slightly lower than those estimated for the NIR and FVG colours for the local type-1 AGNs by Glass (2004), which is possibly attributed to the difference in observed wavelengths. The FVG colour tends to be more sensitive to lower-temperature dust thermal emission than the and FVG colours.
As shown in Fig. 4, the NIR FVGs of unobscured AGNs are almost unchanged systematically \colorblack with redshift. The FVG is constant regardless of redshift when the spectral energy distribution (SED) of the flux variation is a power-law spectrum, whereas it becomes redder in higher redshift when the SED is a blackbody spectrum of single-temperature dust. Therefore, such a weak redshift dependence of the NIR FVG suggests that the SED of the flux variation in 3–5 m shows a bump much broader than a blackbody spectrum, as is found in the typical SED of quasars (e.g., Elvis et al., 1994; Hernán-Caballero et al., 2016; Lyu et al., 2017; Hickox & Alexander, 2018). This weak redshift dependence of NIR FVG and possible broad bump in the NIR SED of AGNs \colorblack can be explained by a composite of thermal radiation from multi-temperature dust. By assuming a distribution of the amount of multi-temperature dust as a power-law of temperature with a maximum temperature of 2000 K, the - to -band flux ratio of the composite SED of the blackbody radiation from the multi-temperature dust matches the best-fit of 0.86 when . We show the redshift dependence of the flux ratio in Fig. 4 with the blue line. The reddening of the flux ratio \textcolorblackof multi-temperature blackbody radiation is weaker than that of the single-temperature blackbody radiation in higher redshift, and this result suggests that the SED of the blackbody radiation from multi-temperature dust shows a broader bump in 3–5 m than that from single-temperature dust.
black Then, we compared the with - to -band flux ratios derived from composite SEDs of quasars. The flux ratio from the SED of Hernán-Caballero et al. (2016) is 0.73, which is redder than even if the intrinsic scatter is considered. We also compared the with the flux ratio derived from the composite SED of warm-dust deficient (WDD) quasars that are defined by Lyu et al. (2017). WDD quasars have a broad NIR bump in their SEDs as normal quasars, but they show weaker mid-infrared emission, which is attributed to the reduction of the warm dust component in the dusty torus. We derived the flux ratio from the composite SED of the WDD quasars as 0.81. We found that it falls within the intrinsic scatter of from the best-fit NIR FVG of , while the is still bluer than the flux ratio for the WDD quasars. This result indicates that the variable component of flux in 3–5 m are dominated by the thermal emission of hot dust in the innermost region of the dusty torus, which is so compact that the thermal reradiation response to the flux variation of the central engine is larger than that in the outer torus. This strengthens the view of a foreground screen geometry for the obscurer to measure the line-of-sight extinction based on the reddening of the NIR FVG, as described in Section 4.1.
4.3 Results of dust extinction
Table 1 lists the dust extinction estimated from the NIR FVG and the error based on Equations (6), (7), and (9). We estimated the dust extinction of obscured AGNs up to mag. The mean uncertainty of of our targets is mag.
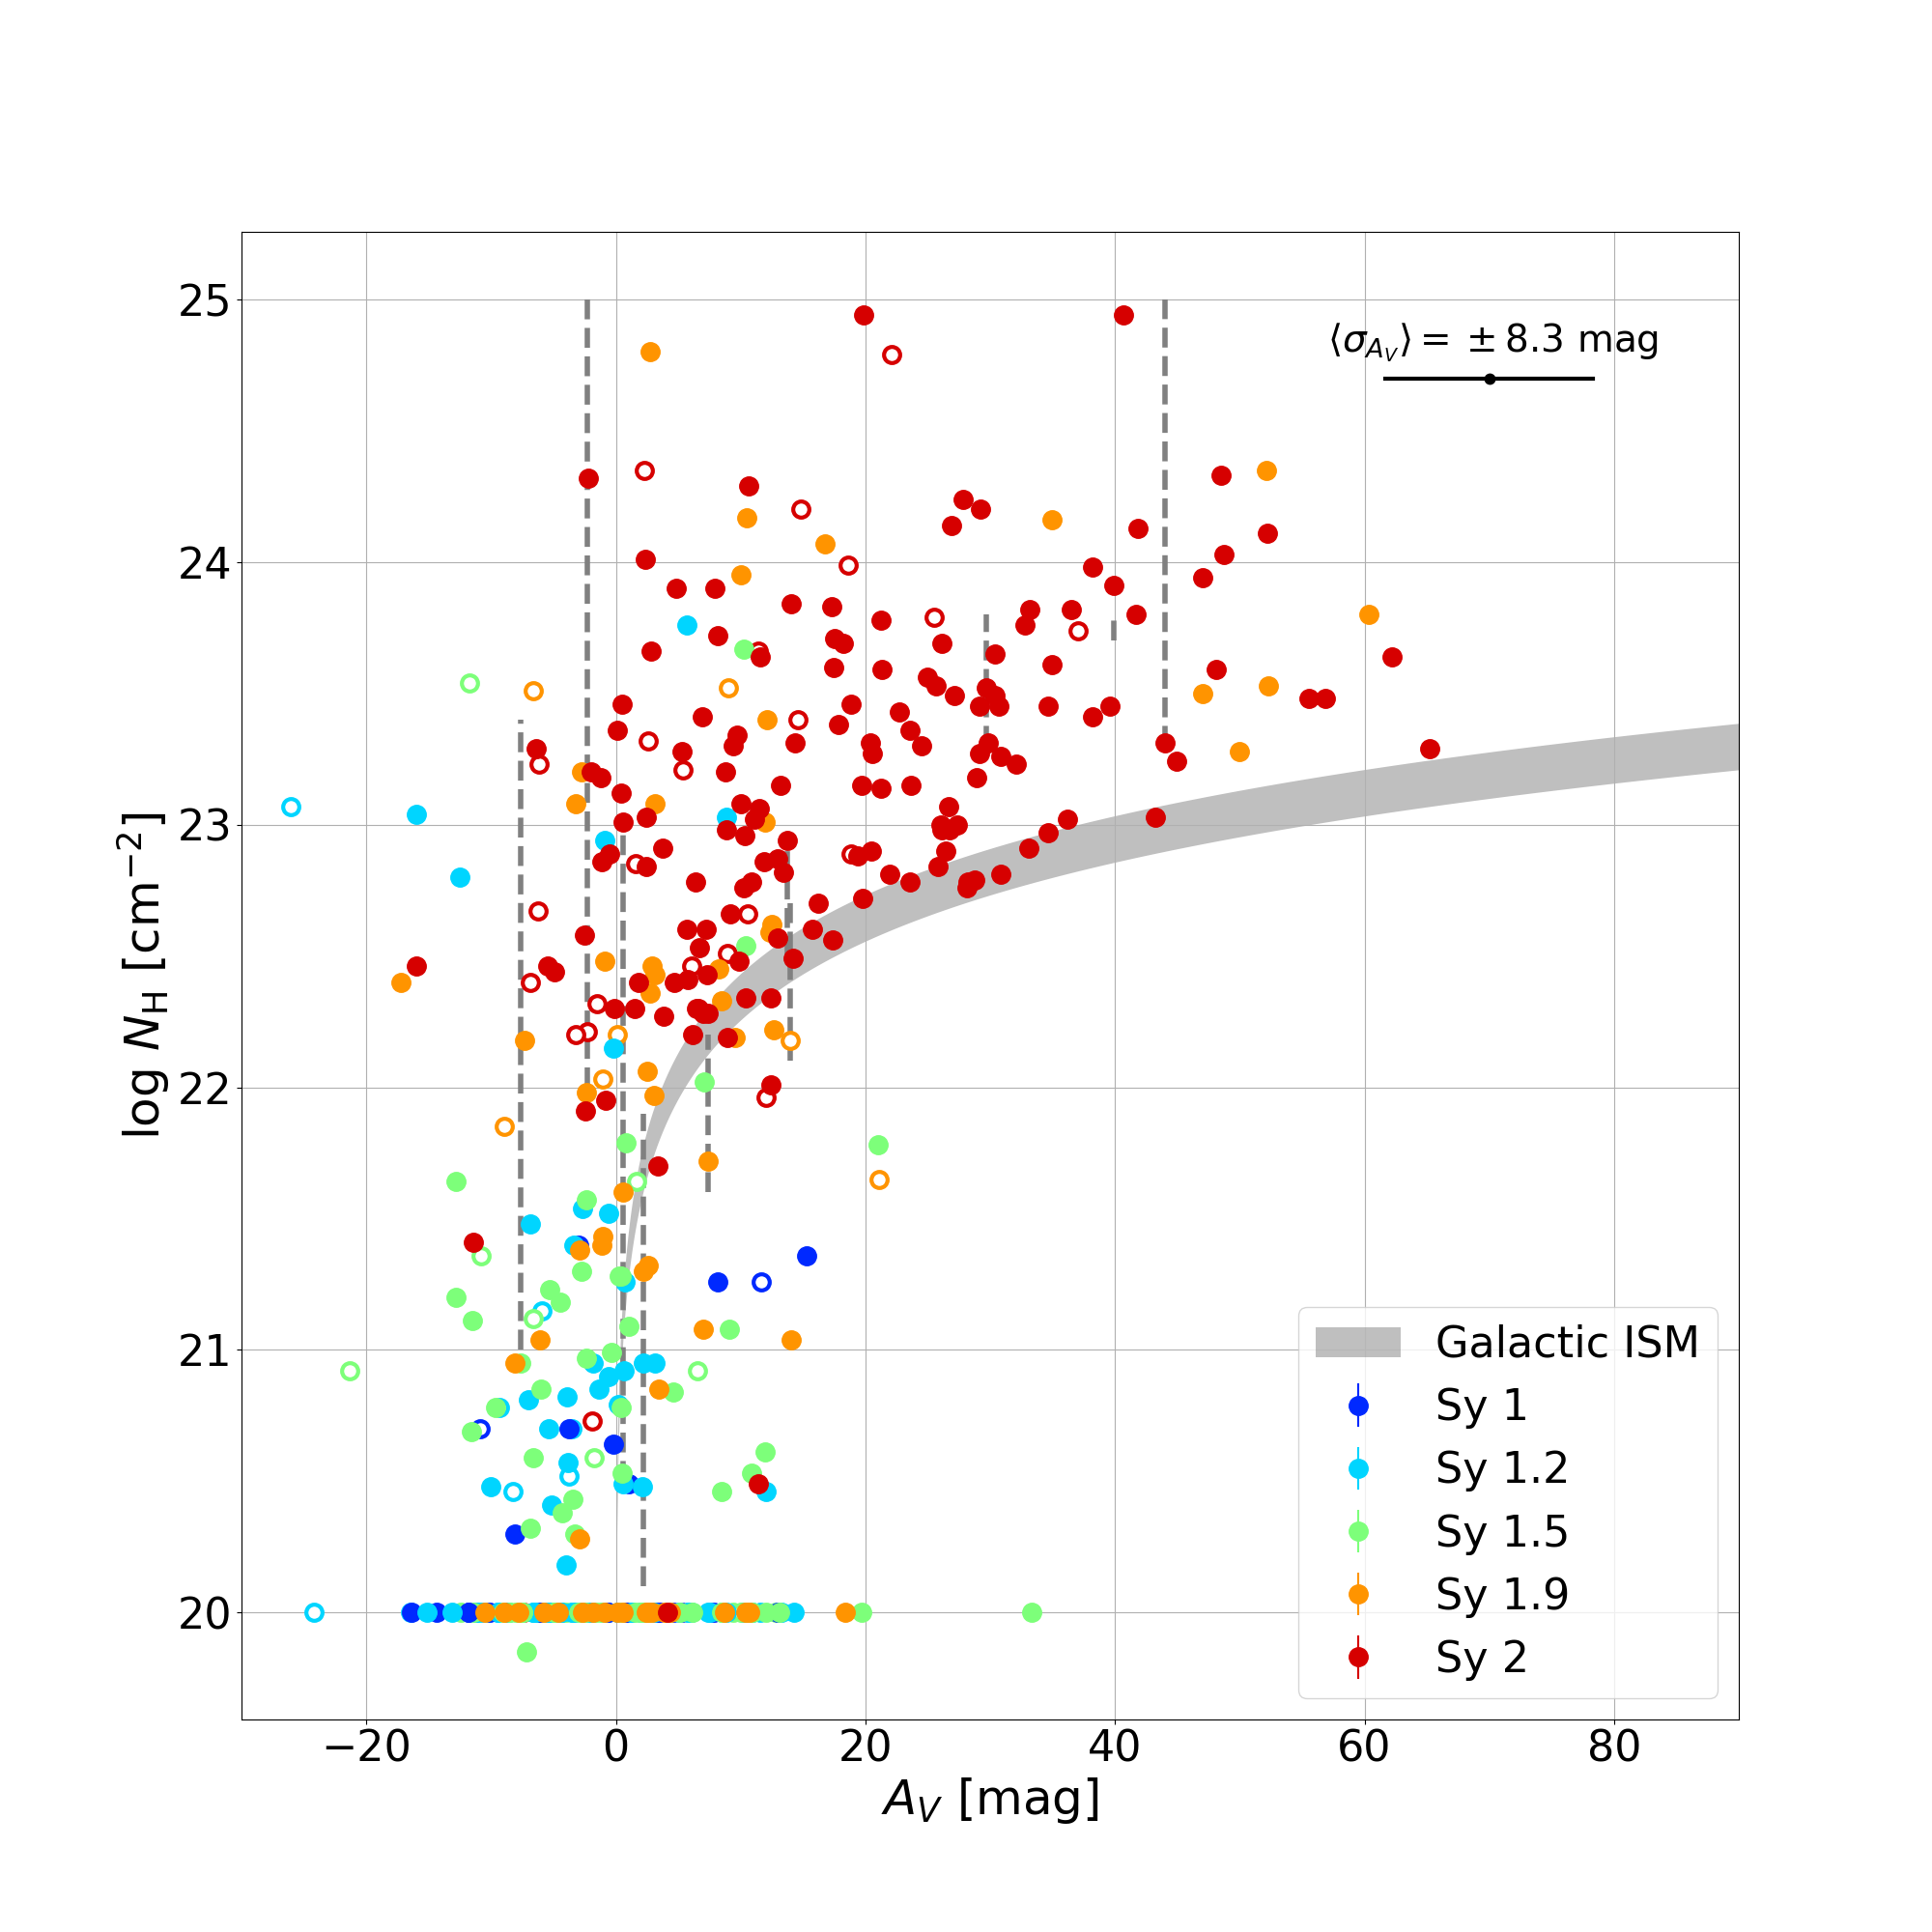
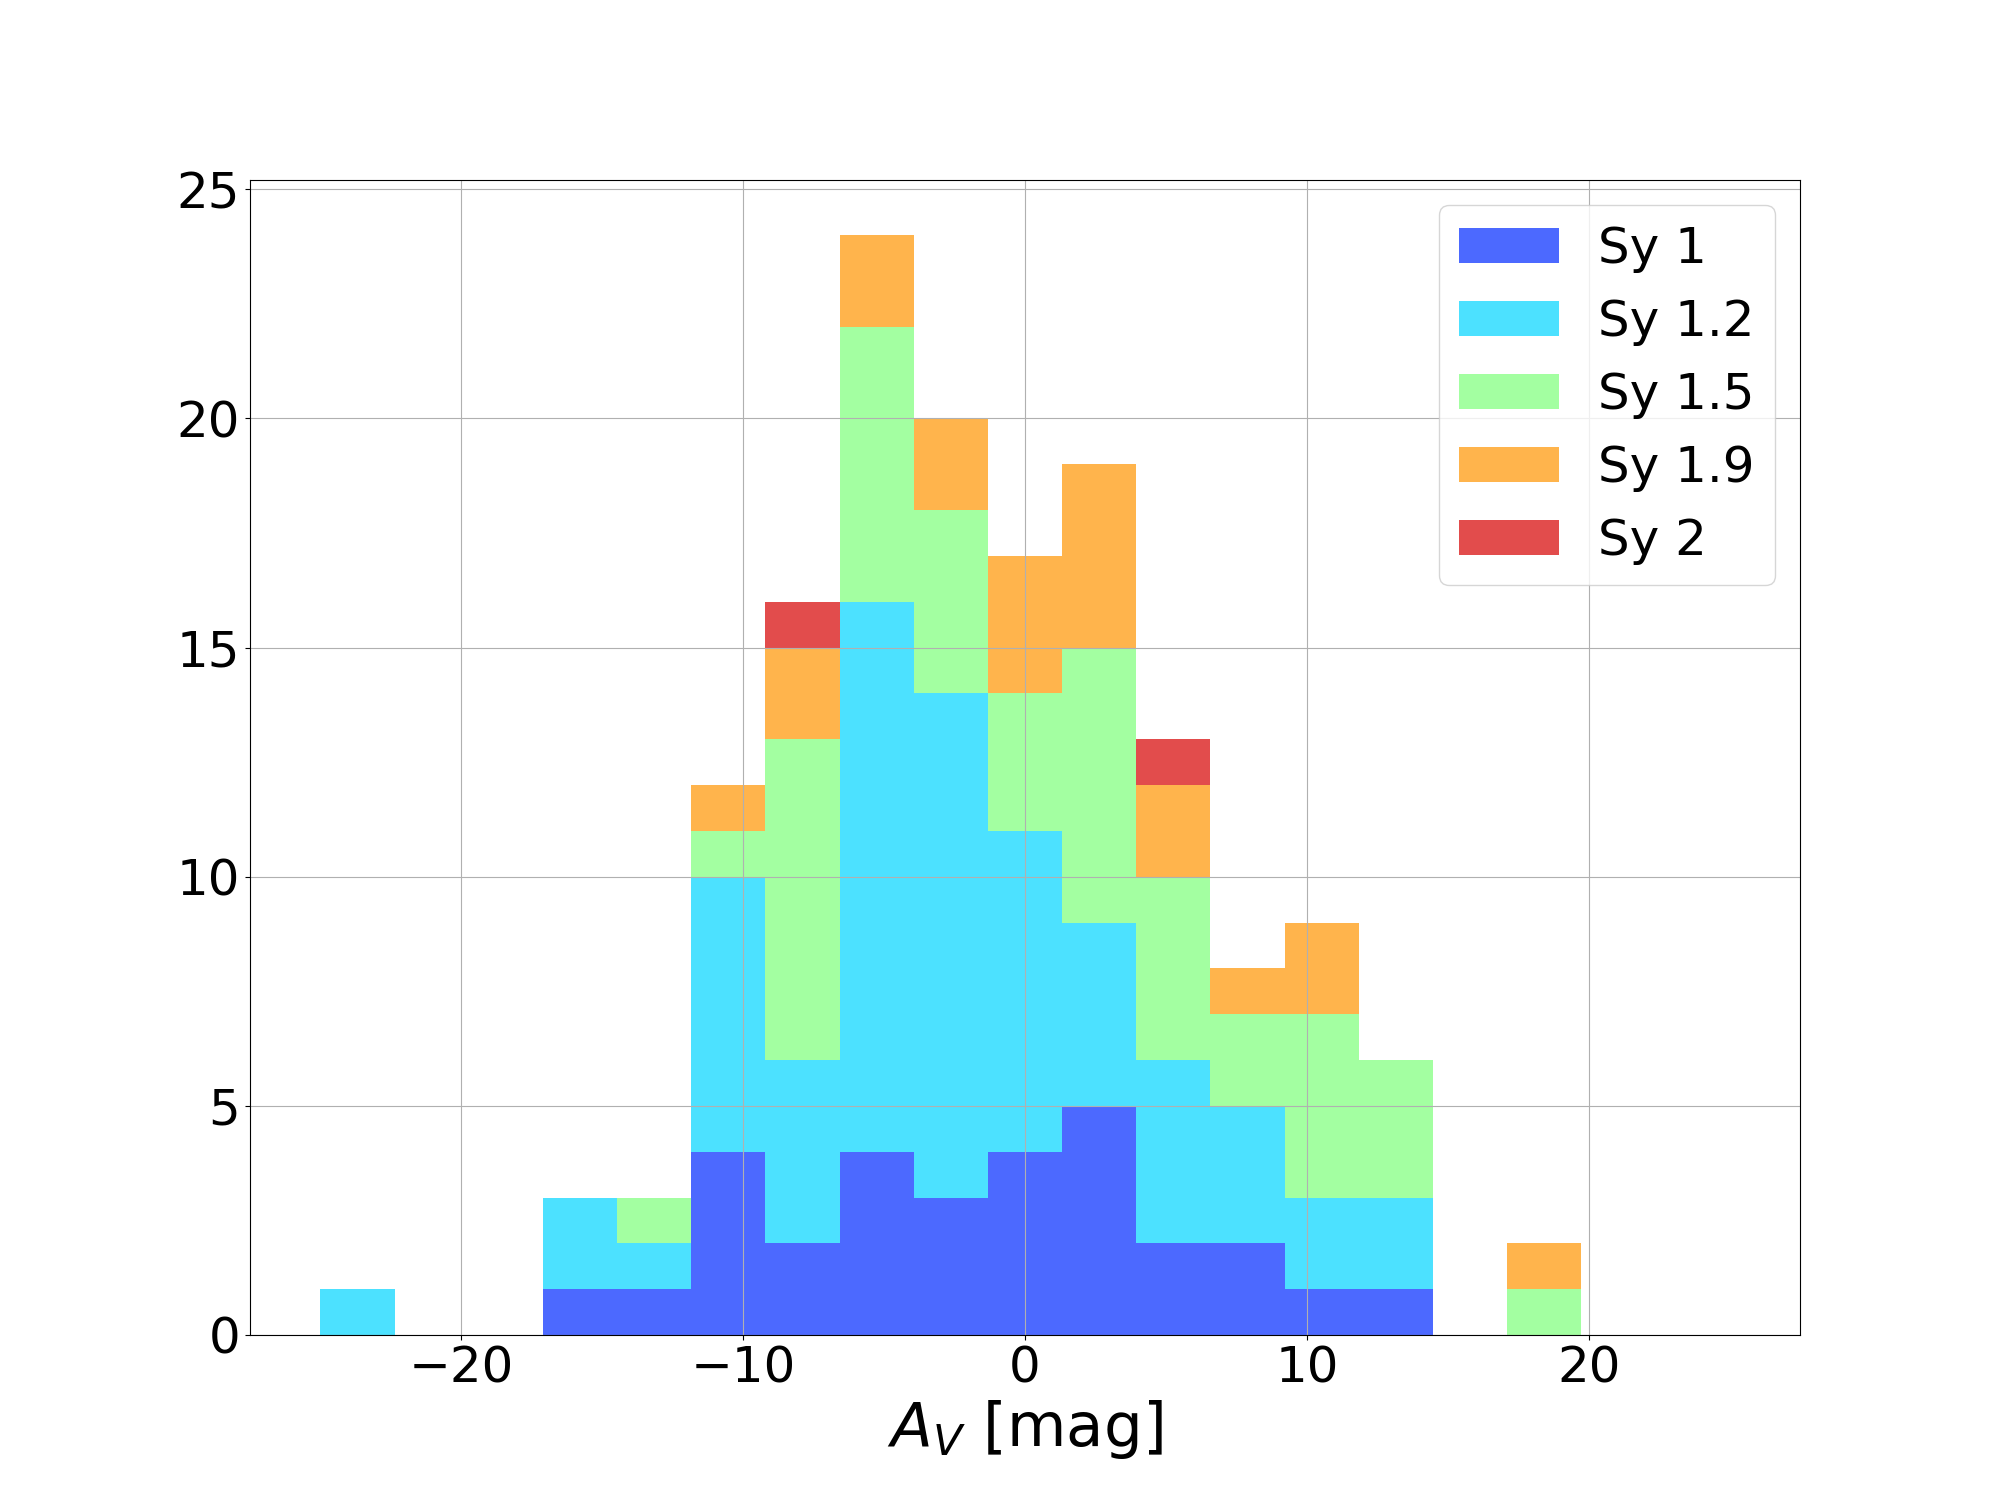
Fig. 5 shows the dust extinction compared with the hydrogen column density from the X-ray absorption. As reported from Fig. 3, almost all samples with distribute around mag, and these targets are dominated by Seyfert type-1–1.5 AGNs. Fig. 6 shows the distribution of of samples with . The average and the standard deviation of them are calculated as mag and 8.0 mag, which would be consistent with a distribution of the average with the typical measurement error for them of mag. Therefore, negative values for the same targets in Figs. 5 and 6 are considered to be mostly caused by the measurement error.
black In contrast, the typical of the samples shows a broad correlation with within mag in the range of . These samples with high are dominated by type-1.9–2 AGNs. They show a target-to-target difference in that spreads over about two orders of magnitude. In Fig. 5, we draw the relation between and for the standard of the Galactic diffuse ISM (–, Predehl & Schmitt, 1995; Nowak et al., 2012) for comparison. The data points for obscured AGNs are located above the Galactic curve, which indicates that these obscured AGNs have typically larger than the Galactic diffuse ISM. These trends for obscured AGNs agree with the results reported in the literature (e.g., Maiolino et al., 2001a; Burtscher et al., 2016). Although there are some data points below the Galactic curve at low (), they are considered to be mostly consistent with small values on the Galactic curve with their measurement errors (see Fig. 6). \colorblack Furthermore, the lower envelope of the data distribution of obscured AGNs is almost consistent with the Galactic curve, which is reported by Burtscher et al. (2016) for a smaller number of data.
black In Fig. 3, we draw the relation for the standard Galactic diffuse ISM. We found that the obscured AGNs with and have larger than the expected from the NIR FVG assuming the Galactic diffuse ISM. This trend is similar to that in Fig. 5.
| (1) | (2) | (3)a | (4)a | (5)a | (6) | (7) | (8) | (9)b | (10) | (11)b |
| Source | Counterpart | Redshift | Sy type | |||||||
| (cm-2) | (mag) | (mag) | ||||||||
| SWIFTJ0001.0-0708 | 2MASX J00004876-0709117 | 0.0375 | 1.9 | 22.19 | 0.96 | 0.879 | 0.71 | 0.07 | 9.6 | 8.2 |
| SWIFTJ0001.6-7701 | 2MASX J00014596-7657144 | 0.0584 | 1.9 | 20.00 | — | 0.866 | 1.04 | 0.09 | 8.0 | |
| SWIFTJ0003.3+2737 | 2MASX J00032742+2739173 | 0.0397 | 2 | 22.86 | — | 0.996 | 0.87 | 0.03 | 6.7 | |
| SWIFTJ0006.2+2012 | Mrk 335 | 0.0258 | 1.2 | 20.48 | 0.981 | 0.943 | 1.03 | 0.06 | 7.5 | |
| SWIFTJ0009.4-0037 | SDSS J000911.57-003654.7 | 0.0733 | 2 | 23.56 | — | 0.922 | 0.52 | 0.08 | 25.0 | 9.8 |
| SWIFTJ0021.2-1909 | LEDA 1348 | 0.0956 | 1.9 | 21.98 | 0.98 | 0.977 | 0.89 | 0.05 | 6.8 | |
| SWIFTJ0026.5-5308 | LEDA 433346 | 0.0629 | 1.9 | 20.00 | 0.983 | 0.982 | 0.93 | 0.06 | 7.1 | |
| SWIFTJ0029.2+1319 | PG 0026+129 | 0.142 | 1.2 | 20.00 | 0.962 | 0.905 | 0.94 | 0.11 | 8.0 | |
| SWIFTJ0034.6-0422 | 2MASX J00343284-0424117 | 0.213 | 2 | 23.45 | 0.992 | 0.892 | 0.41 | 0.06 | 30.7 | 8.2 |
| SWIFTJ0042.9-2332 | NGC 235A | 0.0222 | 1.9 | 23.5 | 0.939 | 0.942 | 0.36 | 0.04 | 47.0 | 8.6 |
| a Data are taken from BASS AGN catalogue (Koss et al., 2017; Ricci et al., 2017). | ||||||||||
| b The error. | ||||||||||
| (This table is available in its entirety in machine-readable form.) | ||||||||||
5 discussion
5.1 Comparison of extinction estimates in different methods
Burtscher et al. (2016) and Shimizu et al. (2018) measured the dust extinction in different methods for some of our target AGNs. In this section, we compare our estimates of dust extinction with those of these two studies.
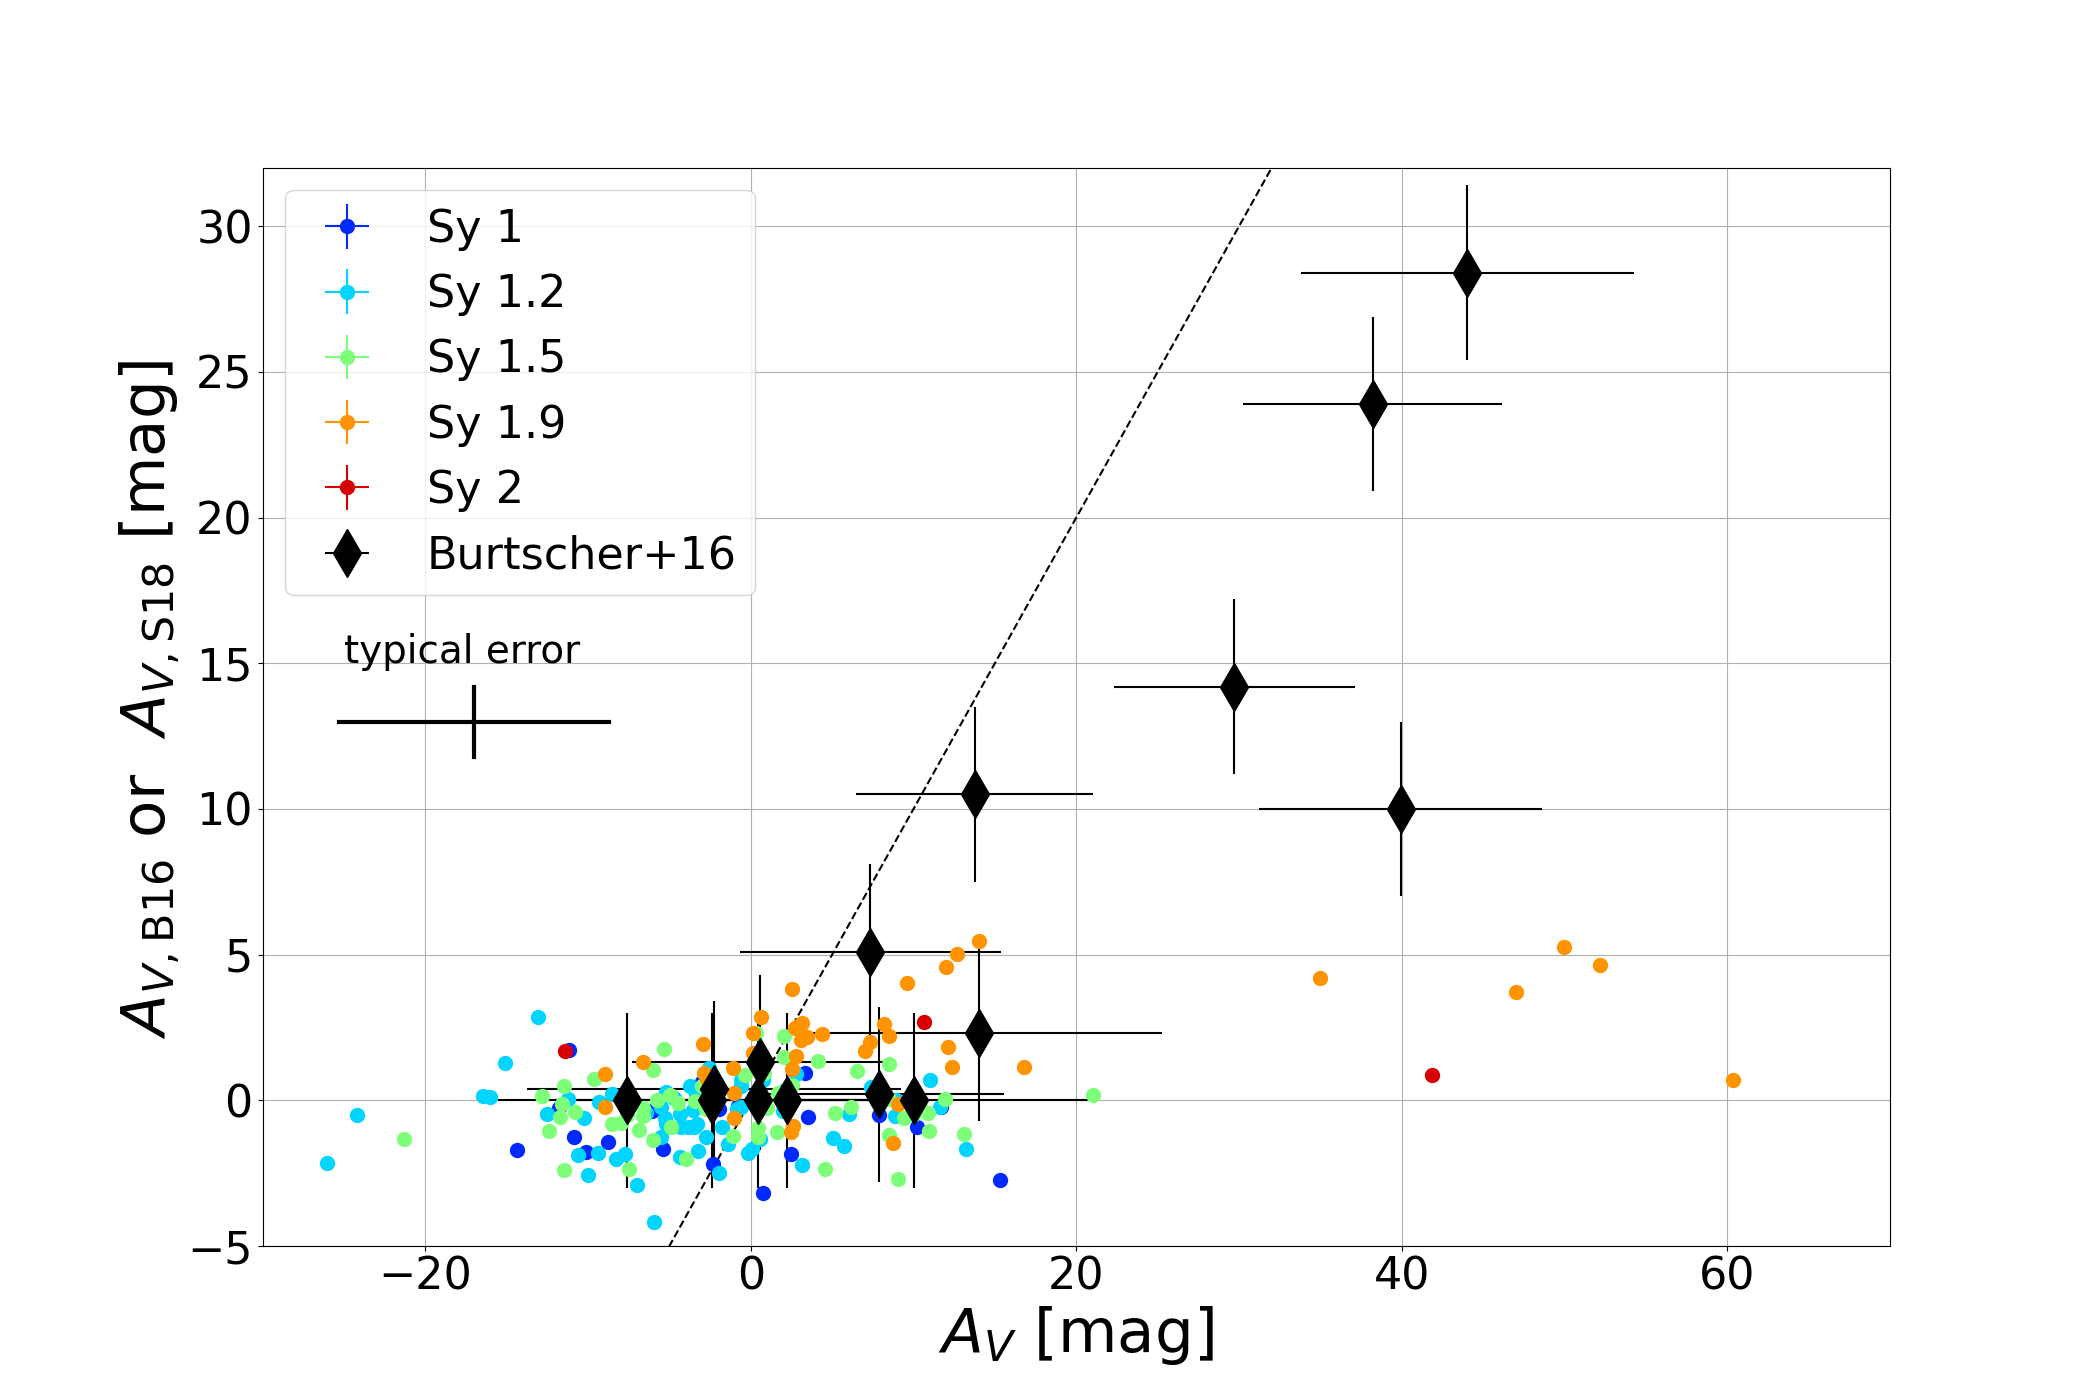
Burtscher et al. (2016) estimated the dust extinction of 29 AGNs based on the colour temperature of the -band continuum emission from the unresolved AGN core. They obtained the amount of reddening of the NIR thermal emission from hot dust in the innermost dusty torus, which is attributed to the dust extinction of the outer dusty torus. In Fig. 7, we compared our estimates of the dust extinction with those of Burtscher et al. (2016), for the common 15 AGNs. In Fig. 7, gets larger as increases, and is consistent with for the 11 targets in mag. However, for the four targets in mag, is systematically larger than by about 15 mag.
One possible reason for smaller than is the underestimation of the intrinsic colour temperature in the band assumed in Burtscher et al. (2016). Burtscher et al. (2016) adopted the intrinsic -band colour temperature of K, which is the mean colour temperature of their 13 type-1–1.9 AGNs. This is somewhat lower than the intrinsic colour temperature suggested by or colour in other works (e.g., Glass, 2004; Kishimoto et al., 2007), although the colour may suggest a hotter colour temperature than that in the band.
black In the case of heavily obscured AGNs, \colorblack another possible reason is the effect of \colorblackthe emission from cool extended dusty structure. \colorblack Burtscher et al. (2016) assumed that the observed -band emission came from the hot dust region in the innermost region of the dusty torus through the outer torus. \colorblackHowever, recent IR interferometric observations of NGC 1068 (Gámez Rosas et al., 2022) indicates that the -band emission come from cooler and extended structure shifted above the hot dust in the innermost dusty torus, and the -band emission is also the same. We consider that this interpretation would explain the difference between of Burtscher et al. (2016) and those of this study: single-epoch NIR emission for heavily obscured AGNs may be contaminated by the cooler extended component, which causes relatively low dust extinction, while most of the time-variable flux component would come from the compact hot dust region in the innermost dusty torus, which causes relatively high dust extinction. Furthermore, \colorblackalthough we use the NIR emission in the same way as Burtscher et al. (2016), the observed wavelengths of and bands are longer than that of the band, and so the former is more sensitive to the emission from the heavily obscured regions than the latter. Consequently, the extinction estimates in this study are expected to be less affected by the \colorblack emission from such an extended structure than those in Burtscher et al. (2016), and the difference of occurs for heavily obscured AGNs.
black Shimizu et al. (2018) estimated the dust extinction of the BASS AGNs by measuring the attenuation of the broad H emission compared to the 14–150 keV hard X-ray emission, assuming that the luminosity ratio between them for unobscured AGNs is constant. Because optical H emission is more sensitive to dust extinction, their method is expected to be advantageous for measuring a small amount of dust extinction for less obscured AGNs, as they reported that the typical uncertainty was estimated as mag. In Fig. 7, we compared our estimates of dust extinction with those of Shimizu et al. (2018), . For comparison, we calculated the for all of our targets whose broad H luminosity is available. We note that the value of presented in Shimizu et al. (2018) is reproduced for common AGNs. We found that both estimates were roughly consistent with one another for within the error. However, was smaller than our estimates for . A similar trend was observed by Xu et al. (2020) compared with their dust extinction estimates based on the mid-IR silicate absorption feature. We suspect that for obscured AGNs is underestimated because of the contribution of the broad H flux scattered in the polar region, as suggested by Xu et al. (2020). \colorblackAlthough typical degrees of H polarization for AGNs are very small (, see e.g. Ramos Almeida et al., 2016), the scattered H emission could be a significant contributor when the nuclear emission is attenuated by a factor of more than 100 ( mag). \colorblack This polarized H emission is often observed for Seyfert type-2 AGNs by spectropolarimetry (e.g., Antonucci & Miller, 1985).
blackAlthough the uncertainty of our estimate is larger than that of Burtscher et al. (2016) and Shimizu et al. (2018), our method can estimate for more-heavily obscured AGNs by using longer NIR wavelength, and can be applied to large number of AGNs easily by using the all-sky NIR monitoring data by WISE. These features of our method enables us to proceed statistical study of dust extinction for obscured AGNs.\colorblack
5.2 Distribution of dust extinction to neutral hydrogen absorption
We here discuss possible origins for the excess of ratios for obscured AGNs over the standard value for the Galactic diffuse ISM. There are two possible explanations for the excess over the Galactic value: (1) the decrease of the caused by the depletion of the small dust grains (e.g. Maiolino et al., 2001a, b), or (2) the increase of the caused by dust-free gas clouds covering the line of sight in the broad-line region (BLR) of the AGN (e.g. Granato et al., 1997; Burtscher et al., 2016).
In Scenario (1), the size distribution of dust grains in the dusty torus is larger than that of Galactic diffuse ISM, which decreases the observed dust reddening and extinction for fixed . The lack of the 2175Å carbon bump in the extinction curve of a typical type-1 AGN suggests the absence of small dust grains in AGN circumstances (e.g., Maiolino et al., 2001a, b; Gaskell et al., 2004; Czerny et al., 2004). Two mechanisms are proposed for depleting small dust grains in the dusty torus: (i) the coagulation or aggregation of small dust grains and their growth into larger dust grains (e.g., Maiolino et al., 2001a, b), and (ii) the selective destruction of small dust grains because of dust sublimation (e.g., Baskin & Laor, 2018) or the Coulomb explosion (Tazaki et al., 2020).
In Scenario (2), dust-free gas clouds are assumed to be located in the dust-free zone within the dust sublimation radius, such as in BLR, and their line-of-sight crossing causes a temporary increase in without an increase in dust extinction. This is supported by the time variation of the in time scales of months to years, which is observed in some AGNs (e.g., Risaliti et al., 2002; Burtscher et al., 2016). Burtscher et al. (2016) demonstrated the time variation of 15 AGNs, which vary between in several years. This fluctuating range roughly corresponds to the scattering range of obscured AGNs in Fig. 5, which strengthens this scenario. Furthermore, the target-to-target difference of for AGNs with can be explained by the difference in the extinction level because of the different gas density or number of dust-free gas clouds in the line of sight.
We here support the excess of the dust-free gas clouds as a major origin to explain the behaviour of of obscured AGNs, because (a) the dust-free gas scenario is easier to explain the large target-to-target difference in , (b) the extinction by the dusty torus with the Galactic dust properties can explain the lower envelope of the distribution of data that is consistent with that of the Galactic diffuse ISM, and (c) the dust-free gas scenario easily explains the time variation. For the common ten target AGNs with Burtscher et al. (2016), we overwrite the range of time variation of in Fig. 5 (Burtscher et al., 2016, and citation therein). The amplitude of variation is comparable to the range of the distribution of the obscured AGNs.
In addition, large dust grains may influence the distribution in a minor manner. We note that the lower envelope of the distribution of obscured AGNs in the mag region may appear to move slightly upward from that in the mag region in Fig. 5. This might indicate the effect of large dust grains in the mid-plane region of the dusty torus that might be observed from an edge-on view. Wada et al. (2019, 2021) suggest that the emission from the central engine does not effectively reach the mid-plane of the dusty torus and that the snow line is located around several parsecs from the centre. They concluded that, in such a case, small ice grains might grow into larger dust grains through aggregation.
6 Conclusion
In this study, we estimated the dust extinction of X-ray-selected AGNs using long-term NIR monitoring data obtained by WISE, and examined the relationship between the dust extinction and hydrogen column density.
Our results and conclusions are as follows:
1. We measured the flux variation gradient (FVG) using the flux data in and bands () of 513 samples and obtained it with an uncertainty of for more than 90% (463/513) of these samples.
2. We compared the NIR FVGs with Seyfert types and the line-of-sight neutral hydrogen column density .
For AGNs with , the majority of which are Seyfert type 1–1.5 AGNs, the NIR FVGs are distributed in a relatively narrow range regardless of the Seyfert types and the .
However, for AGNs with , the majority of which are Seyfert type 1.9–2 AGNs, the NIR FVGs show clear reddening when increases.
3. We determined the intrinsic NIR FVG by fitting the NIR FVGs for unobscured AGNs, and then we calculated the dust extinction for the 463 AGNs based on the reddening of their NIR FVGs.
This novel method is advantageous for measuring the dust extinction for a large sample of obscured AGNs because it uses the variable flux component attributed to the AGN, allows us to ignore the correction for host-galaxy emission, and because the thermal emission of hot dust in the NIR is observable even for obscured AGNs.
4. The of our obscured AGN samples is typically greater than that of the Galactic diffuse ISM, and the lower envelope of the distribution of these is consistent with that of the Galactic diffuse ISM. They have target-to-target scatter that spans approximately two orders of magnitude as has been reported in the literature. These behaviours of obscured AGNs can be explained by the scenario in which dust-free gas clouds in the BLR crossing the line of sight cause both the increase of and its time variation.
Acknowledgements
SM is supported by JST SPRING, Grant Number JPMJSP2108. HN is supported by Japan Society for the Promotion of Science (JSPS) KAKENHI with the Grant number of 19K21884, 20H01941, and 20H01947. HS is supported by Japan Society for the Promotion of Science (JSPS) KAKENHI with the Grant number of 19K03917.
This publication has made use of data products from the Wide- field Infrared Survey Explorer, which is a joint project of the University of California, Los Angeles, and the Jet Propulsion Laboratory/California Institute of Technology, funded by the National Aeronautics and Space Administration. This publication also makes use of data products from NEOWISE, which is a project of the Jet Propulsion Laboratory/California Institute of Technology, funded by the Planetary Science Division of the National Aeronautics and Space Administration.
We also acknowledge the use of public data from the BAT AGN Spectroscopic Survey.
This research has made use of the NASA/IPAC Extragalactic Database (NED), which is operated by the Jet Propulsion Laboratory, California Institute of Technology, under contract with the National Aeronautics and Space Administration.
data availability
The WISE data used in this study are publicly available in the NASA/IPAC Infrared Science Archive (https://irsa.ipac.caltech.edu/Missions/wise.html). The data of BASS AGN catalogue used in this study are also publicly available from the BASS website (https://www.bass-survey.com). The all data derived by the analyses of flux-flux plots in this study are available in the online version of this paper.
References
- Antonucci (1993) Antonucci R., 1993, ARA&A, 31, 473
- Antonucci & Miller (1985) Antonucci R. R. J., Miller J. S., 1985, ApJ, 297, 621
- Baker & Menzel (1938) Baker J. G., Menzel D. H., 1938, ApJ, 88, 52
- Barvainis (1987) Barvainis R., 1987, ApJ, 320, 537
- Baskin & Laor (2018) Baskin A., Laor A., 2018, MNRAS, 474, 1970
- Baumgartner et al. (2013) Baumgartner W. H., Tueller J., Markwardt C. B., Skinner G. K., Barthelmy S., Mushotzky R. F., Evans P. A., Gehrels N., 2013, ApJS, 207, 19
- Burrows et al. (2005) Burrows D. N., et al., 2005, Space Sci. Rev., 120, 165
- Burtscher et al. (2015) Burtscher L., et al., 2015, A&A, 578, A47
- Burtscher et al. (2016) Burtscher L., et al., 2016, A&A, 586, A28
- Combes (2017) Combes F., 2017, Frontiers in Astronomy and Space Sciences, 4, 10
- Czerny et al. (2004) Czerny B., Li J., Loska Z., Szczerba R., 2004, MNRAS, 348, L54
- Elvis et al. (1994) Elvis M., et al., 1994, ApJS, 95, 1
- Fabian (2012) Fabian A. C., 2012, ARA&A, 50, 455
- Fabian et al. (2009) Fabian A. C., Vasudevan R. V., Mushotzky R. F., Winter L. M., Reynolds C. S., 2009, MNRAS, 394, L89
- Fitzpatrick (1999) Fitzpatrick E. L., 1999, PASP, 111, 63
- Gámez Rosas et al. (2022) Gámez Rosas V., et al., 2022, Nature, 602, 403
- Gaskell (2017) Gaskell C. M., 2017, MNRAS, 467, 226
- Gaskell et al. (2004) Gaskell C. M., Goosmann R. W., Antonucci R. R. J., Whysong D. H., 2004, ApJ, 616, 147
- Glass (2004) Glass I. S., 2004, MNRAS, 350, 1049
- Granato et al. (1997) Granato G. L., Danese L., Franceschini A., 1997, ApJ, 486, 147
- Gravity Collaboration et al. (2020) Gravity Collaboration et al., 2020, A&A, 634, A1
- Harrison (2017) Harrison C. M., 2017, Nature Astronomy, 1, 0165
- Hernán-Caballero et al. (2016) Hernán-Caballero A., Hatziminaoglou E., Alonso-Herrero A., Mateos S., 2016, MNRAS, 463, 2064
- Hickox & Alexander (2018) Hickox R. C., Alexander D. M., 2018, ARA&A, 56, 625
- Hönig (2019) Hönig S. F., 2019, ApJ, 884, 171
- Imanishi (2001) Imanishi M., 2001, AJ, 121, 1927
- Jansen et al. (2001) Jansen F., et al., 2001, A&A, 365, L1
- Jarrett et al. (2011) Jarrett T. H., et al., 2011, ApJ, 735, 112
- Jun et al. (2021) Jun H. D., Assef R. J., Carroll C. M., Hickox R. C., Kim Y., Lee J., Ricci C., Stern D., 2021, ApJ, 906, 21
- Kalberla et al. (2005) Kalberla P. M. W., Burton W. B., Hartmann D., Arnal E. M., Bajaja E., Morras R., Pöppel W. G. L., 2005, A&A, 440, 775
- Kelly (2007) Kelly B. C., 2007, ApJ, 665, 1489
- Kishimoto et al. (2007) Kishimoto M., Hönig S. F., Beckert T., Weigelt G., 2007, A&A, 476, 713
- Kormendy & Ho (2013) Kormendy J., Ho L. C., 2013, ARA&A, 51, 511
- Kormendy & Richstone (1995) Kormendy J., Richstone D., 1995, ARA&A, 33, 581
- Koshida et al. (2014) Koshida S., et al., 2014, ApJ, 788, 159
- Koss et al. (2017) Koss M., et al., 2017, ApJ, 850, 74
- Lyu & Rieke (2021) Lyu J., Rieke G. H., 2021, ApJ, 912, 126
- Lyu et al. (2017) Lyu J., Rieke G. H., Shi Y., 2017, ApJ, 835, 257
- Lyu et al. (2019) Lyu J., Rieke G. H., Smith P. S., 2019, ApJ, 886, 33
- Magorrian et al. (1998) Magorrian J., et al., 1998, AJ, 115, 2285
- Mainzer et al. (2011) Mainzer A., et al., 2011, ApJ, 743, 156
- Mainzer et al. (2014) Mainzer A., et al., 2014, ApJ, 792, 30
- Maiolino et al. (2001a) Maiolino R., Marconi A., Salvati M., Risaliti G., Severgnini P., Oliva E., La Franca F., Vanzi L., 2001a, A&A, 365, 28
- Maiolino et al. (2001b) Maiolino R., Marconi A., Oliva E., 2001b, A&A, 365, 37
- Massaro et al. (2009) Massaro E., Giommi P., Leto C., Marchegiani P., Maselli A., Perri M., Piranomonte S., Sclavi S., 2009, A&A, 495, 691
- Minezaki et al. (2019) Minezaki T., et al., 2019, ApJ, 886, 150
- Mitsuda et al. (2007) Mitsuda K., et al., 2007, PASJ, 59, S1
- Mor et al. (2009) Mor R., Netzer H., Elitzur M., 2009, ApJ, 705, 298
- Netzer (2015) Netzer H., 2015, ARA&A, 53, 365
- Noda et al. (2020) Noda H., Kawamuro T., Kokubo M., Minezaki T., 2020, MNRAS, 495, 2921
- Nowak et al. (2012) Nowak M. A., et al., 2012, ApJ, 759, 95
- Predehl & Schmitt (1995) Predehl P., Schmitt J. H. M. M., 1995, A&A, 500, 459
- Ramos Almeida et al. (2016) Ramos Almeida C., Martínez González M. J., Asensio Ramos A., Acosta-Pulido J. A., Hönig S. F., Alonso-Herrero A., Tadhunter C. N., González-Martín O., 2016, MNRAS, 461, 1387
- Ricci et al. (2017) Ricci C., et al., 2017, ApJS, 233, 17
- Risaliti et al. (2002) Risaliti G., Elvis M., Nicastro F., 2002, ApJ, 571, 234
- Schlafly & Finkbeiner (2011) Schlafly E. F., Finkbeiner D. P., 2011, ApJ, 737, 103
- Schnorr-Müller et al. (2016) Schnorr-Müller A., et al., 2016, MNRAS, 462, 3570
- Shimizu et al. (2018) Shimizu T. T., et al., 2018, ApJ, 856, 154
- Suganuma et al. (2006) Suganuma M., et al., 2006, ApJ, 639, 46
- Tazaki et al. (2020) Tazaki R., Ichikawa K., Kokubo M., 2020, ApJ, 892, 84
- Wada et al. (2019) Wada K., Tsukamoto Y., Kokubo E., 2019, ApJ, 886, 107
- Wada et al. (2021) Wada K., Tsukamoto Y., Kokubo E., 2021, ApJ, 909, 96
- Ward et al. (1987) Ward M., Elvis M., Fabbiano G., Carleton N. P., Willner S. P., Lawrence A., 1987, ApJ, 315, 74
- Weisskopf et al. (2000) Weisskopf M. C., Tananbaum H. D., Van Speybroeck L. P., O’Dell S. L., 2000, in Truemper J. E., Aschenbach B., eds, Society of Photo-Optical Instrumentation Engineers (SPIE) Conference Series Vol. 4012, X-Ray Optics, Instruments, and Missions III. pp 2–16 (arXiv:astro-ph/0004127), doi:10.1117/12.391545
- Winkler et al. (1992) Winkler H., Glass I. S., van Wyk F., Marang F., Jones J. H. S., Buckley D. A. H., Sekiguchi K., 1992, MNRAS, 257, 659
- Wright et al. (2010) Wright E. L., et al., 2010, AJ, 140, 1868
- Xu et al. (2020) Xu J., Sun M.-Y., Xue Y.-Q., Li J.-Y., He Z.-C., 2020, Research in Astronomy and Astrophysics, 20, 147
- Yang et al. (2020) Yang Q., et al., 2020, ApJ, 900, 58