Prediction of Adsorption in Nano-Pores with Graph Neural Networks
Abstract
We investigate the graph-based convolutional neural network approach for predicting and ranking gas adsorption properties of crystalline Metal-Organic Framework (MOF) adsorbents for application in post-combustion capture of . Our model is based solely on standard structural input files containing atomistic descriptions of the adsorbent material candidates. We construct novel methodological extensions to match the prediction accuracy of classical machine learning models that were built with hundreds of features at much higher computational cost. Our approach can be more broadly applied to optimize gas capture processes at industrial scale.
Introduction
The discovery of new materials for carbon capture is a major research challenge for its technical complexity and potential global impact. There are potentially millions of materials that are candidates for adsorbents of from the flue gas of point-source emitters, such as fossil fuel-based power plants. Identifying the most suitable material for a given post-combustion capture scenario requires screening of an inordinate number of material candidates. Among the classes of solid-state adsorbents, Metal-Organic Frameworks (MOFs) stand out for their chemical diversity and customisable porous structure (Moosavi et al. 2020). While experimental screening is rendered unviable by its high cost, computational screening that uses physics-based simulations presents significant challenges. Since it is not feasible to perform molecular-level simulations for millions of material candidates, novel hierarchical screening methods for scientific inference in materials research are required. Existing materials screening approaches contain a top layer in which rapid geometric and topological characterisations of the materials are deployed to eliminate samples with less favorable properties. By using this approach, only the properties of the most promising material candidates are subsequently calculated using molecular-level physics simulation, significantly reducing discovery time and computational cost. This approach is promising; however, these top layer topological and geometric descriptors can only classify samples for elimination or further study. Furthermore, they neglect the intricate chemical interactions between various atomic species present in the nanopore framework and gas phase, thus limiting the effectiveness of such descriptors as a screening tool. A data-driven framework is, therefore, needed which explicitly accounts for the complete set of geometric, topological, and chemical mechanisms that determine the results of molecular property simulations.
Previous studies have employed a variety of geometric, topological and chemical descriptors to analyse the adsorption performance of nanoporous materials. Geometric features can include the accessible pore surface area and volume, pore diameter metrics and crystal density (Boyd and Woo 2016; Coudert and Fuchs 2016; Lee et al. 2018; Dureckova et al. 2019; Zhang et al. 2019; Deeg et al. 2020; Jablonka et al. 2020; Krishnapriyan, Haranczyk, and Morozov 2020). Topological representations of the materials can be generated using concepts extracted from persistent homology, and clustering of high performance materials with similar topologies can be performed (Lee et al. 2017, 2018; Zhang et al. 2019; Chung and Lawson 2019; Krishnapriyan, Haranczyk, and Morozov 2020). These topological methods can also be combined with chemical information to enhance correlations between the descriptors and the material adsorption properties (Townsend et al. 2020). Recently, in a comprehensive article (Moosavi et al. 2020), a set of 165 geometric and chemical material descriptors were built and combined with classical machine learning techniques to train algorithms for predicting the adsorption performance of samples from several large MOF databases.
An alternative approach, which frees the material scientist from having to calculate a multitude of descriptors beforehand, is using deep learning methods such as the Crystal Graph Convolutional Neural Network (CGCNN) (Xie and Grossman 2018). Originally developed for predicting electronic properties of crystalline materials, such as formation energy, absolute energy and band gap, this model learns material properties from the atoms in the crystal and their nearest-neighbour connections. In a derived work (Rosen et al. 2021), the original CGCNN formulation was shown to outperform the accuracy of several other descriptor-based regression models in a high-throughput material screening study of electronic properties. Other deep learning models such as an improved CGCNN (iCGCNN) model (Park and Wolverton 2020), and a geometric-information-enhanced crystal graph neural network (GeoCGNN) (Cheng, Zhang, and Dong 2021) have further improved prediction accuracy.
In one of the few attempts to merge the use of CGCNN with gas adsorption prediction (Wang et al. 2020), the authors applied high-throughput Grand Canonical Monte Carlo (GCMC) calculations to 10,000 entries in the CoRE-2019 materials database (Chung et al. 2019) to train a machine learning classifier that distinguishes materials into high- or low-performance categories. The GCMC simulation is a physics-based statistical method that searches for the equilibrium state of a thermodynamic system based on probabilities that depend on the inter-atomic energy between the framework and the adsorbate atoms. This was applied as a pre-screening step for selecting the most promising candidates for further analysis out of a much larger hypothetical MOF database (Wilmer et al. 2012) containing more than 320,000 materials. The CGCNN classifier was able to identify a small fraction of the database, less than , as deserving of further investigation via GCMC simulations.
To date, the use of CGCNNs for creating deep learning regression models capable of predicting and ranking the gas adsorption capacity of nano-porous material candidates based on their atomistic description has not been reported. In the following, we demonstrate an enhanced CGCNN model with significantly improved overall accuracy. This surrogate model can replace the Physics-based simulation and compute material properties in a fraction of the time and with a fraction of computational resources.
Enhanced Crystal Graph Convolutions
We introduce our Enhanced Crystal Graph Convolutional Neural Network (ECGCNN) in relation to the popular CGCNN (Xie and Grossman 2018), and describe our neural network architecture augmentations that significantly improve the prediction of adsorption properties.
In order to build a predictive model based on graph convolutions, the crystal structure of the MOF is represented by a graph that encodes both atomic information and bonding interactions between atoms. The vertices of the graph represent atoms, and the edges represent the atoms’ nearest neighbors, determined by the Euclidean distance between the atoms in 3D Cartesian space; i.e., atoms closer than a threshold distance are considered neighbors and will have an edge connecting them. In fact, there are multiple edges between the same pair of neighbors to represent periodicity in the crystal. Feature vectors corresponding to vertices and edges encode atom and bond properties, respectively. A convolutional neural network is built atop the graph to automatically extract representations that are optimum for predicting target physical properties. The reader is referred to the original paper (Xie and Grossman 2018) for a detailed description of CGCNN.
Notation
denotes an undirected multigraph defined by a vertex set representing the atoms of a crystal with an -atom unit cell and edges representing connections between atoms and , where . allows multiple edges between the same pair of vertices to represent periodicity of the crystal structure; therefore, represents the -th bond between and . A feature vector is associated with each vertex and a feature vector is associated with each edge .
Graph Convolution
Graph Neural Networks (GCNs) apply convolutions to features according to the relationship defined by the graph. The vanilla GCN by Kipf and Welling is a localized first-order approximation of spectral graph convolutions (Kipf and Welling 2016).
| (1) |
Here is the feature vector at vertex at convolution level . For each vertex , its hidden feature vector at next level is computed by aggregating hidden states of its neighbors and possibly of the incident edges as well. In Equation 1, is a constant, is the bias vector, and is the weight matrix; the latter two are parameters to be learned. A prominent feature of GCN that is shared by its later extensions is the message passing mechanism that propagates information through the connections among nodes in the graph.
Graph convolutions for crystal structures have a few major differences from typical GCNs. There can be multiple edges between a pair of nodes, and also the incident edges for a node may change depending on how large a neighborhood is considered according to the strength of the bonds.
Existing GCNs for crystal structures emphasizes the importance of edge features in learning. At level , the feature vector for vertex is computed by a vertex convolution function using the previous level’s features from ’s neighbors and from all edges incident on as follows:
| (2) |
Typically is a linear combination of all features involved with some nonlinear activation function. As long as it aggregates the features from adjacent vertices and edges, ’s definition can be chosen to suitably meet the requirements and the characteristics of the application at hand. In the original CGCNN paper, Xie and Grossman used the following definition:
| (3) |
where denotes element-wise multiplication, is the Sigmoid function, is a nonlinear activation function, and is the concatenation of , , and . and are the shared convolution weight matrix and bias vector, and and are the self weight matrix and bias vector, respectively.
Note the subtle differences between Equation 1 and Equations 2 and Graph Convolution. Equations 2 and Graph Convolution compute for a vertex by first deriving features using both edge features and node features, and then combine them.
Edge Convolution
Edge features are obviously critical to learning the properties of a crystal structure. Notice that Equation Graph Convolution for CGCNN uses the edge features as input to the convolution, but these features themselves remain unchanged through the convolution steps. As shown in the Results section, introducing parameters (weights) associated with the edges and evolving edge features through an edge-convolution function yielded a significant improvement in prediction accuracy.
We introduce convolution to the edges as follows:
where
Now a convolution layer produces two kinds of outputs, one feature for each vertex, and one feature for each edge.
Attention
Attention mechanism has been shown to be a powerful mechanism in deep learning, especially in learning with sequences. In deep neural networks, attention mimics cognitive attention and can capture spacial or temporal interdependence between the most relevant parts of the input. In the graph neural networks, an attention function is learned simultaneously with the features (Velickovic et al. 2018).
An elementary form of attention (or more precisely, a gated mechanism) is implemented in CGCNN shown in Equation Graph Convolution by the Sigmoid function. Note that the added is similar to the concept of pass-through connection first introduced in ResNet (He et al. 2016). We introduce formally the attention mechanism as follows:
Here in producing a feature vector , the neural network attends to features of all neighbors of . Since the neighbors’ features are computed using edge features as well, this mechanism also implicitly attends to the edge features.
Multi-head Attention and beyond
Multi-head attention has been shown to improve the performance of graph convolution (Velickovic et al. 2018). With multi-head attention, multiple attention mechanisms concurrently attend to the neighbors and incident edges of a vertex. The equation below illustrates one way of implementing multi-head attention (with heads) to a graph convolution where the outputs of the attention heads are averaged.
where and .
Instead of averaging, we leverage another layer of attention mechanism in combining the results from multiple attend heads. We generate two features, and , from each attention head at level and use them as below:
Other Considerations
Vanilla graph convolution suffers from over-smoothing when the networks become deep. Recently proposed architectures address this deficiency with various techniques (Chen et al. 2020; Li et al. 2021). For example, initial residual and identity mapping are introduced to GCN to overcome over-smoothing, and achieve good performance on standard benchmarks (Chen et al. 2020). However, in our experimentation, we observed that such techniques did not bring tangible improvement in predicting adsorption. This could be in part due to the highly regular structure of crystal graph and the importance of the edge features.
Some prior work in using graph convolutions to predict the material properties of crystal structures explores incorporating various physical atomic interaction expressions (Chen et al. 2019; Unke and Meuwly 2019; Cheng, Zhang, and Dong 2021), including electronic state wave functions, directly into the neural network. Unfortunately, such techniques cannot be readily applied to our use case as all relevant pairwise atomic interactions in the adsorption simulation are between individual gas molecules and individual framework atoms. While the latter are represented by nodes in our network, the former are not explicitly represented and thus their relative proximity and resultant attractive/repulsive interaction cannot be computed.
Results
We report the performance of ECGCNN for predicting gas uptake.
Training Data
The training dataset was built from existing Crystallographic Information File (CIF) databases (Moosavi et al. 2020). The CoRE-19 database (Chung et al. 2019) contains 9,525 MOF materials, while the BW-20K database is a subset of the original BW-DB database (Boyd and Woo 2016) containing only 19,379 out of 320,000 MOFs.
Each CIF file describes the associated material at an atomistic level, including the atomic number (), atomic coordinates (), and atomic partial charges () of each atom in the crystal. It also contains the geometric features of the crystallographic cell, such as the cell lengths () and cell angles (). With the atomic coordinates and the periodicity of the crystal cell, one can identify pairs of nearest neighbour atoms and the inter-atomic distance between them. The information about cell geometry was not used in the original CGCNN (Xie and Grossman 2018); including it in training resulted in a slight improvement of our model.
The target adsorption properties of the materials were calculated using Physics-based GCMC simulations that only take the CIF as input. The gas uptake for each material was calculated at room temperature for high (16 bar) and low (0.15 bar) pressures, simulating adsorption and desorption conditions, respectively. For more details on the GCMC simulations, please refer to Moosavi et al. (2020).
Hyper-Parameters
In our experiments, we use four layers of graph convolution. The original input vertex and edge feature vectors are the same ones that are employed in (Xie and Grossman 2018). The vertex features encode several atomic properties and the edge features encode atomic distance. These vectors are first embedded into dimensional vectors before graph convolution. All hidden features for the vertices and edges are and dimensional, respectively. We use three attention heads and ReLU for activation. Average pooling is used to pool from the atom features into a feature for the corresponding crystal. A two-layer multilayer perceptron (MLP) is used to predict the adsorption of the crystal. These fully connected layers are , and , respectively. In constructing the graph, we regard the neighbors of each atom to be the nearest atoms within a radius of Å. The Adam optimizer used with learning rate and weight decay. We train for epochs with the training set, and report the test accuracy on the test set with the model that achieved the best validation accuracy on the validation set. We randomly split the datasets into training, validation, and test sets. The reported results are averaged over five splits.
Mean Absolute Error and Spearman Rank Correlation Coefficient
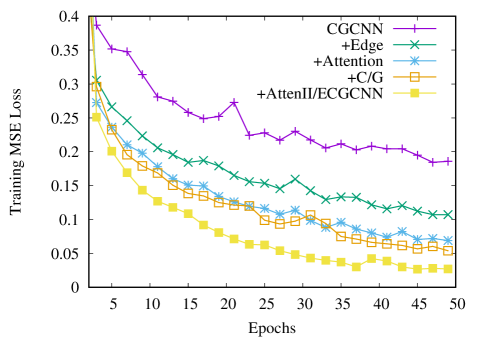
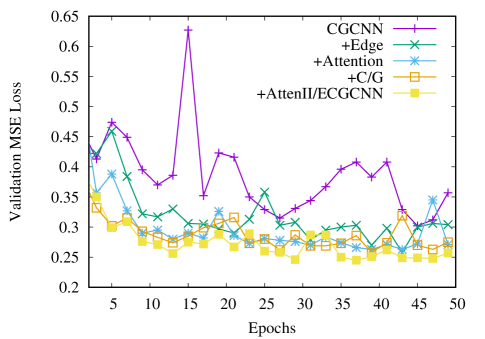
The infusion of our enhancements into the CGCNN significantly improves the training performance of the network. Figure 1 shows the evolution of training mean squared error (MSE) loss with the number of training epochs for the various GCNs for the BW-20K dataset at pressure 0.15 bar. In our experiment we start with CGCNN, and then introduce edge convolution, attention mechanism, atom charge information and geometric features, and then multi-head attention incrementally to the plain convolution used in CGCNN. It is clear from the plot that as the neural network becomes more complex and/or more new physics features are included, better training results (lower losses) are achieved. Figure 2 shows the evolution of validation MSE loss with the number of training epochs.
| Metric | CGCNN | +Edge | +Attention | +C/G | + AttenII/ECGCNN |
|---|---|---|---|---|---|
| train MSE | 0.197 | 0.110 | 0.066 | 0.058 | 0.023 |
| train MAE | 0.304 | 0.231 | 0.184 | 0.175 | 0.112 |
| test MAE | 0.304 | 0.260 | 0.256 | 0.256 | 0.239 |
| test SRCC | 0.923 | 0.931 | 0.932 | 0.932 | 0.943 |
The performance of the original CGCNN on this data set, and of the network with each incremental additional enhancement, is detailed in Table 1. The networks show a monotonic increase in performance in the training phase, as dictated by an overall reduction of 88% in the training MSE and 63% in training mean average error (MAE). This trend is replicated with a reductions of 21% in the test MAE and a 2% rise in the test Spearman ranking (SRCC). Note that we deployed a train-test-validation split of 80:10:10 to produce these results recorded in the first five columns of Table 1.
In Table 2, we contrast the test performance of our most enhanced crystal graph convolutional neural network (ECGCNN) to the previous best results obtained for this data set using the application of classical machine learning techniques to geometric and chemical material properties (Moosavi et al. 2020), for all combinations of temperatures and pressures available in this reference. The two middle columns employ the approximate 70-30 test-train split used by Moosavi et al. while the rightmost column corresponds to the 80-10-10 test-train-validation split used earlier in Table 1. Across the four distinct data sets corresponding to two sets of materials simulated under low (0.15 Bar) and high (16 Bar) pressure conditions, one can observe similar performance between our ECGCNN model and the framework outlined by Moosavi et al. for the first three data sets. This observation holds for both absolute (test MAE) and relative (SRCC) metrics. Both of these performance metrics also improve significantly when one deploys the 80-10-10 test-train-validation split compared to the 70-30 test-train split used in the referenced study.
| Metric | Moosavi7:3 | ECGCNN7:3 | ECGCNN8:1:1 |
| BW-20K, 0.15 bar | |||
| MAE | 0.3 | 0.293 | 0.239 |
| SRCC | 0.92 | 0.920 | 0.943 |
| BW-20K, 16 bar | |||
| MAE | 0.74 | 0.73 | 0.62 |
| SRCC | 0.99 | 0.99 | 0.993 |
| CoRE-2019, 0.15 bar | |||
| MAE | 0.54 | 0.54 | 0.49 |
| SRCC | 0.84 | 0.83 | 0.85 |
| CoRE-2019, 16 bar | |||
| MAE | 0.58 | 1.0 | 0.93 |
| SRCC | 0.98 | 0.92 | 0.93 |
Discussion and Future Work
In this paper we introduce a novel Enhanced Crystal Graph Convolutional Neural Network that rivals the performance of the state-of-the-art classical machine learning approaches in the literature (Moosavi et al. 2020). In the referenced article, the authors construct a complex feature set of 165 chemical and geometric descriptors before deploying classical machine learning regression techniques to train their model. Our simpler model does not require the computation of a feature set and relies purely on known atomic properties and the information already encoded within the input file—the same information that is ingested by physics-based GCMC simulations for predicting adsorption properties.
This result is achieved despite the fact that our model does not fully account for gas molecule specificity. Future work needs to be done to incorporate the long-range inter-atomic potential between the molecules and the framework atoms into our network. In particular, this would require the network to provide an accurate prediction of the final positions and orientations of the adsorbed gas molecules in the solid crystalline materials. The accomplishment of this task would represent a significant step beyond existing graph convolution models for crystalline materials which only account for the constituent atoms of the solid crystals and neglect any interaction with unbound gas or liquid molecules. The set of pairwise inter-atomic interactions is the last significant piece of physical information encoded within the simulation input file that is not utilised in our current model.
The limitations in the inclusion of gas molecule specificity in our ECGCNN model may explain the variations in its overall performance on the data sets presented in Table 2. In the benchmark paper (Moosavi et al. 2020), the relative importance of the 165 chemical and geometric descriptors indicates that chemical specificity is more important for the CoRE-2019 data set relative to the BW-20K data set. The observations could explain why our ECGCNN metrics in Table 2 are better for the BW-20K data set over the CoRE-2019 data set.
Future work beyond refining the interaction between CO2 molecules and the constituent atoms within the network, could include the calibration of the model to additional adsorption target properties. In particular, investigating the evolution of these properties within varying pressure or temperature ranges would allow us to extract engineering metrics that are vital for process engineering optimisation (Farmahini et al. 2021).
Conclusions
We have constructed an enhanced crystal graph convolution neural network (ECGCNN) to predict the carbon dioxide adsorption properties of MOF crystalline nanoporous materials. Our ECGCNN framework matches the best reported performance of classical machine learning methods, which require the costly computation of more than a hundred chemical and geometric material features. Future work could include greater gas molecule specificity within the network, as well as the training of the model to chemical process figures-of-merit for increased efficiency.
Acknowledgements
This material is based upon work supported in part by the U.S. Department of Energy, Office of Science, Office of Advanced Scientific Computing Research, under contract number DE-AC05-00OR22725, and in part by the Laboratory Directed Research and Development Program of Oak Ridge National Laboratory, managed by UT-Battelle, LLC.
This research used resources of the Compute and Data Environment for Science (CADES) at the Oak Ridge National Laboratory, which is supported by the Office of Science of the U.S. Department of Energy under Contract No. DE-AC05-00OR22725.
This work was also supported by the Hartree National Centre for Digital Innovation, a collaboration between STFC and IBM.
References
- Boyd and Woo (2016) Boyd, P. G.; and Woo, T. K. 2016. A generalized method for constructing hypothetical nanoporous materials of any net topology from graph theory. CrystEngComm, 18(21): 3777–3792.
- Chen et al. (2019) Chen, C.; Ye, W.; Zuo, Y.; Zheng, C.; and Ong, S. P. 2019. Graph networks as a universal machine learning framework for molecules and crystals. Chemistry of Materials, 31(9): 3564–3572.
- Chen et al. (2020) Chen, M.; Wei, Z.; Huang, Z.; Ding, B.; and Li, Y. 2020. Simple and Deep Graph Convolutional Networks. In III, H. D.; and Singh, A., eds., Proceedings of the 37th International Conference on Machine Learning, volume 119 of Proceedings of Machine Learning Research, 1725–1735. PMLR.
- Cheng, Zhang, and Dong (2021) Cheng, J.; Zhang, C.; and Dong, L. 2021. A geometric-information-enhanced crystal graph network for predicting properties of materials. Communications Materials, 2(1): 1–11.
- Chung et al. (2019) Chung, Y. G.; Haldoupis, E.; Bucior, B. J.; Haranczyk, M.; Lee, S.; Zhang, H.; Vogiatzis, K. D.; Milisavljevic, M.; Ling, S.; Camp, J. S.; et al. 2019. Advances, updates, and analytics for the computation-ready, experimental metal–organic framework database: CoRE MOF 2019. Journal of Chemical & Engineering Data, 64(12): 5985–5998.
- Chung and Lawson (2019) Chung, Y.-M.; and Lawson, A. 2019. Persistence curves: A canonical framework for summarizing persistence diagrams. arXiv preprint arXiv:1904.07768.
- Coudert and Fuchs (2016) Coudert, F.-X.; and Fuchs, A. H. 2016. Computational characterization and prediction of metal–organic framework properties. Coordination Chemistry Reviews, 307: 211–236.
- Deeg et al. (2020) Deeg, K. S.; Damasceno Borges, D.; Ongari, D.; Rampal, N.; Talirz, L.; Yakutovich, A. V.; Huck, J. M.; and Smit, B. 2020. In silico discovery of covalent organic frameworks for carbon capture. ACS Applied Materials & Interfaces, 12(19): 21559–21568.
- Dureckova et al. (2019) Dureckova, H.; Krykunov, M.; Aghaji, M. Z.; and Woo, T. K. 2019. Robust machine learning models for predicting high CO2 working capacity and CO2/H2 selectivity of gas adsorption in metal organic frameworks for precombustion carbon capture. The Journal of Physical Chemistry C, 123(7): 4133–4139.
- Farmahini et al. (2021) Farmahini, A. H.; Krishnamurthy, S.; Friedrich, D.; Brandani, S.; and Sarkisov, L. 2021. Performance-based screening of porous materials for carbon capture. Chemical Reviews, 121(17): 10666–10741.
- He et al. (2016) He, K.; Zhang, X.; Ren, S.; and Sun, J. 2016. Deep residual learning for image recognition. In Proceedings of the IEEE conference on computer vision and pattern recognition, 770–778.
- Jablonka et al. (2020) Jablonka, K. M.; Ongari, D.; Moosavi, S. M.; and Smit, B. 2020. Big-data science in porous materials: materials genomics and machine learning. Chemical Reviews, 120(16): 8066–8129.
- Kipf and Welling (2016) Kipf, T. N.; and Welling, M. 2016. Semi-supervised classification with graph convolutional networks. arXiv preprint arXiv:1609.02907.
- Krishnapriyan, Haranczyk, and Morozov (2020) Krishnapriyan, A. S.; Haranczyk, M.; and Morozov, D. 2020. Topological descriptors help predict guest adsorption in nanoporous materials. The Journal of Physical Chemistry C, 124(17): 9360–9368.
- Lee et al. (2017) Lee, Y.; Barthel, S. D.; Dłotko, P.; Moosavi, S. M.; Hess, K.; and Smit, B. 2017. Quantifying similarity of pore-geometry in nanoporous materials. Nature Communications, 8(1): 1–8.
- Lee et al. (2018) Lee, Y.; Barthel, S. D.; Dłotko, P.; Moosavi, S. M.; Hess, K.; and Smit, B. 2018. High-throughput screening approach for nanoporous materials genome using topological data analysis: application to zeolites. Journal of Chemical Theory and Computation, 14(8): 4427–4437.
- Li et al. (2021) Li, G.; Mueller, M.; Qian, G.; Delgadillo Perez, I. C.; Abualshour, A.; Thabet, A. K.; and Ghanem, B. 2021. DeepGCNs: Making GCNs Go as Deep as CNNs. IEEE Transactions on Pattern Analysis and Machine Intelligence, 1–1.
- Moosavi et al. (2020) Moosavi, S. M.; Nandy, A.; Jablonka, K. M.; Ongari, D.; Janet, J. P.; Boyd, P. G.; Lee, Y.; Smit, B.; and Kulik, H. J. 2020. Understanding the diversity of the metal-organic framework ecosystem. Nature Communications, 11(1): 1–10.
- Park and Wolverton (2020) Park, C. W.; and Wolverton, C. 2020. Developing an improved crystal graph convolutional neural network framework for accelerated materials discovery. Physical Review Materials, 4(6): 063801.
- Rosen et al. (2021) Rosen, A. S.; Iyer, S. M.; Ray, D.; Yao, Z.; Aspuru-Guzik, A.; Gagliardi, L.; Notestein, J. M.; and Snurr, R. Q. 2021. Machine learning the quantum-chemical properties of metal–organic frameworks for accelerated materials discovery. Matter, 4(5): 1578–1597.
- Townsend et al. (2020) Townsend, J.; Micucci, C. P.; Hymel, J. H.; Maroulas, V.; and Vogiatzis, K. D. 2020. Representation of molecular structures with persistent homology for machine learning applications in chemistry. Nature Communications, 11(1): 1–9.
- Unke and Meuwly (2019) Unke, O. T.; and Meuwly, M. 2019. PhysNet: a neural network for predicting energies, forces, dipole moments, and partial charges. Journal of Chemical Theory and Computation, 15(6): 3678–3693.
- Velickovic et al. (2018) Velickovic, P.; Cucurull, G.; Casanova, A.; Romero, A.; Lio’, P.; and Bengio, Y. 2018. Graph Attention Networks. ArXiv, abs/1710.10903.
- Wang et al. (2020) Wang, R.; Zhong, Y.; Bi, L.; Yang, M.; and Xu, D. 2020. Accelerating Discovery of Metal–Organic Frameworks for Methane Adsorption with Hierarchical Screening and Deep Learning. ACS Applied Materials & Interfaces, 12(47): 52797–52807.
- Wilmer et al. (2012) Wilmer, C. E.; Leaf, M.; Lee, C. Y.; Farha, O. K.; Hauser, B. G.; Hupp, J. T.; and Snurr, R. Q. 2012. Large-scale screening of hypothetical metal–organic frameworks. Nature Chemistry, 4(2): 83–89.
- Xie and Grossman (2018) Xie, T.; and Grossman, J. C. 2018. Crystal graph convolutional neural networks for an accurate and interpretable prediction of material properties. Physical Review Letters, 120(14): 145301.
- Zhang et al. (2019) Zhang, X.; Cui, J.; Zhang, K.; Wu, J.; and Lee, Y. 2019. Machine learning prediction on properties of nanoporous materials utilizing pore geometry barcodes. Journal of Chemical Information and Modeling, 59(11): 4636–4644.