1]Kamioka Observatory, Institute for Cosmic Ray Research, University of Tokyo, Kamioka, Gifu 506-1205, Japan 2]Department of Theoretical Physics, University Autonoma Madrid, Madrid, 28049, Spain 3]Laboratorio Subterraneo de Canfranc, Canfranc Estacion, Huesca, 22880, Spain 4]High Energy Accelerator Research Organization (KEK), Tsukuba, Ibaraki 305-0801, Japan 5]Department of Physics, Okayama University, Okayama, Okayama 700-8530, Japan 6]Department of Physics and Astronomy, The University of Sheffield, Sheffield, S3 7RH, United Kingdom 7]Boulby Underground Laboratory, Saltburn-by-the-Sea, Redcar & Cleveland, TS13 4UZ, United Kingdom 8]Tohoku University Research Center for Neutrino Science, Sendai, Miyagi 980-8578, Japan 9]Department of Physics, University of Tokyo, Bunkyo, Tokyo 113-0033, Japan 10]Kavli Institute for the Physics and Mathematics of the Universe (WPI), The University of Tokyo Institutes for Advanced Study, University of Tokyo, Kashiwa, Chiba 277-8583, Japan 11]Department of Physics and Astronomy, University of California, Irvine, Irvine, CA 92697-4575, USA 12]Department of Physics, Faculty of Science and Technology, Tokyo University of Science, Noda, Chiba 278-8510, Japan 13]Faculty of Pure and Applied Science, University of Tsukuba, Tsukuba, Ibaraki 305-8577, Japan 14]Nippon Yttrium Co., Ltd., Omuta, Fukuoka 836-0003, Japan
Development of Ultra-pure Gadolinium Sulfate for the Super-Kamiokande Gadolinium Project
Abstract
This paper reports the development and detailed properties of about 13 tons of gadolinium sulfate octahydrate, , which has been dissolved into Super-Kamiokande (SK) in the summer of 2020. We evaluate the impact of radioactive impurities in on DSNB searches and solar neutrino observation and confirm the need to reduce radioactive and fluorescent impurities by about three orders of magnitude from commercially available high-purity . In order to produce ultra-high-purity , we have developed a method to remove impurities from gadolinium oxide, Gd2O3, consisting of acid dissolution, solvent extraction, and pH control processes, followed by a high-purity sulfation process. All of the produced ultra-high-purity is assayed by ICP-MS and HPGe detectors to evaluate its quality. Because of the long measurement time of HPGe detectors, we have employed several underground laboratories for making parallel measurements including LSC in Spain, Boulby in the UK, and Kamioka in Japan. In the first half of production, the measured batch purities were found to be consistent with the specifications. However, in the latter half, the contained one order of magnitude more 228Ra than the budgeted mean contamination. This was correlated with the corresponding characteristics of the raw material Gd2O3, in which an intrinsically large contamination was present. Based on their modest impact on SK physics, they were nevertheless introduced into the detector. To reduce 228Ra for the next stage of Gd loading to SK, a new process has been successfully established.
xxxx, xxx
1 Introduction
Super-Kamiokande (SK) Super-Kamiokande:2002weg is a 50-kton water Cherenkov detector located in Hida-city, Japan and has been operational since 1996. The experiment started with pure water as the detection medium and has made world-leading measurements of astrophysical, atmospheric and accelerator neutrinos, as well as searches for nucleon decays. To further enhance its physics capability, such as searching for the Diffuse Supernova Neutrino Background (DSNB), it was proposed to add gadolinium to the SK detector (SK-Gd) Beacom:2003nk . Gadolinium, in the form of , is expected to significantly enhance the neutron detection capability of SK thanks to its large thermal neutron capture cross section and subsequent 8 MeV gamma-ray emission.
While one of the primary physics goals of SK-Gd is to detect the DSNB signal via inverse-beta reactions (), measurements of conventional physics targets will continue with similar sensitivities as before. One challenge to overcome in the realization of the SK-Gd project is to mass-produce many tonnes of with impurities low enough so that, when dissolved into SK, backgrounds for the solar neutrino analysis at SK would not increase significantly and the detector performance would not be otherwise adversely affected. To achieve this, we developed a scalable purification method and conducted highly-sensitive radiopurity assays at multiple sites. These efforts were critical for the successful first Gadolinium loading to the SK detector in 2020 Super-Kamiokande:2021the .
In this paper, we first present and justify the requirements imposed on radioactive impurities in the in Section 2. Section 3 describes the level of typical impurities of commercially available , which motivated significant R&D of the purification methods described in Section 4. We describe the low-background, low-activity radioimpurity assay methods in Section 5 and their results in Section 6. Finally, we describe further improved purification methods, which will be employed for future Gadolinium loading in Section 7.
2 Requirements
While the addition of Gd to SK will allow more efficient neutron tagging, any impurities present in the raw would also be present in the detection medium. Radioactive impurities may contribute to the low energy backgrounds and affect the sensitivity of SK-Gd to the observation of the DSNB and solar neutrino measurements (4-20 MeV). To maintain these sensitivities, stringent requirements are set on the radioactive purity of the material to be introduced to SK.
In 2.1, we consider gamma emission accompanied by a neutron from radioactive contaminants; these neutrons are produced throughout the detector and their detection could mimic an antineutrino inverse beta decay signal.
Further, in 2.2 and 2.3, the relevant radioactive impurities to be controlled include those which emit gamma or beta radiation with sufficient energy to mimic signals from low energy, (MeV), neutrino interactions.
In this section, we study the radioactivity-induced backgrounds for SK-Gd and set the requirements on the impurities based on the physics analyses they impact. We also justify the limit imposed on the fluorescent cerium concentration to prevent a significant adverse change in detector performance.
For all these studies we assume 0.2% concentration of , or 0.1% concentration of Gd.
2.1 238U Spontaneous Fission
A small fraction of 238U decays are the result of spontaneous fission (SF), as are even smaller fractions of 235U and 232Th due to their lower masses. A neutron captured on Gd and the resulting gamma cascade following an SF event can be indistinguishable from an antineutrino inverse-beta decay (IBD) if only one gamma and one neutron are detected. Therefore, these decays represent an irreducible source of background for measuring low-energy antineutrinos from the DSNB, nuclear reactors, and the silicon-burning phase prior to a supernova burst.
The number of 238U decays which fake an antineutrino IBD is calculated using several factors. First, the likelihood of 238U to decay by SF is popeko80 . Second, the target concentration of in SK-Gd is 0.2%. And third, the number of high energy, , photons produced with energy in an SF decay, as derived from the emission spectrum measured in Sobel73 , is:
| (1) |
where the factors and are the normalization and slope of the exponential fit to the data in popeko80 of gamma emission rate from 238U SF as a function of the energy. One should also note that for the photons to be detected as electrons in SK, they must have 0.511 MeV additional energy to account for the electron mass.
For an SF decay to mimic an antineutrino IBD, one emitted neutron must be detected. Combining the neutron multiplicity probability popeko75 ; Ethvignot05 from 238U SF with the SK estimated neutron tagging efficiency of 80% (given the 0.2% concentration of ) along with calculations in FernandezMenendez:2017ccn , the irreducible background rate (events per second) for antineutrino IBD events from 238U SF is
| (2) |
where is the 238U SF rate per decay, is the mass of the SK fiducial volume (around kg depending on the physics analysis), is the specific activity of 238U in the in units of Bq/kg and 0.2% is the target concentration in SK-Gd. The factor is the fraction of 238U SF decays with a single reconstructed neutron. This accounts for the neutron multiplicity distribution measured in popeko75 and the above 80% neutron tagging efficiency, which depends on the target concentration.
For the SK DSNB analysis, events with reconstructed energy from MeV are considered. For reactor neutrinos, the photon energies relevant are from MeV, where the minimum energy is limited by the SK low energy threshold.
The irreducible backgrounds from 238U SF which mimic antineutrino IBD events impact the reactor antineutrino detection analysis, the DSNB measurement, and the detection of pre-supernova antineutrinos at SK. Among these analyses, the detection of the DSNB is most constrained by backgrounds from 238U SF FernandezMenendez:2017ccn .
Depending on the theoretical model for the DSNB, the expected signal rate at SK ranges from 0.6 to 5.3 events per year with antineutrino energy above 10 MeV PhysRevD.104.122002 . To maintain a favourable signal-to-background ratio, the concentration of 238U in dissolved is limited to less than 5 mBq/kg, which corresponds to about 0.8 events per year in the SK fiducial volume from Equation 2.
2.2 -rays from Radioactivity
Sources of radiation in SK primarily impact the solar neutrino analysis because those s mimic low-energy electron neutrino interactions. Additionally, a decay when coincident with a neutrino interaction may mimic an antineutrino IBD event. The most significant decay backgrounds are those that come from decays with a large branching fraction in the respective decay chain and a high -value: 208Tl ( MeV, 35.9% of 228Th decays), 212Bi ( MeV, 64.1% of 228Th decays) and 214Bi ( MeV, nearly 100% of 226Ra decays). These s may be reconstructed as the signal of low energy neutrinos for the lowest energy bins in the SK solar neutrino analysis. According to FernandezMenendez:2017ccn , the fraction of these decays which pass the SK solar neutrino cuts are 0.19% for 208Tl, 0.01% for 214Bi and % for 212Bi.
The expected solar neutrino candidate event rate in SK is around 200 per day with recoil electron kinetic energy between 3.5 MeV and 10 MeV PhysRevD.94.052010 . From the above estimates, 0.05 mBq/kg of 208Tl contamination will produce about 130 solar neutrino candidate background events per day. About 190 candidate background events is expected from the decay of 214Bi in the late part of the 238U chain (226Ra equilibrium) for a 0.5 mBq/kg contamination.
2.3 Radioactivity-Induced Neutron Production
238U SF is the main neutron producer in the SK fiducial volume. For these decays, 67% of the final states contain more than one neutron popeko75 , making these background events easily distinguishable from solar neutrino candidates considering the high neutron tagging efficiency in SK-Gd.
However, reactions on oxygen from all decays in all radioactive chains comprise another irreducible source of background for solar neutrino candidate events in SK as the emitted neutrons are captured by Gd, producing an 8 MeV cascade. In fact, 40% of neutron captures on Gd pass the SK solar neutrino cuts FernandezMenendez:2017ccn .
As 18O is naturally five times more abundant than 17O, these reactions occur mostly on 18O nuclei. In these reactions, neutrons are produced in pairs,
| (3) |
which together with the high neutron capture efficiency of Gd, helps reduce this source of background for solar neutrinos.
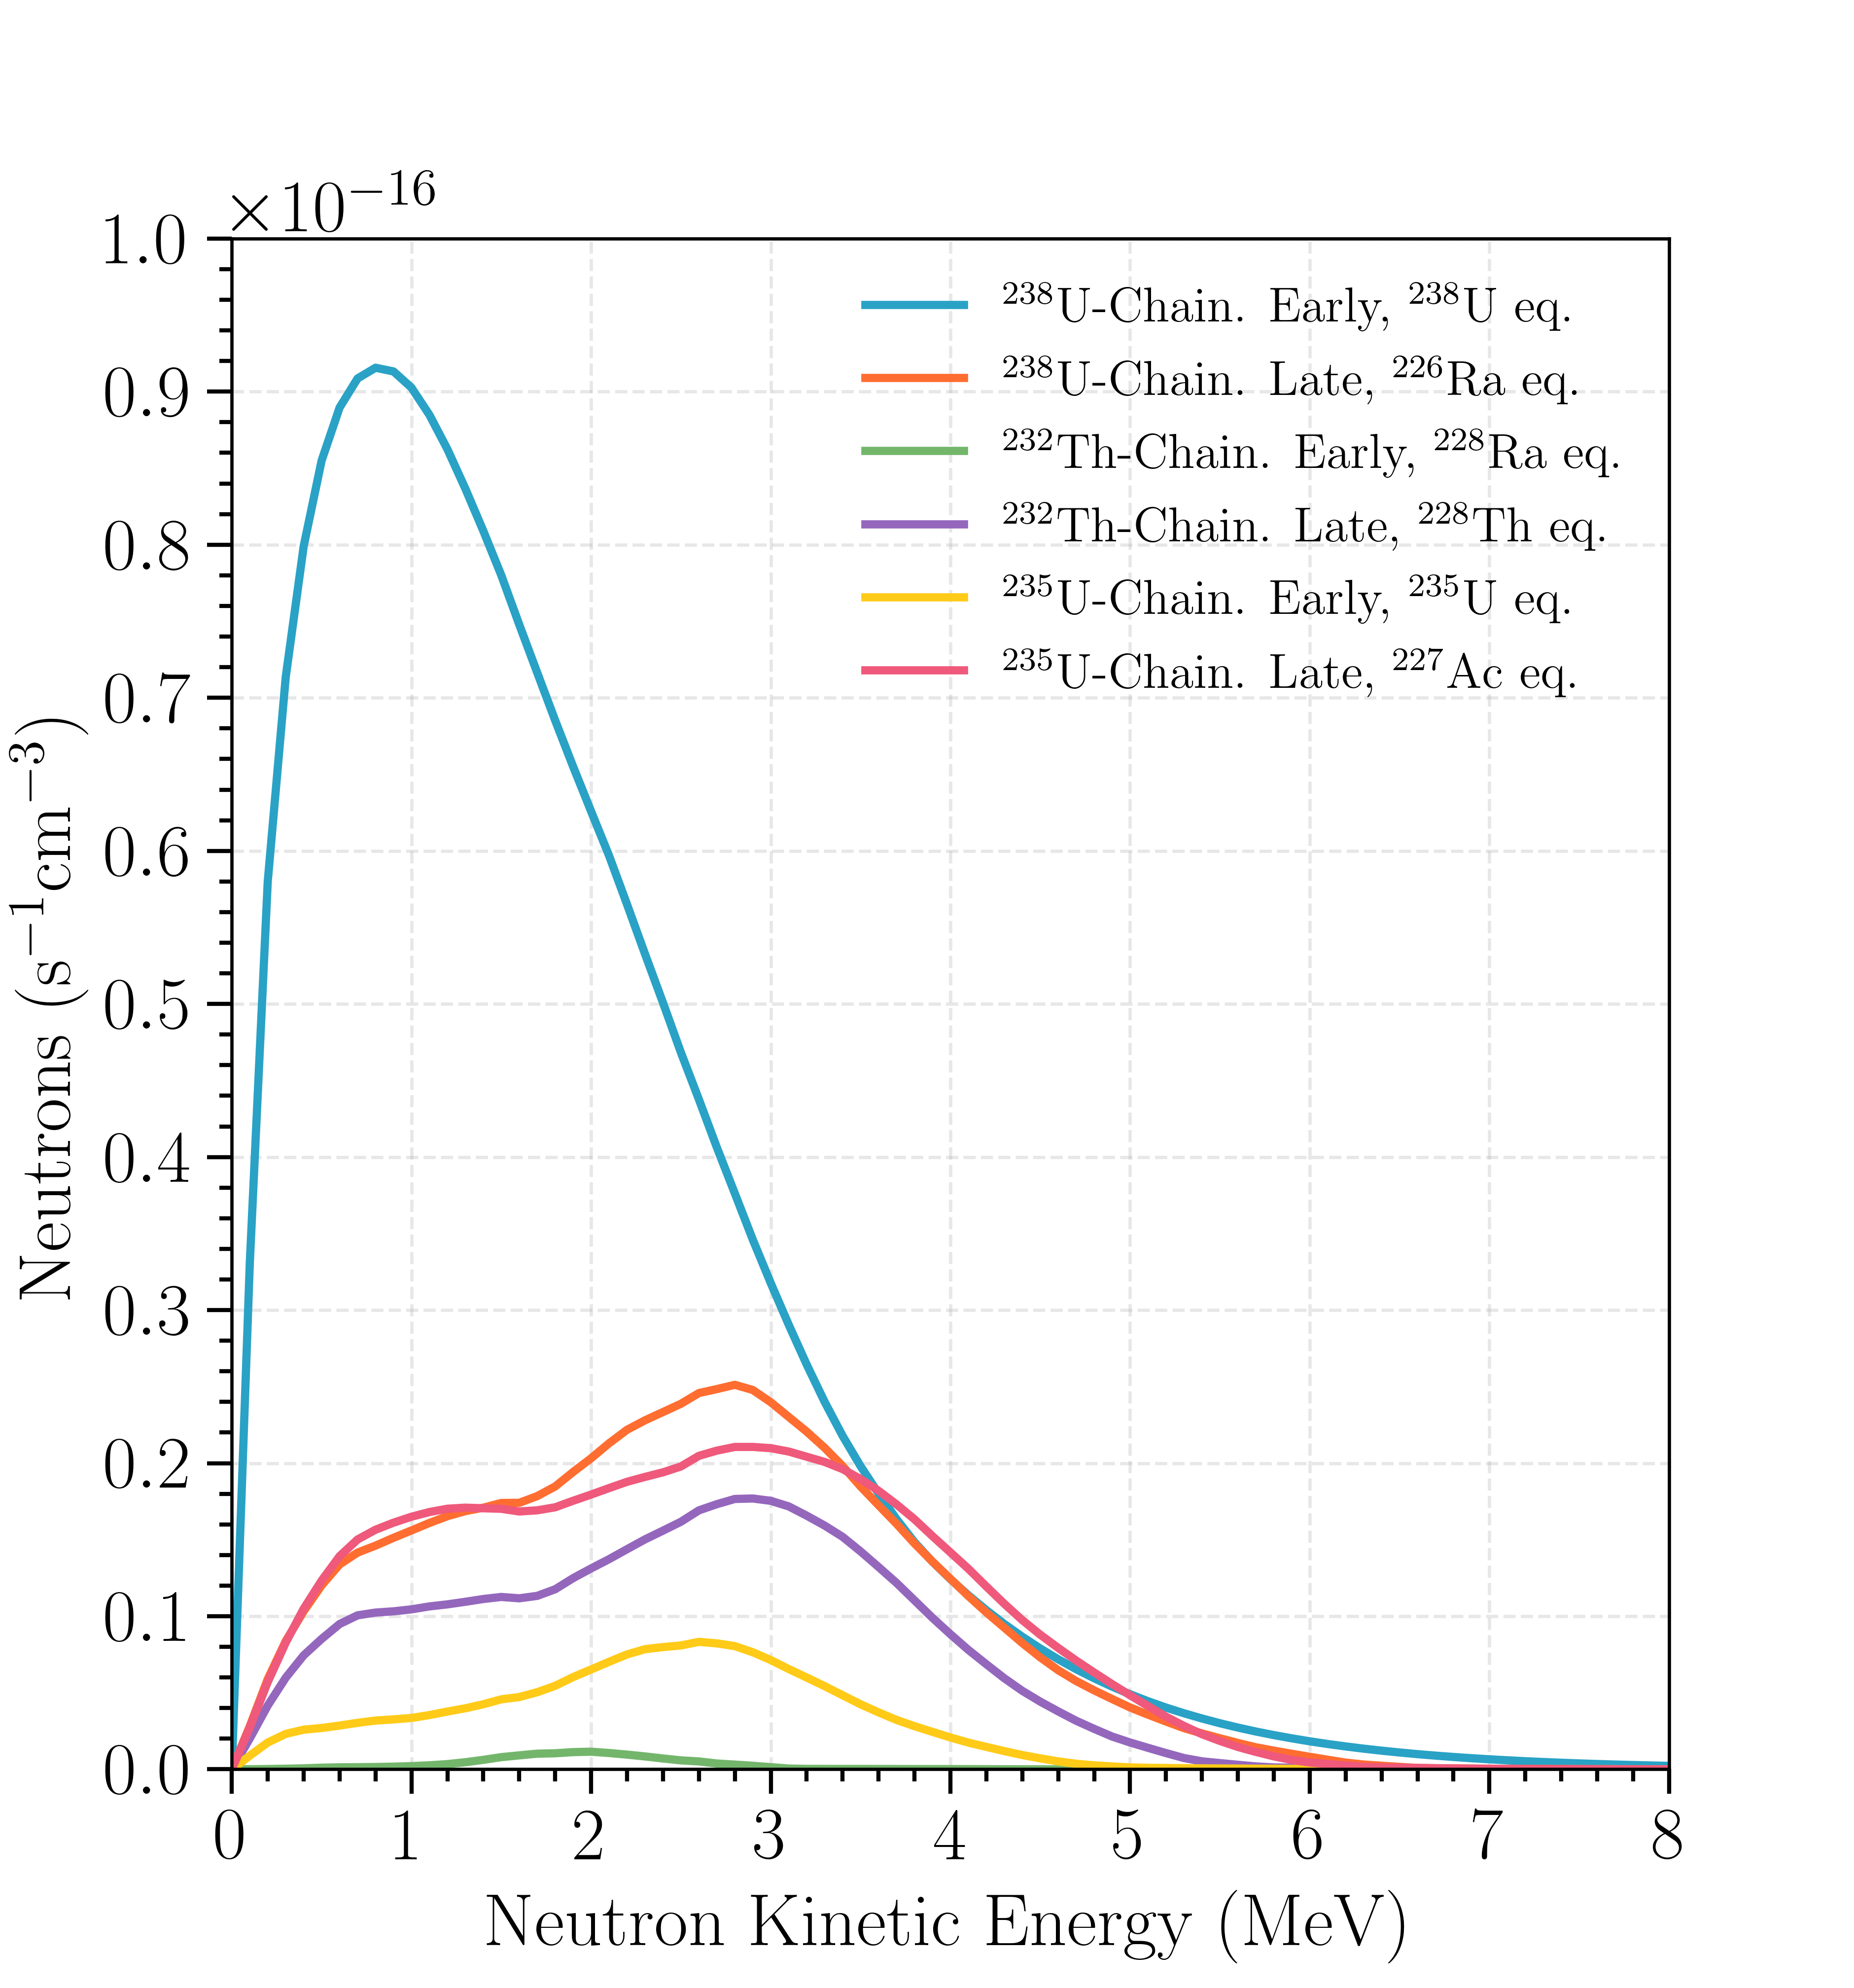
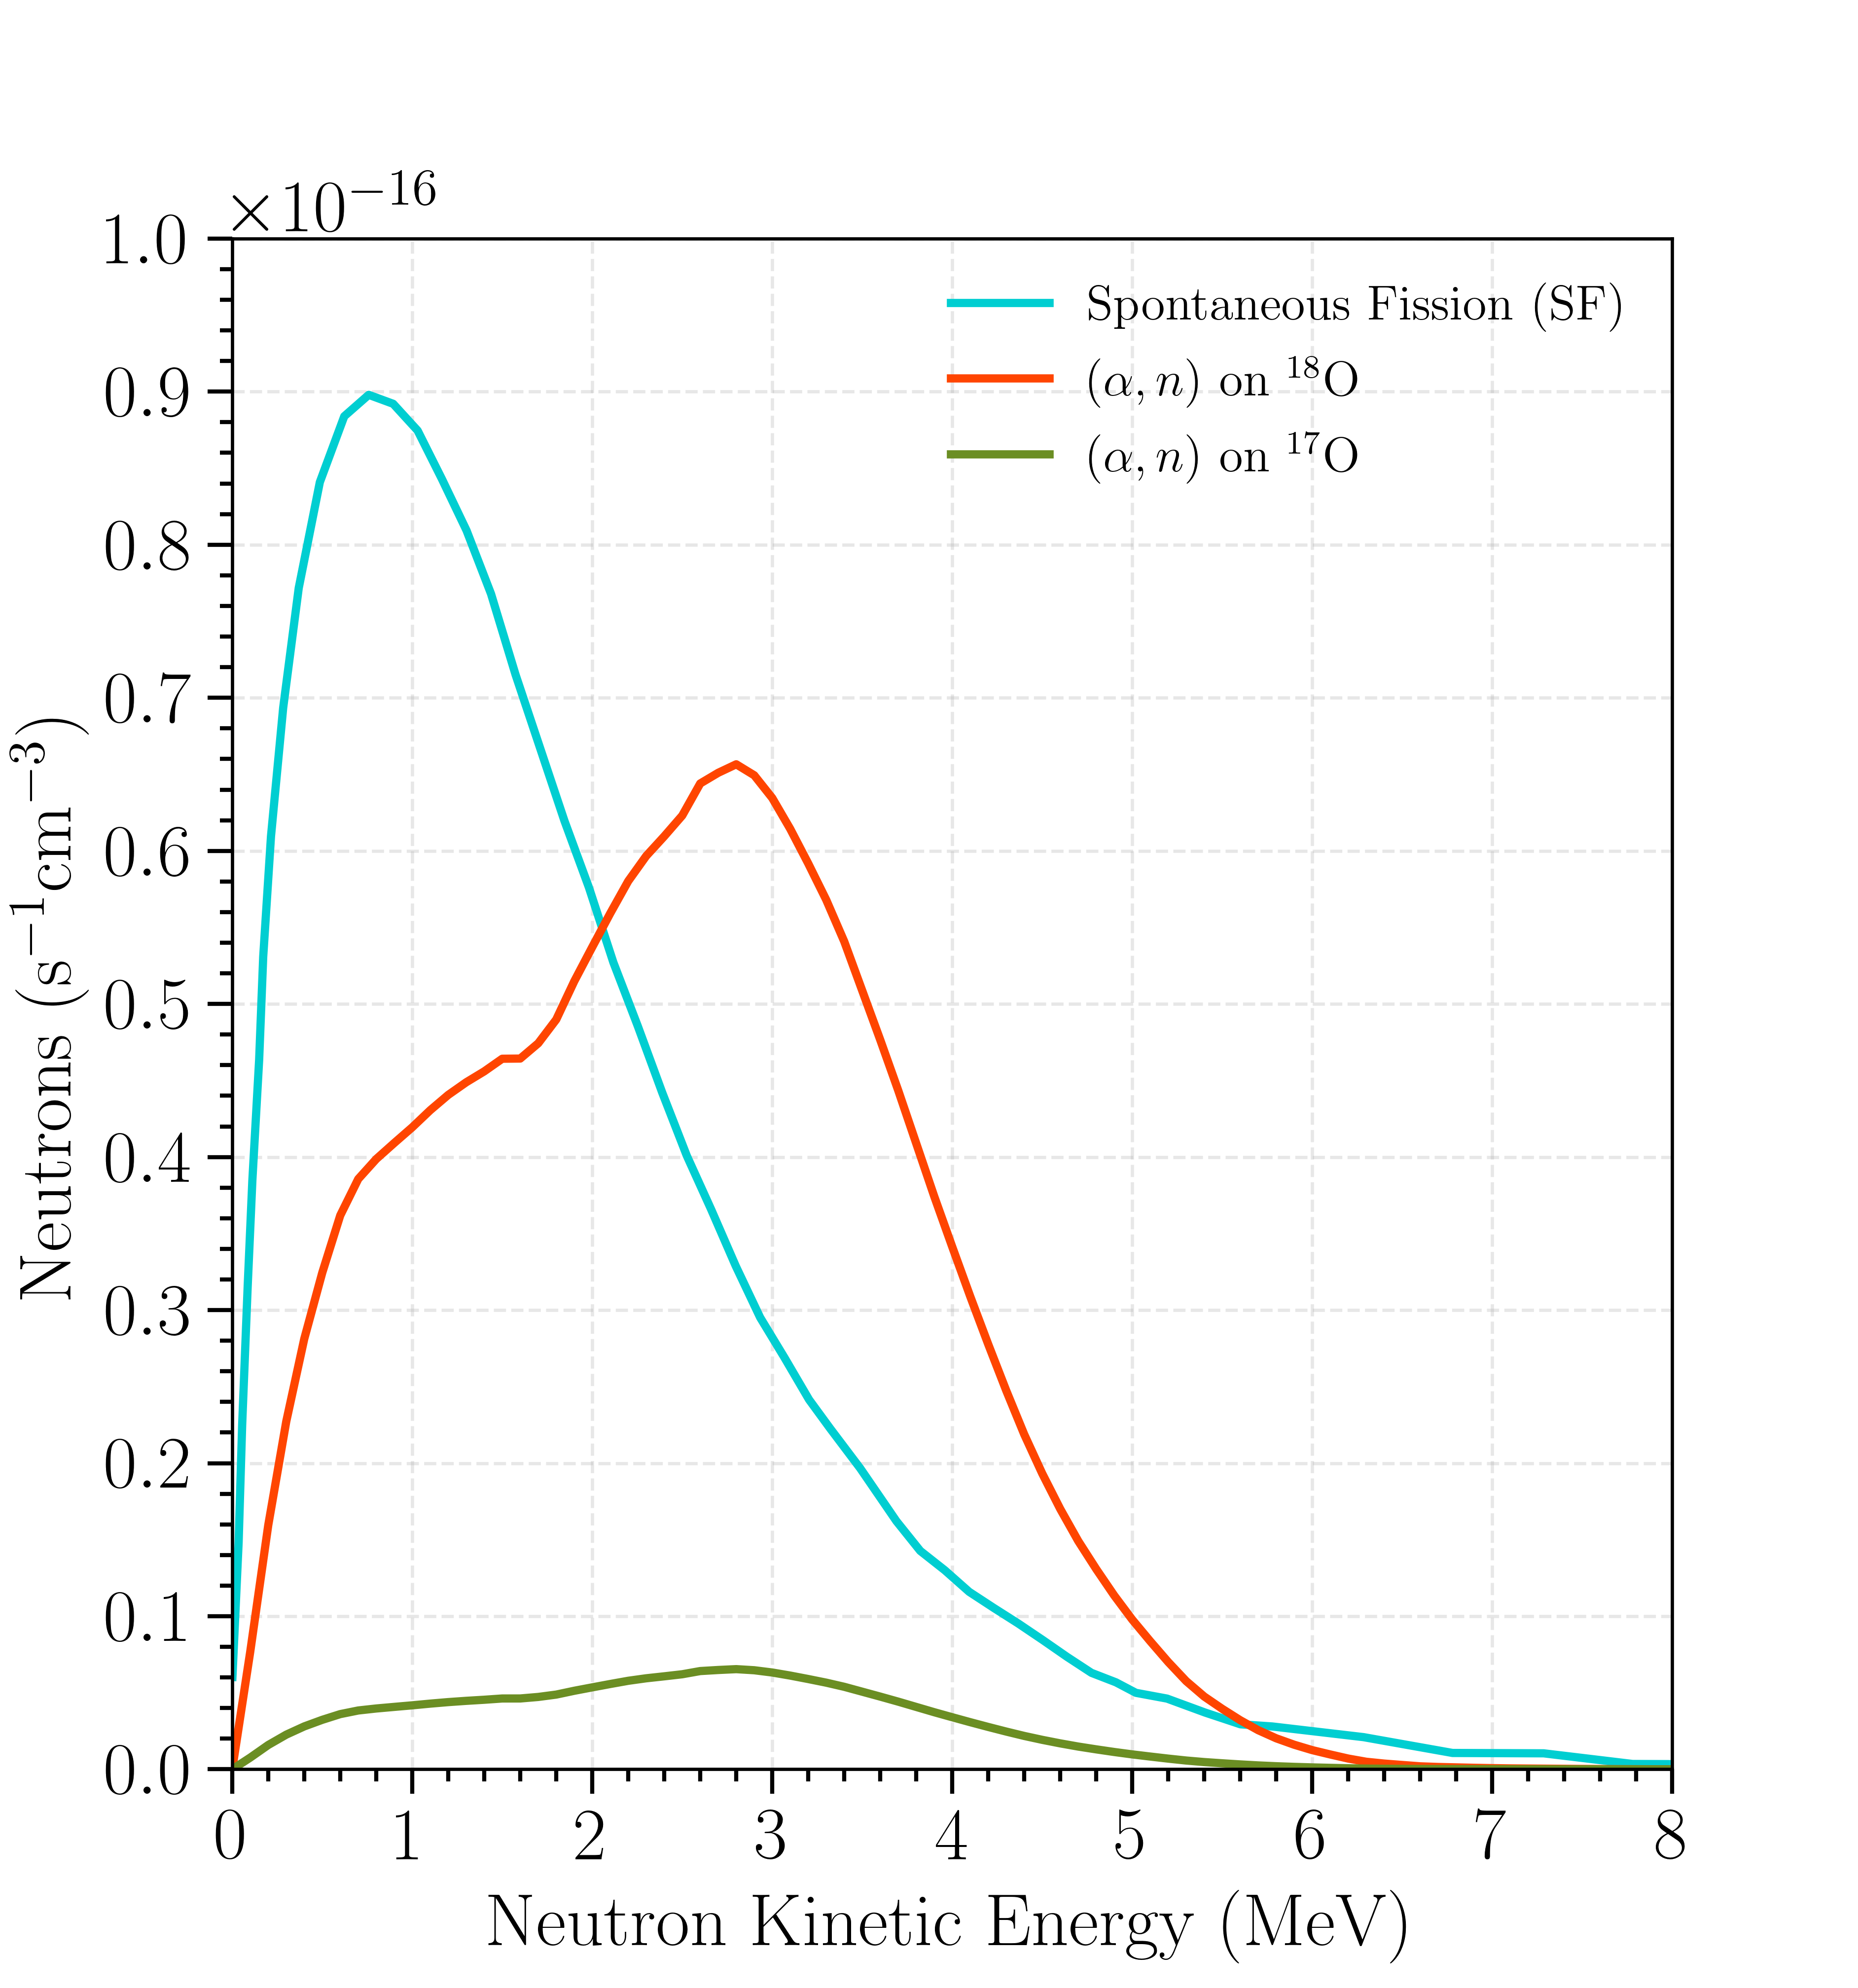
To quantify the production of neutrons from SF and reactions, we use the SOURCES-4C code wilson02 . The neutron production rates for an activity of 1 mBq/kg of each impurity decay chain and 0.2% concentration are shown in Figure 1 for each decay sub-chain and in Figure 2 for every relevant reaction. The total expected neutron production rate (events per second) from decays is then parameterized by:
| (4) |
where the prefactors on each term (in units of neutrons per second per kg of water per Bq/kg of contamination) represent the total neutron production rate for that sub-chain given the 0.2% concentration and integrated over the full neutron kinetic energy range. corresponds to the concentration of radioactive impurities for each part of each decay chain in units of Bq/kg and the factor is the fraction of reactions which result in at least one of the two emitted neutrons being captured on Gd (90% capture efficiency) but only one reconstructed as a solar neutrino candidate (40% chance to pass SK solar neutrino event cuts).
Background neutrons from reactions on 18O impact the solar neutrino analysis at SK. At the impurity concentration imposed on early-chain 238U by the DSNB analysis and on the 226Ra and 228Th chains by emission as backgrounds to the solar neutrino analysis, the radioactivity-induced neutrons from these chains do not impose any stricter requirements on the impurity concentrations.
For early-chain 232Th, neither SF nor reactions on 18O comprise a significant portion of background events on any physics analysis. However, because the half-lives of 228Ra and 228Th are on the same scale as the lifetime of the SK-Gd experiment, we impose the same requirement on the early part of the chain as imposed by emission on the late part of the chain, mBq/kg.
Similarly, 235U is not significantly limited by SF or emission. To derive a limit on 235U activity we consider that both emission and radioactivity-induced neutron production contribute to the solar neutrino background. Since the background candidate event rate from emission of 226Ra and 228Th are together greater than 300 events per day, we limit 235U to as low as reasonably possible. A limit of mBq/kg, which is easily achievable through purification, produces around 26 background candidate events per day. We adopt this as the impurity requirement for the entire 235U decay chain.
2.4 Fluorescence of Ce
The Cherenkov light wavelength shifting properties of cerium ions have a negative impact on the response of the SK detector. Cerium is typically found in at concentrations at the parts-per-million (ppm) level. The excitation maximum for cerium ions is 255 nm and the fluorescence emission maximum is around 350 nm with a time constant of around 100 ns shigematsu1971 . Cherenkov light is emitted in a continuous spectrum that is inversely proportional to the square of the wavelength, and the direction of the photons correlates with the direction of the incoming particles. However, when Cherenkov light near 255 nm, to which the SK photosensors are insensitive, is re-emitted and observed in a random direction with a time constant of 100 ns due to wavelength conversion of Ce, the pattern and time resolution of the longer wavelength Cherenkov light degrades. Therefore, it is necessary to reduce the cerium concentration in SK-Gd as much as possible.
It was found that the commercially available used in our R&D with the EGADS detector Marti:2019dof contained about 50 ppm Ce. The observed time distribution of Cherenkov light was distorted significantly by the light emission by Ce. It has been confirmed by EGADS that the hit timing disruption of Ce is not observed when the Ce concentration of is reduced by three orders of magnitude from the nominal value. Therefore, the requirement of Ce content in for SK-Gd was set to 50 parts-per-billion (ppb).
Although Gd and Ce are easily separated to the ppm level in the process of refining rare earths, a special treatment is added for a further reduction of Ce to the ppb level or below, which will be explained in Section 4.3.
2.5 Summary of Requirements
SK-Gd aims to measure low energy neutrinos from the Sun and antineutrinos from the DSNB, nuclear reactors, and the silicon-burning stage prior to a supernova burst. Among them, the solar neutrino and DSNB antineutrino measurements set the strongest requirements on the purity of the .
The detection of the DSNB is most strongly limited by 238U SF mimicking an antineutrino IBD signal. Thus, the concentration limit imposed on the early part of the 238U decay chain in is mBq/kg.
Because the ranges of the lowest-energy detectable solar neutrinos and the highest-energy rays overlap, the detection of solar neutrinos drives the allowable concentration of the 232Th chain, mBq/kg, and the late part of the 238U chain, mBq/kg. For 235U, the detection of solar neutrinos is most strongly limited by radioactivity-induced neutron production, thereby limiting this nuclide to mBq/kg.
The radioactivity contamination requirements for are summarized in Table 2.5.
| Chain | Part of chain | Requirement (mBq/kg) | Requirement (ppb) 111ppb values are in units of kg/kg and corrected assuming each isotope’s natural abundance. | ||
| 238U | 238U | ||||
| 226Ra | |||||
| 232Th | 232Th | ||||
| 228Th | |||||
| 235U | 235U | ||||
| 227Ac / 227Th | |||||
| \hdashline Ce | – | ||||
Additionally, once the is dissolved into the water, the uranium concentration is expected to be reduced by approximately two orders of magnitude using the resin-based filtration within the water purification system Marti:2019dof ; ABE2022166248 . This has a further positive impact on the measurements affected by uranium contamination.
3 Market production
The world market was searched for suppliers of high purity . Several samples were purchased from different companies to measure and compare their radioactive contaminants. These measurements were performed at Canfranc Underground Laboratory (LSC) in Spain (see Section 5.1.2), and the results summarized in Table 2.
| 238U Chain | 232Th Chain | 235U Chain | Others | |||||||
|---|---|---|---|---|---|---|---|---|---|---|
| Company | Date | E, 238U eq. | L, 226Ra eq. | E, 228Ra eq. | L, 228Th eq. | E, 235U eq. | L, 227Ac eq. | 40K | 138La | 176Lu |
| A (USA) | 2009/04 | 5121 | 81 | 112 | 283 | 32 | 21410 | 295 | 81 | 808 |
| A (USA) | 2010/08 | 33 | 2.80.6 | 27016 | 865 | 32 | 170020 | 123 | - | 212 |
| B (China) | 2012/08 | 2926 | 742 | 109912 | 5046 | 112 | 295630 | 10110 | 68315 | 5666 |
| C (China) | 2013/02 | 7428 | 131 | 2056 | 1273 | 25 | 142321 | 607 | 31 | 121 |
| B (China) | 2013/03 | 2426 | 132 | 213 | 3746 | 25 | 17542 | 188 | 423 | 82 |
| A (USA) | 2013/08 | 7120 | 81 | 61 | 1593 | 32 | 29510 | 32 | 51 | 301 |
| D (China) | 2013/07 | 4726 | 51 | 142 | 131 | 12 | 6 | 32 | 1 | 1.60.3 |
| D (China) | 2013/07 | 7327 | 61 | 31 | 4115 | 30 | 18 | 84 | 1 | 2 |
| A (USA) | 2014/02 | 76 | 1.4 | 21 | 292 | 1.8 | 1906 | 5 | 231 | 2.50.6 |
These measurements indicate the presence of non-negligible naturally-occurring radioactive contamination in the material, much higher than the requirements discussed in the previous section. It is worth noting that the early and late parts of the radioactive decay chains do not appear to be in secular equilibrium. Table 2 clearly shows that a dedicated R&D program must be carried out to purify the available powder to levels which satisfy the requirements in Table 2.5.
The commercially available used in our R&D with the EGADS detector Marti:2019dof contained about 50 ppm Ce, which is near the natural abundance of cerium in the Earth’s crust.
4 Purification method
4.1 Gd-Oxide and its solution by acid
Gadolinium oxide, , is used as a raw material for production. The purity of is better than 99.99% by mass as / TREO (gadolinium oxide amount in total rare earth oxide amount). The concentration of trace uranium and thorium contained in with this purity is typically about 500-1000 ppb, but we carefully selected raw material with a low thorium concentration ( ppb) for this development.
To dissolve , hydrochloric acid is used. This is because gadolinium chloride, GdCl3, has a high solubility, and wastewater treatment is relatively easy since it does not contain nitrogen. This gadolinium acidic aqueous solution becomes a raw material for the subsequent production process after the insoluble matter is filtered off. The acid concentration is set to 30-40% by weight, resulting in high reactivity and low volatility. From the viewpoint of the removal efficiency of radioactive impurities and the yield in the subsequent processes, the target gadolinium concentration in this solution is then 305 g/L (Gd2O3: 350g/L).
4.2 Solvent extraction
The solution obtained above is then processed with the solvent extraction to increase the purity. While maintaining Gd in the aqueous phase, radioactive impurities such as Th and U can be extracted into the organic solvent phase using extractant 2-ethylhexyl 2-ethylhexylphosphonate (PC-88A manufactured by DAIHACHI Chemical Industry Co., Ltd.). It is known that rare earth elements are extracted and separated in an organic solvent containing 2-ethylhexylphosphonate KUMARI20181029 . The extraction solvent is diluted with an isoparaffin (IP3835 manufactured by Idemitsu Kosan Co., Ltd.) which reduces the viscosity and specific gravity of the organic solvent phase. Reducing the viscosity improves contact between the aqueous phase and the organic solvent phase to improve the efficiency of solvent extraction. Reducing the specific gravity accelerates the separation between the organic solvent phase and the aqueous phase after mixing. The extraction solvent and the isoparaffin solvent are mixed at a ratio of 20:80.
Between a pH of 1.0 and 1.3, Gd is not extracted into the organic solvent phase, but Th and U are. During this process, the pH is controlled at 1.0 by using an ammonia solution to prevent metal contamination and enhance separation efficiency. After mixing the isoparaffin with the aqueous solution, the aqueous phase is separated as a purified Gd solution by allowing the mixed solution to separate. This solvent extraction step is performed twice for this production.
4.3 Neutralization and sulfation
After solvent extractions, two neutralization processes are performed to reduce Th and Ce. Because the precipitation pH of thorium hydroxide is lower than the precipitation pH of gadolinium hydroxide, thorium hydroxide can be removed by coprecipitating with a small amount of gadolinium hydroxide by adjusting pH. The pH is adjusted to 4.8 by adding ammonia water to the Gd solution after the solvent extraction. In an acidic solution, Ce is trivalent and stable but it was precipitated as cerium oxide by adding hydrogen peroxide solution and raising the electric potential in the solution to oxidize it. By performing this treatment together with the precipitation of thorium hydroxide described above, cerium oxide is coprecipitated together with thorium hydroxide. Hydrogen peroxide is added so that it is 0.3% in the aqueous solution.
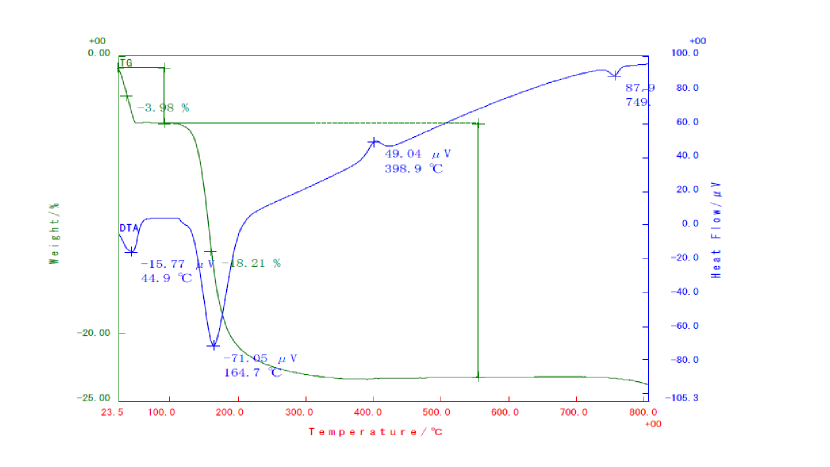
Finally, 98% purity sulfuric acid is added to the obtained Gd solution to precipitate Gd sulfate. Gd sulfate is filtered to remove the filtrate, and washed with pure water until the pH reaches 4. The produced gadolinium sulfate is octahydrate. This can be confirmed by X-ray diffraction (Appendix A) or thermogravimetric analysis (Appendix B).
Each batch of the production is about 500 kg. The is in a powder form but contains an average of 2.5% additional water left over from processing. So the 13.2 tons of powder dissolved into SK corresponds to 12.9 tons of .
5 Material Assay
Samples from each 500 kg batch of are assayed to evaluate whether the requirements set out in Section 2 for radioactive and fluorescent impurities are met. Since the nuclides which contaminate are not necessarily in secular equilibrium with their long-lived parents and daughters, high purity Germanium (HPGe) gamma spectrometry is used to investigate the activity of the early and late parts of all decay chains which could affect SK-Gd physics sensitivities. Also, inductively-coupled plasma mass spectrometry (ICP-MS) is used to measure the concentration of U, Th, and Ce to very low levels.
ICP-MS is sensitive to the most abundant, long-lived members of the early parts of the U and Th decay chains to the level required by SK-Gd: 238U to mBq/kg and 232Th to mBq/kg. HPGe gamma spectrometry infers the activity of long-lived parent nuclides based on the gamma emission of the parent or its daughters. For late-chain 238U (226Ra equilibrium) and all parts of the 235U chain, only HPGe gamma spectrometry is sensitive to the level specified by the SK-Gd requirements: mBq/kg and mBq/kg, respectively. Neither method of assay used here is sensitive to late-chain 232Th (228Th equilibrium) concentration to mBq/kg.
5.1 HPGe Laboratories
5.1.1 Boulby
The Boulby UnderGround Screening (BUGS) Facility scovell2018 (Fig. 3(a)) is located 1.1 km underground (2840 m water equivalent) at the Boulby Underground Laboratory in the north of England. Gamma spectrometry of 13 samples of was performed using two HPGe detectors at BUGS. Produced by Mirion, the two p-type detectors called Belmont and Merrybent have relative efficiencies of 160% and 100%, respectively. The “specialty ultra-low background” detectors are housed in similar low-background lead and inner copper-lined shields and are purged with generated gas. Additional details of these detectors and their general performance around the same time as this assay program is reported in akerib2020lux .
Samples of 5 kg of were packed in Marinelli beakers of type 448G-E from Ga-Ma and Associates, Inc. in a clean environment, then transported into the BUGS class 1000 clean room using standard triple-bagged procedures. Figure 3(b) shows a sample placed on the Merrybent detector. Samples are measured for several weeks to reach a minimum detectable activity (MDA) of mBq/kg of 226Ra-equivalent activity at the 95% confidence level.
To achieve the best possible results, several known systematic errors are accounted for in the spectrum analysis using a Geant4-based AGOSTINELLI2003250 detector simulation developed in-house. Apart from estimating the gamma detection efficiency for an arbitrary sample geometry, corrections for true coincidence summing scovell2018 and background shielding by the sample material thiesse2022 are implemented to improve the accuracy of results.
Since this assay program has been completed, several improvements have been made at BUGS to reduce the radon concentration of the nitrogen purge line, greatly improving the sensitivity of Merrybent and Belmont to 226Ra and its daughters.
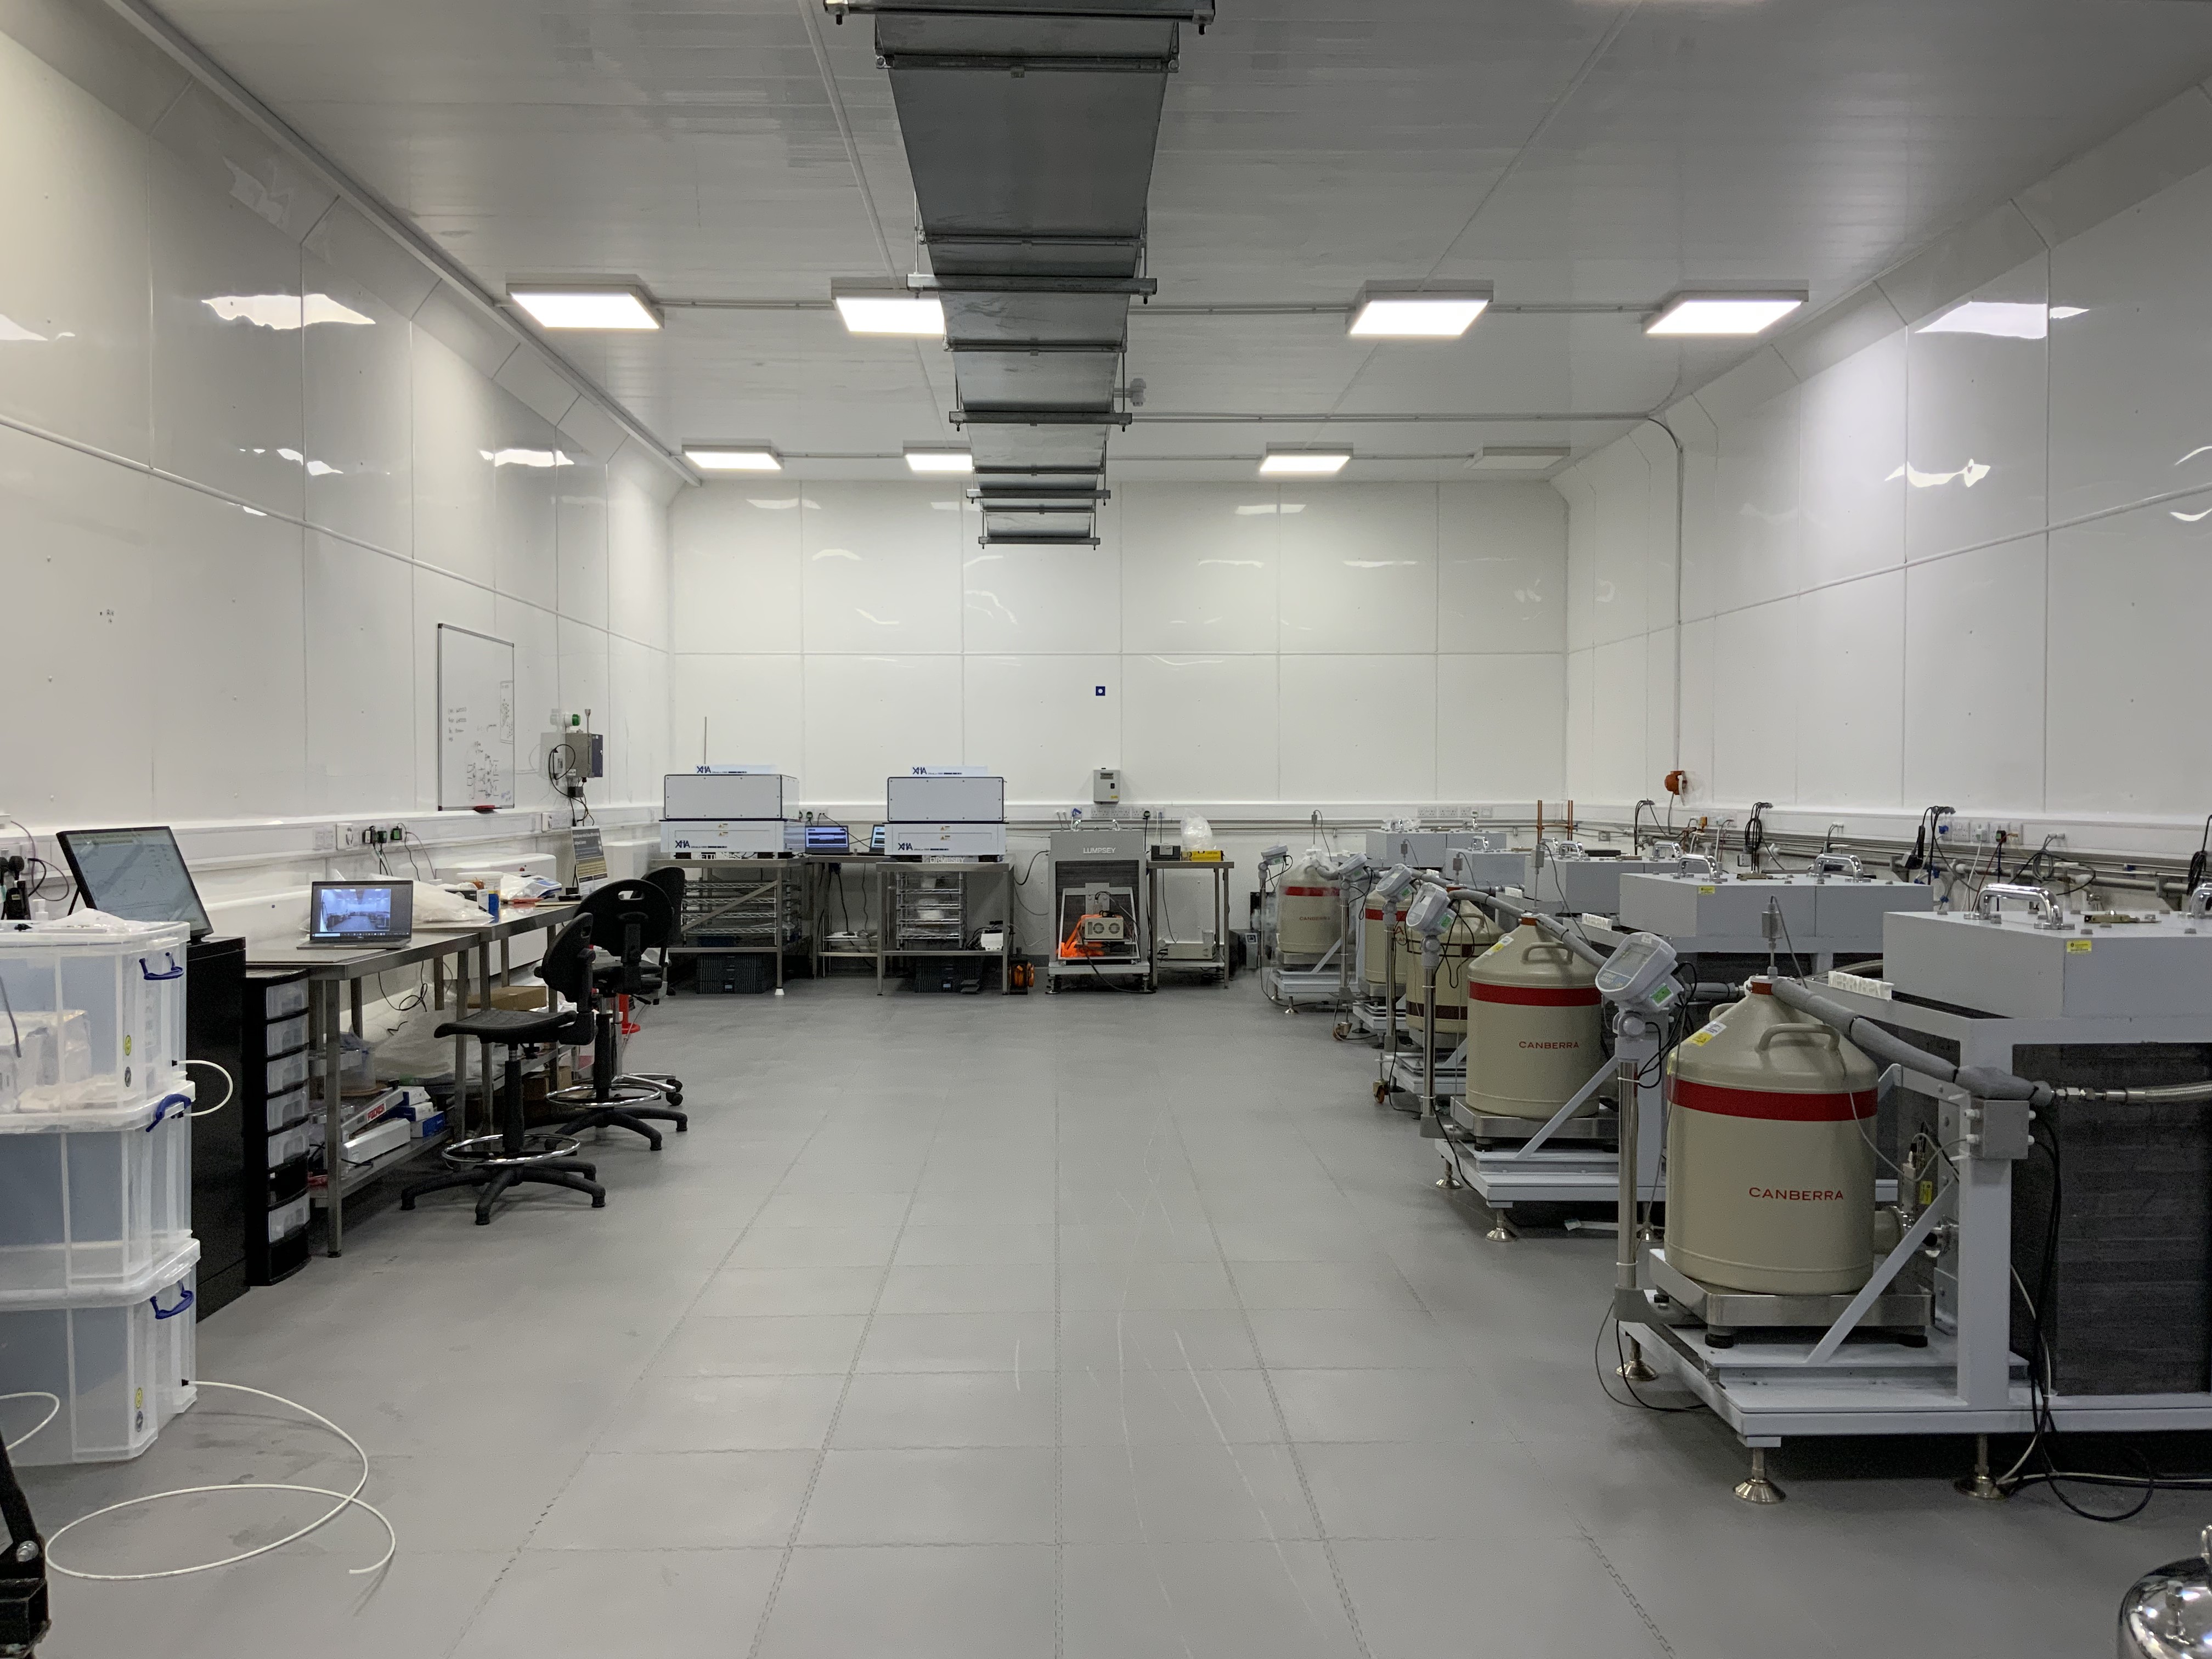
5.1.2 Canfranc
The Laboratorio Subterráneo de Canfranc (LSC) is located on the Spanish side of the Pyrenees Mountains, under the Tobazo peak. The laboratory has a rock shielding of 800 water equivalent), that suppresses the cosmic muon flux by almost 5 orders of magnitude.
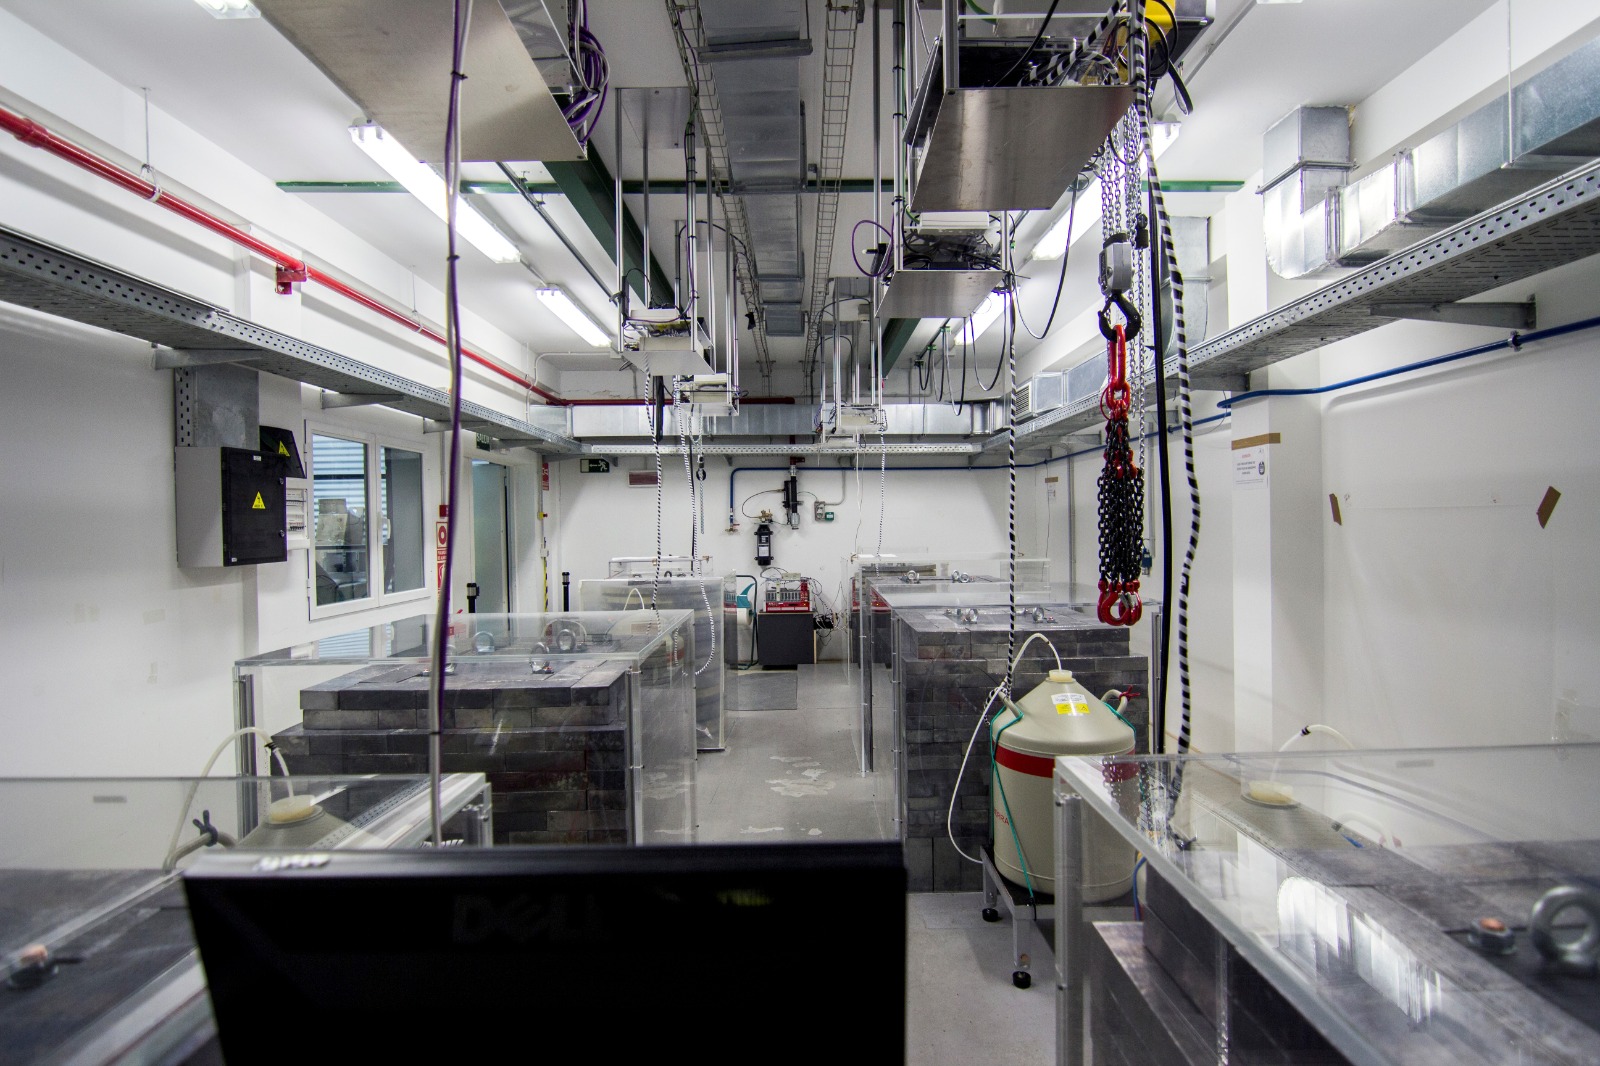
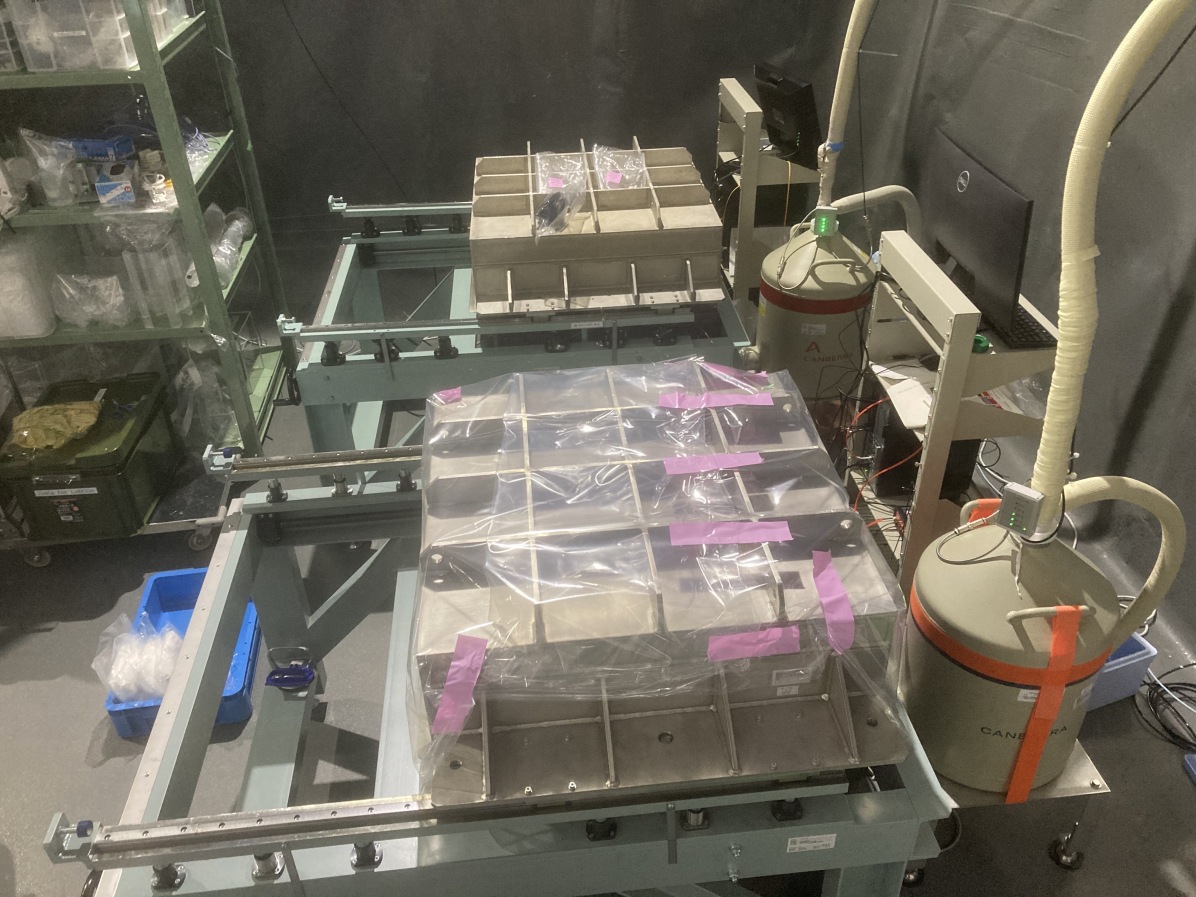
The Ultra-Low Background Service (ULBS), working since 2010 in Hall C of LSC (Figure 4(a)), offers a high-quality material assay facility to experiments. At present, it is equipped with six 2 kg p-type coaxial HPGe detectors with relative efficiency and two SAGe-Well High-Purity detectors, shielded with 20 cm of lead with a low contamination in 210Pb. An internal 10 cm layer of OFHC copper completes the shielding. For SK-Gd, two p-type detectors were mainly used: GeOroel and Asterix (see Table 3).
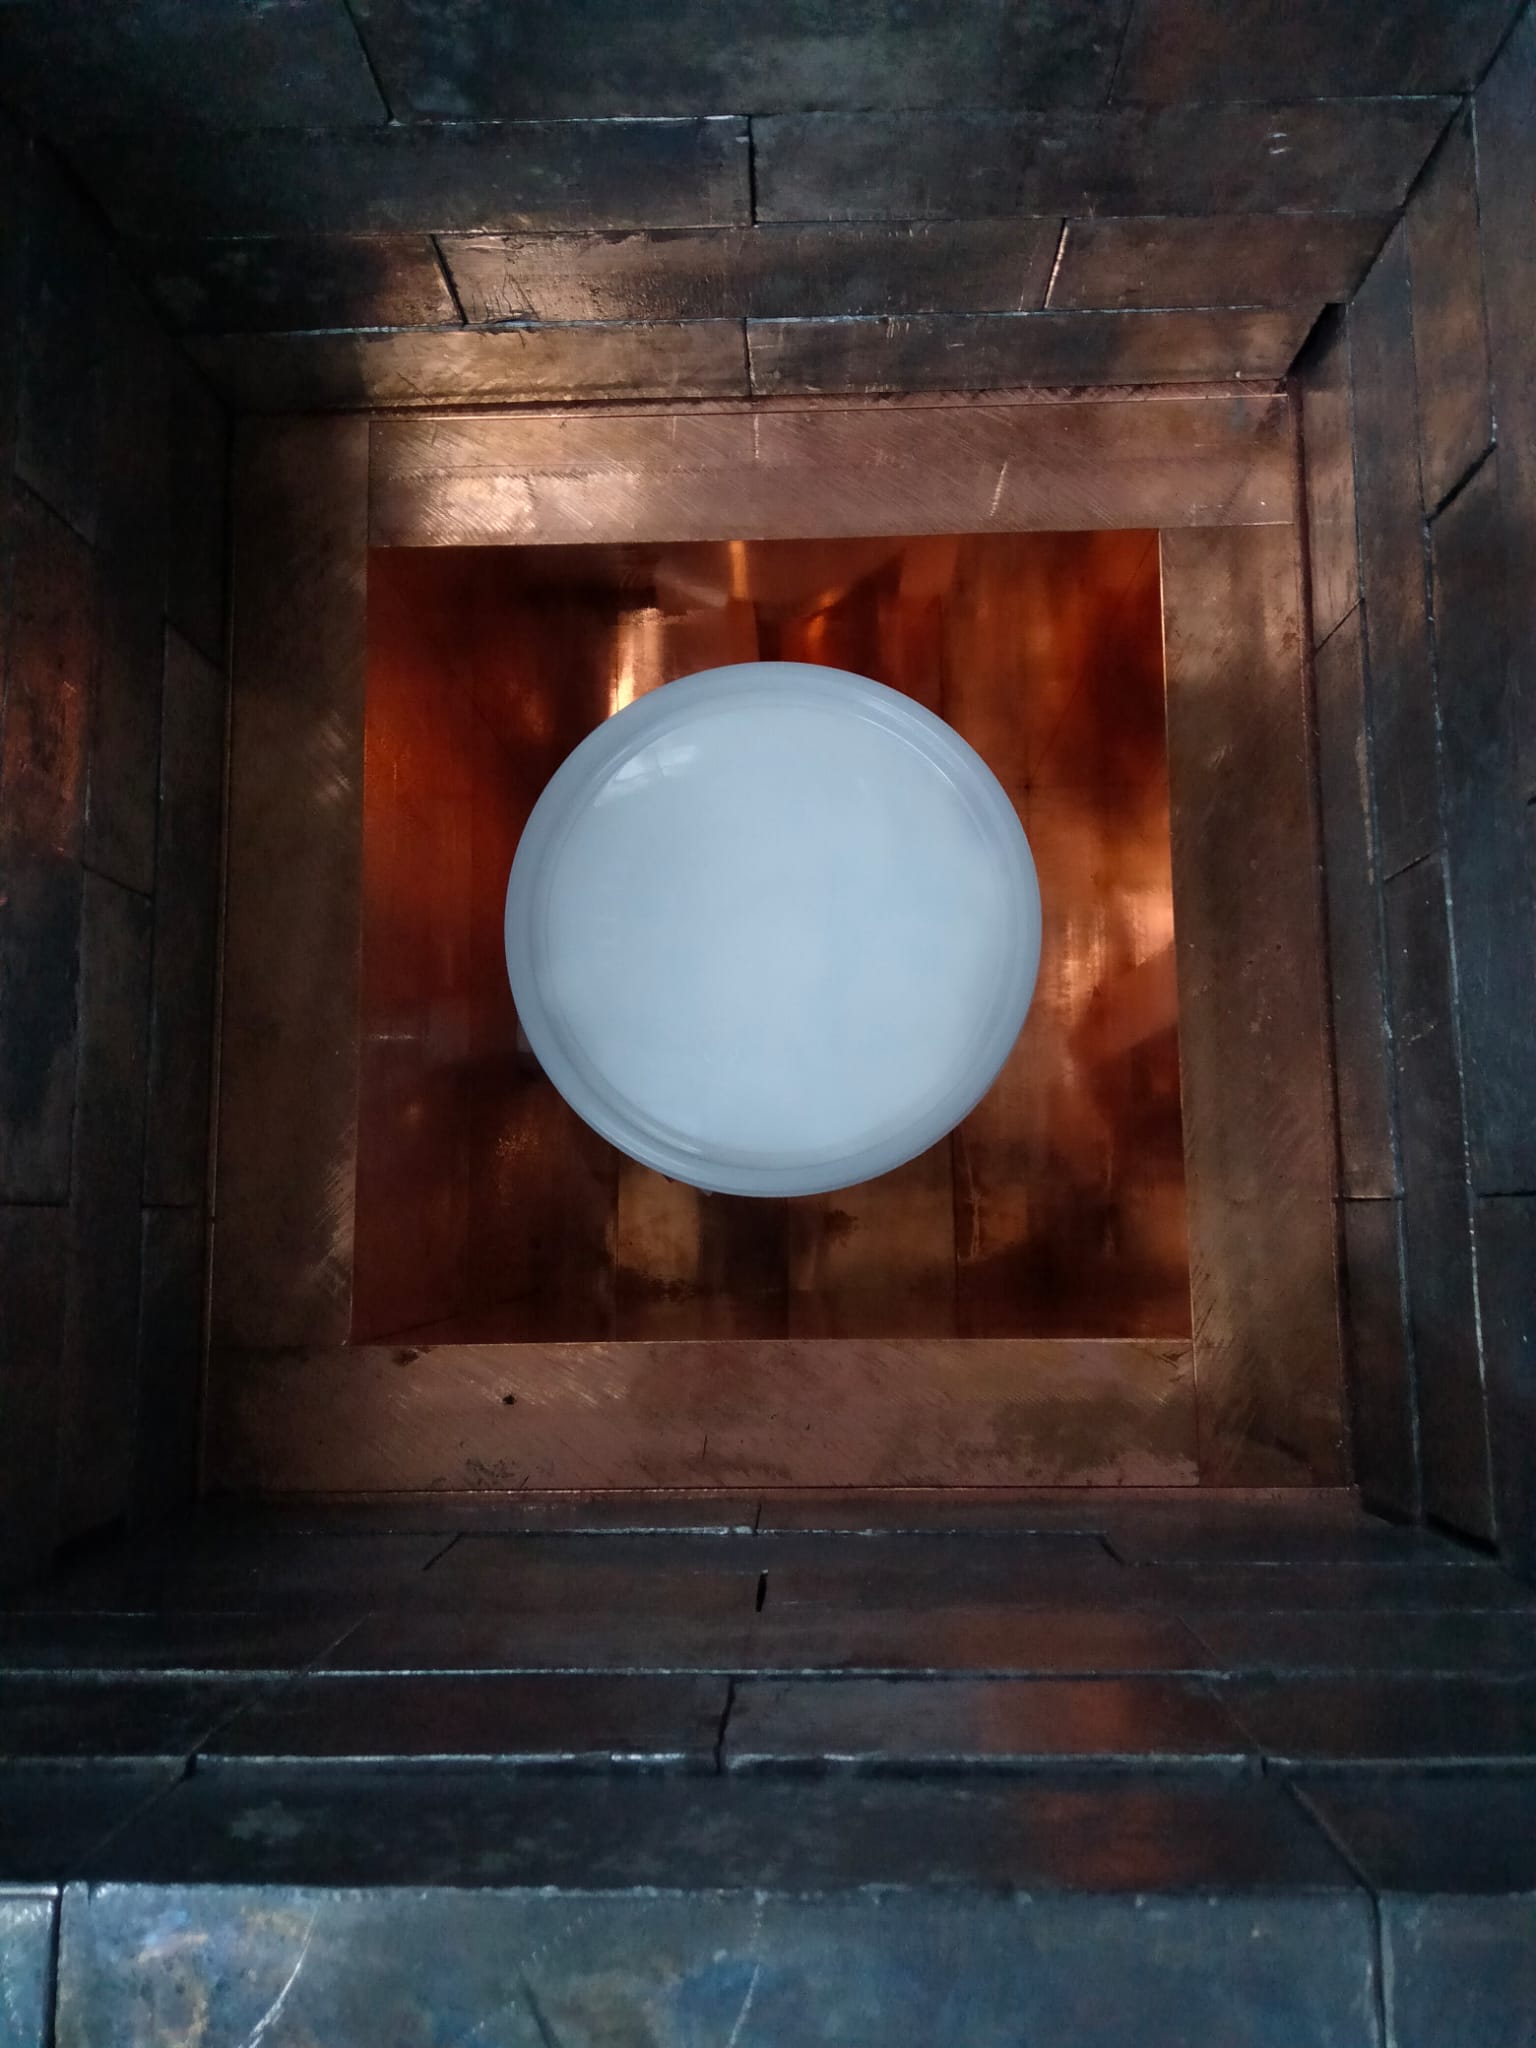
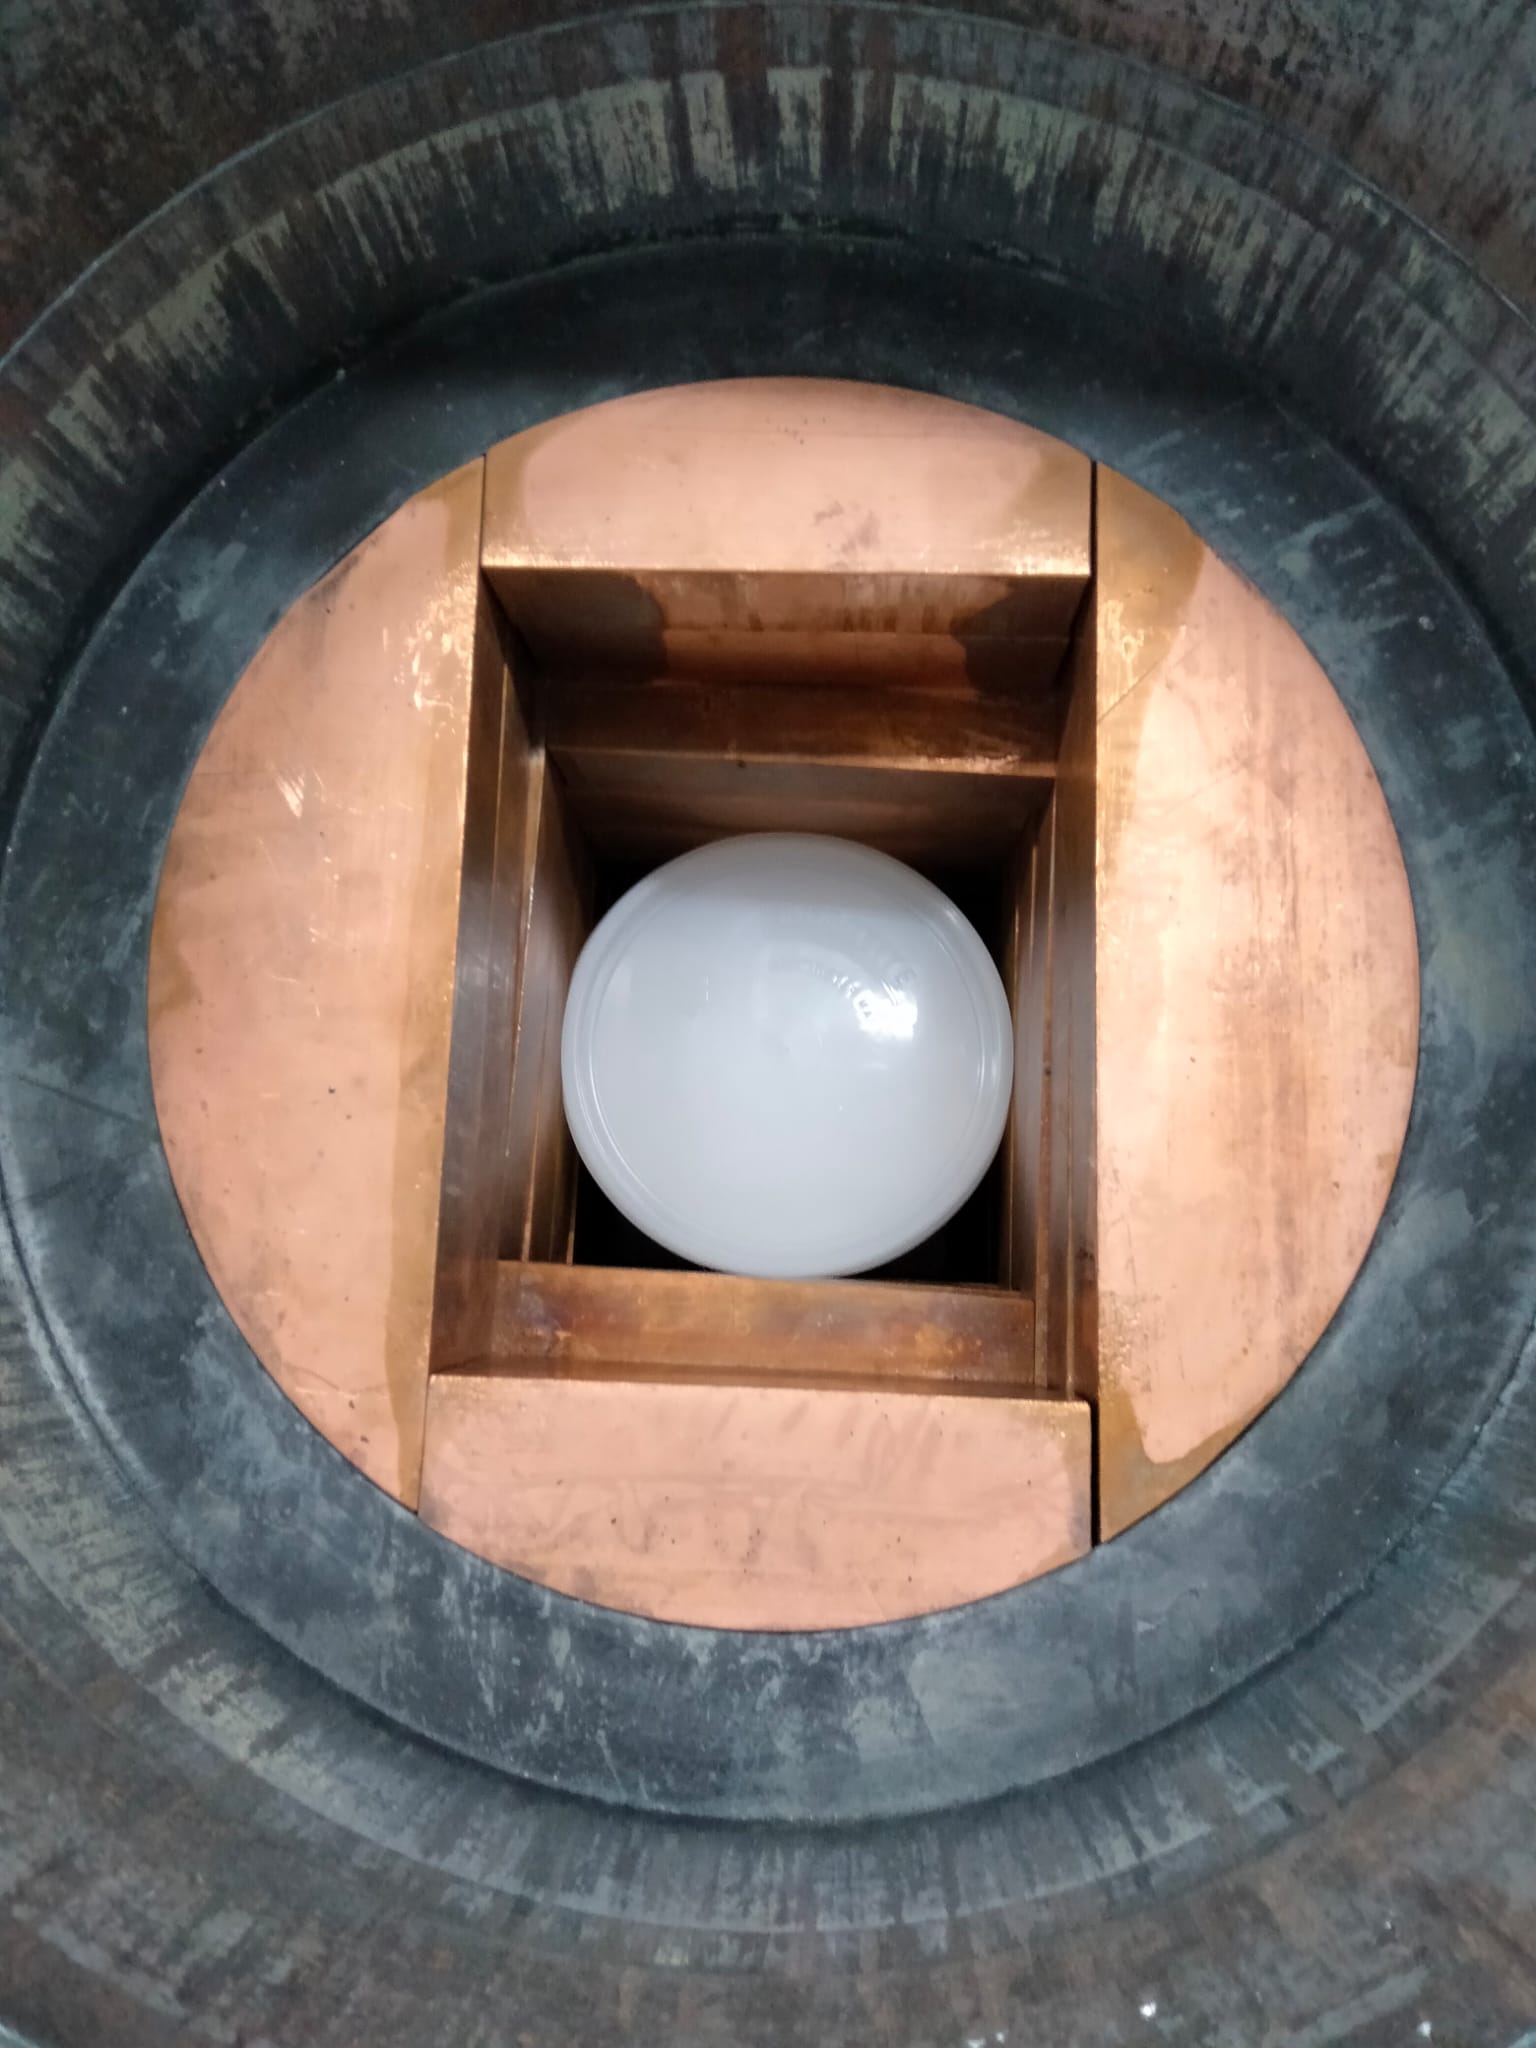
Samples of 4 kg were packed in Marinelli beakers (Ga-Ma and Associates, Inc. model 445N-E). Measurements of around 30 days are necessary to reach mBq/kg sensitivity, with the condition that the radon contained in the air inside the HPGe detector shielding has decayed. To achieve this, each detector has an extra layer of shielding made of methacrylate which surrounds the lead shielding. To impede the exterior air (and the Rn) to enter inside the shielding, a slight over-pressure is created inside the copper shielding. The Cu shield inner volume available for sample measurement is L (see Figures 4(b) and 4(c)). This volume is flushed with L/h of a mixture of nitrogen and Rn-free air, which corresponds to about six full volume changes per hour.
5.1.3 Kamioka
Kamioka Observatory is located 2700 m water equivalent underground. In addition to housing the SK-Gd detector, several HPGe detectors are operated to support the many scientific goals of the laboratory. For the current assay program, the ultra-low background HPGe detector located in Lab-C, manufactured by Mirion Technologies France CANBERRAFrance , was used. Details of the shield geometry and detector performance can be found in Abe_2020 .
Samples of are prepared in two ways. First, a molecular recognition resin embedded in the ”Empore Radium Rad Disk” 10.1093/ptep/pty096 ; 10.1093/ptep/ptaa105 was used to adsorb radium from the and increase its concentration. Since the size of the disk is small (47 mm diameter, 0.5 m thickness), it could be laid directly onto the end cap of the HPGe detector to measure the concentrated radium activity in with high detection efficiency. A 226Ra activity of 0.5 mBq/kg is measurable with ten days of measurement using this method.
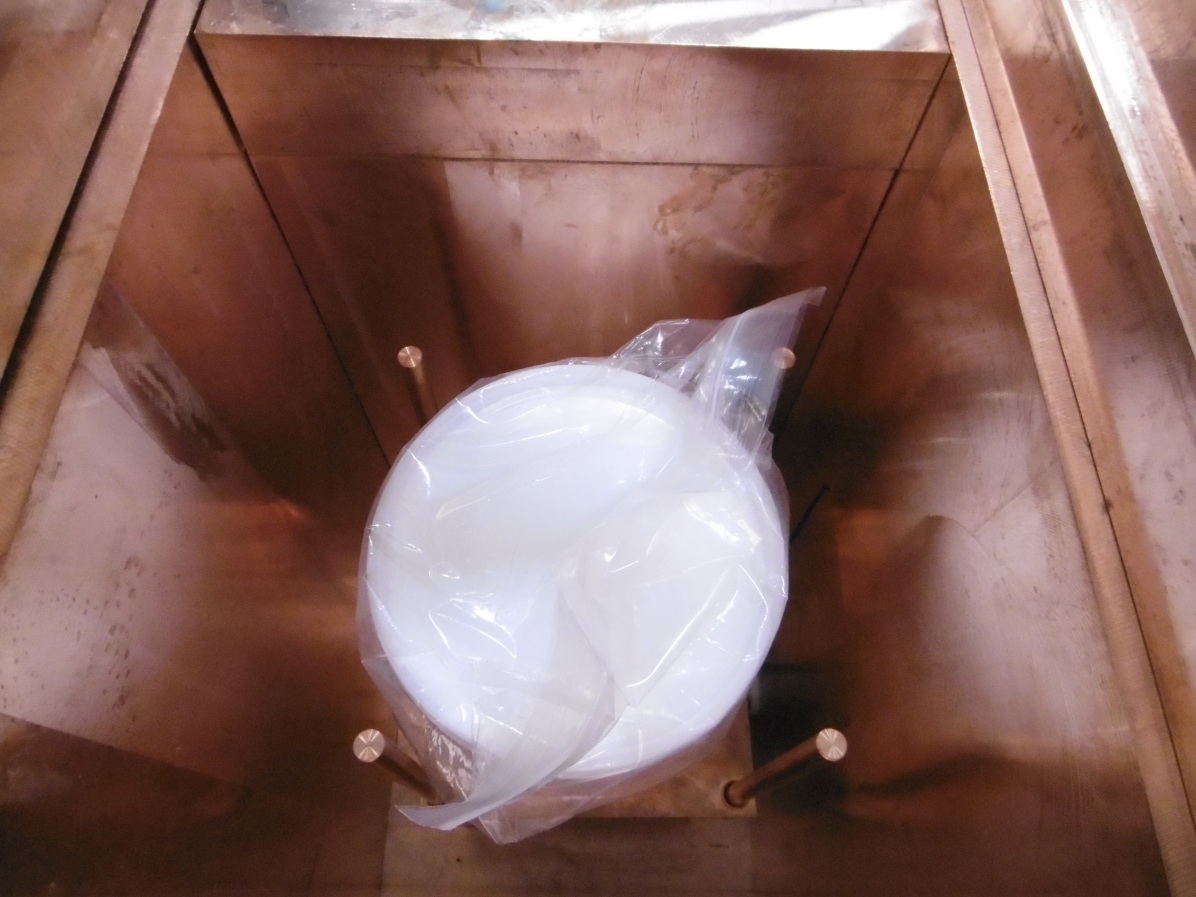
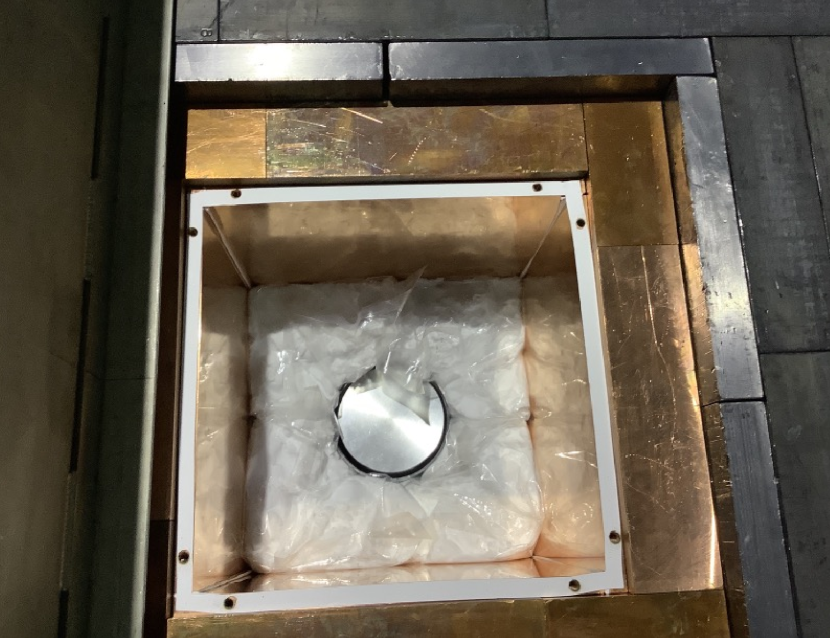
Second, 2.5 kg of was packed into ethylene-vinyl alcohol (EVOH) bags. Any radon present was purged from the bags with radon-free air, the bags evacuated and then closed. Four such bags are loaded directly into the HPGe shield, surrounding the detector head and filling the space within the shield. Figure 5(b) shows the detector with four EVOH bags of loaded for measurement. About two weeks of sample measurement time is required to achieve a MDA of mBq/kg of 226Ra at 95% confidence level.
A Monte Carlo simulation based on Geant4 was used to evaluate the detection efficiency for the sample geometries.
5.2 HPGe Performance
Table 3 shows relevant characteristics and some background count rates at relevant gamma energies of all the HPGe detectors used, as well as the number of SK-Gd samples assayed on each.
| Lab | Detector |
|
|
|
|
|
|
|
|
|||||||||||||||||||||||||
|---|---|---|---|---|---|---|---|---|---|---|---|---|---|---|---|---|---|---|---|---|---|---|---|---|---|---|---|---|---|---|---|---|---|---|
| BUGS | Belmont | 3.2 | 1.92 | 90.0 | 0.12 | 0.67 | 0.47 | 0.58 | 8 | |||||||||||||||||||||||||
| BUGS | Merrybent | 2.0 | 1.87 | 145.0 | 0.23 | 2.15 | 0.47 | 1.16 | 5 | |||||||||||||||||||||||||
| LSC | GeOroel | 2.31 | 2.22 | 128.7 | 0.53 | 0.89 | 0.06 | 0.46 | 3 | |||||||||||||||||||||||||
| LSC | Asterix | 2.13 | 1.92 | 171.3 | 0.11 | 1.10 | 0.28 | 0.61 | 13 | |||||||||||||||||||||||||
| LSC | GeAnayet | 2.26 | 1.99 | 461.2 | 3.68 | 0.71 | 0.16 | 0.74 | 2 | |||||||||||||||||||||||||
| Kamioka | Lab-C Ge | 1.68 | 2.39 | 104.5 | 0.08 | 0.39 | 0.41 | 0.44 | 23 |
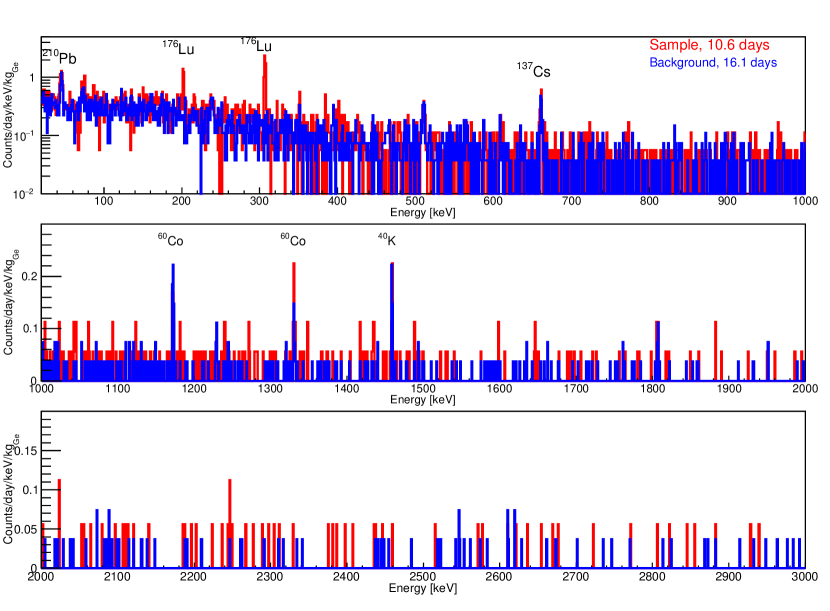
Figure 6 shows a typical measurement spectrum (red) compared with the detector background (blue). The measurement corresponds to 10 kg of measured by Kamioka’s Lab-C Ge detector. No peaks from daughters of 226Ra (for example, 214Pb: 295 keV, 352 keV, and 214Bi: 609 keV, 1120 keV, 1764 keV) are observed either in the sample or background data. The two peaks observed at 202 keV and 307 keV in the sample spectrum come from the decay of 176Lu, which is observed in most samples.
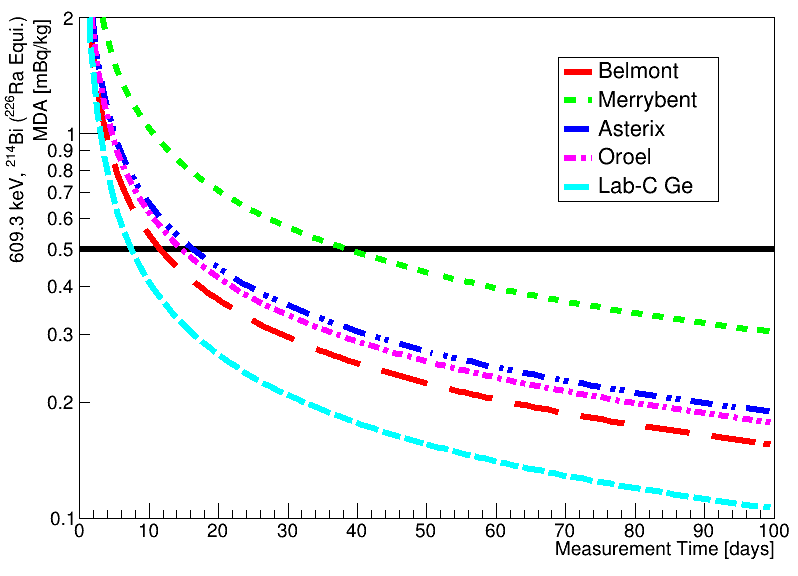
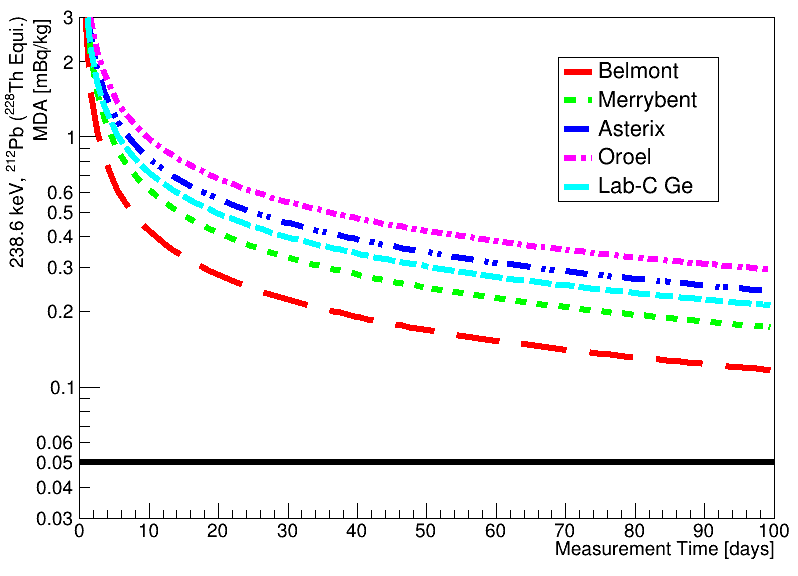
A true comparison of the sensitivities of the HPGe detectors accounts for the detector backgrounds as well as the gamma detection efficiency for the particular sample. For samples prepared according to the particular procedures used in each laboratory, all of the detectors used in this study are sensitive to mBq/kg of 235U and its daughters within just a few days of measurement. In contrast, none of the HPGe detectors are sensitive to mBq/kg of 232Th daughters in any realistic measurement timescale (see Figure 7(b)). Since 238U is measurable using ICP-MS, achieving a sensitivity of mBq/kg using HPGe methods is not critical. For 226Ra daughters, all HPGe detectors are sensitive to mBq/kg within a few weeks of measurement (see Figure 7(a)). It is this requirement which primarily motivates the measurement time of samples on the HPGe detectors.
5.3 ICP-MS
In addition to HPGe gamma spectrometry at Kamioka Laboratory, specialty ICP-MS is used to assay U, Th, and Ce impurities.
To measure U and Th at the parts-per-trillion (ppt) level, a solid-phase extraction technique has been developed 10.1093/ptep/pty096 . First, a nitric acid aqueous solution in which a sample of is dissolved is passed through a well-washed chromatographic extraction resin, so that about 90% or more U and Th are adsorbed on the resin but Gd is not. U and Th can then be eluted from the resin when a dilute nitric acid solution is passed through. Finally, by analyzing the elute with ICP-MS it is possible to measure trace amounts of U and Th without interference from Gd, which is reduced by a factor of about 104.
To assay Ce impurities, is diluted 10,000-fold by mass ratio with 2% HNO3. Then the concentration of Ce in the aqueous solution is directly measured using ICP-MS. At this concentration, the matrix effect due to the existence of Gd is negligible since the Gd concentration is 0.01%.
6 Results
Table 4 shows the results from the ICP-MS assays of all batch samples of . All samples meet the criteria for U, Th and Ce contamination except for one which slightly exceeds the criteria value for Th. This will be discussed later in more detail. The mean Ce concentration in all approved samples of , weighted by the dissolved batch mass, is measured to be ppb, well below the 50 ppb requirement.
| Batch ID | Ce [ppb] | U [ppt] | Th [ppt] |
|---|---|---|---|
| 50 | 400 | 13 | |
| 17090X | 35±1.6 | 2.7 | 4.9±1.8 |
| 180702 | 10 | 3.0 | 4.8±0.4 |
| 180703 | 10 | 1.4 | 9.1±2.9 |
| 190302 | 23.5±1.0 | 6.4 | 9.8 |
| 190303 | 10.4±1.2 | 7.3 | 19 |
| 190304 | 10.8±0.7 | 13 | 19 |
| 190502 | 10.0±0.6 | 4.9 | 7.4 |
| 190604 | 32.5±0.7 | 4.8±0.5 | 7.7±0.7 |
| 190606 | 29.0±0.8 | 8.9 | 17 |
| 190607 | 10.1±0.1 | 9.7 | 11.6±2.3 |
| 190608 | 13.8±1.0 | 5.6 | 7.7 |
| 190702 | 12.1±0.7 | 3.9±0.3 | 12 |
| 190703 | 9.7±0.6 | 3.4±0.6 | 2.1±0.4 |
| 190704 | 13.9±0.5 | 5.9±0.4 | 6.3±0.8 |
| 190706 | 5.3±0.6 | 4.7±0.4 | 1.2±0.1 |
| 190801 | 4.5±0.5 | 3.7±0.4 | 2.1±0.8 |
| 190803 | 6.3±0.6 | 3.4±0.6 | 1.9±0.6 |
| 190804 | 6.0±0.3 | 2.5±0.7 | 15.5±1.0 |
| 190805 | 6.5±0.6 | 2.2±0.8 | 0.2±0.3 |
| 190806 | 5.9±0.4 | 8.5±1.0 | 7.8±0.5 |
| 190901 | 8.0±0.9 | 4.0±0.3 | 7.2±1.0 |
| 190902 | 5.7±0.4 | 2.4±0.5 | 5.0±1.1 |
| 190903 | 5.5±0.4 | 4.0±1.0 | 3.8±0.5 |
| 190905 | 6.5±0.4 | 2.7±0.5 | 4.4±0.7 |
| 200101 | 6.7±0.8 | 4.2 | 6.5 |
| 200103 | 4.5±0.2 | 1.4±0.3 | 2.1±0.5 |
| 200104 | 4.0±0.4 | 1.4±0.5 | 2.5±0.9 |
Gamma spectrometric assay results for all SK-Gd batch samples are shown in Table 5. For the late-chain 238U (226Ra equilibrium) and entire 235U series, most of the limits set on the activity are below the detection limit for the given detector. Some activities in these sub-chains are reported with finite, non-zero values at the 95% confidence level. The decision criteria for reporting one-sided or two-sided confidence intervals for low numbers of counts follows the procedure recommended in hurtgen2000 .
For 228Ra and 228Th, many of the later batches (after 190706) are observed to contain more than the criteria value of gamma activity. Considering the ICP-MS measurements of 232Th indicate an activity which satisfies the SK-Gd requirements, it is inferred that the production and processing of the powder disrupts the secular equilibrium in the decay chain, removing 232Th more efficiently than 228Ra. The significant excess of 228Ra daughters in these later batches is associated with a known excess of impurities in the raw material which was used to produce these batches. As described in Section 4, most lots of were selected to contain 150-200 ppb of Th. The later lots contained more Th but could not be affordably replaced with a cleaner raw material. We justify the use of this material, despite the impurities, knowing that Ra is adsorbed by cation exchange resins in the SK-Gd water system ABE2022166248 , and that the mean lifetime of 228Th is 2.7 years, well within the expected lifetime of the SK-Gd project.
We also note that many samples contained 176Lu and 138La. Since these nuclides have -values below 2 MeV, they are below the detection threshold in SK-Gd so do not meaningfully affect any physics analyses.
The total impurity activity budget for SK-Gd (Section 2) is generally based on the requirement that backgrounds will not increase by more than 100% of the pre-Gd backgrounds. For all of the limited decay chain activities, the radioactivity budget is shown in Table 6 along with a summary of the estimated total impurities dissolved into SK-Gd via the .
To estimate the total impurities in all batches, we first assume that each small (4-10 kg for HPGe measurements, several grams for ICP-MS measurements) assayed sample exactly represents the radioactivity of the full 500 kg batch from which it came, then combine the finite activities and upper limits in two ways. First, a lower bound on the total activity is the sum of all finite measured (FM) activities, with the errors combined in quadrature. Second, a conservative upper bound on the total activity is the sum of all 95% confidence level upper limits (UL), which includes the reported one-sided confidence intervals as well as the finite measurements plus 1.645 times the measurement standard deviation.
For 238U and 232Th, the ICP-MS measurements show that the total added radioactivity is well below the SK-Gd budget. The HPGe results for all parts of the 238U and 235U decay chains show that, even in the worst case scenario, the SK-Gd requirements are met even though some samples of contain activities which exceed the required specific activity for these nuclides.
For 228Ra and 228Th, the sum of finite measurements (FM) in all batch samples is more than half of the total SK-Gd budget, even though these dissolved batches only consist of about 10% of the design Gd concentration. The conservative upper limit (UL) for these decay chain activities is 30% to 60% greater than the total SK-Gd budget. Without better measurements of the 228Ra and 228Th activities, it is not known whether the SK-Gd total budget is met or exceeded.
Since the 232Th activity is shown to be well within the total SK-Gd budget, and since it is known that Ra is adsorbed by the resin in the SK-Gd water system, only the observed activity of 228Th is expected to be problematic for SK-Gd. The HPGe result for 228Th represents the true activity of 208Tl at the time of measurement, which will decay with a 1.9 yr half-life assuming all 228Ra is removed during the SK-Gd water filtration. By one half-life, the worst-case estimate of total 208Tl activity is within the SK-Gd requirement.
| Sample | Laboratory | Detector / Method | Activity (mBq/kg, 95% c.l.) | ||||||||||
|---|---|---|---|---|---|---|---|---|---|---|---|---|---|
| 238U Chain | 232Th Chain | 235U Chain | 40K | 138La | 176Lu | 134Cs | 137Cs | ||||||
| E, 238U eq. | L, 226Ra eq. | E, 228Ra eq. | L, 228Th eq. | E, 235U eq. | L, 227Ac eq. | ||||||||
| SK-Gd Req. | <5 | <0.5 | <0.05 | <0.05 | <30 | <30 | - | - | - | - | - | ||
| 17090X | Canfranc | ge-Asterix | <6 | <0.21 | <0.30 | <0.30 | <0.42 | <1.6 | <1.0 | <0.14 | <0.13±0.03 | <0.07 | <0.13 |
| 180702 | Canfranc | ge-Asterix | <3.1 | <0.12 | <0.22 | <0.21 | <0.3 | <1.1 | <0.5 | 0.13±0.04 | <0.24±0.03 | <0.07 | <0.08 |
| 180703 | Canfranc | ge-Asterix | <4.5 | <0.24 | <0.44 | <0.38 | <0.3 | <1.1 | <0.5 | <0.14 | <0.22±0.03 | <0.07 | <0.07 |
| 190302 | Canfranc | ge-Asterix | <4.9 | <0.32 | <0.35 | <0.29 | <0.42 | <0.92 | <1.6 | 0.26±0.1 | <0.21 | <0.09 | <0.09 |
| 190303 | Canfranc | ge-Asterix | <4.2 | <0.3 | <0.44 | <0.29 | <0.39 | <0.81 | <1.5 | 0.45±0.09 | 0.16±0.12 | <0.08 | <0.09 |
| 190304 | Canfranc | ge-Asterix | <5.5 | <0.42 | <0.55 | <0.36 | <0.52 | <1.22 | <2.1 | 0.40±0.11 | <0.21 | <0.13 | <0.14 |
| 190502 | Boulby | Belmont | <5.4 | <0.49 | <0.95 | <0.48 | <0.36 | <1.7 | <2.8 | <0.28 | 0.49±0.08 | - | <0.10 |
| Kamioka | Lab-C Ge | <25.0 | <0.75 | <0.52 | <0.36 | <9 | 7.9±0.8 | <1.63 | <0.37 | 0.68±0.18 | <0.16 | <0.22 | |
| 190604 | Boulby | Belmont | <9.80 | <0.47 | <0.61 | <0.50 | <0.45 | <2.33 | <2.45 | <0.21 | 0.97±0.11 | - | <0.08 |
| Kamioka | Lab-C Ge | <26.9 | <0.68 | <0.55 | <0.33 | <4.6 | <1.2 | <2.02 | <0.36 | 1.43±0.19 | <0.19 | <0.34 | |
| 190606 | Boulby | Merrybent | <13.1 | <0.84 | <0.79 | <0.63 | <0.37 | 2.6±0.6 | <3.27 | <0.29 | 1.23±0.16 | - | <0.13 |
| Kamioka | Lab-C Ge | <17.3 | <1.36 | <0.91 | <0.94 | <8.3 | 2.6±1.3 | <3.20 | <0.26 | 0.74±0.29 | <0.39 | <0.50 | |
| Kamioka | Lab-C Ge, Ra Disk | - | <0.31 | <0.82 | <0.48 | - | - | - | - | - | - | - | |
| 190607 | Canfranc | ge-Oroel | <3.6 | <0.30 | <0.79 | <0.42 | <0.30 | <0.96 | <1.59 | <0.18 | <0.13 | <0.12 | <0.09 |
| 190608 | Canfranc | ge-Asterix | <4.4 | <0.53 | <0.43 | <0.35 | <0.40 | <0.88 | <1.50 | <0.14 | <0.25 | <0.08 | <0.09 |
| Kamioka | Lab-C Ge | <23.2 | <1.06 | <1.38 | <0.80 | <4.3 | <1.8 | <2.15 | <0.49 | <0.51 | <0.21 | <0.30 | |
| Kamioka | Lab-C Ge, Ra Disk | - | <0.63 | <0.52 | <0.61 | - | - | - | - | - | - | - | |
| 190702 | Canfranc | ge-Oroel | <5.5 | <0.45 | <1.11 | <0.50 | <0.37 | 2.4±0.9 | <1.5 | <0.20 | 0.23±0.13 | <0.12 | <0.11 |
| Kamioka | Lab-C Ge | <12.0 | <0.63 | <1.08 | <0.33 | <3.4 | <1.6 | <1.99 | <0.28 | 0.28±0.12 | <0.17 | <0.28 | |
| 190703 | Canfranc | ge-Asterix | <4.2 | <0.35 | <0.51 | <0.50 | <0.45 | 1.8±1.0 | <1.7 | <0.20 | 0.51±0.13 | <0.10 | <0.10 |
| 190704 | Boulby | Belmont | <9.8 | <0.44 | <0.66 | <0.75 | <0.29 | <1.39 | <2.01 | <0.25 | <0.18 | - | <0.10 |
| 190706 | Boulby | Belmont | <9.5 | <0.45 | <0.66 | 0.53±0.12 | <0.28 | <1.32 | <2.09 | <0.25 | <0.25 | - | <0.13 |
| Kamioka | Lab-C Ge | <9.4 | <0.69 | <0.50 | <0.86 | <2.26 | <1.10 | <1.9 | <0.29 | <0.19 | <0.19 | <0.26 | |
| 190801 | Canfranc | ge-Anayet | <14 | 0.92 | <1.5 | <0.77 | <0.80 | <1.17 | <1.44 | <0.18 | 2.7±0.2 | <0.23 | <0.18 |
| 190803 | Canfranc | ge-Asterix | <3.5 | <0.31 | 0.39±0.21 | 0.55±0.22 | <0.36 | <0.74 | <1.4 | <0.09 | 3.5±0.1 | <0.08 | <0.07 |
| 190804 | Boulby | Belmont | <11 | <0.46 | 0.67±0.21 | <0.67 | <0.38 | <1.98 | <2.57 | <0.20 | 4.60±0.24 | - | <0.10 |
| 190805 | Canfranc | ge-Oroel | <4.6 | <0.52 | 0.53±0.44 | 0.57±0.40 | <0.44 | <0.98 | <1.18 | <0.10 | 9.44±0.10 | <0.10 | <0.09 |
| 190806 | Boulby | Merrybent | <8.09 | <0.43 | 0.49±0.11 | 1.27±0.13 | <0.26 | <1.23 | <1.78 | <0.14 | 9.35±0.22 | - | <0.07 |
| 190901 | Canfranc | ge-Asterix | <4.3 | <0.30 | 0.42±0.27 | 0.37±0.27 | <0.46 | <1.20 | <1.47 | <0.15 | 4.85±0.12 | <0.10 | <0.13 |
| 190902 | Boulby | Belmont | <5.52 | <0.26 | 0.53±0.10 | 0.63±0.09 | <0.33 | <1.22 | <1.32 | <0.10 | 8.78±0.18 | - | <0.05 |
| 190903 | Canfranc | ge-Asterix | <4.4 | <0.37 | 0.59±0.28 | 0.35±0.28 | <0.54 | <1.7 | <1.5 | <0.14 | 4.9±0.1 | <0.10 | <0.09 |
| 190905 | Kamioka | Lab-C Ge | <8.6 | <0.21 | 0.72±0.20 | 0.70±0.16 | <5.2 | <1.1 | <1.57 | <0.09 | 6.6±0.2 | <0.09 | <0.13 |
| Kamioka | Lab-C Ge, Ra Disk | - | <0.29 | 0.58±0.25 | <0.39 | - | - | - | - | - | - | - | |
| 200101 | Kamioka | IPMU-N | <6.80 | <0.35 | 0.98±0.18 | 1.00±0.15 | 8.24±1.68 | <0.54 | <0.95 | <0.08 | 6.25±0.17 | <0.18 | <0.13 |
| 200103 | Kamioka | IPMU-N | <8.46 | 0.51±0.12 | 1.42±0.25 | 0.84±0.17 | <2.11 | <0.88 | <1.43 | <0.12 | 0.18±0.07 | <0.13 | <0.16 |
| 200104 | Kamioka | IPMU-N | <8.39 | <0.36 | 1.48±0.24 | 0.84±0.18 | <3.45 | <0.95 | <1.02 | <0.08 | <0.28 | <0.23 | <0.11 |
| Chain | Part of Chain | SK-Gd Req. | HPGe | ICP-MS | ||||||||||||
|---|---|---|---|---|---|---|---|---|---|---|---|---|---|---|---|---|
|
|
|
|
|
||||||||||||
| 238U | RI 238U | 4.5 Gy | 650 | – | – | |||||||||||
| E, 238U eq. | 4.5 Gy | 650 | – | |||||||||||||
| L, 226Ra eq. | 1602 y | 65 | – | |||||||||||||
| 232Th | RI 232Th | 14 Gy | 6.5 | – | – | |||||||||||
| E, 228Ra eq. | 5.7 y | 6.5 | – | |||||||||||||
| L, 228Th eq. | 1.9 y | 6.5 | – | |||||||||||||
| 235U | E, 235U eq. | 0.7 Gy | 3900 | – | ||||||||||||
| L, 227Ac eq. | 21.7 y | 3900 | – | |||||||||||||
7 New purification process to reduce Radium
To reduce the radium concentration in future batches of for SK, a new process has been developed. It utilizes the difference of precipitation pH between Gd hydroxide and Ra hydroxide. By adding a base to an acidic aqueous solution of the raw material and adjusting the pH of the aqueous solution between 8 and 9, Gd precipitates as Gd hydroxide while maintaining the state in which Ra is still dissolved in the aqueous phase. As bases for pH adjustment, ammonia, sodium hydroxide, and potassium hydroxide can be considered. It is most preferable to use ammonia for pH adjustment to avoid contamination with other metals such as sodium or potassium. During a test, 25% by mass aqueous ammonia was gradually added to the aqueous Gd chloride solution after dissolving Gd oxide to adjust the pH to 8.0. Then Gd hydroxide can be obtained as a precipitate. The amount of ammonia water added to 10 kg of the Gd chloride solution was 4.7 kg. The precipitate was separated by filtration and washed with water until the chloride ion concentration of the filtrate became 1000 mg/L or less to obtain gadolinium hydroxide. The obtained hydroxide is again dissolved in 35% by mass hydrochloric acid aqueous solution to obtain an acidic aqueous Gd solution which is an input to the solvent extraction. As shown in Table 7, we succeeded in reducing Ra to less than 1% of its previous value with this new process.
| Only solvent extraction | With hydroxide precipitation | |
|---|---|---|
| pH during precipitation | - | 8.0 |
| pH during solvent extraction | 1.1 | 1.1 |
| Gd recovery rate [%] | 91 | 90 |
| 238U by ICP-MS [ppb] | 16 | <0.8 |
| 232Th by ICP-MS [ppb] | 1.2 | <0.02 |
| 228Ra by HPGe [mBq/kg] | 162 | <0.4 |
8 Conclusions
This paper reports the development and detailed properties of about 13 tons of which has been dissolved into SK in the summer of 2020. We evaluated the impact of radioactive impurities in on DSNB searches and solar neutrino observations. We confirmed the need to reduce radioactive and fluorescent impurities by about three orders of magnitude from commercially available high-purity . Therefore, we developed a method to remove impurities from by acid dissolution, solvent extraction, and pH control processes, and then we developed a high-purity sulfation process. All of the produced high-purity batches were sampled and assayed by ICP-MS and HPGe detectors to evaluate their quality. Because the HPGe assays require long measurement times to achieve sufficient sensitivity to distinguish very low levels of radioactive impurities, measurements were performed in cooperation with HPGe detectors at LSC in Spain, Boulby in the UK, and Kamioka in Japan.
In the first half of production, the assayed batch purities were consistent with the specifications. However, it was found that the in the latter half of the produced batches contained one order of magnitude more 228Ra than the budgeted mean contamination. This was correlated with the corresponding characteristics of the raw material , in which an intrinsically large contamination was present and could not affordably be replaced with raw material of ideal condition. However, since the increase of the background event rate for solar neutrino observations due to this activity of 228Ra is at the same level as the background in the pure water phase of SK, the decision was made to introduce these later batches into SK anyway.
A new method to remove 228Ra from has been subsequently established. Introduced into SK in 2022, the latest 26 tons of show the required high-purity.
Acknowledgments
We gratefully acknowledge the Super-Kamiokande experiment. It has been built and operated from funding by the Japanese Ministry of Education, Culture, Sports, Science and Technology, the U.S. Department of Energy, and the U.S. National Science Foundation. We also acknowledge the cooperation of the Kamioka Mining and Smelting Company, Japan. Some of us have been supported by funds from the Ministry of Education, Japan 2018R1D1A3B07050696, 2018R1D1A1B07049158, the Japan Society for the Promotion of Science (JSPS) KAKENHI Grants Grant-in-Aid for Scientific Research on Innovative Areas No. 26104004, 26104006, 17H06365, 19H05807, 19H05808, Grant-in-Aid for Specially Promoted Research No. 26000003, Grant-in-Aid for Young Scientists No. 17K14290, and Grant-in-Aid for JSPS Research Fellow No. 18J00049, Universities and Innovation grant PID2021-124050NB-C31, the European Union’s Horizon 2020 Research and Innovation Programme under the Marie Sklodowska-Curie 2020-MSCA-RISE-2019 SK2HK grant agreement no. 872549. We acknowledge Israel Chemicals Ltd UK (ICL-UK) for hosting the U.K. Science and Technology Facilities Council’s (STFC) Boulby Underground Laboratory. The authors from Sheffield were supported by the STFC under award numbers ST/R000069/1, ST/T00200X/1, ST/V002821/1, ST/V006185/1, and ST/S000747/1. We are grateful to the Laboratorio Subterráneo de Canfranc (Spain) for supporting the low-background materials screening work.
References
- (1) Y. Fukuda et al., Nucl. Instrum. Meth. A, 501, 418–462 (2003).
- (2) J. F. Beacom and M. R. Vagins, Phys. Rev. Lett., 93, 171101 (2004), hep-ph/0309300.
- (3) K. Abe et al., Nucl. Instrum. Meth. A, 1027, 166248 (2022), arXiv:2109.00360.
- (4) A. G. Popeko and G. M. Ter-Akopian, Nuclear Instruments and Methods, 178(1), 163–165 (1980).
- (5) H. W. Sobel, A. A. Hruschka, W. R. Kropp, J. Lathrop, F. Reines, M.F. Crouch, B. S. Meyer, and J. P. F. Sellschop, Phys. Rev. C, 7, 1564–1579 (Apr 1973).
- (6) A. G. Popeko, V. I. Smirnov, G. M. Ter-Akop’yan, B. V. Fefilov, and L. P. Chelnokov, Sov. J. Nucl. Phys. (Engl. Transl.); (United States), 24:3 (9 1976).
- (7) T. Ethvignot, M. Devlin, H. Duarte, T. Granier, R. C. Haight, B. Morillon, B. R. O. Nelson, J. M. O’Donnell, and D. Rochman, Phys. Rev. Lett., 94, 052701 (Feb 2005).
- (8) Pablo Fernández Menéndez, Neutrino physics in present and future kamioka water-cherenkov detectors with neutron tagging, PhD thesis, U. Autonoma, Madrid (main) (2017).
- (9) K. Abe et al., Phys. Rev. D, 104, 122002 (Dec 2021).
- (10) K. Abe et al., Phys. Rev. D, 94, 052010 (Sep 2016).
- (11) W. B. Wilson, R. T. Perry, E. F. Shores, W. S. Charlton, T. A. Parish, G. P. Estes, T. H. Brown, E. D. Arthur, M. Bozoian, T. R. England, D. G. Madland, and J. E. Stewart, SOURCES 4C: a code for calculating ([alpha],n), spontaneous fission, and delayed neutron sources and spectra (1 2002).
- (12) T. Shigematsu, Y. Nishikawa, K. Hiraki, S. Goda, and Y. Tsujimoto, Bunseki kagaku, 20(5), 575–581 (1971).
- (13) Ll. Marti et al., Nucl. Instrum. Meth. A, 959, 163549 (2020), arXiv:1908.11532.
- (14) K. Abe et al., Nuclear Instruments and Methods in Physics Research Section A: Accelerators, Spectrometers, Detectors and Associated Equipment, 1027, 166248 (2022).
- (15) A. Kumari, R. Panda, M. K. Jha, and D. D. Pathak, Comptes Rendus Chimie, 21(11), 1029–1034 (2018).
- (16) P. R. Scovell et al., Astroparticle Physics, 97, 160–173 (2018).
- (17) D. S. Akerib et al., Eur. Phys. J., C80(11), 1–52 (2020).
- (18) S. Agostinelli et al., Nuclear Instruments and Methods in Physics Research Section A: Accelerators, Spectrometers, Detectors and Associated Equipment, 506(3), 250–303 (2003).
- (19) M. Thiesse, P. Scovell, and L. Thompson, Applied Radiation and Isotopes, 188, 110384 (2022).
- (20) CANBERRA France Inc., https://www.canberra.com/fr/ (data last accessed 2021-12-20).
- (21) K. Abe et al., Journal of Instrumentation, 15(09), P09027–P09027 (sep 2020).
- (22) S. Ito et al., Progress of Theoretical and Experimental Physics, 2018(9), 091H01 (09 2018), https://academic.oup.com/ptep/article-pdf/2018/9/091H01/25845516/pty096.pdf.
- (23) S. Ito et al., Progress of Theoretical and Experimental Physics, 2020(9), 093H02 (09 2020), https://academic.oup.com/ptep/article-pdf/2020/9/093H02/33774486/ptaa105.pdf.
- (24) C. Hurtgen, S. Jerome, and M. Woods, Applied Radiation and Isotopes, 53(1), 45–50 (2000).
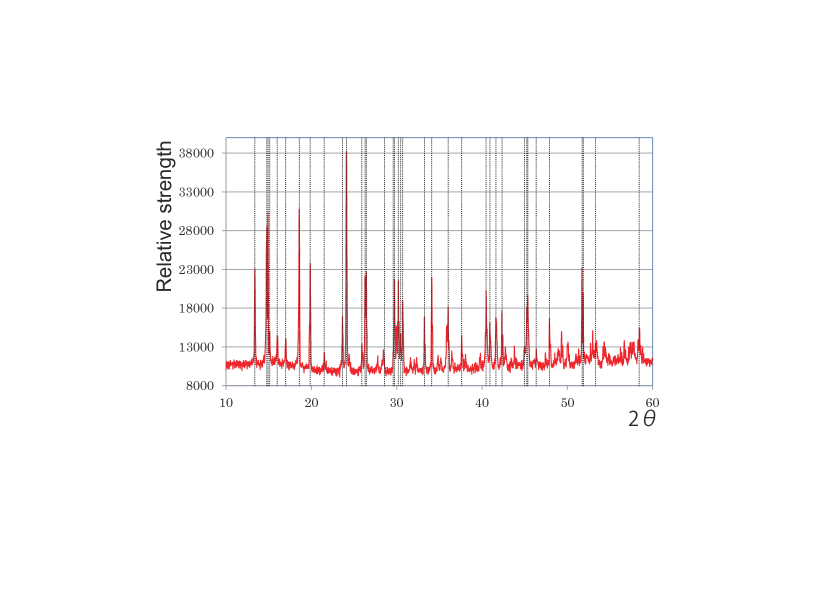
Appendix A X-ray diffraction analysis
An example of x-ray diffraction data of one batch sample is shown in Figure 8. Since particles have high crystallinity, the orientation dependence of each peak intensity is high. Therefore, the intensity may change depending on how it is packed in a holder, so the peak positions (not the relative intensities) must be checked. As a result, all the peak positions are in agreement with the X-ray diffraction database :ICPDS # 01-81-1794: Gadolinium Sulfate octahydrate.
Appendix B Thermogravimetric analysis
An example of thermogravimetric analysis data of one batch sample is shown in Figure 9. The sample is heated from room temperature to 800∘ C, and the mass change depending on the temperature is measured. Figure 9 shows the mass loss and the heat flow as functions of sample temperature. The mass loss observed near 100∘ C is mainly due to the evaporation of the water remaining during purification, and the mass loss at higher temperatures is due to the evaporation of the octahydrate from . The expected mass loss due to going from an octahydrate to an anhydrous form of gadolinium sulfate is 19.3%.