Socially Enhanced Situation Awareness from Microblogs using Artificial Intelligence: A Survey
Abstract.
The rise of social media platforms provides an unbounded, infinitely rich source of aggregate knowledge of the world around us, both historic and real-time, from a human perspective. The greatest challenge we face is how to process and understand this raw and unstructured data, go beyond individual observations and see the “big picture”—the domain of Situation Awareness. We provide an extensive survey of Artificial Intelligence research, focusing on microblog social media data with applications to Situation Awareness, that gives the seminal work and state-of-the-art approaches across six thematic areas: Crime, Disasters, Finance, Physical Environment, Politics, and Health and Population. We provide a novel, unified methodological perspective, identify key results and challenges, and present ongoing research directions.
1. Introduction
Being able to understand the state of the world around us—referred to as situation awareness—is a fundamental capability for making effective decisions affecting our future. The role of “Social Media”, sometimes attributed to as “Web 2.0”, is at the forefront of this endeavour today. Social media refers to those internet and mobile-based services that facilitate online exchanges of conversations, social networking and forming online communities for contributing user-created content among their users (Dewing, 2010). Arguably, the vast uptake of social media platforms has revolutionized the way people interact socially with each other. These platforms allow individuals, organizations and governments to interact with a large number of people, all in real-time, through the exchange of texts, photos, videos and social network cues such as liking and following.
The billions of active social media users per month (Statista, 2021) provide a big data processing challenge that is infeasible without employing high performance, large-scale distributed computational methods—with a rapidly increasing demand for machine learning (Bishop, 2006) approaches. Machine Learning (ML) is a subset of Artificial Intelligence (AI) that primarily focuses on making a system learn and improve itself without involving explicit programming, by utilizing concepts primarily from statistics, probability, linear algebra, and differential calculus. ML shares its application scope with many inter-disciplinary areas, including medical (Kononenko, 2001), linguistics (Manning, 2015), time series forecasting (Ahmed et al., 2010), and computer vision (Voulodimos et al., 2018). The various learning paradigms associated with ML are discussed later in Section 2.
1.1. Situation awareness from social media
Speed, transparency, and ubiquity, aided by the proliferation of mobile technology, are the main reasons for the growth of social media. For example, situations that would have otherwise remained relatively unknown for an indefinite period are now being reported and shared worldwide within minutes (Mayfield, 2008). It literally takes only a few seconds to report a situation globally on social media: take a photo, write a few words and share it online. This reporting method is more efficient than individual cellular communication (e.g. making individual calls to friends and family) since social media effectively provides a public broadcast platform for individuals. Effective inclusion of information drawn from social media has become a necessity for government authorities to better understand the environment and people that they govern. The online interaction between users with the exchange of status updates, news stories, and other media has potential to be significantly advantageous for situation awareness.
As defined in (Endsley, 2000), situation awareness is a three-stage process: Perception, Comprehension, and Projection. In the Perception stage, information regarding an event is collected and unwanted information is filtered out. The Comprehension stage involves integrating multiple pieces of information collected from the earlier stage and studying its relevance and validity. The last stage of situation awareness is the Projection stage, and it has been found that even experienced individuals rely on future projections heavily while dealing with situations. Projecting the current scenarios and dynamics to their future implications gives space for timely and effective decision-making.
A situation is traditionally perceived using observations, questionnaires, interviews, checklists and measurements (Endsley, 2000). Social media conversations in the form of text, photos, and videos overlap the observation, questionnaire and interview methods of collecting data. Previous studies have shown that such socially generated data contributes to a better understanding of an ongoing situation (Imran et al., 2015). For example, during a disastrous event people tend to use social media excessively, as they share their safety status and exchange conversations to query the safety status of their friends and family. People also share what they have seen, felt, or heard from others. During such critical hours of a disaster, the use of social media can peak to unprecedented levels, and based on these public conversations first responders and decision-makers can visualize a more comprehensive real-time picture of the situation to aid in formulating actionable plans.
1.2. The social media spectrum
Figure 1 classifies some of the popular (Statista, 2021) social media services. Social Network Services are platforms that allow users to create profiles and develop a network of connections so that their exchanged conversations are shared effectively within the network. Instant Messaging Services are a subclass of Social Network Services, considering their main feature of creating users’ networks. Online Journals, commonly referred to as “blogs”, let their users publish stories/ideas usually in a reverse chronological order. Social Bookmarking Services allow users to bookmark links to websites. These services can generate enormous traffic to the bookmarked web content. Microblogs are online broadcasting services that allow users to post updates with a limited number of words or characters. Wikis are collaborative platforms powered by wiki engines where their users can edit and manage the content. Unlike content management system such as WordPress, the content production in a wiki is not limited to a sole author. Media-Sharing Services allow their users to share media contents such as images and videos. This classification does not have strict boundaries because one way or another, these services borrow features from the other side of the spectrum to keep their users engaged. Consider Twitter—it is a microblogging platform, but it also acts as a Social Network and also allows sharing of images and short videos just like Media-Sharing Services.
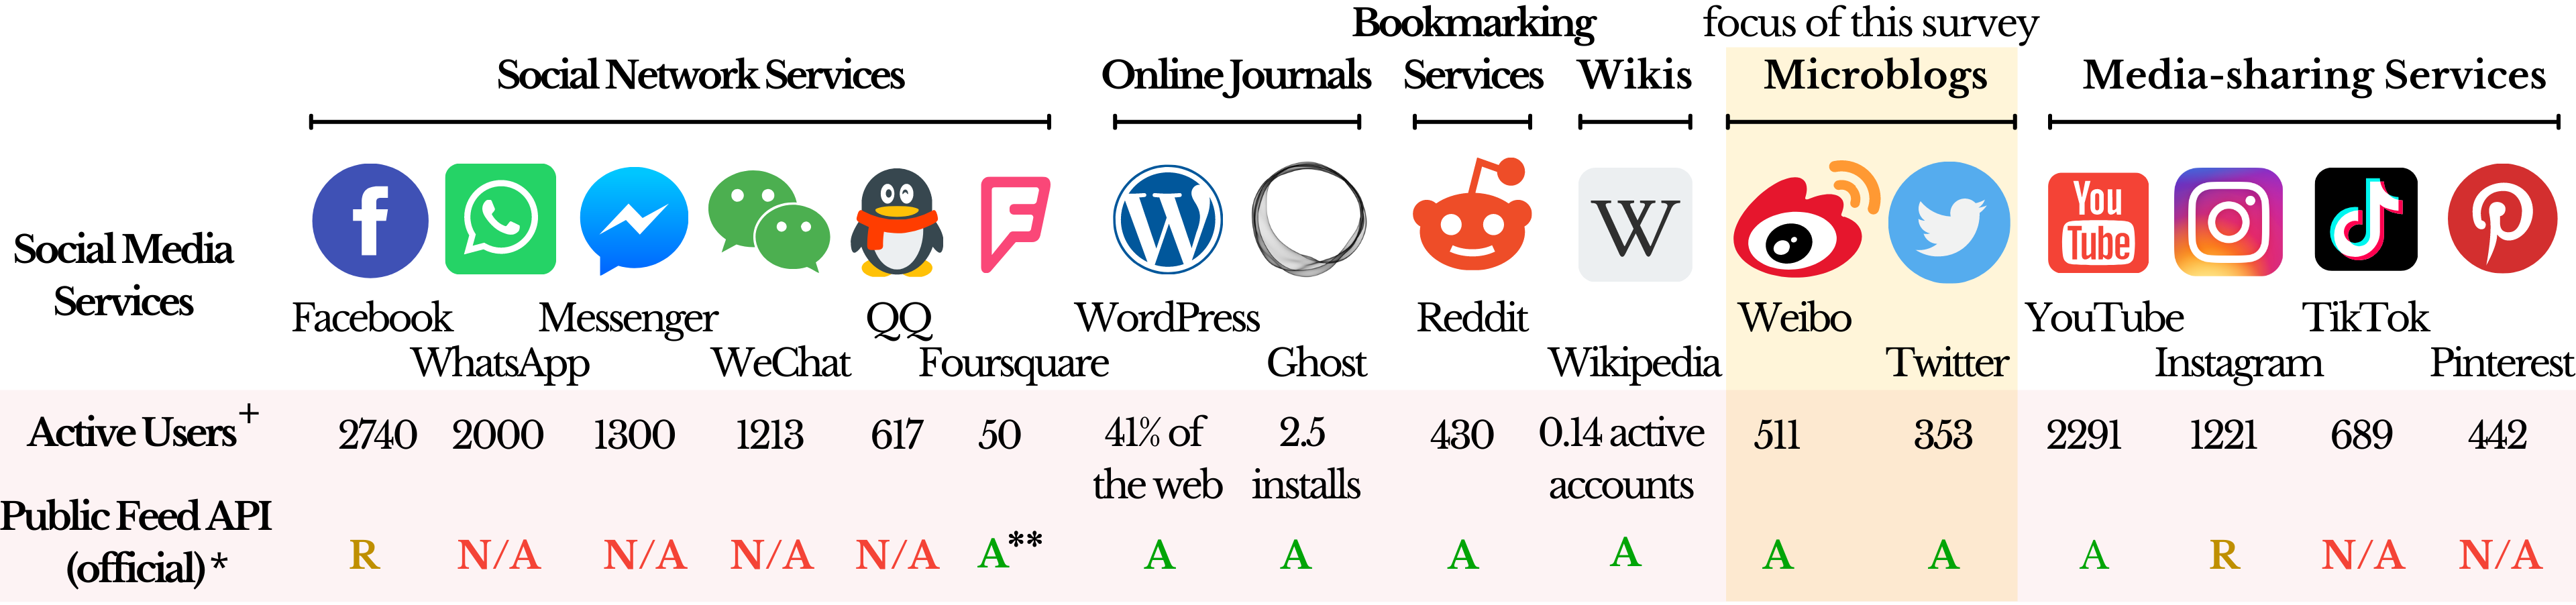
1.2.1. Suitability for situation awareness
To be an effective source of social media for enhancing situation awareness we consider three key attributes (shown in Figure 1): the content should carry real-time descriptions, there should be a significantly large and active userbase, and the service must provide a public streaming API. With these criteria in mind, we focused this survey on Microblog services, primarily research that uses Twitter data. Some social media services may not have real-time attributes, i.e. their content is updated over a long time intervals, but they still contribute to enhancing situation awareness by enriching the data obtained from their real-time peers. Consider, for example, an event associated with the Eiffel Tower; during the processing of social media conversations, a parallel analysis from wikis can help ML models understand that the event is closely associated with France, Paris, a structure, a monument, etc.
1.3. Scope and organization
There are existing surveys related to social media analytics concerning its techniques, tools, platforms (Batrinca and Treleaven, 2015), and applications—disasters (Nazer et al., 2017; Imran et al., 2015), visual analytics (Wu et al., 2016), politics (Stieglitz and Dang-Xuan, 2013), health (Abbasi et al., 2014), business (Holsapple et al., 2014), false information and rumor detection (Kumar and Shah, 2018; Zubiaga et al., 2018). Based on our literature search, the previous surveys either focus on social media in general and/or are application/analysis-specific. To the best of our knowledge, this survey is the first that studies the use of AI for extracting situation awareness from microblogs without limitations on both the application and analysis. As major contributions of this survey, we:
-
—
discuss the essential aspects of microblog analytics and present a high-level methodological view of the literature (in Section 2),
-
—
survey AI research that extract situational information from microblog data (in Section 3),
-
—
provide a commentative review of the literature and present challenges and research directions in the domain (in Section 4).
2. Background and Preliminary Concepts
In this section, we discuss high-level aspects of microblog analytics that are common across the surveyed literature. We start with a review of differing tasks, associated algorithms/methods, some advanced ML methods, and later provide a broad description of commonly used microblog data and its uses, followed by basic and advanced methods for representation learning. We refrain from en masse citations to the literature in this section; a detailed literature breakdown is given in Section 3.
2.1. Fundamental Machine Learning
Many of the applications/problems described in the surveyed literature were addressed using fundamental applications of machine learning and/or applied statistics.
2.1.1. Supervised learning problems
In this set of problems, the task is to learn a function that maps an input to output based on previously recorded examples (Bishop, 2006); therefore requiring labelled data for training purposes. Considering a set of previously recorded examples, , such that represents the feature vector of the -th example and represents the corresponding output class, a supervised learning problem aims at modelling a function , where represents the input space and represents the output space. Supervised learning problems are further divided into two types: Regression (continuous output) and Classification (discrete output or categories). The literature employs different variants of regression-based algorithms such as Linear/Polynomial Regression, Stepwise Regression, Poisson Regression (Wang et al., 2012c; Bendler et al., 2014; Corea, 2016; Leitch and Sherif, 2017), and classification-based algorithms such as Logistic Regression (LR) (Gerber, 2014; Chen et al., 2015; Ashktorab et al., 2014), Naive Bayes (NB) (Wang et al., 2012b; D’Andrea et al., 2015; Gu et al., 2016; Sarker et al., 2016; Neppalli et al., 2017; Ruz et al., 2020), -Nearest Neighbours (KNN) (Abbass et al., 2020), Decision Trees (DT) (D’Andrea et al., 2015; Sarker et al., 2016), Random Forest (RF) (Alam et al., 2018; Ruz et al., 2020; Tejaswin et al., 2015; Mamidi et al., 2019), Support Vector Machine (SVM) (D’Andrea et al., 2015; Sarker et al., 2016; Neppalli et al., 2017; Ruz et al., 2020), and Artificial Neural Network (ANN) (refer to Section 4.2 for recent trends in the use of neural models).
2.1.2. Unsupervised learning problems
This set of problems deal with the task of learning internal patterns from unlabelled data (Bishop, 2006): clustering—finding groups of similar examples; density estimation—determining the distribution of data; visualization—projecting high-dimensional data to a two or three-dimensional space; outlier detection—detecting anomalies; topic modelling—learning latent variables; and understanding opinions from texts using lexicon-based methods (some literature classify lexicon-based methods as semi-supervised as these methods maintain a predefined dictionary of words and phrases). Commonly used methods in unsupervised learning are -Means (Liu et al., 2015), Hierarchical Clustering, Isolation Forest, Latent Dirichlet Allocation (LDA) (Gerber, 2014; Wang et al., 2012c; Abd-Alrazaq et al., 2020), Kernel Density Estimation (KDE) (Gerber, 2014; Chen et al., 2015), Principal Component Analysis (PCA), and ANN. There is a third learning paradigm, an instance of weak supervision (Zhou, 2018), known as Semi-supervised learning, where a small set of labelled data is used alongside a large set of unlabelled data during training. One of its cases is Active learning (discussed shortly in Section 2.2.2), which aims at training models during situations when labelled data may not be available promptly.
2.1.3. Applied statistical problems
Besides the learning problems discussed above, some surveyed literature uses computationally intensive applied statistical methods. Examples include classical time series forecasting methods (Achrekar et al., 2011; Gaurav et al., 2013) (e.g. auto-regressive (AR) models, moving average (MA) models, and their variants) for forecasting the future using historical data, Markov models (Barberá, 2015) for modelling systems with pseudo-random characteristics, resampling methods for estimating the precision of statistics, generalized additive models (Wang et al., 2012a; de Almeida Marques-Toledo et al., 2017) for modelling interpretable predictor functions, the Granger causality test for causality analysis (Bollen et al., 2011; Zhang et al., 2012) in multiple time series data.
2.2. Advanced Machine Learning
Of the surveyed literature, the more recent works tend to utilize an ensemble of techniques for focusing fundamentally on the “learning” perspective to deal with large-scale data, discussed below.
2.2.1. Representation learning
Also known as feature learning, representation learning (Bengio et al., 2013) allows a system to automatically learn meaningful and useful representations of data. This set of techniques replaces traditional manual feature engineering, thus enabling systems to learn features by themselves and train for specific tasks. Examples include ANN, Sparse Coding, Independent Component Analysis, and Clustering methods. Deep learning (LeCun et al., 2015) is a representation learning method based on ANN, used for both supervised and unsupervised tasks, where each layer in the network learns to transform the input data into a more abstract and composite representation. Nowadays, deep learning architectures are the go-to methods for dealing with large-scale data, as these architectures often capture sophisticated non-linear relationships and outperform their traditional counterparts in numerous tasks further in. Deep learning architectures such as Multilayer Perceptron (MLP), Convolutional Neural Network (CNN), and Recurrent Neural Network (RNN) are supervised models. Architectures such as Self-Organizing Maps (SOMs), Boltzmann Machines, and AutoEncoders are unsupervised models.
2.2.2. Active learning
In Active learning (Settles, 2009), a case of semi-supervised learning, a learning algorithm (learner) interactively queries a human to label sampled examples. Since the learner itself determines the examples for labelling, the number of labelled data needed in active learning is often less than the number required in normal supervised learning. The learner uses probabilistic methods for uncertainty sampling of examples from the unlabelled dataset. The uncertainty sampling approach includes strategies such as least confidence, margin sampling, and entropy sampling. Other methods include Query-By-Committee, Expected Error Reduction and Weighted Methods.
2.2.3. Few-shot learning
In Few-shot learning (FSL) (Wang et al., 2020b) the training set contains a limited number of labelled examples. FSL is mainly applied to supervised tasks such as image classification, text classification, and object recognition. There is another instance of FSL—Few-shot reinforcement learning—that aims to find a policy given only a few state-action pairs. The literature classifies FSL tasks into three categories: Data-based where training data is augmented by prior knowledge; Model-based where the hypothesis space is limited by prior knowledge; and Algorithm-based where search methods in the hypothesis space are altered by prior knowledge.
2.2.4. Transfer learning
In Transfer learning (TL) (Zhuang et al., 2020) knowledge is transferred across related source domains. Data labelling in the case of microblogs can be time-consuming, expensive, or unrealistic during events such as disasters and riots. Semi-supervised learning does utilize a small chunk of labelled data alongside a large unlabelled set for improving learning accuracy. However, obtaining unlabelled data itself can be difficult in many cases. During such a scenario, TL has been reported to show promising results. In TL, a base network is trained for a base task using a dataset, and then the learned features are transferred to a different network for training on a target dataset concerning a target task (Yosinski et al., 2014). TL works if the features are generic to both base and target tasks. Some examples of TL include the Inception model (Szegedy et al., 2016) and ResNet model (He et al., 2016) for image data, and Word2vec (Mikolov et al., 2013) and GloVe (Pennington et al., 2014) for text data.
2.3. Microblog data
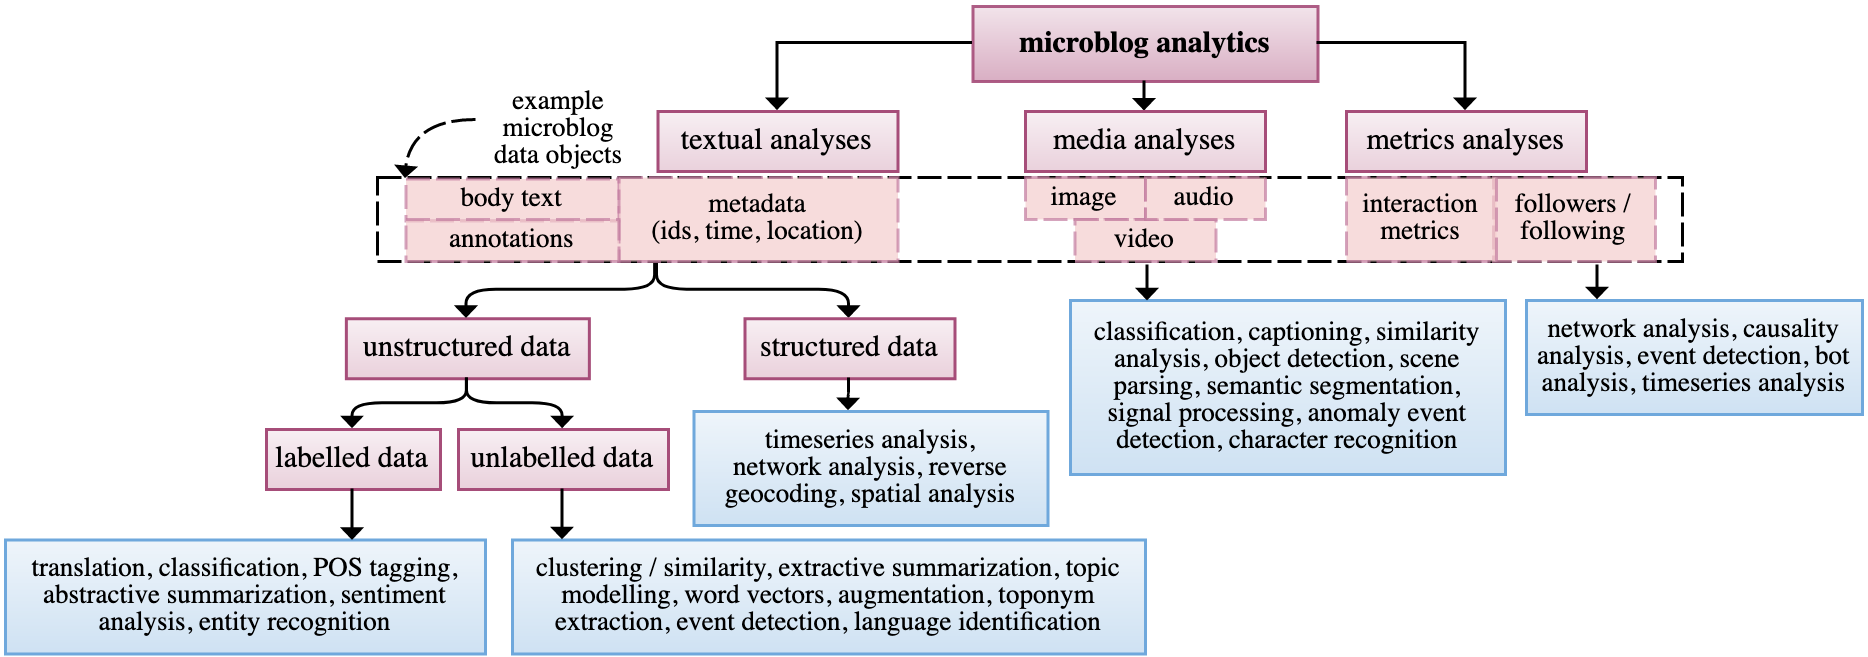
The most common surveyed uses of microblog data are shown in Figure 2 as a taxonomy of microblog data objects-specific tasks. From the literature, we have identified five main categories of microblog data: Data objects include fundamental attributes such as text content, content creation time, content identifier, a resharing flag, etc.; User objects include details that reference a user’s profile, for example, user id, user biography, location, followers/following list, etc.; Geo objects, available when content is geo-tagged, include attributes related to geographic information, such as precise geo-coordinates, bounding box coordinates, and place type; Entity objects provide additional contextual information regarding the content, for example hashtags, URLs, user mentions, media, etc.; and Miscellaneous objects contain diverse attributes, including interaction metrics, machine-identified language of the content and service specific data.
2.4. Word Vectorization
Word vector representation methods found in the literature are broadly either Frequency-based, where the components of the vectors associate to the frequency attribute of words and word sequences, or Prediction-based, where the vectors are trained weights of a neural network.
2.4.1. Frequency-based
(a) Bag of words. In the Bag of words (BoW) model, each document (text object) is represented by a vector of dimension where is the vocabulary, and the -th component of the vector represents the frequency of the corresponding -th word in the document. (b) Bag of -grams. In this model, the vocabulary consists of -grams, where represents the size of the continuous sequence. The -gram of size is a bigram and size is a trigram. The BoW model is a special case where , i.e. a unigram. (c) Term Frequency-Inverse Document Frequency (TF-IDF). The TF-IDF model uses the “importance of a word to a document” factor for computing the vector representation of the document. The TF-IDF value, defined as the product of and , increases proportionally to the frequency of a word in a document and is penalized based on the number of documents in the corpus containing the word . Frequency-based methods introduce high dimensionality and sparsity issues due to vocabulary size. Furthermore, they fail to capture the true semantics of words and do not deal with out-of-vocabulary (OOV) words.
2.4.2. Prediction-based
(a) Static Embeddings. In 2013, Mikolov et al. (Mikolov et al., 2013) proposed Word2vec, a neural network-based text representation model that learns word vectors of a given dimension while maintaining semantic similarity between the words, thus solving the dimensionality, sparsity and context issues associated with frequency-based methods. GloVe (Pennington et al., 2014) is a similar technique, but exploits both global statistics and local statistics of a text corpus, whereas Word2vec uses only the local statistics. Both Word2vec and GloVe consider words as the smallest units to train on. This results in an inability to deal with OOV words. In 2016, Facebook proposed FastText (Bojanowski et al., 2017) to address the OOV words issue by representing each word as a bag of character n-grams. These models generate static embeddings (vectors) i.e. the same embedding is assigned to the same words used across different contexts.
(b) Contextual (Dynamic) Embeddings. Recent progress in Natural Language Processing (NLP) has led to the design of contextualized embedding models that address the issue of polysemous. Some widely used such models include seq2seq NMT (Neural machine translation) model-based Contextualized Word Vectors (CoVe) (McCann et al., 2017); two-layer bidirectional LSTM-based Embeddings from Language Models (ELMo) (Peters et al., 2018); ASGD Weight-Dropped LSTM-based Universal Language Model Fine-tuning (ULMFiT) (Howard and Ruder, 2018); and Transformer-based (Vaswani et al., 2017) Bidirectional Encoder Representations from Transformers (BERT) (Devlin et al., 2018) and Generative Pre-trained Transformer-3 (GPT-3) (Radford et al., 2018).
2.5. Image Representation
In recent years, numerous methods have been proposed for learning image representations. Some methods to visual feature learning include learning through image colorization, image inpainting, image super-resolution, image generation with Generative Adversarial Networks (GANs) (Goodfellow et al., 2014) and game engines, context similarity and spatial relations between image patches, shuffling of image patches, image clustering, and TL (Jing and Tian, 2020). In 2020, Chen et al. (Chen et al., 2020) proposed SimCLR, a simplified framework for contrastive learning of visual representations, that outperforms the existing state-of-the-art method (Henaff, 2020) for self-supervised and semi-supervised learning, and performs on par with or better than the supervised baseline method (Kornblith et al., 2019).
2.6. Graph Representation
Based on the encoder-decoder framework proposed by Hamilton et al. (Hamilton et al., 2017), and depending on the type of information used in the encoder network, graphs representation learning methods are majorly classified into four classes: shallow embeddings, graph auto-encoders, graph-based regularization, and graph neural networks (Chami et al., 2020). Shallow embeddings, auto-encoders, and graph neural networks are unsupervised embedding methods that map a graph onto a vector space with the objective of learning an embedding that preserves the graph structure. Graph-based regularization is a supervised graph embedding method; shallow embeddings and graph neural networks also have their use in supervised settings. The supervised methods, however, besides learning the representations, also predict node or graph labels that could be valuable particularly for downstream supervised tasks such as node or graph classification.
Mining of microblog data objects introduces various social networks of unprecedented scales: networks of friends, hashtags, keywords, followers, bots, geographic locations, etc. The literature represents a social network as a graph—a nonlinear data structure consisting of entities and their relationships. Normally, a network is a graph , where denotes vertexes (entities) and denotes edges (relationships), and it is represented mathematically using matrices such as Incidence Matrix, (Weighted) Adjacency Matrix, Degree Matrix, Laplacian Matrix (Bollobás and Bollobas, 1998). Social networks are a means to study the behavior of entities like people, organizations, and events; for example, a network analysis of users’ pool is modeled by distinguishing the individuals as nodes and their relationships as edges. Graph mining has application to social network analysis across multiple tasks (Tang and Liu, 2010) including Centrality analysis—identifying the most influential nodes in a network, Community detection—identifying communities/groups through public discourse and/or interaction patterns, Information diffusion—studying how information propagates/flows in a network, and Outlier detection—identifying rare entities and/or relationships.
2.7. Evaluation metrics
There is no consistent use of evaluation metrics across the surveyed literature and this makes it hard to numerically compare different studies. R-squared (), Mean Absolute Error (MAE), Root Mean Square Error (RMSE), Relative Absolute Error (RAE), and Root Relative Squared Error (RRSE) are some common evaluation metrics for regression problems. Consider a problem where represents actual values and represents predicted target values. Let and the notation . Then the evaluation metrics are defined: is ; MAE is ; RMSE is ; RAE is ; and RRSE is . Some studies use Pearson’s Correlation Coefficient (PCC), where is sample size, and , are data points, to find a measure of fit for linear regression, and time series problems.
Accuracy, Precision, Recall (a.k.a. sensitivity), Specificity, F-measure, and Area under the ROC Curve (AUC) are the commonly used evaluation metrics for classification problems. True Positive (TP), True Negative (TN), False Positive (FP) and False Negative (FN) are measures used for computing those metrics. TP represents the number of samples predicted positive and that are actually positive. TN represents the number of samples predicted negative and that are actually negative. FP represents the number of samples predicted positive but that are actually negative. FN represents the number of samples predicted negative but that are actually positive. Accuracy is the number of correct predictions to the total number of samples, . Accuracy is not applicable if the dataset is imbalanced (unequal distribution of samples between classes). Precision gives the percentage of positive samples out of the total predicted positive samples and is computed as . Recall gives the percentage of positive samples out of the total actual positive samples and is computed as . Specificity gives the percentage of negative samples out of the total actual negative samples and is computed as . F-measure is the harmonic mean of precision and recall and is computed as . The Area under the ROC Curve (AUC) is a plot of Sensitivity versus 1-Specificity across varying threshold values. The Receiver Operating Characteristics (ROC) curve is a probability curve. A model with a good measure of separability has an AUC score near .
Common evaluation metrics for clustering are Silhouette Coefficient (SC) and Dunn’s Index (DI). SC is computed as , where is the average distance between a sample and all other datapoints in the same cluster, and is the distance between a sample and all other datapoints in the next nearest cluster. The distance metric can be any distance function, such as Euclidean or Manhattan. DI is the ratio of the minimum inter-cluster distance to the maximum cluster size.
2.8. A high-level methodological view of the literature
To better understand how the surveyed literature relates to the common problem of enhancing situation awareness from microblog data, we present a high-level methodological view of the literature, shown in Figure 3, that embodies the microblog data objects and range of techniques discussed above, and we provide theme-specific methodological examples in Section 3.
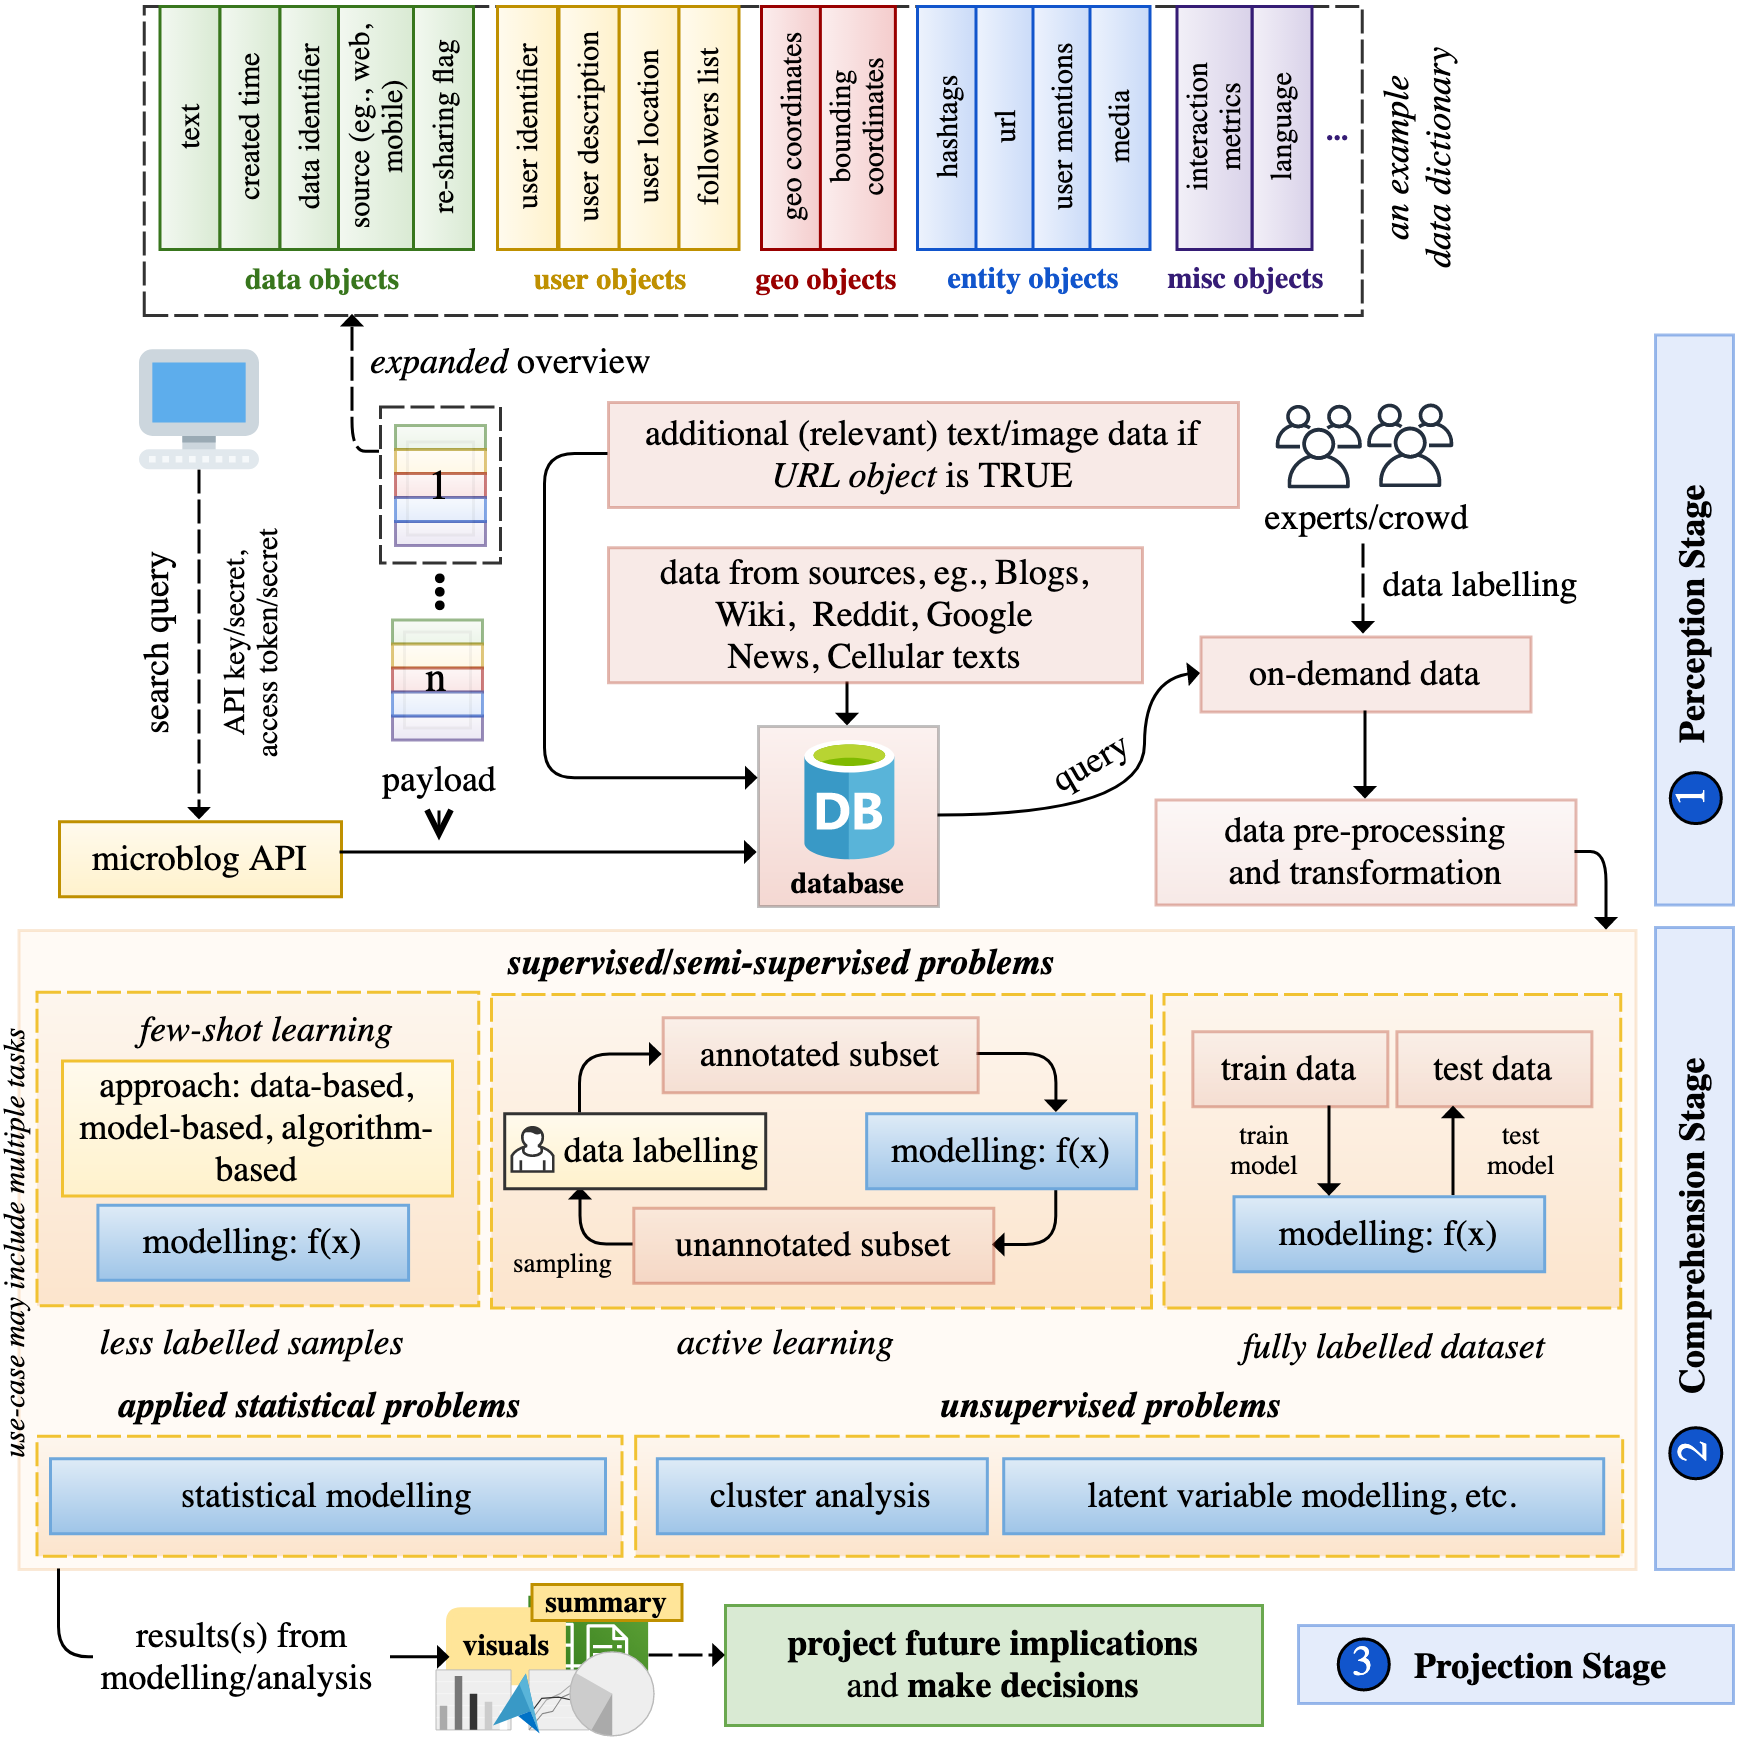
2.8.1. The perception stage
This stage involves the collection of relevant data. The first step to curating a large-scale microblog dataset starts with pre-determining a set of “seed” keywords (words and phrases) and hashtags (keywords preceded by a hash sign). Next, a search query is created. A search query contains keywords, hashtags, and conditions for requesting relevant data from API endpoints. For example, a search query using twarc111https://github.com/DocNow/twarc on Twitter’s full-archive endpoint can be as simple as: ”(covid OR quarantine OR lockdown OR pandemic OR #covid-19 OR #covid OR mask OR ppe OR flu) -filter:nativeretweets lang:en” –archive –since-id 1372953264359145481 –until-id 1407693866816393223. This query searches for original (not re-shared) English language Twitter contents that include the queried keywords and hashtags within their text body and were created between the two time-based “Snowflake” identifiers. When a connection is established, the microblog API endpoint returns a continuous data stream—payload—based on the search query. The payload is stored in a central database. Additional data such as discussions, headlines, and reports from other sources can also be considered for enriching the existing corpora.
High volume endpoints such as Twitter’s COVID-19 stream endpoint utilizes 4 partitions to split the overall volume of payload over multiple connections to consume the entire stream. File-based databases such as SQLite are equally effective for handling large-scale data, but they come with demerits of their own compared to their distributed peers. Therefore, the selection of the database is up to the user. Next an on-demand dataset is created and labelled (if the problem is supervised) either by experts or through crowdsourcing. The resulting data is finally pre-processed as per requirements.
2.8.2. The comprehension stage
2.8.3. The projection stage
This stage involves observing visualizations and summaries generated during the comprehension stage for projecting current scenarios to their future implications and making decisions. Activities in this stage include: (i) observing abstractive summarization of the data stream and quantitative assessments on maps/charts, and (ii) analyzing real-time convex closures (generated using geo-tagged content) of a situation.
3. Survey of AI Approaches for Situation Awareness
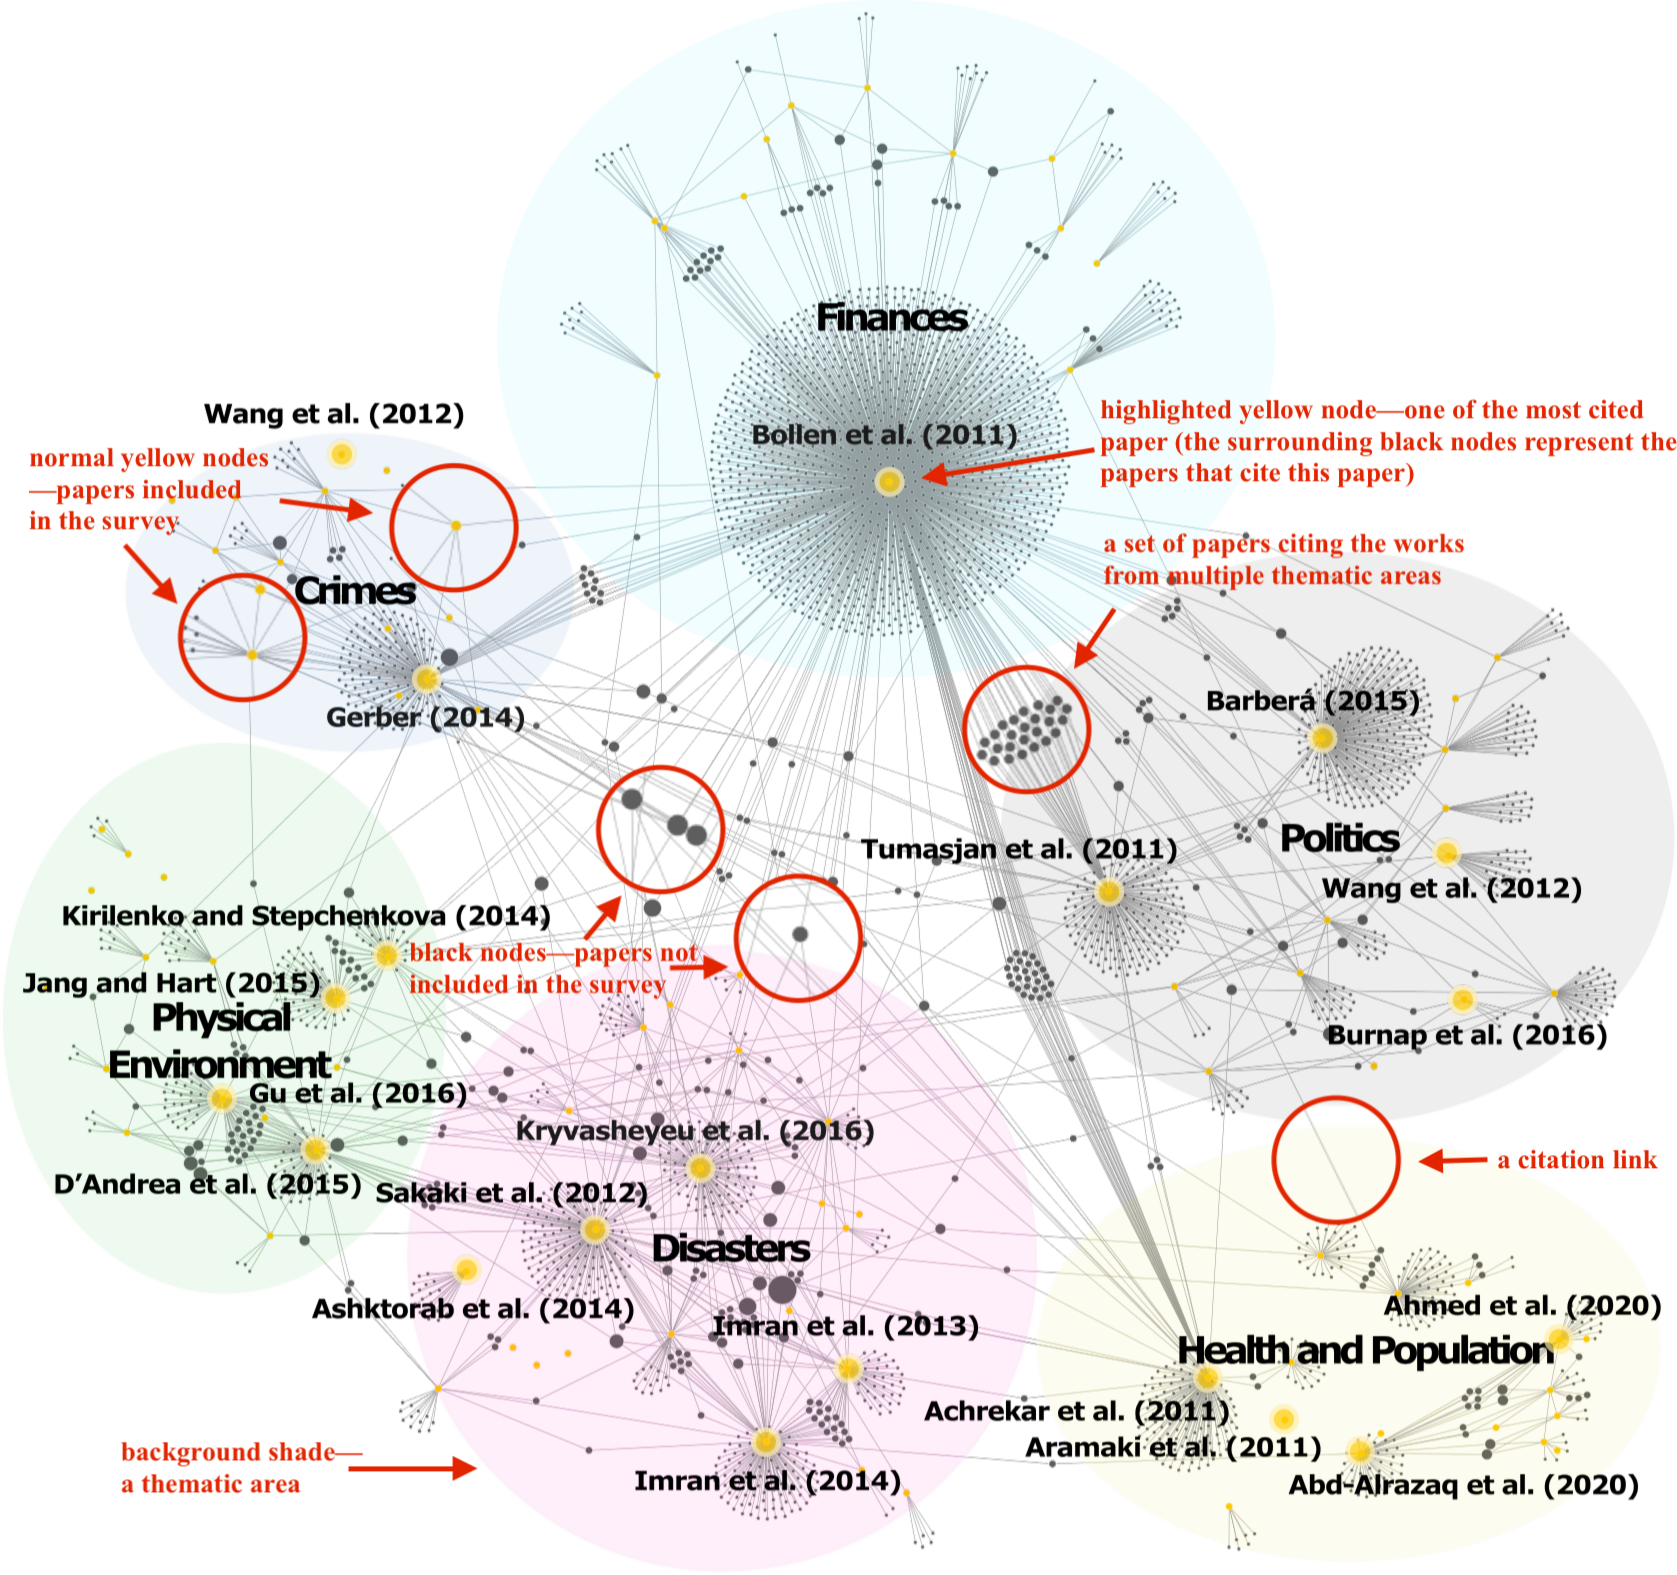
We undertook an extensive search in the digital libraries of ACM, Elsevier, IEEE, Springer, and other major publishers while also utilizing the Web of Science and Scopus databases to identify relevant papers published between 2010–21 (the early 2010s mark the emergence of microblog APIs222https://blog.twitter.com/developer/en_us/a/2011/streaming-api-turning-ssl-only-september-29th). We discarded papers from the initial set if: (i) primary data source was not microblog, (ii) extracting “situational information” was not the primary objective, (iii) AI was not employed significantly, and (iv) published before 2020 and had ¡5 citations. Crossref’s public API333https://www.crossref.org/documentation/retrieve-metadata/rest-api/ was used for querying the list of papers that cited a set of 78 papers initially collected during the filtering stage of the paper selection process. This data was used to create a citation network, shown in Figure 4, where nodes represent papers and are weighted based on the number of citations they receive from within the network. Under the hypothesis that the most influential papers are likely to have many citations we manually identified 19 additional papers that were either foundational papers or significantly related to the scope of this survey. Out of the surveyed papers, the nodes corresponding to the most prominent papers in terms of citations, are highlighted and labelled in the citation network.
Literature breakdown. We reviewed 97 papers out of which 28 were from Elsevier, 15 from IEEE, 13 from ACM, 9 from JMIR, 6 from Springer, and 26 (combined) from journals such as Taylor & Francis, Wiley, SAGE, Emerald and BMC. Out of 97 papers, this survey involved 63 journal papers, 29 conference and symposium papers, 2 workshop papers, 2 book chapters and 1 thesis article. Among the 20 most cited papers, 15 of them were published before 2016. Out of those, 7 are journal papers, 6 are conference papers, 1 is a book chapter, and 1 is a workshop paper. The remaining 5 out of the 20 most cited papers published after 2015 are all journal articles.
Thematic areas. The papers identified for the survey are classified into six thematic areas: Crime, Disasters, Finance, Physical Environment, Politics, and Health and Population. Each thematic area is further divided into sub-thematic areas based on research directions. Tables 2–7 provide an overview of the essential elements of the literature in each thematic area, and we use abbreviations throughout as shown in Table 1.
| SmPar | Semantic Parsing | TpMd | Topic Modelling | SmEx | Semantic Extraction |
| SpTmMd | Spatio-temporal Modelling | Cf | Classification | SeqLbl | Sequence Labelling |
| Reg | Regression | SnAn | Sentiment Analysis | WoVec | Word Vectors |
| DnEs | Density Estimation | AdSt | Advanced Statistics | CoFqAn | Content Frequency Analysis |
| LLVFE | Low Level Visual Features Extraction | NetAn | Network Analysis | NER | Name Entity Recognition |
3.1. Crime
This thematic area surveys microblog data as a “social crime sensor” that helps detect geographical regions that are more likely to show criminal conduct. Such analysis can assist agencies and governments in producing persistent solutions to counter crimes such as theft, burglary, robbery, cyberbullying, and harassment. Table 2 provides an overview of the literature in this theme.
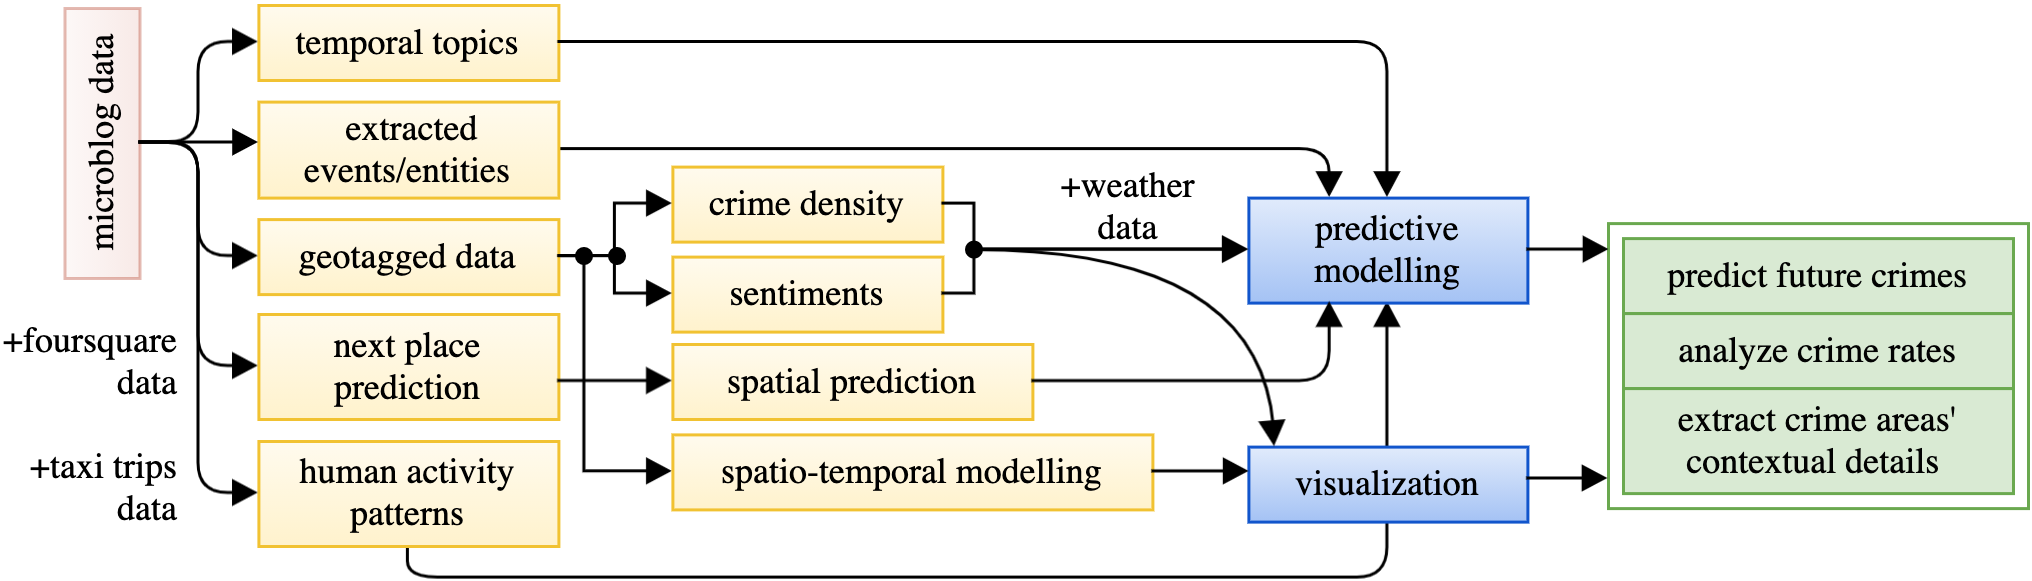
3.1.1. Predicting future crime
A Generalized Linear Regression Model (GLM) was designed by Wang et al. (Wang et al., 2012c) for predicting future hit-and-run incidents. The authors used LDA for topic modelling and Semantic Role Labeling (SRL) for extracting events, entities and their relationships from tweets. Their results showed that training an LDA/GLM model on event-specific words has higher predictive capability than training the same model on a complete vocabulary. Wang et al. (Wang et al., 2012a) extended this work while incorporating spatio-temporal, geographic, and demographic data. The extended work proposed a new modelling approach, the Spatio-Temporal Generalized Additive Model (STGAM), that used a feature-based approach to predict the probability of criminal activities alongside their space and time attributes.
Gerber (Gerber, 2014) collected geo-tagged Twitter data, used LDA for topic modelling, and designed a binary LR model using KDE + the features derived from the Twitter topics. In 19 of the 25 crime types, the Twitter data + KDE features improved the model’s performance compared to using just the KDE features. Similarly, Chen et al. (Chen et al., 2015) considered crime density, the sentiment of tweets, the last three days’ sentiment trend, and weather factors such as temperature, dew, precipitation, etc., as explanatory variables for designing a model to predict future crimes. The authors used KDE to compute crime density and lexicon-based methods for sentiment analysis and reported the KDE + Twitter + weather data model surpassing the base model that used only KDE features.
Bendler et al. (Bendler et al., 2014) used predictive analytics to show that Twitter data can assist in predicting future crimes. The authors selected a small region within San Francisco with higher Twitter activity, divided the area chosen into a grid, and performed regression analysis to provide evidence for the relationship between Twitter data and criminal activities. They trained SVM models to predict burglary and robbery crimes while including and excluding tweets’ volume feature. The inclusion of volume feature for training showed improvement in prediction performance.
Foursquare data has also been used in combination with Twitter data to study the correlation between the predicted masses of people at different venues and the occurrence of real crimes at those venues. Wang and Gerber (Wang and Gerber, 2015) designed two text-enriched models, one for predicting the type of venue (e.g., restaurant or transportation hub) the user is likely to visit next and another for predicting the spatial information. Their models outperformed all baseline models—three Markov models and an SVM model—trained on historical visiting details. They reported that geo-tagged tweets do correlate with users’ next venue visits.
| Direction | Year | Study | Primary Dataset | Geo Scope | Tasks | Best outcome |
|---|---|---|---|---|---|---|
| Predicting crimes | 2012 | (Wang et al., 2012c) | 3.65k tweets | United States | SmPar, TpMd | Wide confidence intervals |
| 2012 | (Wang et al., 2012a) | same as (Wang et al., 2012c) | United States | SmPar, SpTmMd, TpMd | AUC: 0.7616 | |
| 2014 | (Bendler et al., 2014) | 60k geo-tagged tweets | United States | Cf, Reg | Accuracy: 0.66 | |
| 2014 | (Gerber, 2014) | 1.52k geo-tagged tweets | United States | DnEs, TpMd | AUC: 0.71 | |
| 2015 | (Chen et al., 2015) | 1.06M tweets | United States | Cf, DnEs, SnAn | AUC: 0.67 | |
| 2015 | (Wang and Gerber, 2015) | 1.23M tweets, 224k POI from Foursquare | United States | Cf, Reg | Accuracy: 71% | |
| 2018 | (Vomfell et al., 2018) | 6 month period tweets, 47k POI from Foursquare | United States | Reg | 19% improvement over baseline model | |
| 2020 | (Abbass et al., 2020) | 150k tweets | Global | Cf | Accuracy: 92.0% | |
| Analyzing crime rates | 2016 | (Aghababaei and Makrehchi, 2016) | 101M tweets | United States | Cf | F-measure: 0.83 |
| 2018 | (Aghababaei and Makrehchi, 2018) | 1.13M tweets | United States | Cf, SnAn, TpMd | F-measure: 0.94 | |
| 2020 | (Vo et al., 2020) | 3.80k tweets | India | Clu | Accuracy: 70% | |
| Space-time Analysis | 2019 | (Piña-García and Ramírez-Ramírez, 2019) | 26k tweets, 2.57k tweets after filtering | Mexico | AdSt, Reg | Absolute errors for 80% & 95% coverage: 3.796 & 2.933 |
| 2019 | (Siriaraya et al., 2019) | 979k geo-tagged tweets | Mexico City | SnAn, WoVec | F-measure: 0.80 | |
| 2020 | (Ristea et al., 2020) | 9.43k geo-tagged tweets | Mexico City | DeEs, SnAn | AUC upper limit: 0.72–0.77 | |
| 2021 | (Park et al., 2021) | 123k tweets | Mexico City | Clu, SnAn, TpMd | Statistical analysis presented |
Similarly, data from Foursquare and Twitter has been combined with taxi trip data to analyze human activity patterns. Vomfell et al. (Vomfell et al., 2018) presented a multi-model solution using a Simultaneous Autoregressive Model, a Conditional Autoregressive Model, and a Generalized Linear Mixed Model as some of the predictors for their spatial linear regression models. The authors trained RF, Ensemble-based, and ANN models and reported that the heterogeneous data sources they considered contribute to a better prediction of property crimes compared to using just demographic data.
Abbass et al. (Abbass et al., 2020) developed an -gram language model to predict cybercrimes using Twitter. The authors collected tweets containing hashtags such as #harassment, #metoo, #sexualassualt, #cyberbullying, #victim for training Multinomial NB, KNN and SVM models to find the best value of for the -gram model. Their results showed that the bigram language model performed better than the network-based feature selection approach, and SVM outperformed other models.
3.1.2. Analyzing crime rates
Relationships between Twitter data and crime rates have been examined in multiple studies. Aghababaei and Makrehchi (Aghababaei and Makrehchi, 2016) trained a linear SVM model using features extracted from historical Twitter data. Their model achieved an -measure of 0.83 for crimes such as theft, burglary, and sex offences; however, the results for crimes such as murder and vandalism correlated poorly. The same work was later extended with a temporal topic model (Aghababaei and Makrehchi, 2018) which outperformed the batch model in 17 out of 22 crime types. Vo et al. (Vo et al., 2020) analyzed Twitter data from seven major cities of India to confirm that tweets contribute to a better understanding of crime rates. The authors used the Twitter part-of-speech tagger444http://www.cs.cmu.edu/ ark/TweetNLP/, and a class-based -gram clustering (Brown et al., 1992) to build a crime rate detection model that predicted nearly 70% of the crime rates.
3.1.3. Space-time analysis
An exploratory study was done by Piña-García and Ramírez-Ramírez (Piña-García and Ramírez-Ramírez, 2019) using Twitter data alongside Google Trends on 13 different crimes, including theft, robbery, rape and homicide. Tweets were filtered at the API level using Spanish keywords such as ‘‘inseguridad’’, ‘‘violencia’’, ‘‘robo’’, ‘‘crimen’’, and ‘‘víctima’’. Their results showed the pairwise correlation of the official crime data and the tweets as almost negligible. The authors asserted that Twitter data should be considered merely observative and not representative. However, they acknowledged the effectiveness of Twitter data in understanding the spatio-temporal patterns of crime data.
A crime analysis tool was developed by Siriaraya et al. (Siriaraya et al., 2019) to provide contextual information regarding crimes through visualization. The tool uses a binary linear SVM trained on GloVe for identifying negative sentiment tweets to explore the negative characteristics of crime associated areas. The tool visualizes situational information based on crime type and period. Tweets specific to a crime or a region are shown on an interactive map, and a word cloud is generated to describe the spatial and temporal aspects of the crime area.
Concerning sporting events, Ristea et al. (Ristea et al., 2020) studied the spatial relationship between geo-tagged tweets and crime occurrences alongside demographic and environmental aspects. The authors used crowd-sourced databases related to “hate words” and “swearing” to extract tweets containing at least one word from those databases. Feature selection was done using RF, and sentiment analysis was performed based on lexicon methods. They computed the density estimate based on the centre points of each grid and then trained an LR model. Their result showed improved AUC in all crime types during event days and non-event days with the addition of Twitter data to the base model.
Similarly, Park et al. (Park et al., 2021) examined the spatial distribution of sentiments and the level of happiness using geo-tagged Twitter data, census data and geospatial data on one of the shrinking cities in the United States—Detroit. The authors collected username, text, geo-coordinates and used the Complete Automation Probability (CAP) technique to filter out bot-involved tweets. Cluster and hotspot analyses were performed to study the spatial distribution of sentiments, LDA was implemented for topic modelling, and the AFINN lexicon dictionary555https://pypi.org/project/afinn/ was used for computing sentiments of tweets. Their results reported that areas with less crime tend to be happier and suggested that areas with negative sentiments should be prioritized for regeneration efforts.
An illustrative summary of methodologies discussed in this thematic area is given in Figure 5.
3.2. Disaster
People disseminate situational information before, during, and after natural/human-made disasters and hazards such as earthquakes, floods, cyclones, fires, terrorist attacks, and nuclear explosions. Researchers have used such socially generated data for enhancement of situation awareness and prediction and rapid assessment of disasters with a common purpose to facilitate law enforcement agencies and humanitarian bodies to get firsthand knowledge about an ongoing situation. Table 3 provides an overview of the literature in this theme.
3.2.1. Identifying relevant data
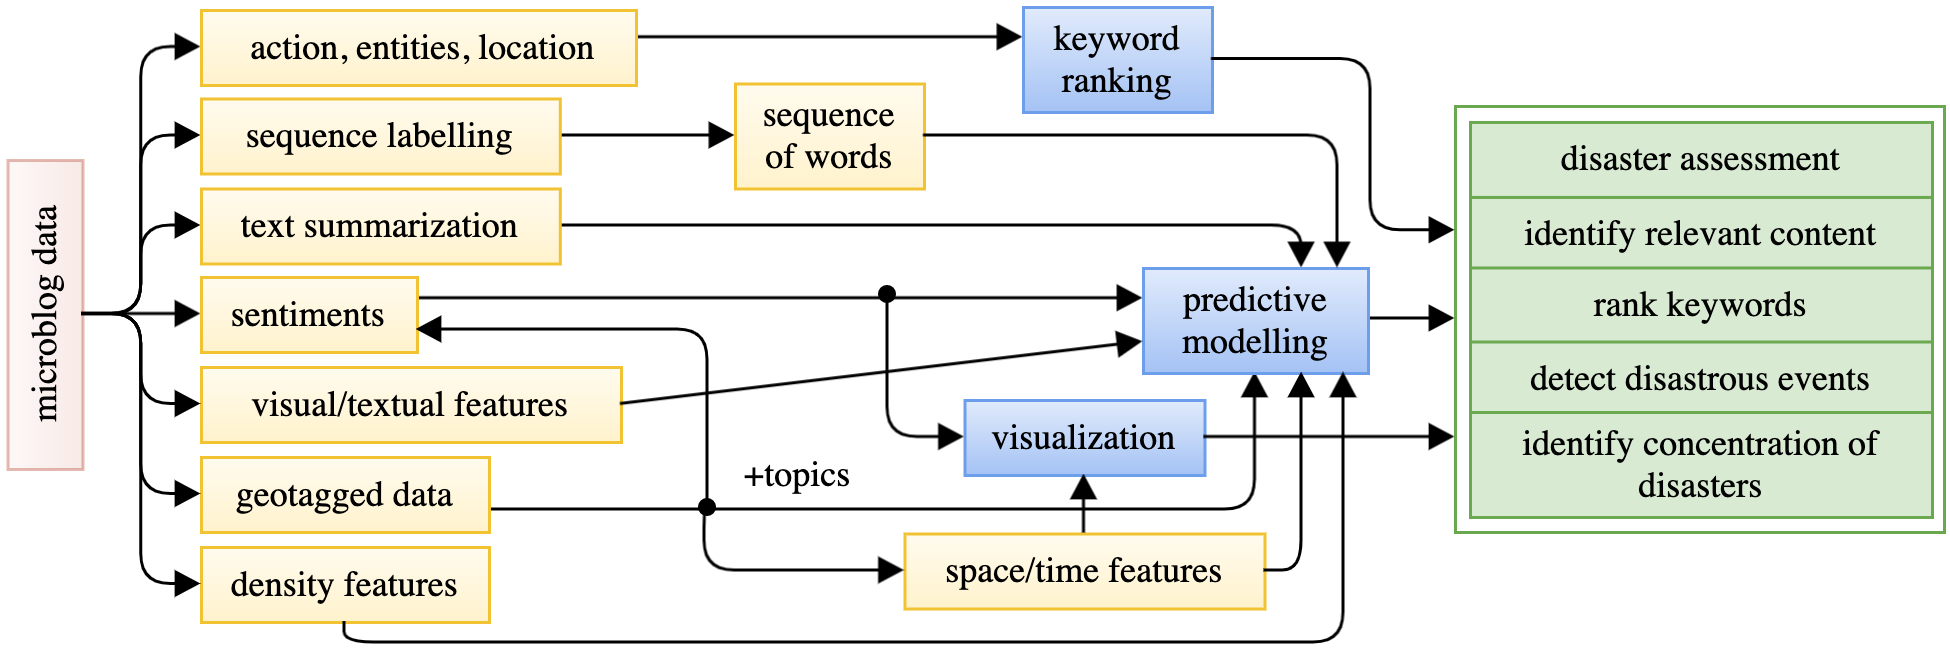
Imran et al. (Imran et al., 2013b) applied a classification-extraction approach, also presented in their previous work (Imran et al., 2013a), for extracting informative tweets. The authors implemented a sequence labelling algorithm to tokenize tweets to form a sequence of word tokens and assign labels based on classification requirements. The study intended to detect informative tweets and distinguish those tweets as reported by direct eyewitnesses or simply the repetitive blocks of earlier reported situations. The classification task was validated against tweets labelled by volunteers to show that their approach could extract 40-80% of informative tweets.
A keyword relevance scoring approach was developed by Joseph et al. (Joseph et al., 2014) for identifying and ranking keywords that might assist in finding tweets that describe a situation. The authors used reports generated on Ushahidi, a crowd-sourced platform, to identify keywords associated with actions, entities and location aspects of a disaster. The relevance of each keyword was computed based on its frequency in Ushahidi reports and its use in other contexts besides disaster.
A real-time multi-level damage assessment model was proposed by Shan et al. (Shan et al., 2019). In the first level, dictionaries specific to physical damage and sentiments were constructed. LDA was used on infrastructure, industry, people, etc., related documents retrieved from the Baidu search engine. In the second level, the situation (what), time (when) and entity (who) information gathered from Weibo posts were summarized and the physical dictionary was used for assessing the level of physical damages, and the sentiment dictionary for assessing emotional damage. In the third level, a semantic web was created to extract semantic patterns by analyzing prominent “noun” based nodes such as building, factory, etc. Similarly, Karami et al. (Karami et al., 2020) proposed a Twitter data analysis framework, TwiSA, that implements lexicon-based sentiment analysis and LDA-based temporal topic discovery. The framework concentrates on text analysis for extracting situational information to support the preparedness, response and recovery phases of the disaster management cycle.
A two-stage classification model was proposed by Rizk et al. (Rizk et al., 2019) for identifying tweets that report damages to either human-made structures or the natural environment. First, visual features and semantic features were extracted independently from tweets. The extracted features were then passed onto the next stage of classifiers for the final classification. SVM, Ensemble-based and ANN models were trained on a disaster tweets corpus and a scene dataset. A domain-specific dense BoW model was generated for building semantic descriptors. The authors reported that the addition of semantic features alongside low-level visual features improved classification performance.
Zahra et al. (Zahra et al., 2020) trained multiple classifiers for four different disasters—floods, hurricanes, earthquakes, and wildfires—using crowd-sourced labelled data to classify disaster specific tweets into three categories: eyewitness, non-eyewitness, and don’t know. The authors used different combinations of textual features and domain-expert selected features. The study reported that perceptual senses are usually found in tweets created by direct eyewitnesses, whereas emotions and prayer specific terms are found in tweets from indirect eyewitnesses.
Similarly, Alam et al. (Alam et al., 2018) performed a textual content analysis on Twitter data collected during three hurricanes—Harvey, Irma, and Maria. The study involved understanding humanitarian needs by using RF classifiers, learning the concerns of affected population through sentiment using Stanford’s sentiment analysis classifier666https://nlp.stanford.edu/sentiment/, tracking incidents by implementing LDA for topic-modelling, and identifying notable entities through name entity recognition. The authors also performed a multimedia analysis using a TL-based deep image recognition model to identify the relevance of images to disastrous events.
| Direction | Year | Study | Primary Dataset | Geo Scope | Tasks | Best outcome |
| Identifying relevant data | 2013 | (Imran et al., 2013b) | 346k tweets | JoplinT, SandyH | Cf, SeqLbl | Accuracy: 80–90% |
| 2014 | (Joseph et al., 2014) | 1k Ushahidi reports, 90M tweets | Haiti | AdSt | Qual. disc. presented | |
| 2018 | (Alam et al., 2018) | 9M tweets, 191k images | HarveyH, IrmaH, MariaH | Cf, NER, TpMd | Accuracy: 76–90% | |
| 2019 | (Rizk et al., 2019) | 1.34k tweets | Nepal, Chile, Japan, Kenya | Cf, LLVFE, SemExt | Accuracy: 92.43% | |
| 2019 | (Shan et al., 2019) | 67k Weibo posts | China | SmEx, TpMd | 5/8 close predictions | |
| 2020 | (Zahra et al., 2020) | 20M tweets | Global | Cf | F-measure: 0.69–0.95 | |
| 2020 | (Karami et al., 2020) | 1M tweets | South Carolina | SnAn, TpMd | Qual. disc. presented | |
| Mining systems | 2012 | (Sakaki et al., 2012) | 597 tweets | Japan | Cf, SemExt, SnAn | F-measure: 0.73 |
| 2014 | (Imran et al., 2014) | 200 tweets | Global | Cf | AUC: 80% | |
| 2014 | (Ilyas, 2014) | 700–850 images | Global | Cf | AUC: 78% | |
| 2014 | (Ashktorab et al., 2014) | 17M tweets | North America | Cf, Clu | AUC: 88% | |
| Assessment of disasters | 2016 | (Kryvasheyeu et al., 2016) | 52.5M | SandyH | AdSt, SnAn | Stat. analysis presented |
| 2017 | (Neppalli et al., 2017) | 12.9M tweets | SandyH | Cf, SnAn | Accuracy: 75.91% | |
| 2018 | (Resch et al., 2018) | 1.5k tweets (subset) | California | TpMd | Fleiss kappa score: 0.886 | |
| 2018 | (Wu and Cui, 2018) | 970k tweets | SandyH | AdSt, SnAn, TpMd | Corr. coef.: 0.989 | |
| 2019 | (Hernandez-Suarez et al., 2019) | 7.76k unique tweets | Mexico City | Cf, DnEs | Avg. F-measure: 0.84 | |
| 2020 | (Zhai et al., 2020) | 39k geo tweets | FlorenceH | Cf, TpMd | Avg. Accuracy: 74.23 | |
| Benchmarking | 2016 | (Caragea et al., 2016) | 2.82k tweets | Global | Cf | Accuracy: 75.90–82.52% |
| 2017 | (Nguyen et al., 2017) | 21k tweets | Global | Cf | AUC: 81.21–94.17% | |
| 2018 | (Ragini et al., 2018) | 70k tweets | India, Pakistan | Cf | F-measure: 0.72–0.94 | |
| 2020 | (Ruz et al., 2020) | 2.18k/60k tweets | Chile, Catalonia | Cf | Accuracy: 81.2–85.8% |
Trepresents tornado.Hrepresents hurricane.
3.2.2. Mining Systems
Imran et al. (Imran et al., 2014) presented a data mining platform, Artificial Intelligence for Disaster Response (AIDR), for the automatic classification of crisis-specific Twitter data into categories related to community needs, loss of lives and damages. The platform utilizes three core components: a collector for retrieving tweets, a tagger for classification of tweets, and a trainer for training the classifier present in the tagger component. The platform automatically collects tweets created during humanitarian crises and trains on a sample of labelled data. A similar classification platform with an SVM classifier, MicroFilters, was developed by Ilyas (Ilyas, 2014) for classifying images present in tweets. Tweedr (Ashktorab et al., 2014) is also a Twitter data mining tool that engages three operations in its data analysis pipeline: classification for classifying disaster specific tweets into categories such as damages and casualties, clustering for merging similar tweets and extraction for extracting words and phrases corresponding to damages and casualties.
Sakaki et al. (Sakaki et al., 2012) studied the real-time nature of tweets for event detection. The authors proposed an earthquake reporting system that analyzes disaster related tweets for detecting and estimating the location of earthquake events (spatial estimation). They built a probabilistic spatio-temporal model using features such as the essential keywords in a tweet, the number of words in a tweet, and the context of the words specific to an event.
3.2.3. Assessment of disasters
Resch et al. (Resch et al., 2018) presented an approach to combine semantic information extracted from tweets with spatial and temporal analysis to assess the affected areas and damages caused by natural disasters. The authors employed LDA for topic-modelling in two iterations—LDA was further applied to the results from the first iteration to identify granular topics. When validated against a manually annotated sample of tweets, their results showed that the affected areas and damages caused by disasters could be reliably identified by discovering similarities in spatial, temporal, and semantic details extracted from tweets.
Hierarchical multiscale analysis was conducted by Wu and Cui (Wu and Cui, 2018) to understand the role of socially generated data before, during and after a disaster and investigate if the joint use of such data alongside spatial information helps in disaster assessment. The authors used an opinion lexicon resource to compute sentiment polarity and performed hashtag and keyword frequency analysis for topic discovery. Results from the textual analysis were combined with spatio-temporal data to assess the damages done by Hurricane Sandy. The results showed the intensity of disaster-specific conversations originating from a region significantly correlating with the severity of damages.
Neppalli et al. (Neppalli et al., 2017) showed that the sentiment of a population changes based on its distance from a disaster. The authors used lexicon methods to compute the polarity of tweets. Next, they classified polar tweets as positive and negative using NB and SVM classifiers. The study concluded that the mapping of sentiments during a disaster could uncover more vital situation awareness. Similarly, Kryvasheyeu et al. (Kryvasheyeu et al., 2016) showed that the spatio-temporal analysis of Twitter data assists in the rapid assessment of disaster damage. The authors performed sentiment analysis on tweets created before, during and after Hurricane Sandy to examine if sentiment can be used as a predictor for assessing damages. The study showed negative sentiments correlating with damages and concluded that the proximity of the hurricane’s path was highly correlated with tweet activity.
In (Zhai et al., 2020), Zhai et al. categorized neighbourhoods based on poor and non-poor attributes and used geo-tagged tweets alongside socio-demographic data to understand disaster situation awareness from the perspective of neighbourhood equity. They implemented LDA to identify specific topics associated with each neighbourhood and trained an LR model for sentiment analysis. Their results showed that poor areas are more likely to share negative opinions, as people from those communities are more likely to have their work affected during disasters.
Hernandez-Suarez et al. (Hernandez-Suarez et al., 2019) used word vectors derived from a corpus of tweets to train a Bidirectional Long Short-Term Memory (biLSTM) network. They used a Conditional Random Field (CRF) output layer for improving classification accuracy. A toponym was formed based on labelled words and was geocoded and finally scored by a KDE function. The authors visualized the results on a map to identify concentration of disasters.
3.2.4. Benchmarking
Disaster specific tweets were analyzed by Ragini et al. (Ragini et al., 2018) to identify the best feature set for sentiment analysis using: (i) BoW + Parts of Speech (POS) tagging and (ii) bigram and trigram subjective phrases. The authors used multiple lexicon-based methods to extract subjective tweets, as such tweets contain the sentiments of people compared to objective ones. Their results showed that the combination of subjective phrases and ML models trained on bigram features performs best for disaster specific Twitter data.
The performance of Bayesian network classifiers was benchmarked by Ruz et al. (Ruz et al., 2020) against sentiment analysis on disaster specific tweets. The authors trained multiple learning models on tweets related to the Chilean earthquake and the Catalan independence referendum. Their results favoured SVM and RF models; however the tree augmented NB model was seen to produce competitive results, thus validating the applicability of Bayesian networks for analyzing sentiments of disaster-related tweets.
CNN models have been shown to outperform BoW models in the task of identifying informative messages from a stream of tweets during disastrous events. Caragea et al. (Caragea et al., 2016) used the BoW model as a feature representation for training multiple SVM and ANN models using various combinations of -grams. The results showed their CNN model outperforming all ANN and SVM models. The ANN model trained on unigrams and bigrams achieved the second-best accuracy; however, the margin was ¡2%. Similar results were obtained in another study (Nguyen et al., 2017), where CNN models outperformed non-neural network models.
An illustrative summary of methodologies discussed in this thematic area is given in Figure 6.
3.3. Finance
The stock markets, startups, and company-specific events are often discussed topics across social media. The discourse generated by financial communities on microblogs has been shown to correlate with stock options pricing, market movements, events’ popularity, stock returns, and sustainable startups and business models. Table 4 provides an overview of the literature in this theme.
| Direction | Year | Study | Primary Dataset | Geo Scope | Tasks | Best outcome |
| Stock market analysis | 2011 | (Bollen et al., 2011) | 9.85M tweets | United States | Reg, SnAn | Direction Accuracy: 86.7% |
| 2012 | (Zhang et al., 2012) | 3.8M retweets | United States | Reg, SnAn | Retweets are predictive of market movements | |
| 2015 | (Liu et al., 2015) | Twitter metrics of firms | United States | AdSt, Clu | Twitter metrics predict stocks comovement | |
| 2016 | (Corea, 2016) | 160k tweets | Global | Reg, SnAn | Tweets’ volume is an essential feature for financial forecasting models. | |
| 2016 | (Zhang et al., 2016) | 50M tweets | Global | Reg, SnAn | Happiness sentiments can Granger-cause the changes in index return | |
| 2016 | (Wei et al., 2016) | 3.28k Twitter volume spikes | United States | AdSt | Volume spikes correlate with stock pricing when price change is extreme | |
| 2017 | (López-Cabarcos et al., 2017) | 133k tweets | United States | Reg, SnAn | Goodness-of-fit: 0.9776 | |
| 2017 | (You et al., 2017) | Daily happiness index | Global | Reg, SnAn | Investors’ sentiment correlate to stock returns | |
| 2018 | (Nisar and Yeung, 2018) | 60k tweets | United Kingdom | Reg, SnAn | Presence of correlation between public sentiment and investment behavior | |
| Company-specific analysis | 2017 | (Daniel et al., 2017) | 192k tweets | United States | Cf, SnAn | Case study specific results |
| 2017 | (Leitch and Sherif, 2017) | 17k tweets | United States | Reg, SnAn | Negative relationship between sentiment and stock return. | |
| 2019 | (Singh et al., 2019) | 53k tweets | India | TpMd, SnAn | Indian startup ecosystem is more inclined towards positive sentiments. | |
| 2019 | (Saura et al., 2019) | 35k tweets | Global | TpMd, SnAn | Qualitative results presented |
3.3.1. Stock market analysis
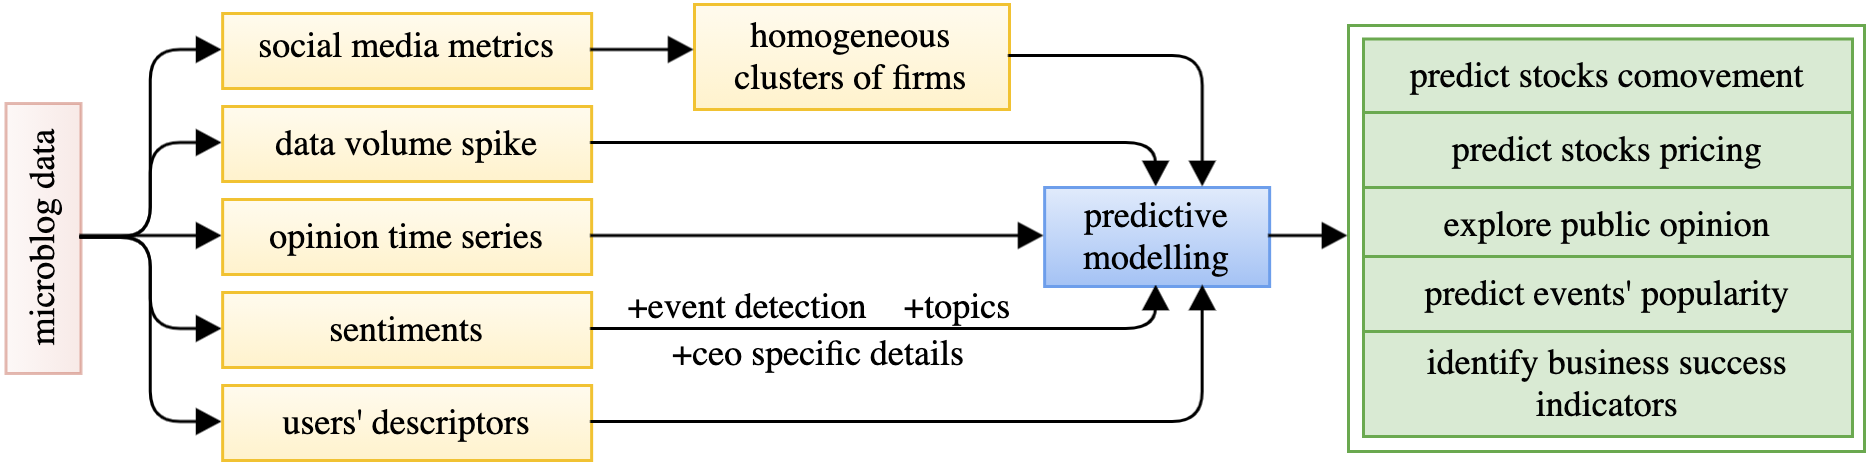
Liu et al. (Liu et al., 2015) proposed a model for predicting stock comovement based on social media metrics. The authors reported that firms with official Twitter accounts had higher comovement. After analyzing data from the NYSE and the NASDAQ stock exchanges, they concluded that Twitter metrics, such as the number of followers and number of tweets created, highly correlate with the comovement of stocks. Further, they created homogeneous groups of firms using -Means based on their Twitter metrics to show that they contribute to a better prediction of comovement than industry-specific label.
Wei et al. (Wei et al., 2016) investigated the relationship between Twitter content volume spikes and stock pricing. They considered a volume spike when the number of tweets in a day was greater than the average number of tweets in the last days. They used the relative value of the number of tweets and added thresholds against the number of unique users and their diversity to avoid false volume spikes. Their analysis revealed that the volume spikes correlate with stock pricing when the change in the price is extreme.
Bollen et al. (Bollen et al., 2011) extracted seven public mood time series from tweets to investigate if those mood descriptors are predictive of future stock values. The authors used Granger causality analysis to correlate the extracted mood time series with DJIA values. They reported that not all but some amongst the seven mood descriptors were Granger causative of the stock exchange’s values. Similarly, Zhang et al. (Zhang et al., 2012) tried to identify the relationship between Twitter data and financial market movement, such as gold price and stock market indicators. Six different opinion time series were extracted from a large-scale retweets dataset containing the following six keywords: ‘‘dollar’’, ‘‘gold’’, ‘‘$’’, ‘‘job’’, ‘‘economy’’ and ‘‘oil’’. The authors applied Granger causality analysis to the opinion time series versus financial market movement to show that the retweet information is correlated to and predictive of market movement.
Corea (Corea, 2016) analyzed Twitter data, concerning Apple, Facebook, and Google, to study if tweets can be considered representative of investors’ sentiments. The author implemented Stepwise Regression for finding the best set of variables. The results showed that how much the public talks about a stock is more valuable than what they think about it. The authors observed the volume of tweets had a positive correlation with the stock price. In a similar study by You et al. (You et al., 2017), investors’ sentiment showed to be a significant driving force on excess stock returns. Similarly, López-Cabarcos et al. (López-Cabarcos et al., 2017) analyzed Twitter data to understand the influence of technical and non-technical investors on the stock market. The authors designed logit and probit models using the predictors derived from Twitter profiles such as experience in investing, number of followers, holding period. The study showed that the opinions of non-technical investors had relevance with the market risk, while for the technical ones, their opinions were insignificant.
Zhang et al. (Zhang et al., 2016) extracted happiness indices from Twitter data for 11 international stock markets and compared it with index return. The results from their correlation regression model showed a positive influence of happiness sentiment on index return and opening/closing price of a trading session. Similarly, Nisar and Yeung (Nisar and Yeung, 2018) presented evidence of a correlation between public opinion and stock market price. The authors collected political-related tweets created before, during, and after the 2016 UK local elections and performed correlation and regression analysis on the sentiment of the tweets and the daily change in the price of FTSE 100. Their study showed promising results to support Twitter data as a medium for forecasting market price.
3.3.2. Company-specific analysis
Daniel et al. (Daniel et al., 2017) proposed a system to find event popularity through the sentiment of tweets concerning a company. Multiple public and a custom lexicon-based sentiment analyzers were used to compute sentiment scores. Event detection was done based on the peaks and drops observed in the average sentiment of the tweets. One of their case studies involving a Fortune 500 company showed people’s excitement during the launch of product A relatively higher than product B, where B was a minor upgrade to A.
Leitch and Sherif (Leitch and Sherif, 2017) designed regression models based on predictors such as public sentiment during the announcement of a new Chief Executive Officer (CEO), location of the company, number of employees and various features associated with the CEO, including gender, degree details, and experience, to study if Twitter sentiment yields any relationship with stock returns. Their results reported that the sentiment score had a significant negative correlation with stock returns, while the age of the CEO had a significant positive correlation. Features such as gender, experience and number of employees reported positive correlation but were statistically insignificant.
Singh et al. (Singh et al., 2019) used Twitter data to analyze the startup ecosystem in India. The authors collected tweets from 15 different startups across multiple industries and applied NB for sentiment analysis and LDA for topic modelling. They reported that the Indian startup ecosystem was inclined towards positive sentiments as the startups were more concerned about digital technologies, people, planet and profit. More specifically, startups in cities with the availability of resources, connectivity and a huge market base seemed to be finding it easy to do business. Similarly, Saura et al. (Saura et al., 2019) used SVM for sentiment analysis and LDA for topic modelling on tweets using hashtags related to startups to identify indicators for a successful startup business. Their study showed that the founders’ attitudes and methodologies were associated with positive sentiments. In contrast, frameworks, and programming languages were some of the factors inducing negative sentiments.
An illustrative summary of methodologies discussed in this thematic area is given in Figure 7.
3.4. Physical Environment
While considering microblog users as “environment monitoring sensors”, researchers have applied a wide range of analytical strategies that exploit microblog data to generate valuable insights concerning traffic patterns, conditions, and incidents, weather situations, outdoor air pollution, climate change, and global warming. Table 5 provides an overview of the literature in this theme.
3.4.1. Weather and Climate
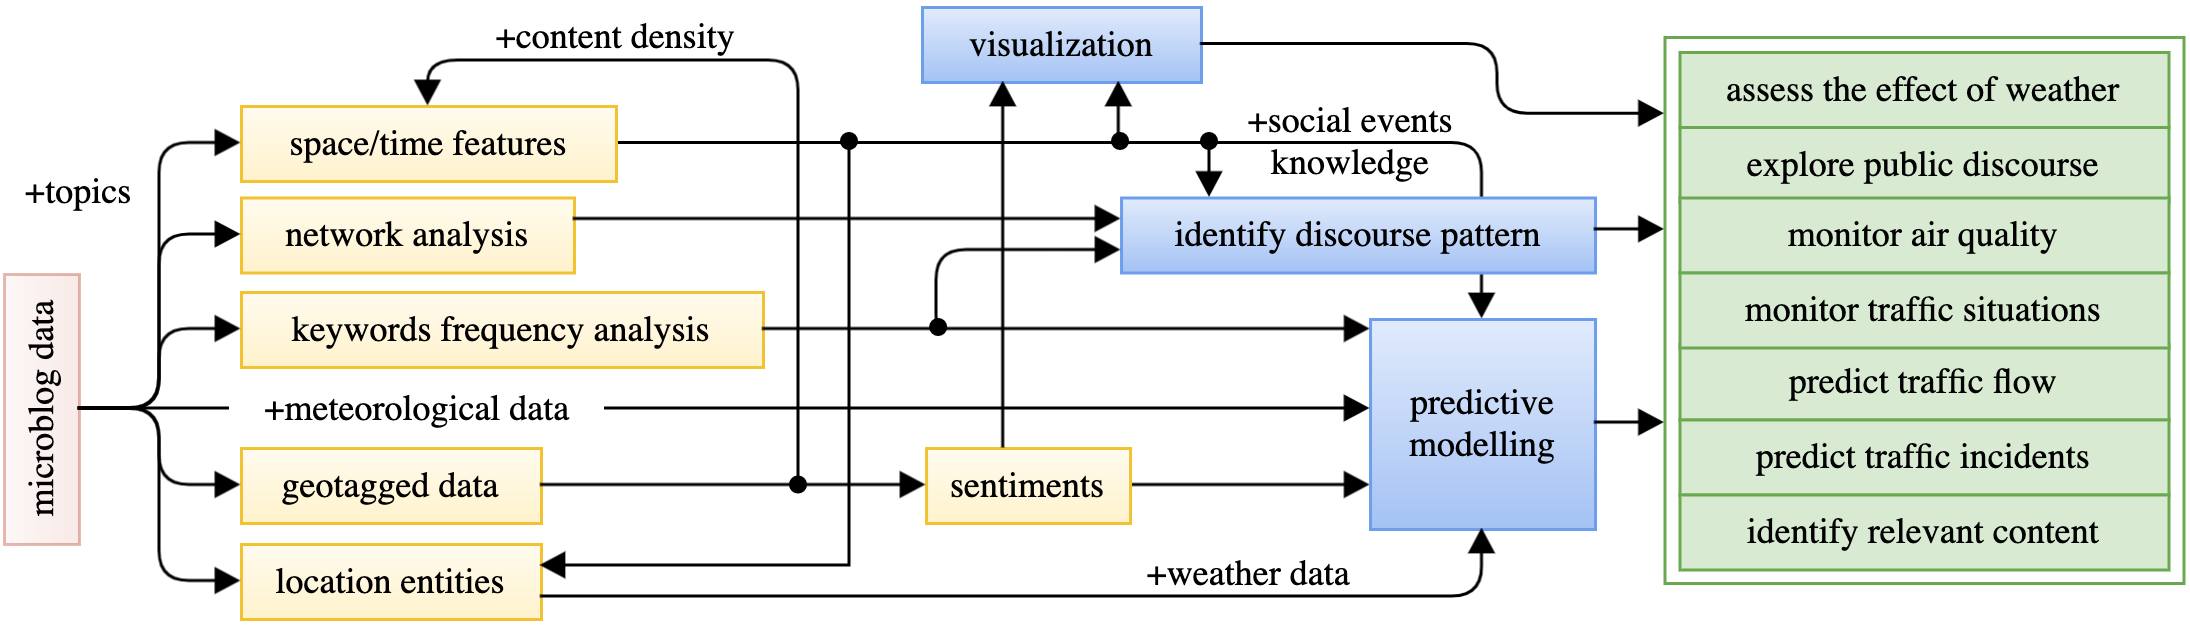
In (Giuffrida et al., 2020), Giuffrida et al. analyzed tweets containing weather-related keywords alongside meteorological data to show that Twitter can be regarded as an alternative data source for assessing the effect of weather on human outdoor perception. The authors trained an opinion-based classifier to classify tweets as relevant or irrelevant and further categorize the relevant ones into neutral, positive or negative. Tweets were next analyzed together with meteorological data to establish comfort ranges. The ranges identified through tweets analysis were found to be in good agreement with the ranges derived through questionnaires and interviews.
Kirilenko and Stepchenkova (Kirilenko and Stepchenkova, 2014) reported the US, UK, Canada, and Australia to have created more discourse related to climate change on Twitter than the rest of the world. The study performed spatio-temporal and network analyses to identify daily patterns of discourse, the significant events affecting the discourse, and the most influential media houses and Twitter users. In (Jang and Hart, 2015), Jang and Hart performed a content analysis on tweets related to climate change originating from the US, UK, Canada, and Australia between 2012–14. The authors constructed five representative frames, namely Real, Hoax, Cause, Impact, and Action, based on associated keywords to extract the relative prevalence of each frame, country-wise. The study summarised that hoaxes are common, and the Cause, Impact and Action-based Twitter discourse are comparatively lower in the US.
Chen et al. (Chen et al., 2019) analyzed similar climate change-related tweets to explore the temporal details of climate change discourse and identify Twitter users that deny the existence of climate change. The related English keywords were translated into 34 different languages, and the resulting set of keywords were used for filtering the tweets. A sample of 2k tweets was annotated to train an ANN model for classifying the users as deniers and non-deniers. Their exploratory analysis showed that the discussion about climate change is driven by extreme weather events and changes in policies.
3.4.2. Pollution
In (Hswen et al., 2019), Hswen et al. studied if Twitter data can be used for monitoring outdoor air pollution. The authors collected geo-tagged tweets (non-media) containing air pollution terms from Greater London and performed sentiment analysis on the tweets using VADER777https://github.com/cjhutto/vaderSentiment . Next, cross-correlation analysis was done to find relationships between sentiment trends and levels of PM2.5 (particles with diameter less than 2.5 micrometres). Their results showed a significant correlation between negative sentiment tweets and PM2.5 data, thereby hinting that Twitter users from a densely populated area can be treated as “social sensors” of PM2.5 levels.
Sachdeva and McCaffrey (Sachdeva and McCaffrey, 2018) studied the effectiveness of using Twitter data in ascertaining the impacts of wildfire events on air quality. The authors used structural topic model for topic modelling. Topics related to “smoke” were then identified for tagging tweets. Their spatio-temporal model used this tagged information for assessing the relationship between the frequency of smoke-related tweets with daily PM2.5 levels. Their results showed that the tweets relating to smoke were better predictors of air quality than tweets related to more generic wildfire discourse.
| Direction | Year | Study | Primary Dataset | Geo Scope | Tasks | Best outcome |
|---|---|---|---|---|---|---|
| Weather and climate analysis | 2014 | (Kirilenko and Stepchenkova, 2014) | 1.85M tweets | Global | SpTmMd, NetAn | Qual. disc. presented |
| 2015 | (Jang and Hart, 2015) | Rnd smp. of 500 tweets | Global | CoFqAn | Precision: 96% | |
| 2019 | (Chen et al., 2019) | 2k tweets | Global | WoVec, Cf | Accuracy: 88% | |
| 2020 | (Giuffrida et al., 2020) | 38k tweets | United States | SnAn | Class. Accuracy: 88% | |
| Pollution analysis | 2018 | (Sachdeva and McCaffrey, 2018) | 39k geo-tagged tweets | California | TpMd | Stat. analysis presented |
| 2019 | (Hswen et al., 2019) | 60k tweets | Greater London | SnAn, AdSt | Corr. coef.: 0.816 | |
| Road and traffic analysis | 2010 | (Carvalho et al., 2010) | 565k tweets | Portugal | Cf | F-measure: 0.96% |
| 2015 | (Wang et al., 2015) | 245k tweets | Chicago | SpTmMd, AdSt | Stat. analysis presented | |
| 2015 | (Gong et al., 2015) | System self-collects data | Melbourne | Clu | Qual. disc. presented | |
| 2015 | (Tejaswin et al., 2015) | 200 tweets | India | NER | F-measure: 0.918 | |
| 2015 | (D’Andrea et al., 2015) | 1.33k/999 tweets | Italy | Cf | F-measure: 0.957 | |
| 2016 | (Gu et al., 2016) | 10k/11k tweets | Pittsburgh, Philadelphia | Cf | F-measure: 0.95 | |
| 2017 | (Wang et al., 2017) | 9.70k tweets | United Kingdom | TpMd, Cf | Recall: ¿90% | |
| 2019 | (Dabiri and Heaslip, 2019) | 51k tweets | United States | WoVec, Cf | F-measure: 0.986 | |
| 2020 | (Essien et al., 2020) | 9k geo-tagged tweets | United Kingdom | Reg | MAE: 5.5 | |
| 2021 | (Yao and Qian, 2021) | 1.78M tweets | Pittsburgh | SnAn, Clu | Accuracy: |
3.4.3. Traffic
Tejaswin et al. (Tejaswin et al., 2015) designed an incident alert and mapping system by extracting location entities from tweets that describe traffic situations. To deal with the sparsity of data, the authors created multiple grids of the overall city area and grouped traffic incidents to generate statistics on historical data for extracting real-time insights. Predictors such as weather data, grid number and temporal detail were used for training an RF classifier for predicting traffic incidents.
Essien et al. (Essien et al., 2020) mined geo-tagged Twitter data together with traffic and weather information to study if such data can improve urban traffic flow prediction. The authors trained a biLSTM stacked autoencoder model and evaluated it on an urban road network in the UK. They prioritized the tweets created from the official Twitter accounts of road-traffic organizations to deal with authenticity and veracity issues. Their results showed that combining Twitter data with traffic, rainfall and temperature data assists in a design of a more accurate traffic flow prediction model.
Wang et al. (Wang et al., 2015) proposed a traffic congestion estimation framework by using information regarding traffic from Twitter. A frequent-pattern spatial and temporal analysis was done to identify the road networks that are more likely to have co-occurring congestions. Their estimation approach also considered social events within the city as supplementary information. The authors used the time and location of such events to model the impact on traffic in the nearby roads using a Gaussian distribution. Similarly, Yao and Qian (Yao and Qian, 2021) extracted sleep-wake status, local event details and traffic incidents as tweeting profiles and used the following generalizations to build a prediction framework for next morning commute congestion: (i) roads are congested the following morning if people sleep earlier, (ii) lower travel demand the following day if the earlier evening had social events. Their approach outperformed existing approaches that excluded Twitter data. In a similar study, Gong et al. (Gong et al., 2015) utilized created time and geocoordinates information extracted from tweet data dictionaries to identify a road as congested if multiple tweets share similar spatial and temporal attributes. The authors used a density-based clustering and assumed the presence of congestion if 4 or more tweets are created in 1 km stretch of road within a 15-minute time window.
Dabiri and Heaslip (Dabiri and Heaslip, 2019) proposed a traffic information system that processes a large volume of Twitter data and detects traffic events. The authors used word2vec and FastText for feature representation to train three deep learning architectures (CNN, LSTM and CNN+LSTM) to classify traffic-related information into three categories: traffic incident, traffic information and condition, and irrelevant. Their results showed the CNN model trained on word2vec outperforming all other models, including the SVM, RF, and MLP models proposed by Carvalho et al. (Carvalho et al., 2010), the NB, DT, and SVM models proposed by D’Andrea et al. (D’Andrea et al., 2015), and the semi-NB model proposed by Gu et al. (Gu et al., 2016).
Identifying relevant tweets amongst those created by official accounts of road administration offices and that mention road/street is simple compared to tweets created informally from drives, as such tweets are likely to have a significant amount of noise. To deal with this problem, Wang et al. (Wang et al., 2017) first filtered the tweets based on a set of automatically generated keywords and then applied LDA to achieve higher recall scores. Binormal separation and NB word weighting schemes were used to identify the top set of keywords.
An illustrative summary of methodologies discussed in this thematic area is given in Figure 8.
3.5. Politics
Researchers have analyzed microblog data to study the popularity of election candidates, predict election outcomes, understand voting intentions of a nation, detect emerging political topics, identify probable riot events, and understand human/bot communication patterns during disruptive events. Table 6 provides an overview of the literature in this theme.
3.5.1. Election Analysis
Twitter has been reported as an essential source of data for complementing traditional polls and surveys for political forecasting. In (Tumasjan et al., 2011), Tumasjan et al. performed sentiment analysis and generated multidimensional profiles of politicians using tweets related to the 2009 German Federal Election. Their results showed the tweets’ sentiments corresponding closely with voters’ political inclinations and the relative volume of party-specific tweets as a strong predictor of the federal election results. Bermingham and Smeaton (Bermingham and Smeaton, 2011) also showed the volume of tweets as a significant predictive variable in predicting election outcomes. In (Gaurav et al., 2013), Gaurav et al. reported that the volume-based approach in election prediction could be improved by also considering different aliases used for a candidate while constructing datasets for analysis.
Wang et al. (Wang et al., 2012b) designed a real-time tweets sentiment analysis system targeting the 2012 US Presidential Election. The authors used around 200 rules for filtering tweets related to the election campaign. A sample of relevant tweets was crowd-sourced for polarity labelling to train an NB classifier. Sentiment trend and volume of tweets associated with each candidate were aggregated for visualization on their dashboard. Similar sentiment-based approaches have also been used in forecasting the winners of the 2013 Pakistani Election, the 2014 Indian Election (Kagan et al., 2015), the 2015 UK General Election (Burnap et al., 2016), the 2016 Indian General State Elections (Sharma and Moh, 2016), and the 2017 French Presidential Election (Wang and Gan, 2017).
In (Yaqub et al., 2017), Yaqub et al. analyzed the 2016 US presidential election Twitter discourse to evaluate how well such data represent public opinion. The keywords ‘‘trump’’, ‘‘clinton’’, and ‘‘election2016’’ were used for pulling relevant tweets. The authors reported negative trends for both the candidates and quoted reports that termed the 2016 election as “the most negative campaign” to support their results. Their subsequent analysis showed that tweets containing only the keyword ‘‘trump’’ had a lower average negative score than the tweets associated to ‘‘clinton’’. A similar methodology was used in an earlier study by Ibrahim et al. (Ibrahim et al., 2015), where only the positive sentiment tweets were considered candidate-wise for predicting the winner of the 2014 Indonesian Presidential Election.
Song et al. (Song et al., 2014) analysed tweets related to the 2012 Korean Presidential Election to show Twitter as an essential medium for tracking topical trends. The authors performed temporal LDA for topic modelling and a term co-occurrence analysis for tracing chronologically co-occurring topics. They also implemented network analysis based on “user-mentions” to identify thematic connections among users. Rill et al. (Rill et al., 2014) designed a system for early detection of current and emerging political topics using Twitter. The authors considered Twitter hashtags as candidates for emerging topics by considering the temporal change in the number of tweets associated with each hashtag, i.e. comparing the current number of tweets associated with a hashtag to the number of tweets in the previous period . Their results showed that emerging topics on Twitter could be detected immediately after their occurrence, and these topics seemed to appear earlier on Twitter compared to Google Trends.
Paul et al. (Paul et al., 2017) designed SVM and LR classifiers for identifying political and non-political tweets and performed sentiment analysis on the political ones concerning their political alliances (Democratic or Republican). The authors used LDA and word2vec for extracting enriched keywords specific to politics and political alliances for labelling tweets. They trained unigram and unigram-bigram based models using SVM and LR. Sentiment Analysis was performed on tweets at the political affiliation level, for which the authors showed the FastText based model outperforming SVM, LR, NB and LSTM models.
Barberá (Barberá, 2015) used a Markov Chain Monte Carlo (MCMC) based method to estimate the political ideology of people by exploiting their “following” profiles on Twitter. The author used an NoU-Turn sampler and a random-walk Metropolis-Hastings algorithm for estimating the parameters (measure of popularity of ) and (measure of political interest of ) indexed by and respectively, where and relate to a sample of 10k -users that follow at least 10 -users. The proposed method distinguishes the political orientation of both political figures and ordinary citizens with their location on the ideological scale associated with “left-wing” and “right-wing” politics.
| Direction | Year | Study | Primary Dataset | Geo Scope | Tasks | Best outcome |
| Election Analysis | 2011 | (Tumasjan et al., 2011) | 100k tweets | Germany | SnAn, CoFqAn | MAE: 1.65% |
| 2011 | (Bermingham and Smeaton, 2011) | 7.2k tweets | Ireland | SnAn, CoFqAn, Reg | MAE: 3.67–5.85% | |
| 2012 | (Wang et al., 2012b) | 17k tweets | United States | SnAn, Cf | Accuracy: 59% | |
| 2013 | (Gaurav et al., 2013) | 62k tweets | Latin America | CoFqAn | Average RMS: ¡0.03 | |
| 2014 | (Song et al., 2014) | 1.73M tweets | South Korea | TpMd, NetAn | - | |
| 2014 | (Rill et al., 2014) | 4M tweets | Germany | CoFqAn, SnAn | Corr. coef.: 0.68 | |
| 2015 | (Barberá, 2015) | 759k Twitter users | United States | AdSt | Stat. analysis presented | |
| 2015 | (Ibrahim et al., 2015) | 10M tweets | Indonesia | SnAn | MAE: 0.61% | |
| 2015 | (Kagan et al., 2015) | 23M tweets | India, Pakistan | SnAn | Corr. coef.: 0.83–0.986 | |
| 2016 | (Sharma and Moh, 2016) | 42k tweets | India | SnAn | Accuracy: 78.4% | |
| 2016 | (Burnap et al., 2016) | 13.8M | United Kingdom | SnAn | Stat. analysis presented | |
| 2017 | (Yaqub et al., 2017) | 3.1M tweets | United States | SnAn | - | |
| 2017 | (Paul et al., 2017) | 2M geo tweets | United States | TpMd, SnAn, SpTmMd | F-measure: 0.930 | |
| 2017 | (Wang and Gan, 2017) | Not-specified | France | SnAn | 2% difference from fact | |
| Riots Analysis | 2017 | (Alsaedi et al., 2017) | 40M/1.6M tweets | England | NER, SnAn, Cf, Clu | F-measure: 85.43% |
| 2020 | (Kušen and Strembeck, 2020) | 4.5M tweets | Germany, United States, Catalonia | SnAn, NetAn | Stat. analysis presented |
3.5.2. Riots Analysis
Alsaedi et al. (Alsaedi et al., 2017) proposed an event detection framework for detecting probable disruptive events such as riots using Twitter. The framework utilizes an NB classifier to filter event-related tweets from non-event tweets. An online clustering algorithm then groups the extracted event-related tweets to identify potentially disruptive events based on spatial, temporal and textual features extracted from the tweets. The textual features list also included cosine similarity, sentiment polarity, mention ratio, hashtag ratio, and URL ratio. Next, a temporal TF-IDF is used for summarizing and representing the topics discussed in each cluster.
Kušen and Strembeck (Kušen and Strembeck, 2020) performed lexicon-based sentiment analysis on tweets using manually selected keywords and hashtags to identify the influence of bots during riot events. The authors used scores computed by Botometer888https://botometer.osome.iu.edu/ to distinguish if an account is a bot. They further constructed two types of directed communication networks, a human-accounts-only network and an all-accounts network, using the “mentions” information available in the tweets. Their findings showed that bot accounts were more involved in amplifying negative emotions to influence the overall sentiment of the discourse. The bot accounts were also noticed receiving significant social interactions from human accounts as the bot accounts seemed to be regarded as credible sources of information.
An illustrative summary of methodologies discussed in this thematic area is given in Figure 9.
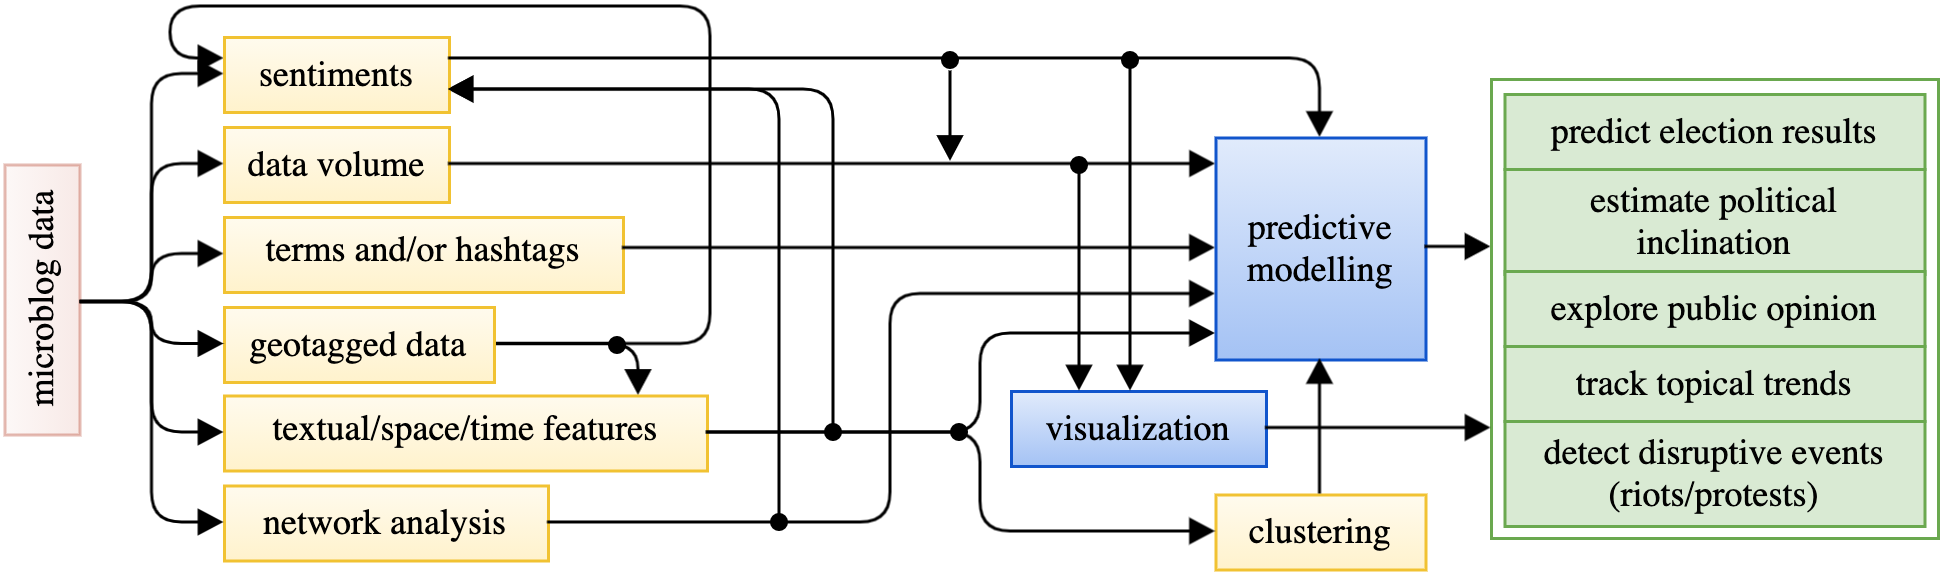
3.6. Health and Population
Public health-related microblog data concerning epidemics such as Influenza, Zika, Dengue, prescription drug abuse, and the coronavirus disease (COVID-19) pandemic has been used for predicting new case counts, extracting detailed insights of the illness/abuse, tracking the flow of conspiracy theories and misinformation. Table 7 provides an overview of the literature in this theme.
3.6.1. Epidemic Analysis
Based on flu related tweets collected between 2009 and 2010, Achrekar et al. (Achrekar et al., 2011) designed auto-regression models to show that the volume of tweets highly correlate with the number of influenza-like illness cases. Also, Masri et al. (Masri et al., 2019) used auto-regressive models on weekly Zika epidemic case counts and tweets for estimating the number of cases, on a weekly basis, one week in advance.
Aramaki et al. (Aramaki et al., 2011) trained an SVM classifier to identify true influenza tweets and used them as a predictor for influenza epidemics detection. Their method outperformed approaches that considered the use of overall volume of tweets or used Google trends data. Similarly, de Almeida Marques-Toledo et al. (de Almeida Marques-Toledo et al., 2017) tracked ‘‘Dengue’’, ‘‘aedes’’ and ‘‘aegypti’’ keywords to collect tweets and employed a classifier to identify tweets related to personal experience with Dengue. The authors used the total number of captured tweets and Dengue cases to design a generalized additive model. Their results showed that tweets have a strong potential to be an explanatory variable for Dengue estimation models.
Mamidi et al. (Mamidi et al., 2019) trained multiple word2vec and -gram-based LR, SVM and RF models for analyzing sentiments of tweets concerning Zika and further identified the main topics within the negative sentiment tweets to distinguish the significant concerns of the targeted population.
Twitter data has been observed as useful for providing insights into the prescription drug epidemic (Shutler et al., 2015). Phan et al. (Phan et al., 2017) collected tweets concerning well-known prescription and illegal drugs and trained SVM, DT, RF and NB classifiers to identify signals of drug abuse in the tweets. Their proposed drug abuse detection model could identify relationships between ‘‘Abuse’’ and ‘‘Fentanyl’’, ‘‘Addiction’’ and ‘‘Heroin’’, etc. Similarly, Katsuki et al. (Katsuki et al., 2015) studied the relationship between Twitter data and promotion of non-medical use of prescription medications (NUPM). The authors trained an SVM classifer on a sample of labelled data for identifying NUPM-relevant tweets. Their results showed a significant proportion of tweets promoting NUPM that actively marketed illegal sales of prescription drugs of abuse. A similar result was reported by Sarker et al. (Sarker et al., 2016), where NB, SVM, Maximum Entropy and DT classifiers were trained for identifying tweets containing signals of medication abuse.
| Direction | Year | Study | Primary Dataset | Geo Scope | Tasks | Best outcome |
|---|---|---|---|---|---|---|
| Epidemic Analysis | 2011 | (Achrekar et al., 2011) | 4.7M tweets | Global | CoFqAn, Reg | Corr. coef.: 0.9846 |
| 2011 | (Aramaki et al., 2011) | 0.4M tweets | Global | AdSt, CoFqAn, Cf | Corr. coef.: 0.89 | |
| 2015 | (Katsuki et al., 2015) | 2.4M tweets | United States | Cf | Accuracy: 93.5–95.1% | |
| 2016 | (Sarker et al., 2016) | 129k tweets | Global | Cf | Accuracy: 85% | |
| 2017 | (de Almeida Marques-Toledo et al., 2017) | 1.65M tweets | Brazil | CoFqAn, Cf, Reg | MRE: 0.345 | |
| 2017 | (Phan et al., 2017) | 31k tweets | United States | Cf | F-measure: 0.746 | |
| 2019 | (Mamidi et al., 2019) | 48k tweets | Zika affected regions | Cf, TpMd, WoVec | F-measure: 0.68 | |
| 2019 | (Masri et al., 2019) | Weekly basis tweets count | United States | Reg, SpTmMd | : 0.74 | |
| Pandemic Analysis | 2020 | (Chandrasekaran et al., 2020) | 13.9M tweets | Global | TpMd, SnAn | Stat. analysis presented |
| 2020 | (Abd-Alrazaq et al., 2020) | 167k tweets | Global | Cf, SnAn, TpMd | Stat. analysis presented | |
| 2020 | (Li et al., 2020) | 115k Weibo posts | Wuhan | CoFqAn, Reg | : 0.621 | |
| 2020 | (Shen et al., 2020) | 14.9M Weibo posts | China | Cf, CoFqAn | F1-measure: 0.880 | |
| 2020 | (Xue et al., 2020) | 1M tweets | Global | TpMd | Qual. disc. presented | |
| 2020 | (Ahmed et al., 2020) | 10k tweets, 6.55k users | United Kingdom | CoFqAn, NetAn | Stat. analysis presented | |
| 2021 | (Gerts et al., 2021) | 1.8M tweets | Global | Cf, SnAn, TpMd | F-measure: 0.857 | |
| 2021 | (Saleh et al., 2021) | 574k tweets | Global | SnAn | Stat. analysis presented |
3.6.2. Pandemic Analysis
Chandrasekaran et al. (Chandrasekaran et al., 2020) used LDA for discovering topics and VADER for exploring associated sentiments of COVID-19 related tweets. They reported that the average sentiment for topics such as growth and spread of cases, symptoms, racism and political impact was negative throughout the analysis period. In contrast, the sentiment was seen shifting towards positivity for government response, impact on the health system, economy, and treatment and recovery. Similarly, Abd-Alrazaq et al. (Abd-Alrazaq et al., 2020) performed topic-wise sentiment analysis using LDA and TextBlob999https://textblob.readthedocs.io/en/dev/ to show the presence of negative sentiment for deaths and racism-related topics.
Saleh et al. (Saleh et al., 2021) collected tweets containing #socialdistancing and #stayathome hashtags for identifying tweets specific to social distancing. They used TextBlob for sentiment and subjectivity analysis. Based on the dominance of positive and subjective tweets, the authors concluded that Twitter users supported the social distance measures. Xue et al. (Xue et al., 2020) collected family violence-related tweets by tracking keywords such as ‘‘family violence’’ and ‘‘child abuse’’, and performed topic modelling using LDA. They identified 9 different topical themes, including violence types, risk factors, victims, law enforcement responses, social awareness, etc. The study showed topic modelling as an essential technique for monitoring violence related situations through tweets.
Gerts et al. (Gerts et al., 2021) used an RF classifier for identifying tweets concerning COVID-19 conspiracy theories related to 5G technology, Bill & Melinda Gates Foundation, origin of the virus, and COVID-19 vaccines. They showed that a significant amount (¿40% except for the “vaccines”) of tweets were spreading misinformation. They used lexicon-based methods for sentiment analysis to report that negative sentiment is most prevalent in the tweets classified as misinformation. Similarly, Ahmed et al. (Ahmed et al., 2020) collected tweets concerning the 5G and COVID-19 conspiracy by tracking the #5GCoronavirus hashtag. The results from their network analysis hinted a lack of authorities in combating misinformation, and content analysis revealed a significant amount (34.8%) of tweets containing views that 5G and COVID-19 were linked.
The volume of socially generated data has been observed predictive of the number of COVID-19 cases. In (Li et al., 2020), Li et al. analyzed Chinese language Weibo posts originating from Wuhan and built a linear regression model to show a positive correlation between the number of Weibo posts and the daily cases of COVID-19 in Wuhan. Similarly, Shen et al. (Shen et al., 2020) designed an RF classifier for identifying Weibo posts that reported anything related to symptoms and diagnosis (“sick messages”) of COVID-19. The authors performed Granger causality test and observed that the number of “sick messages” could significantly predict the daily number of cases, 14 days in advance.
An illustrative summary of methodologies discussed in this thematic area is given in Figure 10.
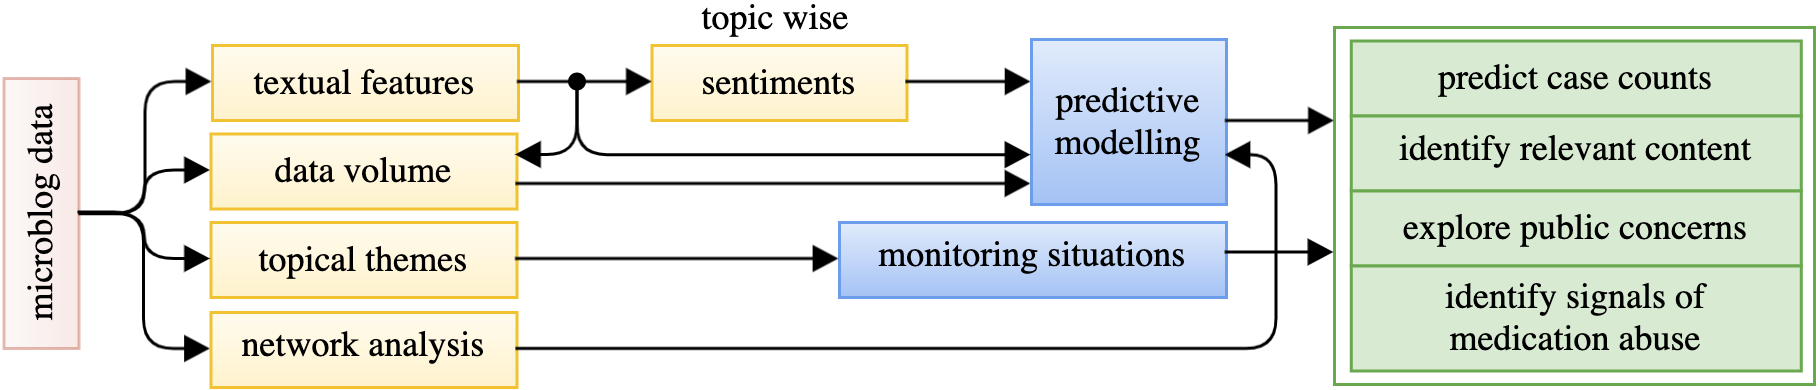
4. Revisiting the Literature
4.1. Data Corpus
Microblogs provide multiple API endpoints for accessing the public feed generated on their platforms. For instance, Twitter allows two API types for accessing its content: a search API for searching against a sample of tweets created in the past 7 days (standard version) (Lamsal, 2021), and a streaming API for accessing its real-time feed. Similarly, Weibo provides developers with a Timeline API for returning the latest Weibo posts and a search API, which is restricted to a set of approved developers, for searching historical Weibo posts (Weibo, 2021). Furthermore, microblogs typically provide endpoints associated with followers, friends, geo location, favorites, reshare, trends, etc.
In general, the literature employs two methods for curating data corpus. The first method involves using official API endpoints to collect near real-time microblog content, or search for historical content. The second method involves hydrating content identifiers to gather complete information. Second method is employed if a microblogging platform only allows sharing of identifiers, such as Twitter (Lamsal, 2020), where researchers are restricted in sharing data other than tweet identifiers (Lamsal, 2021).
4.2. The Deep Learning Trend
During the survey, we observed that almost every study had its own set of data. Implementing the same methodology on different datasets generates mixed outcomes, so quantitatively comparing the outcomes of the surveyed papers is difficult to justify. However, the tasks implemented by the surveyed papers concentrate on the textual and multimedia context of microblog data; therefore, the advancements in NLP and Computer Vision undeniably expand the boundary of microblog analytics. The ongoing radical improvements in hardware have revolutionized the deep learning sphere. Deep models seem to consistently achieve state-of-the-art outcomes in various tasks, including text classification (Yang et al., 2019), sentiment analysis (Raffel et al., 2019; Jiang et al., 2019), short text clustering (Zhang et al., 2021), image classification (Dai et al., 2021; Zhai et al., 2021), text summarization (Aghajanyan et al., 2020), and name entity recognition (Yu et al., 2020; Yamada et al., 2020).
In recent times, deep learning models have become the “go-to” methods for supervised and unsupervised tasks involving numerical data, categorical data, time-series data, and text/image data. It is evident from the survey that there is a surge in the use of deep models after 2016. In this part, we revisit the literature with additional studies that employed different deep learning architectures for analyzing microblog data. The revisit includes only the studies published in 2019 or later. Kang and Kang (Kang and Kang, 2017) used a deep neural network for predicting crime occurrences, Han et al. (Han et al., 2018) proposed a distributed deep anti-money laundering model, and Wei et al. (Wei et al., 2017) built a CNN-LSTM model for hate speech detection. Neppalli et al. (Neppalli et al., 2018) developed a CNN model for identifying informative disaster specific tweets, Ray Chowdhury et al. (Ray Chowdhury et al., 2019) presented a biLSTM model for keyphrase extraction, Kumar and Singh (Kumar and Singh, 2019) used a CNN model for extracting location names from tweets created during emergencies, and Lamsal and Kumar (Lamsal and Kumar, 2021) trained word2vec-based RNN models for disaster response. For analyzing stock markets, Xu and Cohen (Xu and Cohen, 2018) developed a deep generative model, Khan et al. (Khan et al., 2020) worked on an MLP and Shi et al. (Shi et al., 2018) proposed a text-based deep model.
Similarly, Zhai and Cheng (Zhai and Cheng, 2020) proposed an LSTM model for predicting air quality using Weibo posts, Ali et al. (Ali et al., 2021) designed a biLSTM model for traffic accident detection using Twitter and Facebook. Beskow et al. (Beskow et al., 2020) designed an LSTM-CNN model for detecting and characterizing political memes, and Ertugrul et al. (Ertugrul et al., 2019) developed an LSTM model for predicting future protests. Șerban et al. (Șerban et al., 2019) used a CNN-FastText model for detecting events and tracking disease outbreaks.
Furthermore, neural topic models (Wang et al., 2020a; Wang and Yang, 2020) have been proposed as opposed to mathematically arduous traditional methods such as LDA. Also, there are graph-based neural models (Zhou et al., 2020) that aim to infer topological relationships from message passing between nodes. These neural models have been explored across various domains, including Few-shot Image Classification, Text Classification, Sequence Labelling, Semantic Extraction, Event Extraction, Fact Verification (Zhou et al., 2020). In general, graph representation learning methods have applications across multiple areas: unsupervised—graph reconstruction (compress graphs into low-dimensional vectors), link prediction (predicting friendship in social networks), clustering (discovering communities), visualization (qualitative understanding of graph properties); supervised—node classification (predict node labels), graph classification (predict graph labels) (Chami et al., 2020).
4.3. A Commentative Revisit
In this section, we carry out a commentative revisit to the six “thematic” areas.
Crimes. Previous studies have utilized microblog conversations for predicting future crimes, analyzing crime rates, and studying the correlation between masses of people at different venues and the occurrence of real crimes at those venues. Some studies implement the “grid” strategy for identifying crime hot spots; changing the scale and shape of those grids can produce different results—trade a “hot spot” as a “neutral spot”—thus leading to inefficient spatial assignments of resources. Crimes such as murders and vandalisms are organized in nature, and conversations relating to them are not reflected online. Therefore, except for such crimes, researchers have confirmed the contribution of microblog data to a better understanding of future crime scenarios and also have reinforced crime-related microblog contents as “social crime sensors”. However, the literature in this thematic area appears North America-centered; contributions from other parts of the world seem required.
Disasters. Disaster-specific microblog conversations have been used for enhancement of situational awareness and prediction and assessment of disasters such as hurricanes, earthquakes, floods, cyclones, etc. The literature in this area has contributions from researchers globally and has the most comprehensive collections of datasets101010https://crisisnlp.qcri.org/ related to disasters and crisis events. The continuing research in this area has led to the design of the-state-of-the-art social media messages mining system, AIDR, that analyzes Twitter conversations created during humanitarian crises for disaster relief. The science behind the system has been detailed over a stack of research papers111111https://github.com/qcri-social/AIDR/wiki/The-science-behind-AIDR published through 2013, depicting the progress in the area over the years. This thematic area, however, has an unexplored avenue of research—the application of data mining on romanized scripts.
Finance. The literature in this thematic area confirms the relationship between the conversation generated by financial communities on microblogging platforms with stock pricing, market movements, and sustainable business models. The majority of the studies in this area seem to be focused on time-series analysis, with the Granger-causality test, due to its computational simplicity, continuing as the most favored method for causality analysis. Concerning the stock market analysis, the literature is focused majorly on the US-based stock indexes such as NYSE, NASDAQ, and DJIA. The existing methodologies proposed for these indexes are yet to be verified for their generality to other countries’ stock indexes. Also, the current state of research seems to be incorporating only a few variables out of many possible economic variables such as supply and demand, company’s state (revenue, debt, an influx of investor capital, etc.), investors’ sentiment, central bank’s policy on interest rates, politics, current events (protests, civil war, etc.), and foreign exchange.
Physical Environment. Earlier studies have ascertained microblog users as “environment monitoring sensors”; their generated online conversations have been observed valuable in producing insights associated with traffic incidents/patterns/conditions, weather situations, air quality, and climate change. Physical monitoring systems cover only certain regions; however, bringing-in online conversations into the picture for extrapolation can yield fine-grained details for areas that are outside the reach of the existing monitoring systems. Next-generation systems should focus on adding new types of cross-domain data relevant to population activities. This research area, especially the traffic-related applications, considering conversations from roads are usually minimal, require designing an efficient geocoder for identifying the near-accurate geographical locations (e.g., road segments) of the origin of non-geotagged conversations.
Politics. Politics-based microblog conversations have been used across studies for studying the popularity of election nominees, predicting election outcomes, discovering political topics, and understanding communication patterns of bots and humans during riots/protests. Such analyses get majorly influenced by rumors, spam, and misinformation. While these kinds of conversations are an issue across all thematic areas, the wave of misinformation content when targeted to the voters can fuel conspiracy theories that could impact the election outcome. Therefore, the early detection of such content, the analysis of the distinctive characteristics of those content, and the study of how they propagate should be the major concerns of future studies.
Health and Population. The literature in this area discusses the use of public-health-related microblog conversations in predicting new epidemic/pandemic cases, extracting detailed insights regarding an illness or abuse, and tracking conspiracy theories and misinformation trails related to COVID-19. Studies performing early forecasts of new cases or the trend rely majorly on the volume of conversations at different levels—tweet count, sentiment-based count, a specific theme-based count. The issue with the “volume” feature is its reliability; methods based on this feature are highly likely to generate biased forecasts during an avalanche of auto-generated conversations. Granular-level latent topic-based models can address this issue to some extent. The literature suggests that although the conversational models show the applicability of online conversations as an indicator of epidemic/pandemic activity, such models should be considered a supplement but not a substitute for epidemiological models. Researchers globally are applying a wide range of analyses on publicly available COVID-19 discourse. Currently, the primary concerns of researchers in the Crisis Computing domain is to make early forecasts of possible cases while incorporating social media variables into the forecasting models, identify the needs of a region through discourse mining, and study the propagation of misinformation concerning the disease and its vaccines, such that the proposed methodologies can be generalized to future epidemic/pandemic outbreaks.
Apart from the ones discussed above, there are a few more challenges and avenues for future research that are common across all “thematic” areas; we briefly outline them below:
(a) Inadequate context and Data rate limitations. Microblog data is easily misinterpreted, especially when context is unavailable. Inferences can be inaccurate due to biases in microblogger demographics towards younger and tech-savoy users, regional/local users being undistinguished from tourists/travellers, private posts being unavailable, and lack of multi-lingual processing. Freely available microblog data is usually rate limited by the service providers, e.g. a few percent of the total available data, or a few million microblogs per day. Broad queries, and techniques like real-time query expansion, can easily saturate these limits leading to ¡100% recall. Precise queries, targeting specific information, are therefore important.
(b) Ground truth and Multiple data sources. Establishing ground truth, to evaluate the effectiveness of a given approach, can be problematic and/or involve an expensive and time-intensive process of labelling data, typically through crowd-sourcing or citizen science. Labelled data may not be available in real-time as a situation unfolds nor in all required languages. Weak supervision (Zhou, 2018) is an emerging direction to address this. It is increasingly important to complement microblog data with information received from native sensors and also include data from Google Trends, web-references, Reddit (Manikonda et al., 2018), cellular communications (SMS) (Meier, 2010), government agencies.
(c) Knowledge transfer and generalization. There is a significant trend towards language-independent nonexclusive models for homogeneous events. E.g. a classification model designed for the 2015 Nepal Earthquake should be effective at analyzing other earthquake events.
(d) Adversaries and fake information. Systems that process public information can be vulnerable to adversaries who attack the system by posting fabricated microblog data specifically to manipulate the outcomes. The increasing deluge of fake information is a serious problem, and detection and resolution of adversaries is an important research direction (Kumar and Shah, 2018; Zubiaga et al., 2018).
(e) Geo obfuscation/privacy. Precise geo coordinates are extremely valuable for situation awareness, but at the same time microbloggers are placing increased importance on their individual privacy. This leads to omissions and/or obfuscation of geo information; today ¡1% of tweets are geotagged (Lamsal, 2021). Use of bounding boxes and toponyms to enhance geo information needs to be balanced with individuals’ privacy.
(f) Geo-political issues. Many governments are showing an increasing concern over the vulnerability of their citizens and furthermore their national interests, when significant portions of their citizen population are subjected to high-level analysis of their social media activity; particularly when this is undertaken by companies and researchers in foreign countries.
5. Conclusion
AI techniques for processing microblog social media data have become a significant research direction with applications over all areas of life. In this survey we have shown the seminal work and state-of-the-art approaches, from research over the last decade, in six thematic areas that cover the majority of compelling applications today: Crime, Disasters, Finance, Physical Environment, Politics, and Health and Population. We provided a novel, integrated methodological perspective of this body of research, in terms of Perception, Comprehension and Visualization/Projection—the three stages of Situation Awareness. Our survey provides an understanding of how researchers collect, pre-process, and analyze microblog data, with emphasis on how text, image, and spatio-temporal data is utilized for modelling and analysis. We observed a surge of interest in deep learning methods for analyzing microblog data and we expect research efforts to continue strongly in this direction.
Incorporating knowledge from microblog social media data into the three stages of Situation Awareness is a challenging task to automate due a range of issues that we identified in this survey. Challenges stem not only from the intrinsic nature of the data, being largely raw and unstructured, but also from the fact that practical systems, having significant impact and visibility in society, inevitably become the target of cyber-attacks and information manipulation from adversarial third-parties—fake news and misinformation is surging activity that needs to be understood and overcome. As AI systems become more powerful and as social media data becomes more abundant and richer in semantics, we expect an increasing emphasis on the need of AI techniques to suppress the effect of a similarly increasingly intelligent adversarial response. Researchers must concurrently take into account privacy and security of individuals and requirements of governments and law makers, nationally and internationally.
Finally, prior to 2016, the microblog analytics domain was limited in terms of public datasets. However, at present, the number of datasets concerning disasters, protests, politics, propaganda, sports, climate change and health appears to be growing at an unprecedented pace121212https://catalog.docnow.io/ with many areas yet to be addressed. Twitter’s new academic endpoint has also enabled researchers to collect historical tweets at a level surpassing what has been available over the last decade. We hope that more researchers endeavor to curate interesting datasets to support continued research in this area.
References
- (1)
- Abbasi et al. (2014) Ahmed Abbasi, Donald Adjeroh, Mark Dredze, Michael J Paul, Fatemeh Mariam Zahedi, Huimin Zhao, Nitin Walia, Hemant Jain, Patrick Sanvanson, Reza Shaker, et al. 2014. Social media analytics for smart health. IEEE Intell. Syst. 29, 2 (2014), 60–80.
- Abbass et al. (2020) Zaheer Abbass, Zain Ali, Mubashir Ali, Bilal Akbar, and Ahsan Saleem. 2020. A Framework to Predict Social Crime through Twitter Tweets By Using Machine Learning. In Proceedings of ICSC. IEEE, 363–368.
- Abd-Alrazaq et al. (2020) Alaa Abd-Alrazaq, Dari Alhuwail, Mowafa Househ, Mounir Hamdi, and Zubair Shah. 2020. Top concerns of tweeters during the COVID-19 pandemic: infoveillance study. J. Med. Internet Res. 22, 4 (2020), e19016.
- Achrekar et al. (2011) Harshavardhan Achrekar, Avinash Gandhe, Ross Lazarus, Ssu-Hsin Yu, and Benyuan Liu. 2011. Predicting flu trends using twitter data. In Proceedings of INFOCOM Wksps. IEEE, 702–707.
- Aghababaei and Makrehchi (2016) Somayyeh Aghababaei and Masoud Makrehchi. 2016. Mining social media content for crime prediction. In Proceedings of WI. IEEE, 526–531.
- Aghababaei and Makrehchi (2018) Somayyeh Aghababaei and Masoud Makrehchi. 2018. Mining Twitter data for crime trend prediction. Intell. Data Anal. 22, 1 (2018), 117–141.
- Aghajanyan et al. (2020) Armen Aghajanyan, Akshat Shrivastava, Anchit Gupta, Naman Goyal, Luke Zettlemoyer, and Sonal Gupta. 2020. Better fine-tuning by reducing representational collapse. arXiv:2008.03156 (2020).
- Ahmed et al. (2010) Nesreen K Ahmed, Amir F Atiya, Neamat El Gayar, and Hisham El-Shishiny. 2010. An empirical comparison of machine learning models for time series forecasting. Econom. Rev. 29, 5-6 (2010), 594–621.
- Ahmed et al. (2020) Wasim Ahmed, Josep Vidal-Alaball, Joseph Downing, and Francesc López Seguí. 2020. COVID-19 and the 5G conspiracy theory: social network analysis of Twitter data. J. Med. Internet Res. 22, 5 (2020), e19458.
- Alam et al. (2018) Firoj Alam, Ferda Ofli, Muhammad Imran, and Michael Aupetit. 2018. A twitter tale of three hurricanes: Harvey, irma, and maria. arXiv:1805.05144 (2018).
- Ali et al. (2021) Farman Ali, Amjad Ali, Muhammad Imran, Rizwan Ali Naqvi, Muhammad Hameed Siddiqi, and Kyung-Sup Kwak. 2021. Traffic accident detection and condition analysis based on social networking data. Accid. Anal. Prev. 151 (2021), 105973.
- Alsaedi et al. (2017) Nasser Alsaedi, Pete Burnap, and Omer Rana. 2017. Can we predict a riot? Disruptive event detection using Twitter. ACM Trans. Internet Technol. 17, 2 (2017), 1–26.
- Aramaki et al. (2011) Eiji Aramaki, Sachiko Maskawa, and Mizuki Morita. 2011. Twitter catches the flu: detecting influenza epidemics using Twitter. In Proceedings of EMNLP. 1568–1576.
- Ashktorab et al. (2014) Zahra Ashktorab, Christopher Brown, Manojit Nandi, and Aron Culotta. 2014. Tweedr: Mining twitter to inform disaster response.. In Proceedings of ISCRAM. 269–272.
- Barberá (2015) Pablo Barberá. 2015. Birds of the same feather tweet together: Bayesian ideal point estimation using Twitter data. Polit. Anal. 23, 1 (2015), 76–91.
- Batrinca and Treleaven (2015) Bogdan Batrinca and Philip C Treleaven. 2015. Social media analytics: a survey of techniques, tools and platforms. AI Soc. 30, 1 (2015), 89–116.
- Bendler et al. (2014) Johannes Bendler, Tobias Brandt, Sebastian Wagner, and Dirk Neumann. 2014. Investigating crime-to-twitter relationships in urban environments-facilitating a virtual neighborhood watch. In Proceedings of ECIS.
- Bengio et al. (2013) Yoshua Bengio, Aaron Courville, and Pascal Vincent. 2013. Representation learning: A review and new perspectives. IEEE Trans. Pattern Anal. Mach. Intell. 35, 8 (2013), 1798–1828.
- Bermingham and Smeaton (2011) Adam Bermingham and Alan Smeaton. 2011. On using Twitter to monitor political sentiment and predict election results. In Proceedings of SAAIP. 2–10.
- Beskow et al. (2020) David M Beskow, Sumeet Kumar, and Kathleen M Carley. 2020. The evolution of political memes: Detecting and characterizing internet memes with multi-modal deep learning. Inf. Process. Manag. 57, 2 (2020), 102170.
- Bishop (2006) Christopher M Bishop. 2006. Pattern recognition and machine learning. Springer.
- Bojanowski et al. (2017) Piotr Bojanowski, Edouard Grave, Armand Joulin, and Tomas Mikolov. 2017. Enriching word vectors with subword information. Trans. Comput. Linguist. Assoc. Comput. Linguist. 5 (2017), 135–146.
- Bollen et al. (2011) Johan Bollen, Huina Mao, and Xiaojun Zeng. 2011. Twitter mood predicts the stock market. J. Comput. Sci. 2, 1 (2011), 1–8.
- Bollobás and Bollobas (1998) Béla Bollobás and Bela Bollobas. 1998. Modern graph theory. Vol. 184. Springer Science & Business Media.
- Brown et al. (1992) Peter F Brown, Vincent J Della Pietra, Peter V Desouza, Jennifer C Lai, and Robert L Mercer. 1992. Class-based n-gram models of natural language. Comput. Linguist. 18, 4 (1992), 467–480.
- Burnap et al. (2016) Pete Burnap, Rachel Gibson, Luke Sloan, Rosalynd Southern, and Matthew Williams. 2016. 140 characters to victory?: Using Twitter to predict the UK 2015 General Election. Elect. Stud. 41 (2016), 230–233.
- Caragea et al. (2016) Cornelia Caragea, Adrian Silvescu, and Andrea H Tapia. 2016. Identifying Informative Messages in Disasters using Convolutional Neural Networks.. In Proceedings of ISCRAM.
- Carvalho et al. (2010) Sara Carvalho, Luis Sarmento, and Rosaldo Rossetti J.F. 2010. Real-time sensing of traffic information in twitter messages. (2010).
- Chami et al. (2020) Ines Chami, Sami Abu-El-Haija, Bryan Perozzi, Christopher Ré, and Kevin Murphy. 2020. Machine learning on graphs: A model and comprehensive taxonomy. arXiv:2005.03675 (2020).
- Chandrasekaran et al. (2020) Ranganathan Chandrasekaran, Vikalp Mehta, Tejali Valkunde, and Evangelos Moustakas. 2020. Topics, Trends, and Sentiments of Tweets About the COVID-19 Pandemic: Temporal Infoveillance Study. J. Med. Internet Res. 22, 10 (2020), e22624.
- Chen et al. (2020) Ting Chen, Simon Kornblith, Mohammad Norouzi, and Geoffrey Hinton. 2020. A simple framework for contrastive learning of visual representations. In Proceedings of ICML. PMLR, 1597–1607.
- Chen et al. (2015) Xinyu Chen, Youngwoon Cho, and Suk Young Jang. 2015. Crime prediction using Twitter sentiment and weather. In Proceedings of SIEDS. IEEE, 63–68.
- Chen et al. (2019) Xingyu Chen, Lei Zou, and Bo Zhao. 2019. Detecting climate change deniers on twitter using a deep neural network. In Proceedings of ICMLC. 204–210.
- Corea (2016) Francesco Corea. 2016. Can twitter proxy the investors’ sentiment? The case for the technology sector. Big Data Res. 4 (2016), 70–74.
- Dabiri and Heaslip (2019) Sina Dabiri and Kevin Heaslip. 2019. Developing a Twitter-based traffic event detection model using deep learning architectures. Expert Syst. Appl. 118 (2019), 425–439.
- Dai et al. (2021) Zihang Dai, Hanxiao Liu, Quoc V Le, and Mingxing Tan. 2021. CoAtNet: Marrying Convolution and Attention for All Data Sizes. arXiv:2106.04803 (2021).
- D’Andrea et al. (2015) Eleonora D’Andrea, Pietro Ducange, Beatrice Lazzerini, and Francesco Marcelloni. 2015. Real-time detection of traffic from twitter stream analysis. IEEE trans. Intell. Transp. Syst. 16, 4 (2015), 2269–2283.
- Daniel et al. (2017) Mariana Daniel, Rui Ferreira Neves, and Nuno Horta. 2017. Company event popularity for financial markets using Twitter and sentiment analysis. Expert Syst. Appl. 71 (2017), 111–124.
- de Almeida Marques-Toledo et al. (2017) Cecilia de Almeida Marques-Toledo, Carolin Marlen Degener, Livia Vinhal, Giovanini Coelho, Wagner Meira, Claudia Torres Codeço, and Mauro Martins Teixeira. 2017. Dengue prediction by the web: Tweets are a useful tool for estimating and forecasting Dengue at country and city level. PLoS Negl. Trop. Dis. 11, 7 (2017), e0005729.
- Devlin et al. (2018) Jacob Devlin, Ming-Wei Chang, Kenton Lee, and Kristina Toutanova. 2018. Bert: Pre-training of deep bidirectional transformers for language understanding. arXiv:1810.04805 (2018).
- Dewing (2010) Michael Dewing. 2010. Social media: An introduction. Vol. 1. Library of Parliament Ottawa.
- Endsley (2000) Mica R Endsley. 2000. Theoretical Underpinnings of Situation Awareness: A Critical Review. Situation Awareness Analysis and Measurement (2000), 1.
- Ertugrul et al. (2019) Ali Mert Ertugrul, Yu-Ru Lin, Wen-Ting Chung, Muheng Yan, and Ang Li. 2019. Activism via attention: interpretable spatiotemporal learning to forecast protest activities. EPJ Data Sci. 8, 1 (2019), 1–26.
- Essien et al. (2020) Aniekan Essien, Ilias Petrounias, Pedro Sampaio, and Sandra Sampaio. 2020. A deep-learning model for urban traffic flow prediction with traffic events mined from twitter. World Wide Web (2020), 1–24.
- Gaurav et al. (2013) Manish Gaurav, Amit Srivastava, Anoop Kumar, and Scott Miller. 2013. Leveraging candidate popularity on Twitter to predict election outcome. In Proceedings of SNAKDD. 1–8.
- Gerber (2014) Matthew S Gerber. 2014. Predicting crime using Twitter and kernel density estimation. Decis. Support Syst. 61 (2014), 115–125.
- Gerts et al. (2021) Dax Gerts, Courtney D Shelley, Nidhi Parikh, Travis Pitts, Chrysm Watson Ross, Geoffrey Fairchild, Nidia Yadria Vaquera Chavez, and Ashlynn R Daughton. 2021. “Thought I’d Share First” and Other Conspiracy Theory Tweets from the COVID-19 Infodemic: Exploratory Study. JMIR Public Health Surveill. 7, 4 (2021), e26527.
- Giuffrida et al. (2020) Laura Giuffrida, Hanna Lokys, and Otto Klemm. 2020. Assessing the effect of weather on human outdoor perception using Twitter. Int. J. Biometeorol. 64, 2 (2020), 205–216.
- Gong et al. (2015) Yikai Gong, Fengmin Deng, and Richard O Sinnott. 2015. Identification of (near) Real-time Traffic Congestion in the Cities of Australia through Twitter. In Proceedings of UCUI. 7–12.
- Goodfellow et al. (2014) Ian Goodfellow, Jean Pouget-Abadie, Mehdi Mirza, Bing Xu, David Warde-Farley, Sherjil Ozair, Aaron Courville, and Yoshua Bengio. 2014. Generative adversarial nets. Proceedings of NIPS 27 (2014).
- Gu et al. (2016) Yiming Gu, Zhen Sean Qian, and Feng Chen. 2016. From Twitter to detector: Real-time traffic incident detection using social media data. Transp. Res. Part C Emerg. Technol. 67 (2016), 321–342.
- Hamilton et al. (2017) William L Hamilton, Rex Ying, and Jure Leskovec. 2017. Representation learning on graphs: Methods and applications. arXiv:1709.05584 (2017).
- Han et al. (2018) Jingguang Han, Utsab Barman, Jer Hayes, Jinhua Du, Edward Burgin, and Dadong Wan. 2018. Nextgen aml: Distributed deep learning based language technologies to augment anti money laundering investigation. In Proceedings ACL System Demonstrations. 37–42.
- He et al. (2016) Kaiming He, Xiangyu Zhang, Shaoqing Ren, and Jian Sun. 2016. Deep residual learning for image recognition. In Proceedings of CVPR. 770–778.
- Henaff (2020) Olivier Henaff. 2020. Data-efficient image recognition with contrastive predictive coding. In Proceedings of ICML. PMLR, 4182–4192.
- Hernandez-Suarez et al. (2019) Aldo Hernandez-Suarez, Gabriel Sanchez-Perez, Karina Toscano-Medina, Hector Perez-Meana, Jose Portillo-Portillo, Victor Sanchez, and Luis Javier García Villalba. 2019. Using Twitter data to monitor natural disaster social dynamics: A recurrent neural network approach with word embeddings and kernel density estimation. Sens. 19, 7 (2019), 1746.
- Holsapple et al. (2014) Clyde Holsapple, Shih-Hui Hsiao, and Ram Pakath. 2014. Business social media analytics: definition, benefits, and challenges. In Proceedings of AMCIS.
- Howard and Ruder (2018) Jeremy Howard and Sebastian Ruder. 2018. Universal language model fine-tuning for text classification. arXiv:1801.06146 (2018).
- Hswen et al. (2019) Yulin Hswen, Qiuyuan Qin, John S Brownstein, and Jared B Hawkins. 2019. Feasibility of using social media to monitor outdoor air pollution in London, England. Prev. Med. 121 (2019), 86–93.
- Ibrahim et al. (2015) Mochamad Ibrahim, Omar Abdillah, Alfan F Wicaksono, and Mirna Adriani. 2015. Buzzer detection and sentiment analysis for predicting presidential election results in a twitter nation. In Proceedings of ICDMW. IEEE, 1348–1353.
- Ilyas (2014) Andrew Ilyas. 2014. MicroFilters: Harnessing twitter for disaster management. In Proceedings of GHTC. IEEE, 417–424.
- Imran et al. (2015) Muhammad Imran, Carlos Castillo, Fernando Diaz, and Sarah Vieweg. 2015. Processing social media messages in mass emergency: A survey. ACM Comput. Surv. 47, 4 (2015), 1–38.
- Imran et al. (2014) Muhammad Imran, Carlos Castillo, Ji Lucas, Patrick Meier, and Sarah Vieweg. 2014. AIDR: Artificial intelligence for disaster response. In Proceedings of WWW. 159–162.
- Imran et al. (2013a) Muhammad Imran, Shady Elbassuoni, Carlos Castillo, Fernando Diaz, and Patrick Meier. 2013a. Extracting information nuggets from disaster-Related messages in social media.. In Proceedings of ISCRAM.
- Imran et al. (2013b) Muhammad Imran, Shady Elbassuoni, Carlos Castillo, Fernando Diaz, and Patrick Meier. 2013b. Practical extraction of disaster-relevant information from social media. In Proceedings of WWW. 1021–1024.
- Jang and Hart (2015) S Mo Jang and P Sol Hart. 2015. Polarized frames on “climate change” and “global warming” across countries and states: Evidence from Twitter big data. Glob. Environ. Change 32 (2015), 11–17.
- Jiang et al. (2019) Haoming Jiang, Pengcheng He, Weizhu Chen, Xiaodong Liu, Jianfeng Gao, and Tuo Zhao. 2019. Smart: Robust and efficient fine-tuning for pre-trained natural language models through principled regularized optimization. arXiv:1911.03437 (2019).
- Jing and Tian (2020) Longlong Jing and Yingli Tian. 2020. Self-supervised visual feature learning with deep neural networks: A survey. IEEE Trans. Pattern Anal. Mach. Intell. (2020).
- Joseph et al. (2014) Kenneth Joseph, Peter M Landwehr, and Kathleen M Carley. 2014. An approach to selecting keywords to track on twitter during a disaster.. In Proceedings of ISCRAM.
- Kagan et al. (2015) Vadim Kagan, Andrew Stevens, and VS Subrahmanian. 2015. Using twitter sentiment to forecast the 2013 pakistani election and the 2014 indian election. IEEE Intell. Syst. 30, 1 (2015), 2–5.
- Kang and Kang (2017) Hyeon-Woo Kang and Hang-Bong Kang. 2017. Prediction of crime occurrence from multi-modal data using deep learning. PloS One 12, 4 (2017), e0176244.
- Karami et al. (2020) Amir Karami, Vishal Shah, Reza Vaezi, and Amit Bansal. 2020. Twitter speaks: A case of national disaster situational awareness. J. Inf. Sci. 46, 3 (2020), 313–324.
- Katsuki et al. (2015) Takeo Katsuki, Tim Ken Mackey, and Raphael Cuomo. 2015. Establishing a link between prescription drug abuse and illicit online pharmacies: analysis of Twitter data. J. Med. Internet Res. 17, 12 (2015), e280.
- Khan et al. (2020) Wasiat Khan, Mustansar Ali Ghazanfar, Muhammad Awais Azam, Amin Karami, Khaled H Alyoubi, and Ahmed S Alfakeeh. 2020. Stock market prediction using machine learning classifiers and social media, news. J Ambient. Intell. Humaniz. Comput. (2020), 1–24.
- Kirilenko and Stepchenkova (2014) Andrei P Kirilenko and Svetlana O Stepchenkova. 2014. Public microblogging on climate change: One year of Twitter worldwide. Glob. Environ. Change 26 (2014), 171–182.
- Kononenko (2001) Igor Kononenko. 2001. Machine learning for medical diagnosis: history, state of the art and perspective. Artif. Intell. Med. 23, 1 (2001), 89–109.
- Kornblith et al. (2019) Simon Kornblith, Jonathon Shlens, and Quoc V Le. 2019. Do better imagenet models transfer better?. In Proceedings of CVPR. 2661–2671.
- Kryvasheyeu et al. (2016) Yury Kryvasheyeu, Haohui Chen, Nick Obradovich, Esteban Moro, Pascal Van Hentenryck, James Fowler, and Manuel Cebrian. 2016. Rapid assessment of disaster damage using social media activity. Sci. Adv. 2, 3 (2016), e1500779.
- Kumar and Singh (2019) Abhinav Kumar and Jyoti Prakash Singh. 2019. Location reference identification from tweets during emergencies: A deep learning approach. Int. J. Disaster Risk Reduct. 33 (2019), 365–375.
- Kumar and Shah (2018) Srijan Kumar and Neil Shah. 2018. False information on web and social media: A survey. arXiv:1804.08559 (2018).
- Kušen and Strembeck (2020) Ema Kušen and Mark Strembeck. 2020. You talkin’to me? Exploring human/bot communication patterns during riot events. Inf. Process. Manag. 57, 1 (2020), 102126.
- Lamsal (2020) Rabindra Lamsal. 2020. Coronavirus (COVID-19) Tweets Dataset.
- Lamsal (2021) Rabindra Lamsal. 2021. Design and analysis of a large-scale COVID-19 tweets dataset. Appl. Intell. 51, 5 (2021), 2790–2804.
- Lamsal and Kumar (2021) Rabindra Lamsal and TV Vijay Kumar. 2021. Twitter-Based Disaster Response Using Recurrent Nets. Int. J. Sociotechnology Knowl. Dev. 13, 3 (2021), 133–150.
- LeCun et al. (2015) Yann LeCun, Yoshua Bengio, and Geoffrey Hinton. 2015. Deep learning. Nature 521, 7553 (2015), 436–444.
- Leitch and Sherif (2017) Darren Leitch and Mohamed Sherif. 2017. Twitter mood, CEO succession announcements and stock returns. J. Comput. Sci. 21 (2017), 1–10.
- Li et al. (2020) Jiawei Li, Qing Xu, Raphael Cuomo, Vidya Purushothaman, and Tim Mackey. 2020. Data mining and content analysis of the Chinese social media platform Weibo during the early COVID-19 outbreak: retrospective observational infoveillance study. JMIR Public Health Surveill. 6, 2 (2020), e18700.
- Liu et al. (2015) Ling Liu, Jing Wu, Ping Li, and Qing Li. 2015. A social-media-based approach to predicting stock comovement. Expert Syst. Appl. 42, 8 (2015), 3893–3901.
- López-Cabarcos et al. (2017) M Ángeles López-Cabarcos, Juan Piñeiro-Chousa, and Ada María Pérez-Pico. 2017. The impact technical and non-technical investors have on the stock market: Evidence from the sentiment extracted from social networks. J. Behav. Exp. Finance 15 (2017), 15–20.
- Mamidi et al. (2019) Ravali Mamidi, Michele Miller, Tanvi Banerjee, William Romine, and Amit Sheth. 2019. Identifying key topics bearing negative sentiment on Twitter: insights concerning the 2015-2016 Zika epidemic. JMIR Public Health Surveill. 5, 2 (2019), e11036.
- Manikonda et al. (2018) Lydia Manikonda, Ghazaleh Beigi, Huan Liu, and Subbarao Kambhampati. 2018. Twitter for sparking a movement, reddit for sharing the moment:# metoo through the lens of social media. arXiv:1803.08022 (2018).
- Manning (2015) Christopher D Manning. 2015. Computational linguistics and deep learning. Comput. Linguist. 41, 4 (2015), 701–707.
- Masri et al. (2019) Shahir Masri, Jianfeng Jia, Chen Li, Guofa Zhou, Ming-Chieh Lee, Guiyun Yan, and Jun Wu. 2019. Use of Twitter data to improve Zika virus surveillance in the United States during the 2016 epidemic. BMC Public Health 19, 1 (2019), 1–14.
- Mayfield (2008) Antony Mayfield. 2008. What is social media. (2008).
- McCann et al. (2017) Bryan McCann, James Bradbury, Caiming Xiong, and Richard Socher. 2017. Learned in translation: Contextualized word vectors. arXiv:1708.00107 (2017).
- Meier (2010) Patrick Meier. 2010. The unprecedented role of SMS in disaster response: Learning from Haiti. SAIS Rev. Int. Aff. 30, 2 (2010), 91–103.
- Mikolov et al. (2013) Tomas Mikolov, Kai Chen, Greg Corrado, and Jeffrey Dean. 2013. Efficient estimation of word representations in vector space. arXiv:1301.3781 (2013).
- Nazer et al. (2017) Tahora H Nazer, Guoliang Xue, Yusheng Ji, and Huan Liu. 2017. Intelligent disaster response via social media analysis a survey. SIGKDD Explor. 19, 1 (2017), 46–59.
- Neppalli et al. (2018) Venkata Kishore Neppalli, Cornelia Caragea, and Doina Caragea. 2018. Deep neural networks versus naive bayes classifiers for identifying informative tweets during disasters. In Proceedings of ISCRAM.
- Neppalli et al. (2017) Venkata K Neppalli, Cornelia Caragea, Anna Squicciarini, Andrea Tapia, and Sam Stehle. 2017. Sentiment analysis during Hurricane Sandy in emergency response. Int. J. Disaster Risk Reduct. 21 (2017), 213–222.
- Nguyen et al. (2017) Dat Nguyen, Kamela Ali Al Mannai, Shafiq Joty, Hassan Sajjad, Muhammad Imran, and Prasenjit Mitra. 2017. Robust classification of crisis-related data on social networks using convolutional neural networks. In Proceedings of AAAI, Vol. 11.
- Nisar and Yeung (2018) Tahir M Nisar and Man Yeung. 2018. Twitter as a tool for forecasting stock market movements: A short-window event study. J. Financ. Data Sci. 4, 2 (2018), 101–119.
- Park et al. (2021) Yunmi Park, Minju Kim, and Kijin Seong. 2021. Happy neighborhoods: Investigating neighborhood conditions and sentiments of a shrinking city with Twitter data. Growth Change 52, 1 (2021), 539–566.
- Paul et al. (2017) Debjyoti Paul, Feifei Li, Murali Krishna Teja, Xin Yu, and Richie Frost. 2017. Compass: Spatio temporal sentiment analysis of US election what twitter says!. In Proceedings of SIGKDD. 1585–1594.
- Pennington et al. (2014) Jeffrey Pennington, Richard Socher, and Christopher D Manning. 2014. Glove: Global vectors for word representation. In Proceedings of EMNLP. 1532–1543.
- Peters et al. (2018) Matthew E. Peters, Mark Neumann, Mohit Iyyer, Matt Gardner, Christopher Clark, Kenton Lee, and Luke Zettlemoyer. 2018. Deep contextualized word representations. In Proc. of NAACL.
- Phan et al. (2017) Nhathai Phan, Soon Ae Chun, Manasi Bhole, and James Geller. 2017. Enabling real-time drug abuse detection in tweets. In Proceedings of ICDE. IEEE, 1510–1514.
- Piña-García and Ramírez-Ramírez (2019) CA Piña-García and Leticia Ramírez-Ramírez. 2019. Exploring crime patterns in Mexico City. J. Big Data 6, 1 (2019), 1–21.
- Radford et al. (2018) Alec Radford, Karthik Narasimhan, Tim Salimans, and Ilya Sutskever. 2018. Improving language understanding by generative pre-training. (2018).
- Raffel et al. (2019) Colin Raffel, Noam Shazeer, Adam Roberts, Katherine Lee, Sharan Narang, Michael Matena, Yanqi Zhou, Wei Li, and Peter J Liu. 2019. Exploring the limits of transfer learning with a unified text-to-text transformer. arXiv:1910.10683 (2019).
- Ragini et al. (2018) J Rexiline Ragini, PM Rubesh Anand, and Vidhyacharan Bhaskar. 2018. Big data analytics for disaster response and recovery through sentiment analysis. Int. J. Inf. Manag. 42 (2018), 13–24.
- Ray Chowdhury et al. (2019) Jishnu Ray Chowdhury, Cornelia Caragea, and Doina Caragea. 2019. Keyphrase extraction from disaster-related tweets. In Proceedings of WWW. 1555–1566.
- Resch et al. (2018) Bernd Resch, Florian Usländer, and Clemens Havas. 2018. Combining machine-learning topic models and spatiotemporal analysis of social media data for disaster footprint and damage assessment. Cartogr. Geogr. Inf. Sci. 45, 4 (2018), 362–376.
- Rill et al. (2014) Sven Rill, Dirk Reinel, Jörg Scheidt, and Roberto V Zicari. 2014. Politwi: Early detection of emerging political topics on twitter and the impact on concept-level sentiment analysis. Knowl. Based Syst. 69 (2014), 24–33.
- Ristea et al. (2020) Alina Ristea, Mohammad Al Boni, Bernd Resch, Matthew S Gerber, and Michael Leitner. 2020. Spatial crime distribution and prediction for sporting events using social media. Int. J. Geogr. Inf. Sci. 34, 9 (2020), 1708–1739.
- Rizk et al. (2019) Yara Rizk, Hadi Samer Jomaa, Mariette Awad, and Carlos Castillo. 2019. A computationally efficient multi-modal classification approach of disaster-related Twitter images. In Proceedings of SIGAPP. 2050–2059.
- Ruz et al. (2020) Gonzalo A Ruz, Pablo A Henríquez, and Aldo Mascareño. 2020. Sentiment analysis of Twitter data during critical events through Bayesian networks classifiers. Future Gener. Comput. Syst. 106 (2020), 92–104.
- Sachdeva and McCaffrey (2018) Sonya Sachdeva and Sarah McCaffrey. 2018. Using social media to predict air pollution during California wildfires. In Proceedings of SMSociety. 365–369.
- Sakaki et al. (2012) Takeshi Sakaki, Makoto Okazaki, and Yutaka Matsuo. 2012. Tweet analysis for real-time event detection and earthquake reporting system development. IEEE Trans. Knowl. Data. Eng. 25, 4 (2012), 919–931.
- Saleh et al. (2021) Sameh N Saleh, Christoph U Lehmann, Samuel A McDonald, Mujeeb A Basit, and Richard J Medford. 2021. Understanding public perception of coronavirus disease 2019 (COVID-19) social distancing on Twitter. Infect. Control Hosp. Epidemiol. 42, 2 (2021), 131–138.
- Sarker et al. (2016) Abeed Sarker, Karen O’connor, Rachel Ginn, Matthew Scotch, Karen Smith, Dan Malone, and Graciela Gonzalez. 2016. Social media mining for toxicovigilance: automatic monitoring of prescription medication abuse from Twitter. Drug Saf. 39, 3 (2016), 231–240.
- Saura et al. (2019) Jose Ramon Saura, Pedro Palos-Sanchez, and Antonio Grilo. 2019. Detecting indicators for startup business success: Sentiment analysis using text data mining. Sustainability 11, 3 (2019), 917.
- Settles (2009) Burr Settles. 2009. Active learning literature survey. (2009).
- Shan et al. (2019) Siqing Shan, Feng Zhao, Yigang Wei, and Mengni Liu. 2019. Disaster management 2.0: A real-time disaster damage assessment model based on mobile social media data—A case study of Weibo (Chinese Twitter). Saf. Sci. 115 (2019), 393–413.
- Sharma and Moh (2016) Parul Sharma and Teng-Sheng Moh. 2016. Prediction of Indian election using sentiment analysis on Hindi Twitter. In Proceedings of BigData. IEEE, 1966–1971.
- Shen et al. (2020) Cuihua Shen, Anfan Chen, Chen Luo, Jingwen Zhang, Bo Feng, and Wang Liao. 2020. Using reports of symptoms and diagnoses on social media to predict COVID-19 case counts in mainland China: Observational infoveillance study. J. Med. Internet Res. 22, 5 (2020), e19421.
- Shi et al. (2018) Lei Shi, Zhiyang Teng, Le Wang, Yue Zhang, and Alexander Binder. 2018. DeepClue: visual interpretation of text-based deep stock prediction. IEEE Trans. Knowl. Data. Eng. 31, 6 (2018), 1094–1108.
- Shutler et al. (2015) Lukas Shutler, Lewis S Nelson, Ian Portelli, Courtney Blachford, and Jeanmarie Perrone. 2015. Drug use in the Twittersphere: a qualitative contextual analysis of tweets about prescription drugs. J. Addict. Dis. 34, 4 (2015), 303–310.
- Singh et al. (2019) Shiwangi Singh, Akshay Chauhan, and Sanjay Dhir. 2019. Analyzing the startup ecosystem of India: a Twitter analytics perspective. J. Adv. Manag. Res. (2019).
- Siriaraya et al. (2019) Panote Siriaraya, Yihong Zhang, Yuanyuan Wang, Yukiko Kawai, Mohit Mittal, Péter Jeszenszky, and Adam Jatowt. 2019. Witnessing crime through tweets: a crime investigation tool based on social media. In Proceedings of SIGSPATIAL. 568–571.
- Song et al. (2014) Min Song, Meen Chul Kim, and Yoo Kyung Jeong. 2014. Analyzing the political landscape of 2012 Korean presidential election in Twitter. IEEE Intell. Syst. 29, 2 (2014), 18–26.
- Statista (2021) Statista. 2021. Most used social media 2021 — Statista. https://www.statista.com/statistics/272014/global-social-networks-ranked-by-number-of-users/ Accessed on 2021-05-05.
- Stieglitz and Dang-Xuan (2013) Stefan Stieglitz and Linh Dang-Xuan. 2013. Social media and political communication: a social media analytics framework. Soc. Netw. Anal. Min. 3, 4 (2013), 1277–1291.
- Szegedy et al. (2016) Christian Szegedy, Vincent Vanhoucke, Sergey Ioffe, Jon Shlens, and Zbigniew Wojna. 2016. Rethinking the inception architecture for computer vision. In Proceedings of CVPR. 2818–2826.
- Tang and Liu (2010) Lei Tang and Huan Liu. 2010. Graph mining applications to social network analysis. In Managing and Mining Graph Data. Springer, 487–513.
- Tejaswin et al. (2015) Priyam Tejaswin, Rohan Kumar, and Siddharth Gupta. 2015. Tweeting Traffic: Analyzing Twitter for generating real-time city traffic insights and predictions. In Proceedings of CODS-IKDD. 1–4.
- Tumasjan et al. (2011) Andranik Tumasjan, Timm O Sprenger, Philipp G Sandner, and Isabell M Welpe. 2011. Election forecasts with Twitter: How 140 characters reflect the political landscape. Soc. Sci. Comput. Rev. 29, 4 (2011), 402–418.
- Vaswani et al. (2017) Ashish Vaswani, Noam Shazeer, Niki Parmar, Jakob Uszkoreit, Llion Jones, Aidan N Gomez, Łukasz Kaiser, and Illia Polosukhin. 2017. Attention is all you need. In Proceedings of NIPS. 5998–6008.
- Vo et al. (2020) Thanh Vo, Rohit Sharma, Raghvendra Kumar, Le Hoang Son, Binh Thai Pham, Dieu Tien Bui, Ishaani Priyadarshini, Manash Sarkar, and Tuong Le. 2020. Crime rate detection using social media of different crime locations and Twitter part-of-speech tagger with Brown clustering. J. Intell. Fuzzy Syst. Preprint (2020), 1–13.
- Vomfell et al. (2018) Lara Vomfell, Wolfgang Karl Härdle, and Stefan Lessmann. 2018. Improving crime count forecasts using Twitter and taxi data. Decis. Support Syst. 113 (2018), 73–85.
- Voulodimos et al. (2018) Athanasios Voulodimos, Nikolaos Doulamis, Anastasios Doulamis, and Eftychios Protopapadakis. 2018. Deep learning for computer vision: A brief review. Comput. Intell. Neurosci. 2018 (2018).
- Wang et al. (2017) Di Wang, Ahmad Al-Rubaie, Sandra Stinčić Clarke, and John Davies. 2017. Real-time traffic event detection from social media. ACM Trans. Internet Technol. 18, 1 (2017), 1–23.
- Wang et al. (2012b) Hao Wang, Doğan Can, Abe Kazemzadeh, François Bar, and Shrikanth Narayanan. 2012b. A system for real-time twitter sentiment analysis of 2012 us presidential election cycle. In Proceedings of ACL System Demonstrations. 115–120.
- Wang and Gan (2017) Lei Wang and John Q Gan. 2017. Prediction of the 2017 French election based on Twitter data analysis. In Proceedings of CEEC. IEEE, 89–93.
- Wang and Gerber (2015) Mingjun Wang and Matthew S Gerber. 2015. Using twitter for next-place prediction, with an application to crime prediction. In Proceedings of SSCI. IEEE, 941–948.
- Wang et al. (2020a) Rui Wang, Xuemeng Hu, Deyu Zhou, Yulan He, Yuxuan Xiong, Chenchen Ye, and Haiyang Xu. 2020a. Neural topic modeling with bidirectional adversarial training. In Proceedings of ACL. 340–350.
- Wang et al. (2015) Senzhang Wang, Lifang He, Leon Stenneth, Philip S Yu, and Zhoujun Li. 2015. Citywide traffic congestion estimation with social media. In Proceedings SIGSPATIAL. 1–10.
- Wang et al. (2012a) Xiaofeng Wang, Donald E Brown, and Matthew S Gerber. 2012a. Spatio-temporal modeling of criminal incidents using geographic, demographic, and Twitter-derived information. In Proceedings of ISI. IEEE, 36–41.
- Wang et al. (2012c) Xiaofeng Wang, Matthew S Gerber, and Donald E Brown. 2012c. Automatic crime prediction using events extracted from twitter posts. In Proceedings of SBP-BRiMS. Springer, 231–238.
- Wang and Yang (2020) Xinyi Wang and Yi Yang. 2020. Neural topic model with attention for supervised learning. In Proceedings of AISTATS. PMLR, 1147–1156.
- Wang et al. (2020b) Yaqing Wang, Quanming Yao, James T Kwok, and Lionel M Ni. 2020b. Generalizing from a few examples: A survey on few-shot learning. ACM Comput. Surv. 53, 3 (2020), 1–34.
- Wei et al. (2016) Wei Wei, Yuexin Mao, and Bing Wang. 2016. Twitter volume spikes and stock options pricing. Comput. Commun. 73 (2016), 271–281.
- Wei et al. (2017) Xiaocong Wei, Hongfei Lin, Liang Yang, and Yuhai Yu. 2017. A convolution-LSTM-based deep neural network for cross-domain MOOC forum post classification. Inf. 8, 3 (2017), 92.
- Weibo (2021) Weibo. 2021. Weibo API. https://open.weibo.com/wiki/ Accessed on 2021-06-20.
- Wu and Cui (2018) Desheng Wu and Yiwen Cui. 2018. Disaster early warning and damage assessment analysis using social media data and geo-location information. Decis. Support Syst. 111 (2018), 48–59.
- Wu et al. (2016) Yingcai Wu, Nan Cao, David Gotz, Yap-Peng Tan, and Daniel A Keim. 2016. A survey on visual analytics of social media data. IEEE Trans. Multimedia 18, 11 (2016), 2135–2148.
- Xu and Cohen (2018) Yumo Xu and Shay B Cohen. 2018. Stock movement prediction from tweets and historical prices. In Proceedings of ACL. 1970–1979.
- Xue et al. (2020) Jia Xue, Junxiang Chen, Chen Chen, Ran Hu, and Tingshao Zhu. 2020. The Hidden Pandemic of Family Violence During COVID-19: Unsupervised Learning of Tweets. J. Med. Internet Res. 22, 11 (2020), e24361.
- Yamada et al. (2020) Ikuya Yamada, Akari Asai, Hiroyuki Shindo, Hideaki Takeda, and Yuji Matsumoto. 2020. LUKE: deep contextualized entity representations with entity-aware self-attention. arXiv:2010.01057 (2020).
- Yang et al. (2019) Zhilin Yang, Zihang Dai, Yiming Yang, Jaime Carbonell, Ruslan Salakhutdinov, and Quoc V Le. 2019. Xlnet: Generalized autoregressive pretraining for language understanding. arXiv:1906.08237 (2019).
- Yao and Qian (2021) Weiran Yao and Sean Qian. 2021. From Twitter to traffic predictor: Next-day morning traffic prediction using social media data. Transp. Res. Part C Emerg. Technol. 124 (2021), 102938.
- Yaqub et al. (2017) Ussama Yaqub, Soon Ae Chun, Vijayalakshmi Atluri, and Jaideep Vaidya. 2017. Analysis of political discourse on twitter in the context of the 2016 US presidential elections. Gov. Inf. Q. 34, 4 (2017), 613–626.
- Yosinski et al. (2014) Jason Yosinski, Jeff Clune, Yoshua Bengio, and Hod Lipson. 2014. How transferable are features in deep neural networks? arXiv:1411.1792 (2014).
- You et al. (2017) Wanhai You, Yawei Guo, and Cheng Peng. 2017. Twitter’s daily happiness sentiment and the predictability of stock returns. Finance Res. Lett. 23 (2017), 58–64.
- Yu et al. (2020) Juntao Yu, Bernd Bohnet, and Massimo Poesio. 2020. Named entity recognition as dependency parsing. arXiv:2005.07150 (2020).
- Zahra et al. (2020) Kiran Zahra, Muhammad Imran, and Frank O Ostermann. 2020. Automatic identification of eyewitness messages on twitter during disasters. Inf. Process. Manag. 57, 1 (2020), 102107.
- Zhai and Cheng (2020) Weixin Zhai and Chengqi Cheng. 2020. A long short-term memory approach to predicting air quality based on social media data. Atmos. Environ. 237 (2020), 117411.
- Zhai et al. (2020) Wei Zhai, Zhong-Ren Peng, and Faxi Yuan. 2020. Examine the effects of neighborhood equity on disaster situational awareness: Harness machine learning and geotagged Twitter data. Int. J. Disaster Risk Reduct. 48 (2020), 101611.
- Zhai et al. (2021) Xiaohua Zhai, Alexander Kolesnikov, Neil Houlsby, and Lucas Beyer. 2021. Scaling vision transformers. arXiv:2106.04560 (2021).
- Zhang et al. (2021) Dejiao Zhang, Feng Nan, Xiaokai Wei, Shangwen Li, Henghui Zhu, Kathleen McKeown, Ramesh Nallapati, Andrew Arnold, and Bing Xiang. 2021. Supporting Clustering with Contrastive Learning. arXiv:2103.12953 (2021).
- Zhang et al. (2016) Wei Zhang, Xiao Li, Dehua Shen, and Andrea Teglio. 2016. Daily happiness and stock returns: Some international evidence. Physica A 460 (2016), 201–209.
- Zhang et al. (2012) Xue Zhang, Hauke Fuehres, and Peter A Gloor. 2012. Predicting asset value through twitter buzz. In Proceedings of AISC. Springer, 23–34.
- Zhou et al. (2020) Jie Zhou, Ganqu Cui, Shengding Hu, Zhengyan Zhang, Cheng Yang, Zhiyuan Liu, Lifeng Wang, Changcheng Li, and Maosong Sun. 2020. Graph neural networks: A review of methods and applications. AI Open 1 (2020), 57–81.
- Zhou (2018) Zhi-Hua Zhou. 2018. A brief introduction to weakly supervised learning. Natl. Sci. Rev. 5, 1 (2018), 44–53.
- Zhuang et al. (2020) Fuzhen Zhuang, Zhiyuan Qi, Keyu Duan, Dongbo Xi, Yongchun Zhu, Hengshu Zhu, Hui Xiong, and Qing He. 2020. A comprehensive survey on transfer learning. Proc. IEEE 109, 1 (2020), 43–76.
- Zubiaga et al. (2018) Arkaitz Zubiaga, Ahmet Aker, Kalina Bontcheva, Maria Liakata, and Rob Procter. 2018. Detection and resolution of rumours in social media: A survey. ACM Comput. Surv. 51, 2 (2018), 1–36.
- Șerban et al. (2019) Ovidiu Șerban, Nicholas Thapen, Brendan Maginnis, Chris Hankin, and Virginia Foot. 2019. Real-time processing of social media with SENTINEL: A syndromic surveillance system incorporating deep learning for health classification. Inf. Process. Manag. 56, 3 (2019), 1166–1184.