Colloid-Polymer Interplay in the Local Longitudinal Fluctuations of F-actin Solutions
Abstract
We study the motion of single trapped microtracers immersed in F-actin solutions by optical trapping interferometry in order to clarify the observed variability of their anomalous power-law exponent. We obtain a local 7/8 exponent only for non-adsorbing polymer at low optical trapping forces, a value which decreases when increasing the trap stiffness. The velocity autocorrelation function confirms the complex interplay in the colloid-polymer system even under the influence of small external forces and shows an additional constant power-law exponent for the depleted particles.
Optical tweezers (OT) have been demonstrated as a revolutionary technique in soft matter, complex fluids and biophysics since Ashkin and co-workers published their seminal paper Ashkin et al. (1986). Using focused beams of laser light, OT allow to trap and control tracer micrometer-sized particles suspended in a complex fluid, and, therefore, the study of such fluid on biologically relevant scales. Since the position fluctuations of the trapped tracer depend on the properties of the surrounding medium, the viscoelastic properties of the fluid can be inferred by microrheology Mason and Weitz (1995). However, even very small forces applied to the fluid (usually a polymeric suspension) may affect the mechanical properties of the bead’s surroundings Tassieri (2015); Domínguez-García et al. (2016). This drawback becomes interesting when we focus on the interaction between the colloidal particle and the polymers which defines the fluid behavior. The optical force affects the colloid-polymer system, already complex because of the interaction with the biomaterial, the compressibility of the matrix network, and the polymer adsorption and depletion effects near the colloid surface Donath et al. (1997); Chen et al. (2003); Valentine et al. (2004); He and Tang (2011). In practice, the understanding of colloid-polymer interactions is important for their role in industrial applications, from food technologies to personal care products Larson (1999).
As a model case of semiflexible polymer, filamentous actin (F-actin) has been object of intense investigations during the past three decades in the context of biophysics and microrheology. This polymer is the most abundant protein of the cytoskeleton in eukaryotic cells and determine their mechanical properties Bao and Suresh (2003), being also involved in different bioprocesses, remarkably muscle contraction Bershitsky et al. (1997). F-actin has a diameter of nm Egelman (1985) and an average contour length m Kaufmann et al. (1992), persistence length m Ott et al. (1993) (in the range m depending on preparation Isambert et al. (1995)), and mesh size , where is the concentration of actin in mg/ml Schmidt et al. (1989). The length scale relevant for elastically active contacts is the entanglement length, , which is the characteristic scale where an invididual filament is sterically hindered because of other polymers nearby MacKintosh et al. (1995). This length is a phenomenological parameter difficult to measure, but for physiological values of F-actin, it is reported to be m Isambert and Maggs (1996); Palmer et al. (1999); Addas et al. (2004). For mg/ml, these semiflexible polymers 111If , the network of semiflexible polymers is in the highly entangled isotropic regime, while if and are both much less than , then the solution is in the tightly entangled regime. In this work, the terms network and solution are equivalent and describe a semidilute solution of uncrosslinked F-actin. verify . If we take into account the optically-trapped tracer, its radius has to be smaller that the mesh size, so that its motion reflects the mechanical properties of the surrounding medium. Then, for measuring F-actin networks, we need . To explore these conditions, here we use two tracer sizes: m, satisfying the condition ; and m, with , which does not match the required condition. For the former case, we use chemically-active polystyrene (PS) particles (Sigma-Aldrich), but coated with BSA (bovine serum albumin, Sigma-Aldrich), blocking polymer surface absorption to explore their motion in the presence of a depletion layer. For the latter, we employ chemically inert melamine resin particles (Microparticles, GmbH).
The inspection of the motion of those particles inside the polymeric network for these two limit-cases will provide an insight of the complex colloid-polymer interplay, specially in the presence of external optical forces. In this Letter, we focus on the power-law behavior of F-actin solutions, but some reported exponents in the literature (see extended discussion in the accompanying paper Domínguez-García et al. (2022)) deviate from the expected results for semiflexible polymers. We clarify this aspect by studying the local actin longitudinal fluctuations, which we find to depend on the colloid size/polymer length scales, and on the external forces/bead’s surface characteristics.
The motion of single-tracers is used to deduce the mechanical properties of the fluid. One-particle (1P) microrheology provides the fluid viscoelasticity on the microscale, similar to the tracer’s size, i.e., microrheology depends of the length scales in the system Atakhorrami et al. (2014), as opposed to bulk rheology Gardel et al. (2003). To overcome the limitations of 1P microrheology, two-particle (2P) microrheology Levine and Lubensky (2000); Crocker et al. (2000) detects the fluctuations at large length scales, matching bulk rheology as a result 222Basically, 2P microrheology measures bulk viscoelasticity, without the influence of the local environment, because of the propagation through the medium of the interparticle position correlations generated by elastic and hydrodynamics iterations. F-actin solutions are a classic example of substantial differences between micro- and macrorheology results, but a correct characterization of the involved length scales can clarify some of the discrepancies in other viscoelastic fluids Buchanan et al. (2005). The advantage of classical 1P microrheology relays on its potential capacity for isolating the local contribution to the fluctuations in the scale of the tracer bead, therefore, allows to investigate the polymer dynamics in the biological scale.
In this work, the motion of single optically-trapped tracer beads is measured using optical trapping interferometry (OTI), which consists of an optical trap combined with an interferometric position detector, allowing measurements of the Brownian position fluctuations of the microbead with nanometric resolution in the microsecond range Franosch et al. (2011). The trajectories were collected during s at a sampling rate of MHz, corresponding to data points per measurement. In an accompanying paper Domínguez-García et al. (2022), we provide further information about the experimental set-up, materials, and methods.
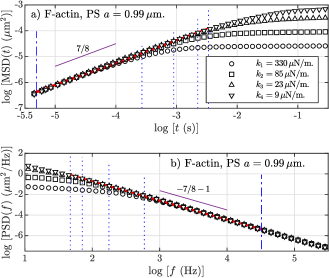
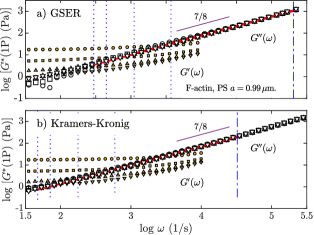
Fig. 1 plots the one-dimensional mean-squared displacement, , and the power spectral density, PSD, for a micron-sized PS BSA-added bead immersed in a F-actin solution 333Phalloidin-stabilized (mM) F-actin ( M) has been polymerized from monomeric actin from rabbit skeletal muscle according to standard recipe Pardee and A (1982) See further details in the accompanying paper Domínguez-García et al. (2022) under four different trap stiffnesses, . The MSD reaches a plateau at higher times because of elastic forces from the trap and the fluid itself. At intermediate and short-time values, it verifies an anomalous power-law behavior with , before the influence of hydrodynamic and inertia effects. The behavior of the PSD is analogous but in the frequency space, showing a PSD decay.
Fig. 2 shows the complex modulus, , where is the storage or elastic modulus and is the loss modulus. These quantities are obtained by means of standard microrheological methods, i.e., by means of the generalized Stokes-Einstein relation (GSER) concurrent with Mason’s approximation Mason et al. (1997); Mason (2000), shown in Fig. 2a), and through the Kramers-Kronig integrals, Fig. 2b). The loss modulus calculated by both methods follows a power-law behavior . In this study, by analyzing the power-law behavior of the functions MSD, PSD and , we systematically calculate values for an appreciable collection of measurements. In the case of PS particles, we obtain results compatible with an exponent . However, according to theory, bulk rheology, and bulk-compatible microrheology, the exponent is equal to for this kind of polymeric networks Gittes and MacKintosh (1998). On the other hand, an exponent is obtained in F-actin solutions when adding myosin Le Goff et al. (2001) and also appears in some experiments similar to the reported in this Letter 444See for example: Chae and Furst, Langmuir, 3084 (2005); Koenderink et al, Phys. Rev. Lett. 96, 138307 (2006); Atakhorrami et al, Phys. Rev. E 77, 061508 (2008); Tassieri et al: Biophys. J. 94, 2170 (2008), and New J. Phys. 14 (2012); Grebenkov et al, Phys. Rev. E 88, 040701 (2013); and Ref. Atakhorrami et al. (2014). The origin of this exponent value relays on the longitudinal response provoked by a local microperturbation in the polymer generated by the tracers. The finite propagation of the tension along the filament generates a more rapid variation in the mean-squared displacement through a growth at low time-scales Everaers et al. (1999).
Semiflexible polymers form entangled networks at very low concentrations and their units are sterically hindered by other filaments at the entanglement length, which should generate a constant value for the elastic modulus, , over an extended range of frequencies Gardel et al. (2003). In Fig. 2, we observe constant values for even at the lowest optical force, but this effect is not detected in bulk rheology, where grows with frequency and the elastic plateau only appears at very low frequencies. The increase of the elastic modulus with frequency occurs because of the fluctuations of the filaments over their persistence length, on a scale of tens of microns. On the contrary, if we measure locally, on the order of microns, the relevant scale lengths are the mesh size and, especially, the entanglement length. Additionally, we check the exposed local mechanical properties of F-actin by adding skeletal muscle tropomyosin (Tm) alone, and Tm and troponin (Tn). Tm is a coiled-coil protein, which, together with actin and Tn, constitutes the thin filament. The coupling of Tm/Tn complex to actin, regulated by the presence of Ca2+ Ebashi et al. (1971), allows myosin and actin interaction and thus muscle contraction. Mechanically, Tm/Tn complex tends to stabilize the filament structure and increases its stiffness, but without major modifications in the network structure Götter et al. (1996). Our analysis of the motion of PS particles immersed in F-actin/Tm and F-actin/Tm/Tn complexes, always in the presence of calcium, returns very similar curves to the ones shown in Fig. 1 and 2, providing analogous results when averaging values (see Table 1 and details in the accompanying paper Domínguez-García et al. (2022)).
| Material | |||||
|---|---|---|---|---|---|
| Actin | |||||
| A.Tm. | |||||
| A.Tm.Tn. |
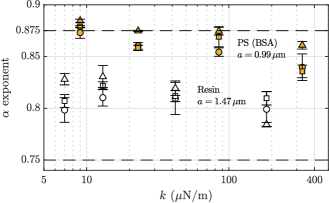
The general picture described until now changes when we focus on the influence of the optical forces and when we repeat the same experiments using chemically-inert melamine resin particles. Fig. 3 shows how our experiments using micro-sized PS BSA-added particles return for low optical forces, but, when we increase the trap stiffnesses, the exponent slightly decreases. Such an effect may be attributed to the effective increase of particle size, because of surface adsorption already improved by the attractive optical force affecting the polymers, but this effect is blocked by BSA. In this case, the filamentous polymers are not attached to the bead, and a less dense network is formed around the particle, generating a polymer-poor depletion zone because of the entropy loss of the molecules near the bead surface. Experimentally, it has already been observed that the increase of the depletion agent concentration in actin solutions decreases the exponent of the power-law behavior in the complex modulus Tharmann et al. (2006). According to that result, it follows that the optical forces are acting like an effective depletion agent.
On the other hand, the resin particles give with no appreciable dependency with the optical trap strength, confirming that these beads have no surface-related effects, and also verifying the importance of their particular size, relative to the fluid’s entanglement length (), when we measure the local mechanical properties, providing an intermediate exponent between 7/8 and the expected 3/4. In relation to the influence of Tm/Tn, the obtained values are very similar to F-actin alone, but a small increase in the averaged values can be observed in Fig. 3. If we visualize the whole data without averaging, we observe that values are less dispersed when adding Tm or Tm/Tn (results detailed in Ref. Domínguez-García et al. (2022)). This observation agrees with a stabilization of the filament structure by Tm/Tn, even when measured locally.
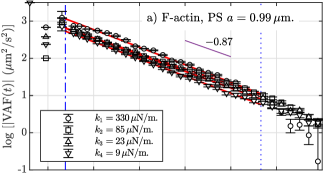
Finally, we study the velocity autocorrelation function defined as , where is the velocity of the particle. Fig. 4a) plots this function in absolute values () for PS tracers, showing a dependence of the numeric values with the applied optical force, where the data with the strongest optical force on top and the weakest at the bottom. Such an effect does not appear for resin tracers, as it can be seen in Fig. 4b). The VAF is related to the dissipation of the particle’s motion by its interaction with the surrounding viscoelastic network. This observation confirms the interpretation that the optical forces are acting like a depletion agent for the non-adsorbing polymer PS tracers, increasing the low-viscosity region around the particles. Regarding its multiple power-law behavior, it is known that the VAF shows a minimum in the first zero-crossing value, related to the interplay between the optical trapping and the hydrodynamics of the fluid. In Newtonian fluids, before that minimum, this function follows an algebraic power-law rather than an exponential tail , knwon as the “long-time tail” Alder and Wainwright (1970). A second zero-crossing appears at higher time scales, before a power-law decay in the form of , but its observation is very limited by the initial noise floor of the experimental set-up. In Fig. 4, we observe a third power-law behavior, , for an intermediate time-scale. We obtain two different exponents, averaged for all values: for PS particles, Fig. 4a), and for resin tracers, Fig. 4b). A similar value to the resin beads exponent has been previously observed in actin solutions () Xu et al. (1998). Remarkably, these exponents do not depend on the applied optical forces, only on the type of tracer.
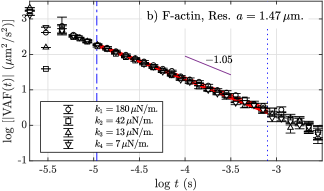
The exponent value for the resin tracers can be deduced from a power-law fluid MSD by making its second derivative, so VAF. Therefore, if , then . More accurately, if we use the published data from a complete phenomenological power-law model which includes inertial and hydrodynamic effects at short-times and optical trapping at long times Grebenkov and Vahabi (2014), we obtain an estimated for , matching our experimental result. However, to our knowledge, the exponent for depleted PS particles has not been previously observed. Its physical interpretation is not clear, but the effects of the depletion layer are indeed more complex than expected, something confirmed by numerical studies of mean-field theory, which show that the depletion thickness and curvature effects depend on the interplay between the persistence and correlation polymer characteristic lengths Ganesan et al. (2008). Unfortunately, there is a lack of numerical and theoretical studies of the behavior of semiflexible polymers near spherical particles.
The results summarized in this Letter clarify the variability of power-law exponents in F-actin solutions reported in the literature by measuring the local longitudinal fluctuations of actin polymeric filaments, under the condition of a previous knowledge of the basic characteristic of the fluid. By analyzing the anomalous diffusion of microtracers immersed in these networks, we have observed a dependence of the power-law exponents and the velocity autocorrelation function with the applied external forces, related to the interplay between the depletion layer surrounding the colloid and the external optical trap. The understanding of the mechanical response of these biopolymeric networks in the microscale may expand the knowledge of the microscopical origins of their rheology and our capacity to emulate biological systems. A potential application for the observations contained in this Letter may be the ability to tune the depletion forces around colloidal particles by the application of lightly controlled external forces.
P.D.G acknowledges support aid by grant PID2020-117080RB-C54 funded by MCIN/AEI/10.13039/501100011033, J.R.P. from National Institutes of Health grant R01 HL128683, and A.A. funding from the Swiss National Science Foundation through project PP00P2_202661.
References
- Ashkin et al. (1986) A. Ashkin, J. M. Dziedzic, J. E. Bjorkholm, and S. Chu, Opt. Letters 11, 288 (1986).
- Mason and Weitz (1995) T. G. Mason and D. A. Weitz, Phys. Rev. Lett. 74, 1250 (1995).
- Tassieri (2015) M. Tassieri, Soft Matter 11, 5792 (2015).
- Domínguez-García et al. (2016) P. Domínguez-García, L. Forró, and S. Jeney, Appl. Phys. Lett. 109, 143702 (2016).
- Donath et al. (1997) E. Donath, A. Krabi, M. Nirschl, V. M. Shilov, M. I. Zharkikh, and B. Vincent, J. Chem. Soc., Faraday Trans. 93, 115 (1997).
- Chen et al. (2003) D. T. Chen, E. R. Weeks, J. C. Crocker, M. F. Islam, R. Verma, J. Gruber, A. J. Levine, T. C. Lubensky, and A. G. Yodh, Phys. Rev. Lett. 90, 108301 (2003).
- Valentine et al. (2004) M. T. Valentine, Z. E. Perlman, M. L. Gardel, J. H. Shin, and P. Matsudaira, Biophys. J. 86, 4004 (2004).
- He and Tang (2011) J. He and J. X. Tang, Phys. Rev. E 83, 041902 (2011).
- Larson (1999) R. G. Larson, The Structure and Rheology of Complex Fluids (Oxford University Press, NewYork, 1999).
- Bao and Suresh (2003) G. Bao and S. Suresh, Nat. Mater. 2, 715 (2003).
- Bershitsky et al. (1997) S. Y. Bershitsky, A. K. Tsaturyan, O. N. Bershitskaya, G. I. Mashanov, P. Brown, R. Burns, and M. A. Ferenczi, Nature 388, 186 (1997).
- Egelman (1985) E. H. Egelman, J. Muscle Res. Cell Motil. 6, 129 (1985).
- Kaufmann et al. (1992) S. Kaufmann, J. Käs, W. H. Goldmann, E. Sackmann, and G. Isenberg, FEBS Letters 314, 203 (1992).
- Ott et al. (1993) A. Ott, M. Magnasco, A. Simon, and A. Libchaber, Phys. Rev. E 48, R1642 (1993).
- Isambert et al. (1995) H. Isambert, P. Venier, A. C. Maggs, A. Fattoum, R. Kassab, D. Pantaloni, and M. F. Carlier, J Biol Chem. 270, 11437 (1995).
- Schmidt et al. (1989) C. F. Schmidt, M. Baermann, G. Isenberg, and E. Sackmann, Macromolecules 22, 3638 (1989).
- MacKintosh et al. (1995) F. C. MacKintosh, J. Käs, and P. A. Janmey, Phys. Rev. Lett. 75, 4425 (1995).
- Isambert and Maggs (1996) H. Isambert and A. C. Maggs, Magnetohydrodynamics 29, 1036 (1996).
- Palmer et al. (1999) A. Palmer, T. G. Mason, J. Xu, S. C. Kuo, and D. Wirtz, Biophys. J. 76, 1063 (1999).
- Addas et al. (2004) K. M. Addas, C. F. Schmidt, and J. X. Tang, Phys. Rev. E 70, 021503 (2004).
- Note (1) If , the network of semiflexible polymers is in the highly entangled isotropic regime, while if and are both much less than , then the solution is in the tightly entangled regime. In this work, the terms network and solution are equivalent and describe a semidilute solution of uncrosslinked F-actin.
- Domínguez-García et al. (2022) P. Domínguez-García, J. R. Pinto, A. Akrap, and S. Jeney, “Micro-mechanical response of the f-actin/tropomyosin/troponin complex by optical trapping interferometry,” (2022).
- Atakhorrami et al. (2014) M. Atakhorrami, G. H. Koenderink, J. F. Palierne, F. C. MacKintosh, and C. F. Schmidt, Phys. Rev. Lett. 112, 088101 (2014).
- Gardel et al. (2003) M. L. Gardel, M. T. Valentine, J. C. Crocker, A. R. Bausch, and D. A. Weitz, Phys. Rev. Lett. 91, 158302 (2003).
- Levine and Lubensky (2000) A. J. Levine and T. C. Lubensky, Phys. Rev. Lett. 85, 1774 (2000).
- Crocker et al. (2000) J. C. Crocker, M. T. Valentine, E. R. Weeks, T. Gisler, P. D. Kaplan, A. G. Yodh, and D. A. Weitz, Phys. Rev. Lett. 85, 888 (2000).
- Note (2) Basically, 2P microrheology measures bulk viscoelasticity, without the influence of the local environment, because of the propagation through the medium of the interparticle position correlations generated by elastic and hydrodynamics iterations.
- Buchanan et al. (2005) M. Buchanan, M. Atakhorrami, J. F. Palierne, and C. F. Schmidt, Macromolecules 38, 8840–8844 (2005).
- Franosch et al. (2011) T. Franosch, M. Grimm, M. Belushkin, F. M. Mor, G. Foffi, L. Forró, and S. Jeney, Nature (London) 478, 85 (2011).
- Note (3) Phalloidin-stabilized (mM) F-actin ( M) has been polymerized from monomeric actin from rabbit skeletal muscle according to standard recipe Pardee and A (1982) See further details in the accompanying paper Domínguez-García et al. (2022).
- Mason et al. (1997) T. G. Mason, K. Ganesan, J. H. van Zanten, D. Wirtz, and S. C. Kuo, Phys. Rev. Lett. 79, 3282 (1997).
- Mason (2000) T. G. Mason, Rheol. Acta 39, 371 (2000).
- Gittes and MacKintosh (1998) F. Gittes and F. C. MacKintosh, Phys. Rev. E 58, R1241 (1998).
- Le Goff et al. (2001) L. Le Goff, F. Amblard, and E. M. Furst, Phys. Rev. Lett. 88, 018101 (2001).
- Note (4) See for example: Chae and Furst, Langmuir, 3084 (2005); Koenderink et al, Phys. Rev. Lett. 96, 138307 (2006); Atakhorrami et al, Phys. Rev. E 77, 061508 (2008); Tassieri et al: Biophys. J. 94, 2170 (2008), and New J. Phys. 14 (2012); Grebenkov et al, Phys. Rev. E 88, 040701 (2013); and Ref. Atakhorrami et al. (2014).
- Everaers et al. (1999) R. Everaers, F. Jülicher, A. Ajdari, and A. C. Maggs, Phys. Rev. Lett. 82, 3717 (1999).
- Ebashi et al. (1971) S. Ebashi, T. Wakabayashi, and F. Ebashi, J. Biomech. 69, 441 (1971).
- Götter et al. (1996) R. Götter, G. K., E. Frey, B. M., and E. Sackmann, Magnetohydrodynamics 29, 30 (1996).
- Tharmann et al. (2006) R. Tharmann, M. M. A. E. Claessens, and A. R. Bausch, Biophys. J. 90, 2622 (2006).
- Alder and Wainwright (1970) B. J. Alder and T. E. Wainwright, Phys. Rev. A 1, 18 (1970).
- Xu et al. (1998) J. Xu, W. H. Schwarz, J. A. Käs, T. P. Stossel, P. A. Janmey, and T. D. Pollard, Biophys. J. 74, 2731 (1998).
- Grebenkov and Vahabi (2014) D. S. Grebenkov and M. Vahabi, Phys. Rev. E 89, 012130 (2014).
- Ganesan et al. (2008) V. Ganesan, L. Khounlavong, and V. Pryamitsyn, Phys. Rev. E 78, 051804 (2008).
- Pardee and A (1982) J. D. Pardee and S. J. A, Methods Enzymol. 85, 164 (1982).