11email: alexsl@strw.leidenuniv.nl 22institutetext: Université Paris-Saclay, Université Paris Cité, CEA, CNRS, AIM, 91191, Gif-sur-Yvette, France 33institutetext: Instituto de Astrofísica de Andalucía (IAA-CSIC), Glorieta de la Astronomía s/n, 18008 Granada, Spain
Detection of Paschen absorption in the atmosphere of KELT-9 b
Hydrogen and helium transmission signals trace the upper atmospheres of hot gas-giant exoplanets, where the incoming stellar extreme ultraviolet and X-ray fluxes are deposited. Further, for the hottest stars, the near-ultraviolet excitation of hydrogen in the Balmer continuum may play a dominant role in controlling the atmospheric temperature and driving photoevaporation.
KELT-9 b is the archetypal example of such an environment as it is the hottest gas-giant exoplanet known to date (T 4500 K) and orbits an A0V-type star. Studies of the upper atmosphere and escaping gas of this ultra-hot Jupiter have targeted the absorption in the Balmer series of hydrogen (n1 = 2 n2 2). Unfortunately, the lowermost metastable helium state that causes the triplet absorption at 1083 is not sufficiently populated for detection. This is due to the low extreme-ultraviolet and X-ray fluxes from the host star, and to its high near-ultraviolet flux, which depopulates this metastable state.
Here, we present evidence of hydrogen absorption in the Paschen series in the transmission spectrum of KELT-9 b observed with the high-resolution spectrograph CARMENES. Specifically, we focus on the strongest line covered by its near-infrared channel, Pa at 12821.6 (n1 = 3 n2 = 5). The observed absorption shows a contrast of (0.53 )%, a blueshift of 14.8 km s-1, and a full width at half maximum of 31.9 km s-1. The observed blueshift in the absorption feature could be explained by day-to-night circulation within the gravitationally bound atmosphere or, alternatively, by Pa absorption originating in a tail of escaping gas moving toward the observer as a result of extreme atmospheric evaporation. This detection opens a new window for investigating the atmospheres of ultra-hot Jupiters, providing additional constraints of their temperature structure, mass-loss rates, and dynamics for future modeling of their scorching atmospheres.
Key Words.:
planets and satellites: atmospheres – planets and satellites: gaseous planets – planets and satellites: individual: KELT-9 b1 Introduction
Ultra-hot Jupiters (UHJs) are highly irradiated gas-giant exoplanets, orbiting extremely close to their host starts, in expected tidally locked configurations (see, e.g., Parmentier et al., 2018; Bell & Cowan, 2018; Arcangeli et al., 2018). At their extremely short orbital distances, their daysides receive permanent stellar irradiation, elevating their temperatures well above 2200 K (see, e.g., Tan & Komacek, 2019). Such extreme environments result in complex atmospheric dynamics and potentially strong temperature and chemical gradients across their atmospheres (Seidel et al., 2019; Hoeijmakers et al., 2019; Seidel et al., 2021; Ehrenreich et al., 2020; Kesseli & Snellen, 2021; Wardenier et al., 2021; Cont et al., 2021; Kesseli et al., 2022; Savel et al., 2022; Cont et al., 2022; Landman et al., 2021; Sánchez-López et al., 2022).
Recent studies have shown that low- and high-resolution transmission spectra can probe the escaping material of hot gas giants, providing information about their atmospheric dynamics and mass-loss rates (Linsky et al., 2010; Ehrenreich & Désert, 2011; Yan & Henning, 2018; García Muñoz & Schneider, 2019; Lampón et al., 2020; Wyttenbach et al., 2020; Lampón et al., 2021b; Casasayas-Barris et al., 2021). Specifically, the Balmer series of hydrogen has been extensively used along with the He I triplet at 10833 to explore the upper atmosphere of exoplanets (Spake et al., 2018; Yan & Henning, 2018; Casasayas-Barris et al., 2018, 2019, 2021; Nortmann et al., 2018; Allart et al., 2018; Salz et al., 2018; Mansfield et al., 2018; Kreidberg & Oklopčić, 2018; Allart et al., 2019; Alonso-Floriano et al., 2019; Kirk et al., 2020; Palle et al., 2020; Ninan et al., 2020; Wyttenbach et al., 2020; Dos Santos et al., 2020; Palle et al., 2020; Vissapragada et al., 2020; Fossati et al., 2021; Krishnamurthy et al., 2021; Czesla et al., 2022; Orell-Miquel et al., 2022; Zhang et al., 2022). This has allowed us to better understand planetary evolution and diversity, which are strongly linked to hydrodynamic atmospheric mass loss. That is, the atmospheric heating and a potentially catastrophic outflow at supersonic velocities are triggered by energy deposition from stellar photons, especially by extreme ultraviolet and extreme X-ray fluxes (see, e.g., García Muñoz, 2007; García Muñoz & Schneider, 2019; Salz et al., 2016a, b; Lampón et al., 2021a). In the case of the hottest host stars, the near-ultraviolet (NUV) energy deposition at high altitudes is expected to occur primarily in the hydrogen Balmer continuum (n = ; ¡ 364.6 nm; see García Muñoz & Schneider, 2019), with the NUV flux being more important than the extreme-ultraviolet radiation in determining the planet’s mass loss. This could partially explain the evaporation desert (Lopez et al., 2012; Fulton et al., 2017; Jin & Mordasini, 2018), at least around hot stars, as the predicted mass-loss rate can be up to two orders of magnitude higher than when only considering extreme ultraviolet energy deposition (García Muñoz & Schneider, 2019).
An extreme and particularly interesting UHJ is KELT-9 b (Gaudi et al., 2017), the hottest gas-giant exoplanet known to date, with an equilibrium temperature of 4500 K (Mansfield et al., 2020). KELT-9 b presents an equilibrium temperature comparable to the effective temperature of many cool stars, which suggests both types of objects may have similar atmospheric features (see, e.g., Parmentier et al., 2018; Arcangeli et al., 2018; Bell & Cowan, 2018). A very extended hydrogen envelope (close to the 1.9 Rp Roche lobe) was detected by Yan & Henning (2018), studying the Balmer H line (n1 = 2 n2 = 3; 6565 ), in a transit of this UHJ. This indicates that its atmosphere is evaporating at a notable rate of 1012 gs-1. This detection was confirmed and additional absorption lines from the Balmer series were reported by Wyttenbach et al. (2020), who performed a comprehensive study of the thermospheric temperature (13200 K) and mass-loss rate (10 gs-1). Interestingly, they found that the escape regime of KELT-9 b could be “Balmer-driven,” as proposed by García Muñoz & Schneider (2019).
Due to the lack of a corona and the strong NUV flux of its early-A0V host star KELT-9 (HD 195689, T 10170 K; see, e.g., Gaudi et al., 2017), no absorption from the metastable He triplet has been observed in the atmosphere of this planet (Nortmann et al., 2018). That is, even if radiative recombination and production of the He(23S) state occurs, its lifetime will be significantly shortened by the stellar NUV flux, which rapidly depopulates this level. As a result, this closes one of the main windows for probing the outer atmospheric layers of this planet. In contrast, the atmosphere of KELT-9 b has been surveyed with multiple instruments, yielding a plethora of atmospheric neutral and ionized species (Hoeijmakers et al., 2018, 2019; Cauley et al., 2019; Yan et al., 2019; Turner et al., 2020; Pino et al., 2020; Borsa et al., 2021). Interestingly, these detections point toward potential deviations from the hydrostatic local thermodynamic equilibrium predictions, as evidenced by significantly stronger absorptions than expected in the upper atmosphere.
Here, we aim at expanding the available repertoire of absorption signals suitable for studying exoplanet atmospheres with high-resolution spectrographs. Specifically, we focus on the Paschen series of hydrogen (n1 = 3 n2 ¿ 3), of which the Paschen (Pa) line at 12821.6 (n1 = 3 n2 = 5) is the strongest absorption line covered by the near-infrared channel of the CARMENES111Calar Alto high-Resolution search for M dwarfs with Exoearths with Near-infrared and optical Échelle Spectrographs. instrument (Quirrenbach et al., 2016, 2018). No detection of this line has been presented in the literature for UHJs, although it has been studied in young accreting companions, where the amplitude variations in the line provide information about planet accretion and the time-dependent planet luminosities, temperatures, and radii (see, e.g., Seifahrt et al., 2007; Lavigne et al., 2009; Baraffe et al., 2009; Biller & Bonnefoy, 2018). A detection could open a new window for exploring the atmospheres of UHJs, thus providing new insights into the atmospheric energy budget and dynamics that can complement previous information.
This Letter is organized as follows. In Sect. 2 we describe the CARMENES observations of this target and the data analysis procedure we followed to obtain the transmission spectrum of KELT-9 b. In Sect. 3 we present the results of the analysis and discuss their possible implications. Finally, in Sect. 4, we summarize the main conclusions of this Letter.
2 Observations and data analysis
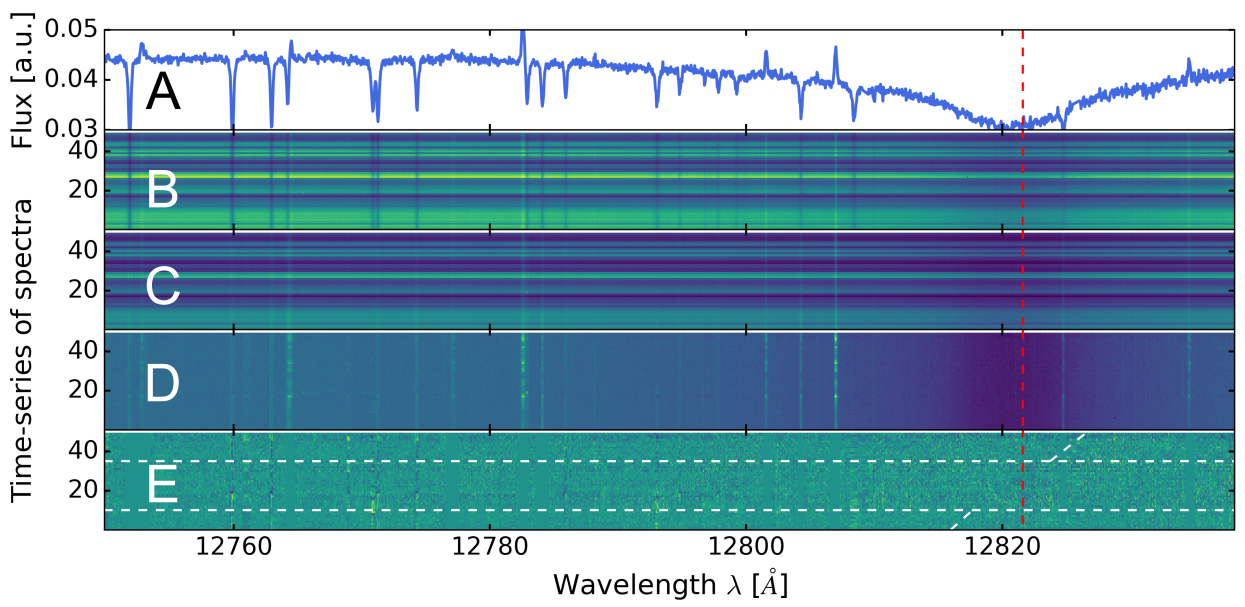
We analyzed CARMENES transit data of KELT-9 b obtained on August 6, 2017, and available from the Calar Alto public archive. The observations consist of 54 exposures with integration times from 300 to 400 s. This introduces a small orbital blurring, as the planet’s orbital velocity with respect to the Earth changes by 3.5 km s-1 on average during exposures (the resolution element is 3 km s-1). The mean signal-to-noise ratio (S/N) per pixel is 60 in the spectral order containing the Pa absorption. We discarded four spectra with low signal (S/N ¡ 35) due to passing clouds. Two additional transits of KELT-9 b are available in the public archive, observed on September 21, 2017, and 16 June, 2018, but under significantly worse conditions in terms of the mean S/N around the Pa line or the transit phase coverage, which did not allow us to recover planet signals. We note that the CARMENES optical data of these events have been previously studied in Yan & Henning (2018), Yan et al. (2019), and Borsa et al. (2021). The data were already reduced with the pipeline caracal (Zechmeister et al., 2014; Caballero et al., 2016), which includes bias and flat field correction as well as wavelength calibration. The processed spectra are provided with wavelengths in vacuum and in the rest frame of the Earth. To remove possible contamination from cosmic rays, we performed a 3-sigma clipping, interpolating the flagged values (deviated over 3-sigma with respect to the time-series spectra of that pixel) using their adjacent pixels.
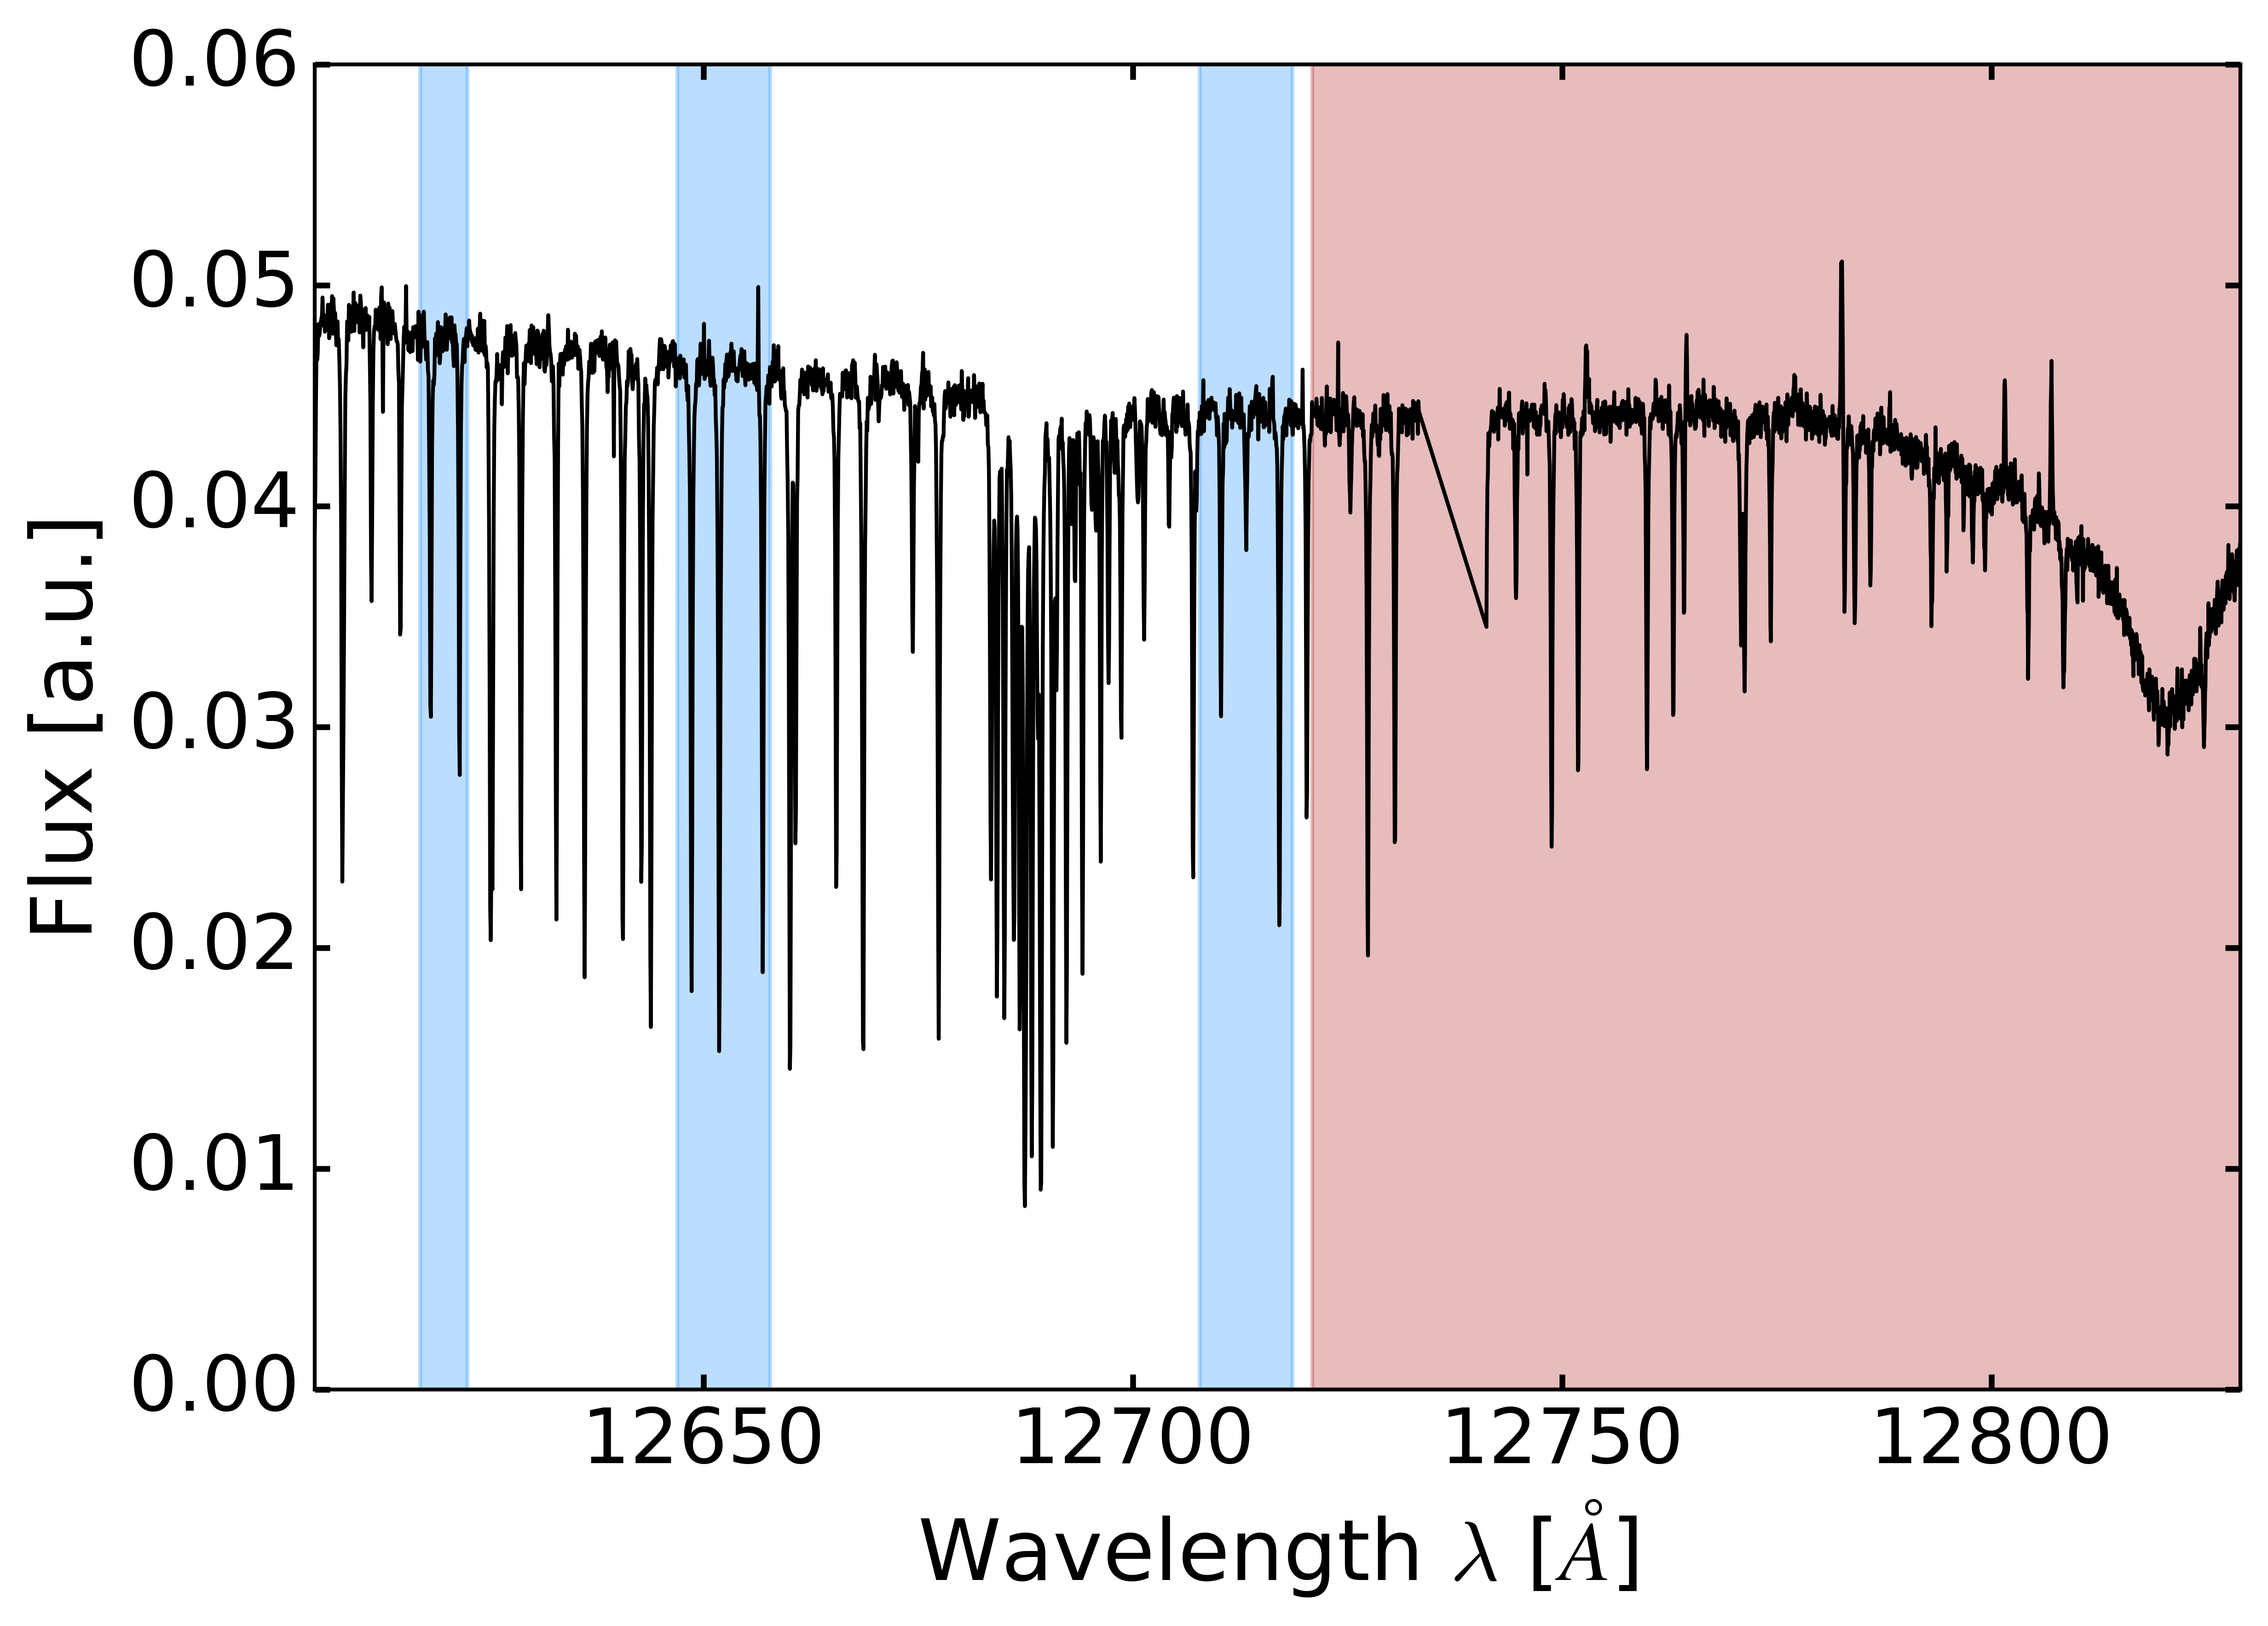
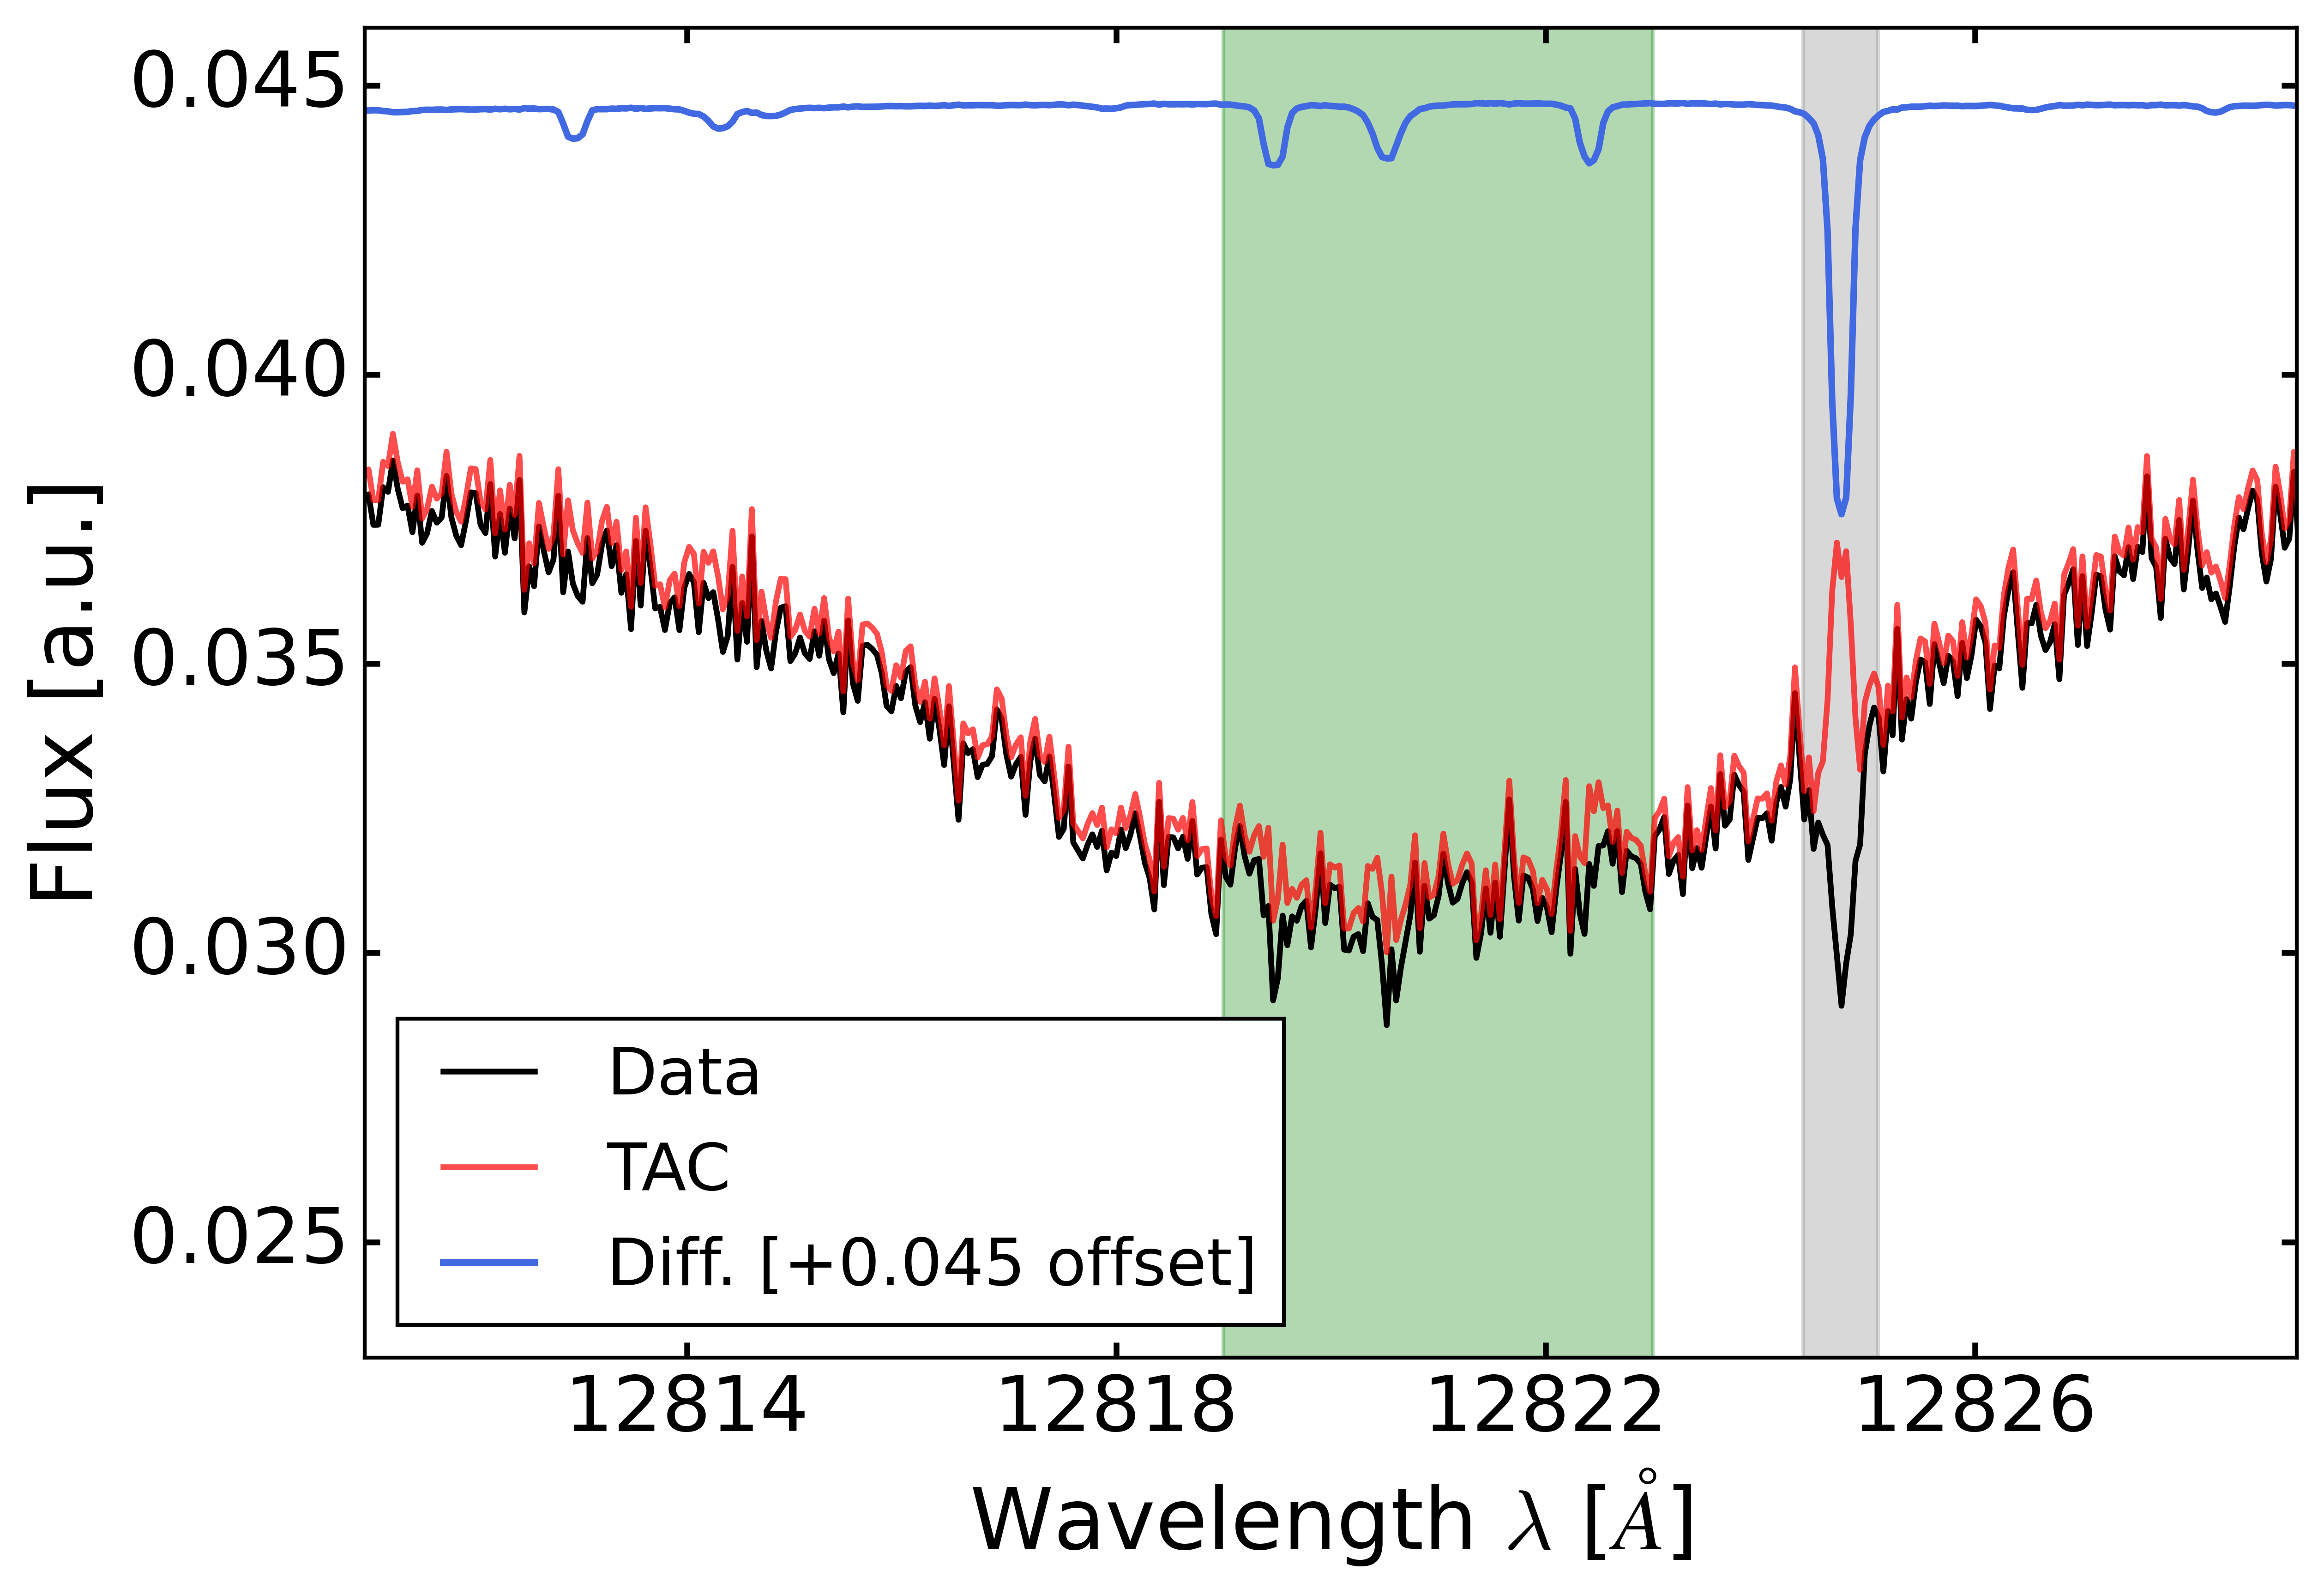
The spectral region around Pa (see Fig. 1) presents a very small telluric contribution that we corrected with the molecfit package (Smette et al., 2015; Kausch et al., 2015). In Appendix A we show the regions included and excluded in the analysis. The telluric-corrected spectra were then cut in a region from 12750 to 12840 and normalized by the continuum measured away from the stellar Pa line. For the next part of the analysis, we followed similar methods as those presented in Yan & Henning (2018), Nortmann et al. (2018), Casasayas-Barris et al. (2019), and Yan et al. (2019). We shifted the spectra to the stellar rest frame using the parameters from Table 1 and computed a master out-of-transit spectrum (F), combining all of the telluric-corrected spectra that contain no signal from the planet. All the in-transit spectra were divided by this master out-of-transit spectrum to remove the stellar contribution.
If present, a signal from the atmosphere of KELT-9 b is likely to be buried in the noise of the residual spectra. In order to enhance its detectability, the standard approach consists in shifting all in-transit spectra to the rest frame of the planet and co-adding them (FF) before subtracting one to obtain the final transmission spectrum around the Pa line. In this step, we used a semi-amplitude of the orbital velocity of the planet (KP) of 234.24 0.90km s-1, as reported by Hoeijmakers et al. (2019), and the in-transit spectra were weighted by their mean S/N. In order to explore the multidimensional parameter space, we used the statistical framework MULTINEST (Feroz et al., 2009) by means of the pyMultinest package (Buchner et al., 2014; Buchner, 2016), which allows parameter estimation and model selection. We modeled possible absorption lines assuming they have a Gaussian profile. The retrieval consists of three parameters, namely, the Gaussian line contrast (), its full width at half maximum (FWHM), and the Doppler shift of the Gaussian line center with respect to the vacuum Pa wavelength, expressed in velocity units ().
Following the methods described and applied in Yan et al. (2015), Yan & Henning (2018), and Casasayas-Barris et al. (2019), we also modeled the distortion in the stellar Pa line produced by the Rossiter-McLaughlin effect and by the center-to-limb variation. Nevertheless, we found the magnitude of these effects to be almost negligible (not shown), so the correction was not performed in the final analysis.
3 Results and discussion
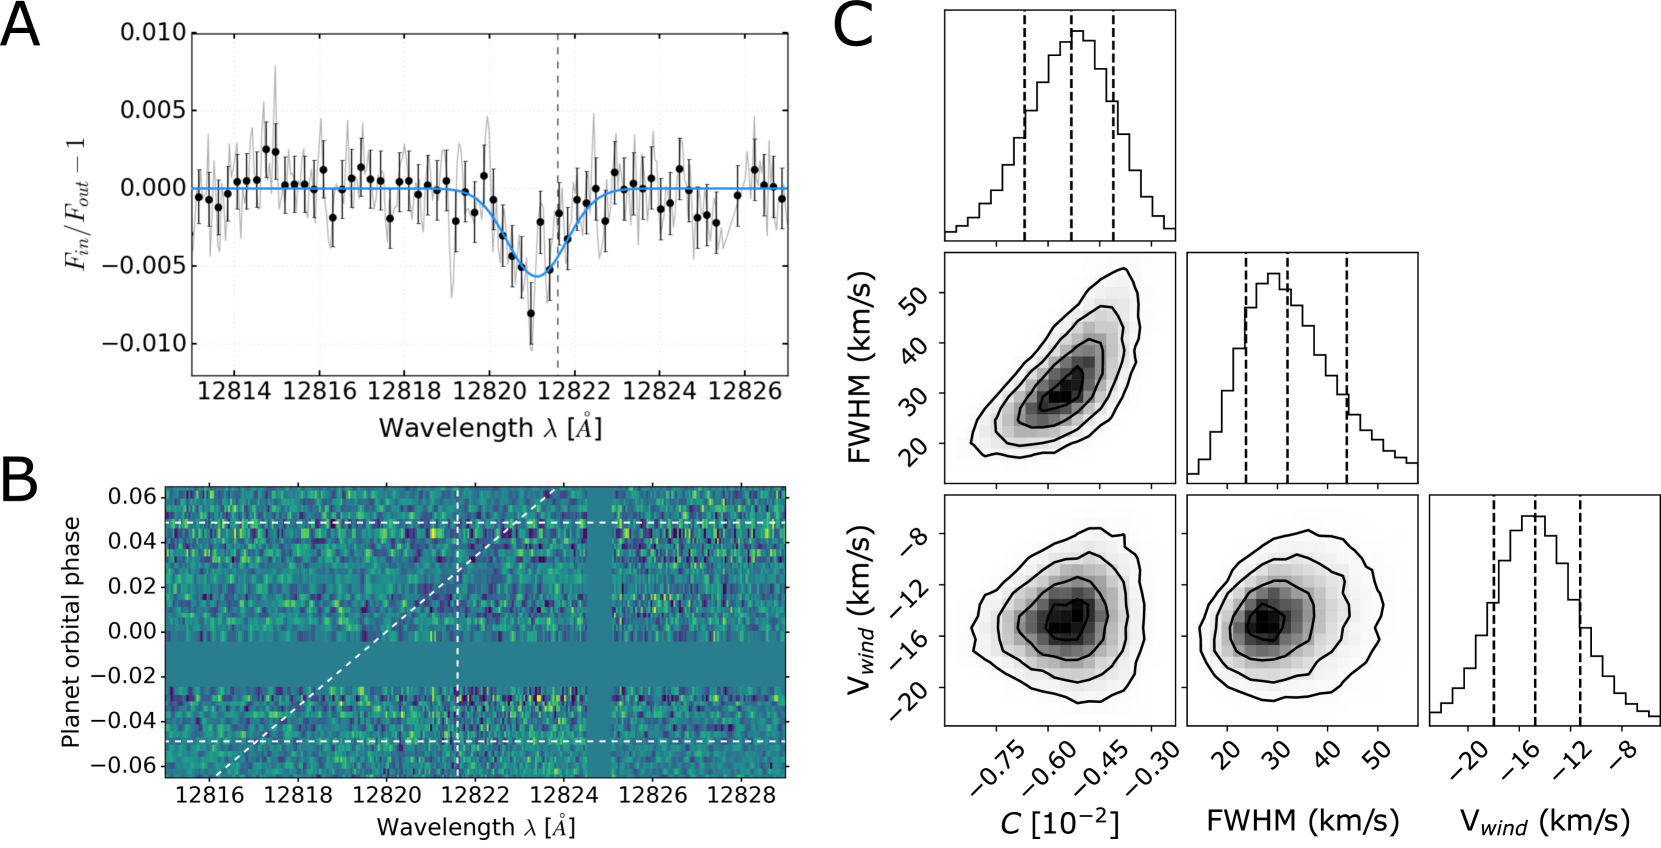
The transmission spectrum shows evidence of hydrogen absorption in the Pa line in the atmosphere of KELT-9 b (see Fig. 2 and Table 1). The retrieved Gaussian fit presents a contrast, , of (0.53 )%, which corresponds to a 4.2 detection, above the usually assumed 3 threshold. In order to further assess the signal’s significance, we compared the goodness-of-fit of the retrieved model with that of a flat line (i.e., no signal in the normalized transmission spectrum). We were able to exclude the no-signal hypothesis with a 6, implying significant evidence for the presence of a real signal in our data. Indeed, the trail originating the observed signal in the transmission spectrum can be seen in Fig. 2B, close to the expected exoplanet velocities during the observations.
| Parameter | Value | Reference |
|---|---|---|
| Physical parameters | Gaudi et al. (2017) | |
| R⋆ | 2.178 0.011 R⊙ | |
| M⋆ | 1.978 0.023 M⊙ | |
| T | 10170 450 K | |
| RP | 1.783 0.009 RJ | |
| MP | 2.44 0.70 MJ | |
| Transit parameters | Gaudi et al. (2017) | |
| T0 | 2457095.68572 0.00014 BJD | |
| 1.4811235 0.0000011 d | ||
| 0.0346 0.001 au | ||
| 86.79 0.25 ° | ||
| Radial velocities | Gaudi et al. (2017) | |
| K⋆ | 276 79 m s-1 | |
| KP | 234.24 0.90 km s-1 | Hoeijmakers et al. (2019) |
| 17.74 0.11 km s-1 | Hoeijmakers et al. (2019) | |
| H analysis | Yan & Henning (2018) | |
| (1.15 0.05)% | ||
| FWHM | 51.2 km s-1 | |
| 1.02 km s-1 | ||
| Pa analysis | This work | |
| (0.53 )% | ||
| FWHM | 31.9 km s-1 | |
| 14.8 km s-1 |
The Pa absorption feature presents a blueshifted of 14.8 km s-1 and a FWHM of 31.9 km s-1, indicative of hydrogen atoms moving toward the observer and significant broadening of the line profile, respectively (see Table 1). We note that this FWHM includes significant contributions from rotational and instrumental broadening, 16 and 3 km s-1, respectively, in addition to slight orbital blurring. For comparison, the line profile of H obtained in Yan & Henning (2018), who also used the optical CARMENES data from August 6, 2017, is slightly broader, with a FWHM of 51.2 km s-1 and no indications of day-to-night winds (see Table 1). Thus, the blueshift observed in Pa is difficult to reconcile with the planet’s rest-frame position of H discussed above, and of other atmospheric signatures detected in transmission by Hoeijmakers et al. (2019) and Wyttenbach et al. (2020). It is important to caution that the values for the velocity of the KELT-9 planetary system () found in the literature are somewhat discrepant, being 17.74 0.11 km s-1 in Hoeijmakers et al. (2019) (the value adopted here) but 20.6 0.1 km s-1 in Gaudi et al. (2017). This introduces a shift in our retrieved , and we find it to be 11.3 km s-1 when using the value from Gaudi et al. (2017) (see also the discussion in Hoeijmakers et al., 2019).
Regardless of the different values, the observed blueshift (at 4.5 for the reference 17.74 0.11 km s-1) still suggests that the atmospheric regions contributing to the observed Pa absorption are different from those of other excited states of hydrogen. We propose that the H(3) H(5) line observed here is probing lower terminator altitudes ( 1.3 RP) than the H(2) H(3) absorption feature, which is reported to originate at 1.6 RP in earlier works (Yan & Henning, 2018; Cauley et al., 2019; Wyttenbach et al., 2020). The higher pressures favor the H(3) H(2), H(1) lines remaining optically thick. That is, the smaller population losses of H(3) by spontaneous emission to the lower-energy levels facilitate the buildup of moderately high H(3) densities. In this interpretation, the blueshift we observe could be explained by a day-to-nightside atmospheric flow. Global circulation models applied to UHJs suggest that a day-to-nightside wind could be possible in the terminator of KELT-9 b at low pressures (see, e.g., Tan & Komacek, 2019; Wong et al., 2020), but the high wind speed we retrieved is not predicted by these models.
An alternative explanation is that Pa absorption may originate in the atomic hydrogen escaping KELT-9 b, resembling a comet-like tail flowing toward the observer (e.g., along the star-planet axis). This scenario is in principle more unlikely, as the tail densities are expected to be much lower than those of the upper atmosphere. As a result, the H(3) abundance might be too low for detection as the H(3) H(2), H(1) lines are optically thinner. However, Cauley et al. (2019) propose that small stellar flares arising, for instance, from the star-planet magnetic-field interactions might result in extreme atmospheric expansion events. Although the occurrence of this mechanism is still uncertain for KELT-9, this hypothesis was supported by the P-Cygni-like profiles the authors observed for H, H, Mg I, and Fe II. Such events could result in significantly higher than expected mass-loss rates and densities building up in a relatively narrow tail of escaping gas. It is worth recalling that the P-Cygni-like profiles observed in Cauley et al. (2019) were not reported for H in Yan & Henning (2018) during the night we analyzed, and we did not detect any Pa absorption in the post-transit spectra either. However, a recent event at the time of the observations might have significantly expanded the upper atmosphere, potentially enhancing Pa detectability. In this case, its blueshift might be explained as being due to the interaction with the radiation pressure (see, e.g., Bourrier et al., 2016; Spake et al., 2018; Cauley et al., 2019), with no significant day-to-nightside circulation being required in the planet. Under this hypothesis, additional observations could reveal variability in the Pa absorption depth, which would be expected if the density of the escaping gas changed significantly during an event and shortly after.
We note that a tendency toward stronger, blueshifted winds and smaller FWHMs (compared to H) is hinted at for weaker lines of the Balmer series in KELT-9 b in Wyttenbach et al. (2020) (see their Table 3). Specifically, the authors reported a blueshift in the H line (H(2) H(6) transition, 4.5 detection) of 4.6 2.2 km s-1. Unfortunately, the H (H(2) H(7) transition) line significance in Wyttenbach et al. (2020) is just below the detection threshold (2.9), but they reported a blueshift of 15.0 5.0 km s-1, which is fully consistent with our result. This might indicate that these lines probe similar regions as Pa, but more data are needed to either confirm or refute this hypothesis.
Regarding the FWHM of the different hydrogen absorptions, the broad line profile observed for H in Yan & Henning (2018), Cauley et al. (2019), and Wyttenbach et al. (2020) cannot be explained by thermal broadening only, as this is about 25 km s-1 at the thermospheric temperature Wyttenbach et al. (2020) retrieved ( 13200 K). This is indicative of the H line being optically thick or forming in a region where the gas is expanding radially at high velocity (García Muñoz & Schneider, 2019). However, considering the uncertainty intervals, thermal broadening could explain the Pa profile obtained here, with no need for a high radial velocity. Future 3D retrievals of wind patterns in KELT-9 b might shed more light onto the widths and Doppler shifts of the observed Pa and H lines, which might also have contributions from convective layers, as has been observed for other UHJs (see, e.g., Seidel et al., 2021).
4 Conclusions
Extremely irradiated exoplanets are perfect astronomical laboratories for searching for spectral features that reveal key information about exoplanet atmospheric temperatures, dynamics, and mass-loss processes. We analyzed CARMENES high-resolution transit observations of the hottest UHJ known to date, KELT-9 b, in a search for hydrogen absorption in the strongest Paschen-series line covered by the instrument’s near-infrared channel (Pa, 12821.6 ). By applying the transmission spectroscopy technique, we observed a Pa signal around the expected planet velocities with respect to the Earth during the transit. This is the first time this signal has been observed in an UHJ, although it has been widely studied in stellar and young companion atmospheres. As the opacities of the Balmer and Paschen series of lines are expected to be different, H and Pa could be probing a significantly different altitude range in the terminator of KELT-9 b. Therefore, our detection expands the available sample of useful lines for exploring the atmosphere of the hottest exoplanet known.
From the retrieved line’s FWHM and blueshift, we propose that this signal could be probing lower atmospheric layers than H, as the higher-density layers greatly favor a longer lifetime of the H(3) population. In this interpretation, the smaller temperature of the lower thermospheric layers and a weaker radial component of the wind would explain the slightly smaller FWHM of Pa when compared to that of H. In addition, the blueshift observed reveals a strong day-to-night velocity component at the atmospheric layers probed. This wind is not observed with the strongest Balmer lines, although it is hinted at for H and H in previous studies. Alternatively, the origin of Pa absorption could be in the escaping gas moving toward the observer, accelerated by radiation pressure. Although the small tail densities make it difficult to form a detectable abundance of H(3), the latter might be enhanced if flaring events arising from star-planet magnetic-field interactions proposed in earlier studies are confirmed in future observations.
Therefore, detailed modeling of the H(3) population in this planet is needed so as to accurately constrain the expected atmospheric layers probed with Pa. Future observations under better weather conditions will be needed to reproduce this signal and study possible variability associated with potential flaring events, and in turn provide stronger constrains for future theoretical studies of the complex 3D nature of UHJ atmospheres. Moreover, additional transit observations could be used to search for additional lines in the Paschen series, of which Pa (H(3) H(6), 10941.1 ) is the strongest one in a relatively transparent telluric region.
Acknowledgements.
We acknowledge funding from the European Research Council under the European Union’s Horizon 2020 research and innovation program under grant agreement No 694513. IAA-CSIC authors acknowledge financial support from the Agencia Estatal de Investigación of the Ministerio de Ciencia, Innovación y Universidades through projects Ref. PID2019-110689RB-I00/AEI/10.13039/501100011033 and the Centre of Excellence “Severo Ochoa” award to the Instituto de Astrofísica de Andalucía (SEV-2017-0709). This research has made use of the Spanish Virtual Observatory (http://svo.cab.inta-csic.es) supported by the MINECO/FEDER through grant AyA2017-84089.7.References
- Allart et al. (2019) Allart, R., Bourrier, V., Lovis, C., et al. 2019, Astronomy & Astrophysics, 623, A58
- Allart et al. (2018) Allart, R., Bourrier, V., Lovis, C., et al. 2018, Science, 362, 1384
- Alonso-Floriano et al. (2019) Alonso-Floriano, F. J., Snellen, I. A., Czesla, S., et al. 2019, Astronomy & Astrophysics, 629, A110
- Arcangeli et al. (2018) Arcangeli, J., Désert, J.-M., Line, M. R., et al. 2018, The Astrophysical Journal Letters, 855, L30
- Baraffe et al. (2009) Baraffe, I., Chabrier, G., & Gallardo, J. 2009, The Astrophysical Journal, 702, L27
- Bell & Cowan (2018) Bell, T. J. & Cowan, N. B. 2018, The Astrophysical Journal Letters, 857, L20
- Biller & Bonnefoy (2018) Biller, B. & Bonnefoy, M. 2018, Handbook of Exoplanets ed HJ Deeg and JA Belmonte
- Borsa et al. (2021) Borsa, F., Fossati, L., Koskinen, T., Young, M. E., & Shulyak, D. 2021, Nature Astronomy, 1
- Bourrier et al. (2016) Bourrier, V., Des Etangs, A. L., Ehrenreich, D., Tanaka, Y., & Vidotto, A. A. 2016, Astronomy & Astrophysics, 591, A121
- Buchner (2016) Buchner, J. 2016, Astrophysics Source Code Library, ascl
- Buchner et al. (2014) Buchner, J., Georgakakis, A., Nandra, K., et al. 2014, Astronomy & Astrophysics, 564, A125
- Caballero et al. (2016) Caballero, J., Guàrdia, J., del Fresno, M. L., et al. 2016, in Observatory operations: strategies, processes, and systems VI, Vol. 9910, International Society for Optics and Photonics, 99100E
- Casasayas-Barris et al. (2021) Casasayas-Barris, N., Orell-Miquel, J., Stangret, M., et al. 2021, Astronomy & Astrophysics, 654, A163
- Casasayas-Barris et al. (2018) Casasayas-Barris, N., Pallé, E., Yan, F., et al. 2018, Astronomy & Astrophysics, 616, A151
- Casasayas-Barris et al. (2019) Casasayas-Barris, N., Pallé, E., Yan, F., et al. 2019, Astronomy & Astrophysics, 628, A9
- Cauley et al. (2019) Cauley, P. W., Shkolnik, E. L., Ilyin, I., et al. 2019, The Astronomical Journal, 157, 69
- Cont et al. (2021) Cont, D., Yan, F., Reiners, A., et al. 2021, Astronomy & Astrophysics, 651, A33
- Cont et al. (2022) Cont, D., Yan, F., Reiners, A., et al. 2022, Astronomy & Astrophysics, 657, L2
- Czesla et al. (2022) Czesla, S., Lampón, M., Sanz-Forcada, J., et al. 2022, Astronomy & Astrophysics, 657, A6
- Dos Santos et al. (2020) Dos Santos, L. A., Ehrenreich, D., Bourrier, V., et al. 2020, Astronomy & Astrophysics, 640, A29
- Ehrenreich & Désert (2011) Ehrenreich, D. & Désert, J.-M. 2011, Astronomy & Astrophysics, 529, A136
- Ehrenreich et al. (2020) Ehrenreich, D., Lovis, C., Allart, R., et al. 2020, Nature, 580, 597
- Feroz et al. (2009) Feroz, F., Hobson, M., & Bridges, M. 2009, Monthly Notices of the Royal Astronomical Society, 398, 1601
- Fossati et al. (2021) Fossati, L., Young, M., Shulyak, D., et al. 2021, Astronomy & Astrophysics, 653, A52
- Fulton et al. (2017) Fulton, B. J., Petigura, E. A., Howard, A. W., et al. 2017, The Astronomical Journal, 154, 109
- García Muñoz (2007) García Muñoz, A. 2007, Planetary and Space Science, 55, 1426
- García Muñoz & Schneider (2019) García Muñoz, A. & Schneider, P. 2019, The Astrophysical Journal Letters, 884, L43
- Gaudi et al. (2017) Gaudi, B. S., Stassun, K. G., Collins, K. A., et al. 2017, Nature, 546, 514
- Hoeijmakers et al. (2018) Hoeijmakers, H. J., Ehrenreich, D., Heng, K., et al. 2018, Nature, 560, 453
- Hoeijmakers et al. (2019) Hoeijmakers, H. J., Ehrenreich, D., Kitzmann, D., et al. 2019, Astronomy & Astrophysics, 627, A165
- Jin & Mordasini (2018) Jin, S. & Mordasini, C. 2018, The Astrophysical Journal, 853, 163
- Kausch et al. (2015) Kausch, W., Noll, S., Smette, A., et al. 2015, Astronomy & Astrophysics, 576, A78
- Kesseli & Snellen (2021) Kesseli, A. Y. & Snellen, I. 2021, The Astrophysical Journal Letters, 908, L17
- Kesseli et al. (2022) Kesseli, A. Y., Snellen, I., Casasayas-Barris, N., Mollière, P., & Sánchez-López, A. 2022, The Astronomical Journal, 163, 107
- Kirk et al. (2020) Kirk, J., Alam, M. K., López-Morales, M., & Zeng, L. 2020, The Astronomical Journal, 159, 115
- Kreidberg & Oklopčić (2018) Kreidberg, L. & Oklopčić, A. 2018, Research Notes of the American Astronomical Society, 2, 44
- Krishnamurthy et al. (2021) Krishnamurthy, V., Hirano, T., Stefánsson, G., et al. 2021, The Astronomical Journal, 162, 82
- Lampón et al. (2021a) Lampón, M., López-Puertas, M., Czesla, S., et al. 2021a, Astronomy & Astrophysics, 648, L7
- Lampón et al. (2020) Lampón, M., López-Puertas, M., Lara, L. M., et al. 2020, Astronomy & Astrophysics, 636, A13
- Lampón et al. (2021b) Lampón, M., López-Puertas, M., Sanz-Forcada, J., et al. 2021b, Astronomy & Astrophysics, 647, A129
- Landman et al. (2021) Landman, R., Sánchez-López, A., Mollière, P., et al. 2021, Astronomy & Astrophysics, 656, A119
- Lavigne et al. (2009) Lavigne, J.-F., Doyon, R., Lafreniere, D., Marois, C., & Barman, T. 2009, The Astrophysical Journal, 704, 1098
- Linsky et al. (2010) Linsky, J. L., Yang, H., France, K., et al. 2010, The Astrophysical Journal, 717, 1291
- Lopez et al. (2012) Lopez, E. D., Fortney, J. J., & Miller, N. 2012, The Astrophysical Journal, 761, 59
- Mansfield et al. (2018) Mansfield, M., Bean, J. L., Oklopčić, A., et al. 2018, The Astrophysical Journal Letters, 868, L34
- Mansfield et al. (2020) Mansfield, M., Bean, J. L., Stevenson, K. B., et al. 2020, The Astrophysical Journal Letters, 888, L15
- Ninan et al. (2020) Ninan, J. P., Stefansson, G., Mahadevan, S., et al. 2020, The Astrophysical Journal, 894, 97
- Nortmann et al. (2018) Nortmann, L., Pallé, E., Salz, M., et al. 2018, Science, 362, 1388
- Orell-Miquel et al. (2022) Orell-Miquel, J., Murgas, F., Pallé, E., et al. 2022, Astronomy & Astrophysics, 659, A55
- Palle et al. (2020) Palle, E., Nortmann, L., Casasayas-Barris, N., et al. 2020, Astronomy & Astrophysics, 638, A61
- Parmentier et al. (2018) Parmentier, V., Line, M. R., Bean, J. L., et al. 2018, Astronomy & Astrophysics, 617, A110
- Pino et al. (2020) Pino, L., Désert, J.-M., Brogi, M., et al. 2020, The Astrophysical Journal Letters, 894, L27
- Quirrenbach et al. (2016) Quirrenbach, A., Amado, P., Caballero, J., et al. 2016, in Ground-based and Airborne Instrumentation for Astronomy VI, Vol. 9908, International Society for Optics and Photonics, 990812
- Quirrenbach et al. (2018) Quirrenbach, A., Amado, P. J., Ribas, I., et al. 2018, in Ground-based and Airborne Instrumentation for Astronomy VII, Vol. 10702, International Society for Optics and Photonics, 107020W
- Salz et al. (2016a) Salz, M., Czesla, S., Schneider, P., & Schmitt, J. 2016a, Astronomy & Astrophysics, 586, A75
- Salz et al. (2018) Salz, M., Czesla, S., Schneider, P. C., et al. 2018, Astronomy & Astrophysics, 620, A97
- Salz et al. (2016b) Salz, M., Schneider, P., Czesla, S., & Schmitt, J. 2016b, Astronomy & Astrophysics, 585, L2
- Sánchez-López et al. (2022) Sánchez-López, A., Landman, R., Mollière, P., et al. 2022, Astronomy & Astrophysics, 661, A78
- Savel et al. (2022) Savel, A. B., Kempton, E. M.-R., Malik, M., et al. 2022, The Astrophysical Journal, 926, 85
- Seidel et al. (2021) Seidel, J., Ehrenreich, D., Allart, R., et al. 2021, Astronomy & Astrophysics, 653, A73
- Seidel et al. (2019) Seidel, J., Ehrenreich, D., Wyttenbach, A., et al. 2019, Astronomy & Astrophysics, 623, A166
- Seifahrt et al. (2007) Seifahrt, A., Neuhäuser, R., & Hauschildt, P. 2007, Astronomy & Astrophysics, 463, 309
- Smette et al. (2015) Smette, A., Sana, H., Noll, S., et al. 2015, Astronomy & Astrophysics, 576, A77
- Spake et al. (2018) Spake, J. J., Sing, D. K., Evans, T. M., et al. 2018, Nature, 557, 68
- Tan & Komacek (2019) Tan, X. & Komacek, T. D. 2019, The Astrophysical Journal, 886, 26
- Turner et al. (2020) Turner, J. D., De Mooij, E. J., Jayawardhana, R., et al. 2020, The Astrophysical Journal Letters, 888, L13
- Vissapragada et al. (2020) Vissapragada, S., Knutson, H. A., Jovanovic, N., et al. 2020, The Astronomical Journal, 159, 278
- Wardenier et al. (2021) Wardenier, J., Parmentier, V., Lee, E., Line, M., & Gharib-Nezhad, E. 2021, Monthly Notices of the Royal Astronomical Society, 506, 1258
- Wong et al. (2020) Wong, I., Shporer, A., Kitzmann, D., et al. 2020, The Astronomical Journal, 160, 88
- Wyttenbach et al. (2020) Wyttenbach, A., Mollière, P., Ehrenreich, D., et al. 2020, Astronomy & Astrophysics, 638, A87
- Yan et al. (2019) Yan, F., Casasayas-Barris, N., Molaverdikhani, K., et al. 2019, Astronomy & Astrophysics, 632, A69
- Yan et al. (2015) Yan, F., Fosbury, R. A., Petr-Gotzens, M. G., Zhao, G., & Pallé, E. 2015, Astronomy & Astrophysics, 574, A94
- Yan & Henning (2018) Yan, F. & Henning, T. 2018, Nature Astronomy, 2, 714
- Zechmeister et al. (2014) Zechmeister, M., Anglada-Escudé, G., & Reiners, A. 2014, Astronomy & Astrophysics, 561, A59
- Zhang et al. (2022) Zhang, M., Knutson, H. A., Wang, L., Dai, F., & Barragán, O. 2022, The Astronomical Journal, 163, 67
Appendix A molecfit correction around Pa