The SPAN512 mid-latitude pulsar survey
Abstract
Context. The large number of ongoing surveys for pulsars and transients at various radio observatories is motivated by the science obtained from these sources. Timing and polarisation analysis of relativistic binaries can place strong constraints on theories of gravity. The observation of a growing number of millisecond pulsars (MSPs) spread over the celestial sphere may allow the detection of a stochastic gravitational wave background arising from supermassive black hole binaries. A more complete sample of young pulsars improves our knowledge of neutron star birth and evolution. Transients such as fast radio bursts can serve to probe the intergalactic medium.
Aims. The SPAN512 pulsar survey covers intermediate Galactic latitudes using the L-band receiver of the Nançay Radio Telescope (NRT). The survey covers 224 sq. deg. of the sky for a total exposure time of 2200 h. Population syntheses predict the discovery of 3 to 19 new normal pulsars and a few MSPs.
Methods. We present detailed modelling of the NRT beam with its L-band receiver and its sensitivity which we used to precisely assess the expected survey yield. We used the flexible Pulsar Arecibo L-band Feed Array data processing pipeline to search the 47 TB of SPAN512 data for pulsars and transients.
Results. The SPAN512 survey discovered two new MSPs and one new middle-aged pulsar. We focus on the analysis of the 2.4-ms spin period pulsar J22056012 for which we also report the detection of gamma-ray pulsations. Its narrow pulse width (s at an observing frequency of 2.55 GHz) allows for sub-microsecond timing precision over 8 years, with exciting prospects for pulsar timing array programs.
Key Words.:
(Stars:) pulsars: individual PSR J2205+6012 – Stars: neutron – gamma rays: star – telescopes1 Introduction
Pulsars are highly magnetised neutron stars with spin periods ranging from a few milliseconds to a few tens of seconds that emit radio waves seen as a succession of radio pulses for an observatory located on the Earth. Since the fortuitous discovery of the first pulsar (Hewish et al., 1968), numerous radio surveys carried out in the last four decades have unveiled over 3200 pulsars (as reported by the ATNF Pulsar Catalogue v1.66111https://www.atnf.csiro.au/research/pulsar/psrcat/ early 2022; Manchester et al., 2005), with about 35% discovered by the successful Parkes Multibeam Pulsar Survey (PMPS; Manchester et al., 2001). Of these, around in the Galactic field have a spin period of less than 20 ms (called millisecond pulsars; MSPs)222http://astro.phys.wvu.edu/GalacticMSPs/GalacticMSPs.txt. A further 200 or more MSPs reside in globular clusters333https://www3.mpifr-bonn.mpg.de/staff/pfreire/GCpsr.html.
Large pulsar surveys are still being conducted because of the wealth of information that can be extracted from pulsar observations. Most notably, the pulsar timing technique consists of measuring the pulse times of arrival (TOAs) recorded at an observatory. A model for the pulsar rotation and the signal propagation from the pulsar to the observatory is then fitted to the TOAs. The discovery and subsequent monitoring of relativistic binary systems can yield the strongest constraints on theories of gravity (PSRs J07373039A/B, J03371715; Kramer et al., 2021; Voisin et al., 2020), on the equation of state for dense matter (PSRs J03480432, J0740+6620; Antoniadis et al., 2013; Raaijmakers et al., 2021), and on the physics of the pulsar radio beam (PSR J19060746; Desvignes et al., 2019). Discovering new radio pulsars helps characterise unidentified gamma-ray sources and pulsar contributions to the Galactic high-energy diffuse emission (Smith et al., 2019).
An ensemble of MSPs spread over the celestial sphere has the potential to directly detect the stochastic gravitational wave background (GWB) generated by a population of supermassive black hole binaries (Sazhin, 1978; Detweiler, 1979; Foster & Backer, 1990). Pulsar timing arrays (PTAs) in Australia (Kerr et al., 2020), Europe (Desvignes et al., 2016), and North America (Alam et al., 2021) have been established to pursue this effort. FERMI-LAT Collaboration et al. (2022) recently demonstrated that gamma-ray timing usefully complements the radio campaigns. These individual PTAs have also combined their efforts to form the International PTA (IPTA) (Perera et al., 2019), later joined by the Indian PTA (Paul et al., 2019) and Chinese PTA (Lee, 2016). A key way to improve a PTA’s sensitivity is to increase the number of MSPs, , suitable for inclusion in the data analysis because the signal-to-noise ratio (S/N) for the detection of the GWB S/N. Such MSPs are characterised by a timing precision of s over several years and decades (Siemens et al., 2013).
The high time and frequency resolution of the pulsar survey data has also enabled the fortuitous discovery of fast radio bursts (FRBs), which are bright and short-duration bursts of extragalactic origin. Some FRBs are seen to repeat and some (but not only repeating FRBs) have been localised to their host galaxy, potentially serving as cosmological probes (for a review, see e.g. Cordes & Chatterjee, 2019).
Pulsar surveys are underway (or were recently conducted) at almost every major radio facility and at various observing frequencies. Near 1.4 GHz, the list includes the High Time Resolution Universe (HTRU) South (Keith et al., 2010) and the SUrvey for Pulsars and Extragalactic Radio Bursts (SUPERB; Keane et al., 2018) with the Parkes radio telescope. HTRU North (Barr et al., 2013) is carried out with the Effelsberg radio telescope. The Pulsar Arecibo L-band Feed Array (P-ALFA) survey (Cordes et al., 2006; Lazarus et al., 2015) with the Arecibo radio telescope was the most sensitive large-scale survey of the Galactic plane until it was superseded by the Five-hundred-meter Aperture Spherical radio Telescope (FAST) Galactic Plane Pulsar Snapshot survey (Han et al., 2021). The unfortunate collapse of Arecibo at the end of 2020 halted the observations with about 30% of the observing towards the inner Galaxy left to be done (Parent et al., 2022). More recently, the Max-Planck-Institut für Radioastronomie Galactic Plane Survey started a 3000h pulsar survey with the MeerKAT radio telescope (Padmanabh et al., in prep). Other large-scale surveys at lower frequencies include the Green Bank North Celestial Cap (GBNCC) pulsar survey near 350 MHz (Stovall et al., 2014) and the Canadian Hydrogen Intensity Mapping Experiment (CHIME) FRB collaboration between 400 and 800 MHz (Good et al., 2021).
At the Nançay Radio Telescope (NRT), a pulsar survey of the Galactic plane was performed at the end of the 90s (Foster et al., 1997) using the now decommissioned Navy Berkeley Pulsar Processor. This survey led to the discovery of two new young pulsars (Theureau et al., 2011). The NRT has also searched for pulsars in Fermi Large Area Telescope (LAT) gamma-ray sources (Desvignes, 2009; Cognard et al., 2011; Guillemot et al., 2012). We report here on the intermediate latitude SPAN512 pulsar survey with the NRT that began in 2012, exploiting the Nançay Ultimate Pulsar Processing Instrument (NUPPI) backend (Desvignes et al., 2011).
2 Observations
2.1 The Nançay radio telescope
The SPAN512 pulsar survey was carried out at L-Band (defined as the 1 to 2 GHz part of the electromagnetic spectrum) with the NRT, a transit telescope of Kraus design oriented north-south, between 2012 and 2016. The sky coverage (, and , ) is delimited towards the inner Galaxy by the more sensitive P-ALFA survey (Cordes et al., 2006; Lazarus et al., 2015) and excludes the Galactic plane covered by the HTRU-North low-latitude survey (Barr et al., 2013).
The observations use the NRT low-frequency receiver tuned to a central frequency of 1.466 GHz, where the system temperature is K, the nominal gain is K Jy-1 and the half-power beam width (HPBW) is roughly (in Right Ascension ) by (in Declination ) for . The NRT can observe any source with . But owing to its specific design, for , the illuminated area of the mirrors, and therefore the gain , decreases with higher source declination. can be approximated by
| (1) |
Conversely, the HPBW increases along the direction,
| (2) |
Figure 1 illustrates both effects, showing that the telescope gain is reduced by half at high declinations. A focal carriage houses the receivers, and moves along a 100m track, allowing the NRT to follow sources for about one hour (up to two hours for sources with high declination). During source tracking, the parallactic rotation of the NRT beam is given by
| (3) |
where HA is the hour angle of the target on the sky (the angle in the east-west direction between the meridian and the source).
Figure 2 illustrates the NRT beam pattern and the effect of parallactic rotation at a frequency of 1.47 GHz for three different declinations. The higher the declination, the more elongated and less sensitive the beam. For high declinations and large hour angles (, ), the parallactic rotation of the elongated beam becomes significant. To mitigate the effects of parallactic rotation of the SPAN512 observations and maintain a more uniform gridding of the sky, we scheduled observations such that .

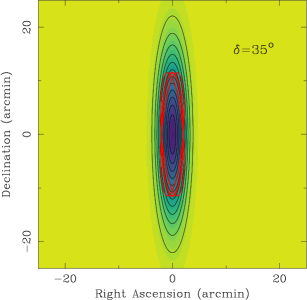
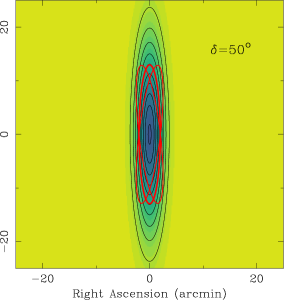
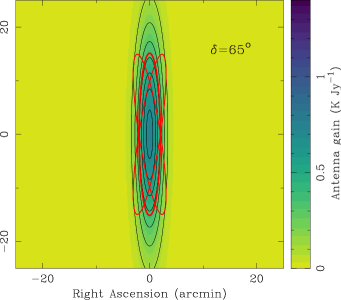
Figure 3 shows the SPAN512 survey sky coverage, with a total of 6034 pointings. Figure 4 details a small region. The pointing grid design assumes an idealised rectangular beam with dimensions corresponding to the HPBW in and . The idealised beam assumes observations near the meridian and therefore neglects parallactic beam rotation. The detailed direction-dependent beam response was studied during the preparation of this article, revealing greater sensitivity variations than intended. A few known pulsars were therefore not re-detected by the survey, as is discussed in Section . Section uses the true observational grid in comparing our pulsar detections with expectations.
2.2 Observing setup
The data are recorded with the versatile NUPPI backend (Desvignes et al., 2011) based on a CASPER444https://casper.berkeley.edu ROACH555Reconfigurable Open Architecture Computing Hardware. board. For each of the two linear polarisations, a 512 MHz bandwidth is first digitised using 8-bit analogue-to-digital converters. Then an 8-tap polyphase filter bank using a Hamming window function implemented in the Xilinx Virtex 5 field-programmable gate array (FPGA) splits the band into 1024 channels. Chunks of contiguous 64 MHz baseband data are sent to four servers equipped with two Graphics Processing Units (GPUs) each.
There, the NUPPI software, adapted from the Green Bank Ultimate Pulsar Processing Instrument (GUPPI) software, is used to detect the signals from the two linear complex polarisations (i.e. sum the polarisation to form Stokes I) and to average in time every 64 s before writing the data in PSRFITS 4-bit search mode format. The MHz sub-bands are later merged together using a modified version of psrfits_utils666https://github.com/demorest/psrfits_utils. The total expected amount of data for the survey was therefore around 53 TB.
The minimum flux density of a pulsar with spin period detectable by the SPAN512 survey can be written as
| (4) |
where denote the pulse signal-to-noise ratio (S/N), sky and system temperature contributions, the number of polarisations summed, the duration of the observation, the observing bandwidth, and the effective pulse width of the pulsar, respectively. Here we take , K, , MHz, and assume a pulse duty-cycle . As this survey was designed to achieve a sensitivity at the lowest pointing Declination of SPAN512 (, K Jy-1) of mJy, which is similar to the HTRU-North low-latitude survey, was set to 18 min. As is constant across all pointings, increases to 0.086 mJy for the pointings of highest Declination ( K Jy-1).
Observations started in early 2012 and stopped in June 2016. During that time, 5412 unique sky pointings were acquired making the survey 89.7% complete. Table 1 summarises the survey characteristics and Figure 3 shows the survey sky coverage.
| Parameter | Value |
|---|---|
| Bandwidth, (MHz) | 512 |
| Number of channels, | 1024 |
| Channel bandwidth, (MHz) | 0.5 |
| Centre frequency, (MHz) | 1466 |
| Sampling time, (s) | 64 |
| Observation length, (min) | 18 |
| Sensitivity, to , (mJy) | to |
| Sky temperature, (K) | 5 |
| System temperature, (K) | 30 |
| Sky area (sq. deg) | 224 |
| Number of grid pointings | 6034 |
| Number of observed pointings | 5412 |
| Completeness of the observations | 89.7% |
| Completeness of the processing | 100% |
3 Survey processing
To analyse the PSRFITS search data, we use the PRESTO-based (Ransom et al., 2003) pipeline developed for processing the P-ALFA survey and described in Lazarus et al. (2015). Below we detail the processing steps specific to the SPAN512 survey.
3.1 Radio frequency interferences excision
The initial processing step is to clean the data to remove narrow-band radio frequency interference (RFI) with the rfifind tool from the PRESTO package. The median value of the percentage of data masked is 12%, with a standard deviation of . The 17 pointings with a percentage of masked data above 30% were marked for reobservation and 15 of these pointings were reobserved and processed.
3.2 Dispersion removal
To detect pulsars with a priori unknown dispersion measure (DM), that is, the integrated free electron column density along the line of sight, we mitigate the frequency-dependent dispersive delay by shifting the frequency channels using a wide range of DM trials. We set the maximum value of DM to 3000 pc cm-3, which is ten times the maximum value predicted by the NE2001 model (Cordes & Lazio, 2002) of the Galactic distribution of free electrons for the different lines of sight of the SPAN512 survey. By doing this, we can account for some DM excess due to, for example, the presence of a H region on our line of sight and remain sensitive to high-DM extragalactic fast radio bursts (FRBs). The time resolution of the data decreases by a power-of-two downsampling factor when the dispersive smearing inside a single channel exceeds the sample duration. The spacing between two neighbouring DM trials, , must be limited such that the dispersive smearing for a DM value halfway between two trial values is less than the sample duration. Table 2 lists the de-dispersion plan computed with the PRESTO script DDplan.py used by the prepsubband program.
| DM range | Number of | Downsampling | |
|---|---|---|---|
| (pc cm-3) | (pc cm-3) | DM trials | factor |
| 0 - 180 | 0.1 | 1800 | 1 |
| 180 - 300 | 0.2 | 600 | 2 |
| 300 - 600 | 0.3 | 1000 | 4 |
| 600 - 1000 | 0.5 | 800 | 8 |
| 1000 - 1800 | 1.0 | 800 | 16 |
| 1800 - 3000 | 3.0 | 400 | 32 |
3.3 Search
As for the P-ALFA processing, each de-dispersed time series is then searched for periodic candidates in two passes using accelsearch. The first search pass is a zero-acceleration search summing up to 16 harmonics, aimed at finding isolated pulsars or pulsars in very wide orbits. The second pass provides an acceleration search, with the fundamental harmonic being allowed to drift by up to 200 Fourier bins. To reduce computing time, the harmonic sum for this pass is restricted to only eight harmonics. Each search pass produces an independent candidate list. Only candidates with probability of not being noise (equivalent Gaussian significance) are retained in each list (Ransom et al., 2002).
3.4 Candidate folding
The candidates from each list are independently sifted to remove those that are harmonically related, keeping only the ones with highest significance within groups with similar periods, and having at least two contiguous DM detections. After sifting, for up to 150 candidates with from each list, we form pulse profiles by folding the raw PSRFITS search data at the candidate period. We find that the median of the distribution of values for the 150 folded candidate of each pointing is 7, with a median absolute deviation of 0.05. This confirms that we are unlikely to miss high-significance candidates due to RFI in the folding stage. In total, we folded approximately candidates.
3.5 Candidate ranking and visualisation
A set of ratings is applied to all folded candidates, including the Pulsar Evaluation Algorithm for Candidate Extraction (PEACE) scoring software (Lee et al., 2013) and the Pulsar Image-based Classification System (PICS) neural-network based artificial intelligence (AI), trained with P-ALFA candidates (Zhu et al., 2014). P-ALFA and SPAN512 candidates have similar observing frequency and bandwidth, and share the same folding pipeline. Reusing a neural net trained on the candidates of a different survey may be suboptimal, but the SPAN512 survey did not redetect enough known pulsars to retrain it. The metadata of all candidates are stored in a NoSQL MongoDB database for ease in data mining. We developed psrhunt777https://github.com/gdesvignes/psrhunt, a Python Qt-based user interface with Matplotlib support (Hunter, 2007), to connect to the MongoDB database and identify common periodicities of radio frequency interferences across different pointings. This allowed us to skim more efficiently through the best candidates, similar to the reaper (Faulkner et al., 2004) and jreaper software (Keith et al., 2009).
4 Results
4.1 Known pulsars
Table 3 lists 18 pulsars, 15 of which were discovered within the 224 sq. deg SPAN512 region independently of our survey. Of these 15 previously known pulsars, 4 are MSPs. PSR J21394716 is a radio-quiet pulsar discovered using Fermi LAT data (Pletsch et al., 2012). Two others (PSRs J041358 and J22066151) lie at unobserved survey grid positions. Table 3 reports the S/N for the redetection of 6 previously known pulsars and the 6 remaining known pulsars not redetected by the survey are noted.
Inspection of Figure 3 shows that all six undetected pulsars lie between or at the end of beam swaths. We used the Python notebook SPAN512-beams.ipynb available online888https://github.com/gdesvignes/SPAN512 to accurately estimate the sensitivity of the SPAN512 survey at a given sky location.
PSRs J01116624, J21155448 and J22155135 lie in between observation swathes, with estimated of respectively 0.32, 0.25, and 0.24 K Jy-1 and were not redetected. Figure 4 illustrates this for PSR J22155135. Moreover, PSR J01116624 has a nulling fraction of (Lynch et al., 2018). For these three sources, we folded the raw PSRFITS data of the closest pointing using the timing ephemeris available from the ATNF Pulsar Catalogue, but again, no pulsations were detected. PSR J220350 is a slow pulsar discovered at 350 MHz with poorly constrained localisation (Hessels et al., 2008). MSPs J032950 and J205150 were discovered at 820 MHz using the Green Bank telescope, in 30 min pointings of Fermi LAT pulsar-like unidentified gamma-ray sources (Tabassum et al., in prep). Scintillation also causes the flux of a pulsar to vary significantly, hindering detection.

The six non-detections include all four MSPs. In addition to the two MSP discoveries described below, our pipeline easily detected the fast MSPs J00300451 and J23171439 outside the survey area but observed as in the survey grid points. A problem finding fast pulsars is therefore unlikely.
In conclusion, the non-detections are explained by low fluxes, positions where the survey sensitivity is poor, or both. SPAN512 reliably detects active pulsars on the survey grid.
| PSR Name | DM | Detected | S/N | Remarks | ||||
|---|---|---|---|---|---|---|---|---|
| (deg) | (deg) | (ms) | (pc cm-3) | (mJy) | ||||
| J01116624 | 124.93 | 3.61 | 4301 | 111.2 | – | N | – | Between pointings |
| J01395814 | 129.216 | -4.044 | 272 | 73.78 | 4.6 | Y | 49 | |
| J0329+50 | 146.9 | -4.7 | 3.06 | 7.40 | – | N | – | Poor localisation |
| J041358 | 147.122 | 4.934 | 687 | 57.0 | 0.19(24)a𝑎aa𝑎aThese pulsars fluxes are measured at lower frequencies and scaled to 1.4 GHz assuming the spectral index of from Jankowski et al. (2017). For PSRs J041358, J21155448, J220350, and J22155135, we took the flux densities and observing frequencies from Sanidas et al. (2019), Sanpa-Arsa (2016), Sanidas et al. (2019), and Hessels et al. (2011), respectively, as we noted discrepancies with the values reported in the ATNF Pulsar Catalogue. | – | – | Position not observed |
| J20274557 | 83.358 | 4.394 | 1099 | 229.59 | 1.34 | Y | 140 | |
| J20475029 | 89.057 | 4.376 | 446 | 107.68 | 0.38 | Y | 10.7 | |
| J20484951 | 88.669 | 3.854 | 568 | 222.8 | 0.12(1) | Y | 15 | SPAN512 discovery |
| J2051+50 | 89.7 | 4.1 | 1.68 | 61.00 | – | N | – | Poor localisation |
| J20553829 | 80.615 | -4.260 | 2.09 | 91.83 | 0.10 (4) | Y | 9 | SPAN512 discovery |
| J21155448 | 95.043 | 4.109 | 2.60 | 77.4 | 0.51(22)a𝑎aa𝑎aThese pulsars fluxes are measured at lower frequencies and scaled to 1.4 GHz assuming the spectral index of from Jankowski et al. (2017). For PSRs J041358, J21155448, J220350, and J22155135, we took the flux densities and observing frequencies from Sanidas et al. (2019), Sanpa-Arsa (2016), Sanidas et al. (2019), and Hessels et al. (2011), respectively, as we noted discrepancies with the values reported in the ATNF Pulsar Catalogue. | N | – | Between pointings |
| J21394716 | 92.633 | -4.02 | 283 | – | – | – | – | Radio quiet |
| J220350 | 97.322 | -4.307 | 745 | 79.0 | 0.12(15)a𝑎aa𝑎aThese pulsars fluxes are measured at lower frequencies and scaled to 1.4 GHz assuming the spectral index of from Jankowski et al. (2017). For PSRs J041358, J21155448, J220350, and J22155135, we took the flux densities and observing frequencies from Sanidas et al. (2019), Sanpa-Arsa (2016), Sanidas et al. (2019), and Hessels et al. (2011), respectively, as we noted discrepancies with the values reported in the ATNF Pulsar Catalogue. | N | – | Poor localisation |
| J22056012 | 103.686 | 3.696 | 2.41 | 157.60 | 0.49(1) | Y | 14 | SPAN512 discovery |
| J22066151 | 104.735 | 4.977 | 323 | 167.0 | 0.8 | – | – | Position not observed |
| J22155135 | 99.868 | -4.159 | 2.61 | 69.2 | 0.55(41)a𝑎aa𝑎aThese pulsars fluxes are measured at lower frequencies and scaled to 1.4 GHz assuming the spectral index of from Jankowski et al. (2017). For PSRs J041358, J21155448, J220350, and J22155135, we took the flux densities and observing frequencies from Sanidas et al. (2019), Sanpa-Arsa (2016), Sanidas et al. (2019), and Hessels et al. (2011), respectively, as we noted discrepancies with the values reported in the ATNF Pulsar Catalogue. | N | – | Between pointings |
| J22296205 | 107.154 | 3.645 | 443 | 124.61 | 0.8 | Y | 36 | |
| J224463 | 109.039 | 3.618 | 461 | 92.0 | – | Y | 25 | Poor localisation |
| J23085547 | 108.729 | -4.206 | 475 | 46.54 | 1.9 | Y | 43 |
4.2 New detections
In addition to nine detections of previously known pulsars, the SPAN512 survey discovered two new MSPs PSR J20553829 and PSR J22056012, and the slow pulsar PSR J20484951. Guillemot et al. (2019) described the discovery and timing of PSR J20553829. We report the remaining two here.
Follow-up NRT observations were recorded with the NUPPI backend in regular timing observing mode (see e.g. Guillemot et al., 2019). Data postprocessing uses the PSRCHIVE pulsar software (Hotan et al., 2004; van Straten et al., 2012). The data are calibrated in polarisation using polarised noise diode data obtained preceding each observation. Regular observations of the quasar 3C286 and the radio galaxy 3C123 are also used to flux-calibrate the data.
4.2.1 PSR J20484951
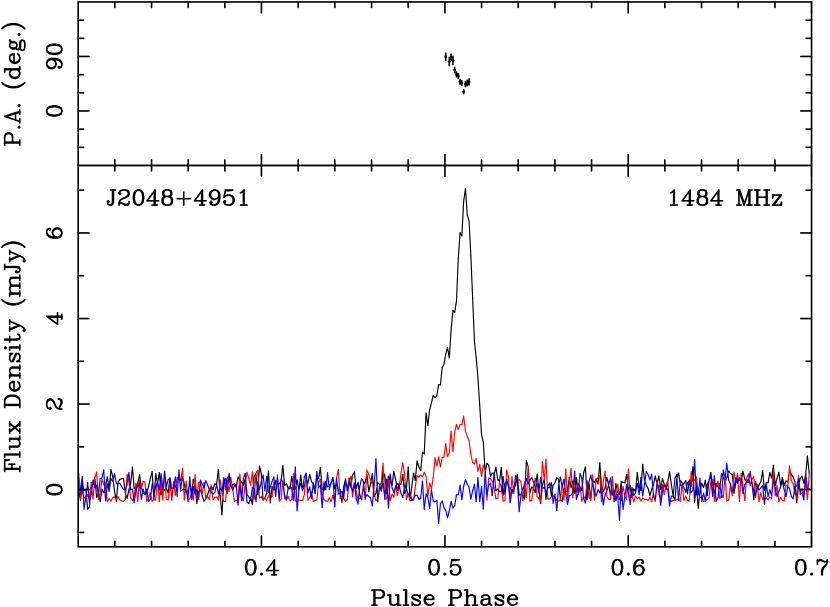
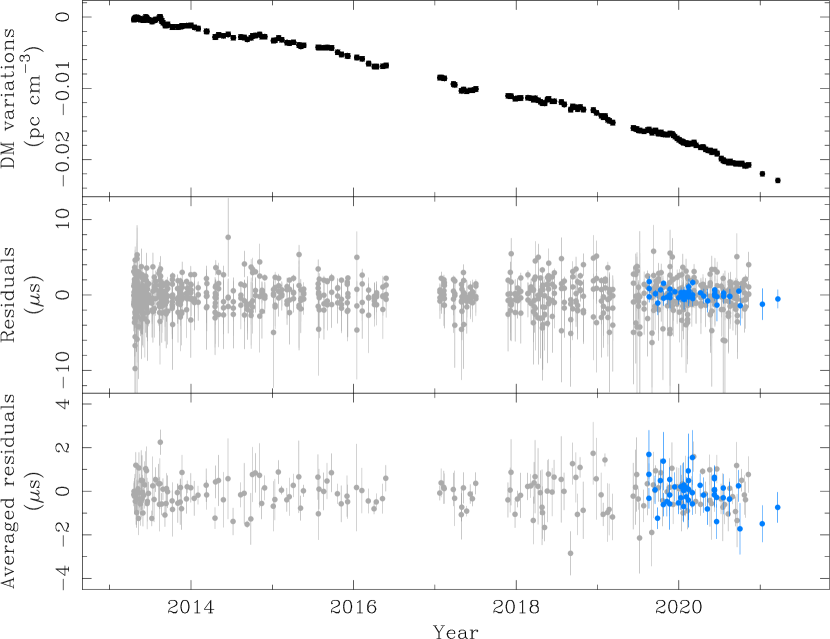
PSR J20484951 is a slow pulsar with ms and pc cm-3. Between 2013 and 2019, we performed 56 follow-up observations at L-band with the NRT. The TOAs of the daily-averaged and frequency-summed pulse profiles were modelled with the Tempo2 (Hobbs et al., 2006) timing software and the Jet Propulsion Laboratory (JPL) DE438 Solar System ephemeris. The timing residuals are shown in Figure 5 and the best-fit parameters are reported in Table 4. We used this ephemeris to integrate all calibrated pulse profiles and build the high-S/N profile shown in Figure 6. From this high-S/N pulse profile, we determine the rotation measure (RM) —the frequency-dependent rotation of the position angle of the linear polarisation of the radio waves due to propagation in the magnetised interstellar medium— to be rad m-2. The mean flux density of the average pulse profile at 1.4 GHz is mJy.

| PSR Name | J20484951 |
|---|---|
| MJD range | 56434 – 58548 |
| Number of TOAs | 56 |
| rms timing residuals () | 329 |
| Reference epoch (MJD) | 56414 |
| Measured timing parameters | |
| Right ascension, (hms, J2000) | 20:48:55.982(4) |
| Declination, (hms, J2000) | +49:51:53.02(3) |
| Spin frequency, (s-1) | 1.759630876491(16) |
| (s-2) | 1.63756(5) |
| (s-3) | 1.59(6) |
| DM (cmpc) | 222.8 |
| Derived parameters | |
| Characteristic age, (Myr) | 1.7 |
| Spindown power, (erg s-1) | |
| Distance (NE2001, kpc) | 9.2 |
| Rotation Measure, RM (rad m-2) | -196(10) |
| (mJy) | 0.12(1) |
4.2.2 PSR J22056012
The SPAN512 survey discovered the millisecond pulsar J22056012 in 2013, with ms and , in a 1.1-day orbit. Since then, it has been regularly monitored at the NRT with its L-band receiver. Since mid-2019, PSR J22056012 has been observed monthly with the Effelsberg radio telescope at S-band (defined as 2 to 4 GHz) with a few observations at C-band (4 to 8 GHz). Due to the low number of C-band observations, these data were not included in the timing analysis but were used to constrain the pulsar spectrum. All Effelsberg data are recorded with the PSRIX backend and calibrated in polarisation and flux using observations of a pulsed noise diode and the planetary nebula NGC 7027. More information about the PSRIX system is provided by Lazarus (2016).
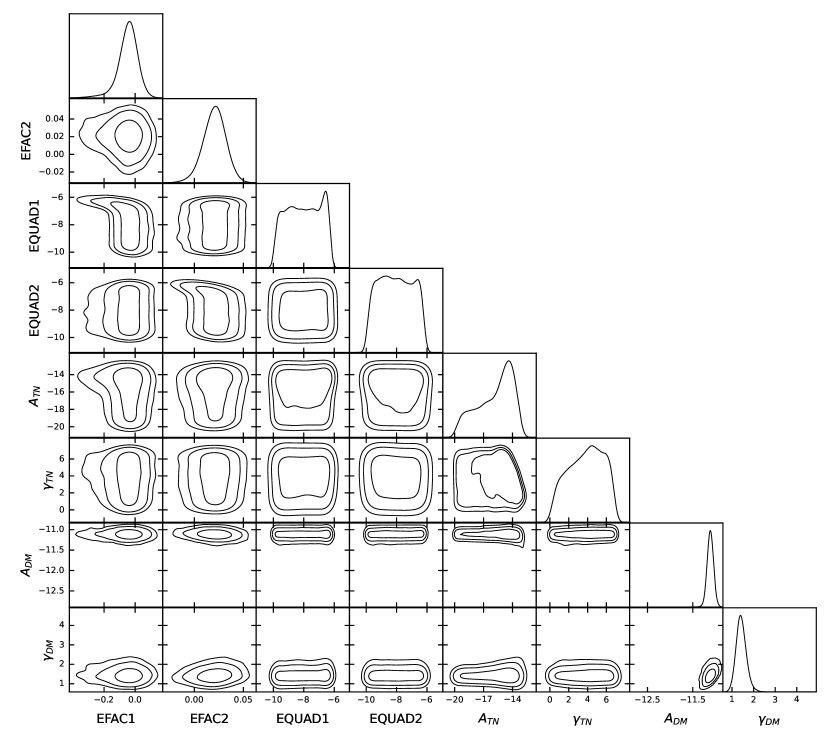
With only the last two years of our dataset providing multifrequency coverage at S-band, we split the large fractional bandwidth of the NUPPI backend into four subbands. The Effelsberg data are fully summed in frequency. Templates for the L-band and S-band averaged pulse profile are built from de-noised time-integrated pulse profiles with the wavelet noise removal software psrsmooth from PSRCHIVE. Before determining the TOAs through cross-correlation of the pulse profiles with the high-S/N templates, the NRT daily pulse profiles are fully integrated in time (from 30 min to 1.5 h) while the Effelsberg profiles are integrated for up to 35 min. In total, we have 852 and 47 TOAs at L-band and S-band, respectively. Following Desvignes et al. (2016), we used TEMPONEST (Lentati et al., 2014) to perform the timing analysis and explore the parameter space of the pulsar timing model. Beyond the astrometric and spin parameters, the timing model includes the ‘ELL1’ parametrisation (Lange et al., 2001) of the pulsar motion around the centre of mass. A set of ‘error scaling factor’ EFAC and ‘error added in quadrature’ EQUAD parameters are required to properly weight the estimated TOA uncertainty between each observing system. The EFAC and EQUAD parameters are sampled with uniform and log-uniform priors in the log10- range , respectively. The model also includes DM variations and red timing noise (TN) described as stationary stochastic processes, with power-law spectra described as , a dimensionless amplitude at reference frequency of 1 yr-1 and the spectral index . and are respectively sampled from a log-uniform prior in the log10 range [-20,-8] and a uniform prior in the range [0,7], for both DM and TN modelling. See also Caballero et al. (2016) for more details. MultiNest (Feroz et al., 2009) sampling uses 2000 live points.
Table 5 lists the timing parameters derived from the TempoNest posterior distributions. A Tempo111111http://tempo.sourceforge.net/ ephemeris is also available online for monitoring by other radio telescopes (see footnote 8). With our current dataset, the TN remains unconstrained (see Fig. 7) and we can set the 95% confidence upper limit on its amplitude with . The DM noise is well constrained and we can reconstruct the DM waveform showing variations of about pc cm-3 during the last 8 years. Figure 9 presents the timing residuals using the maximum likelihood timing parameters and after the DM variations waveform has been subtracted from the residuals. These residuals are characterised by a weighted root mean square (rms) of 1.5 s. Following NANOGrav Collaboration et al. (2015), we also computed the weighted rms after averaging the NRT residuals from the four frequency sub-bands of the same epoch and found a rms of 752 ns.
We find no parallax signature, which is unsurprising because for the high ecliptic latitude of the MSP of , the annual amplitude is ns for a pulsar distance in kiloparsecs. Both NE2001 and the newest YMW16 Galactic electron density model (Yao et al., 2017) predict kpc. Post-Keplerian parameters such as the Shapiro delay or the orbital period derivative are not detectable with the current dataset and so the masses of the two stars are not accurately measured. The mass function
| (5) |
where s gives a lower limit for the companion mass , assuming a low pulsar mass of 1.2 and an edge-on orbit (inclination angle ). The projected semi-major axis and the orbital period are given by the timing analysis. This constraint argues for a low-mass helium white dwarf as the companion star of PSR J22056012 (see e.g. Tauris (2011) for a review of the evolutionary path of this type of binary). No optical counterpart from the white dwarf was found in the Digitized Sky Survey at the position of the pulsar.
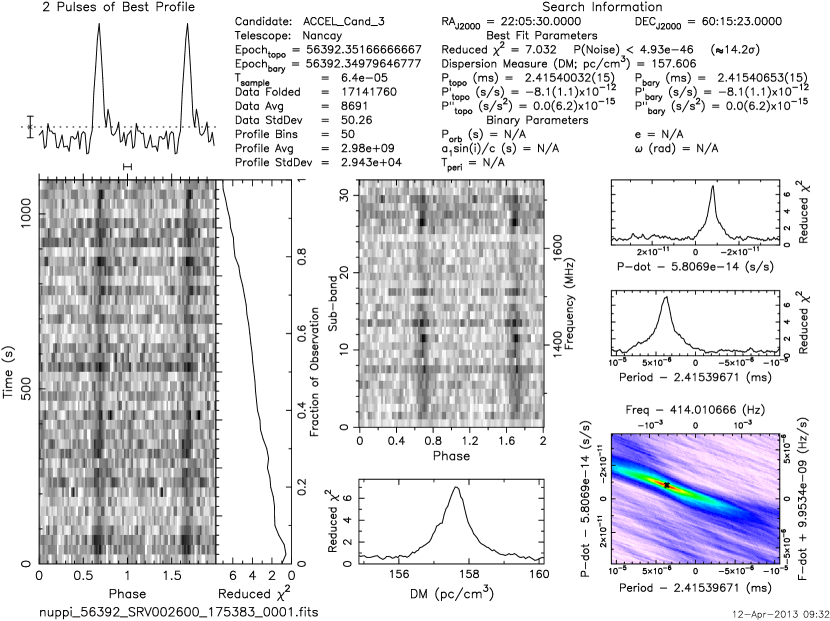
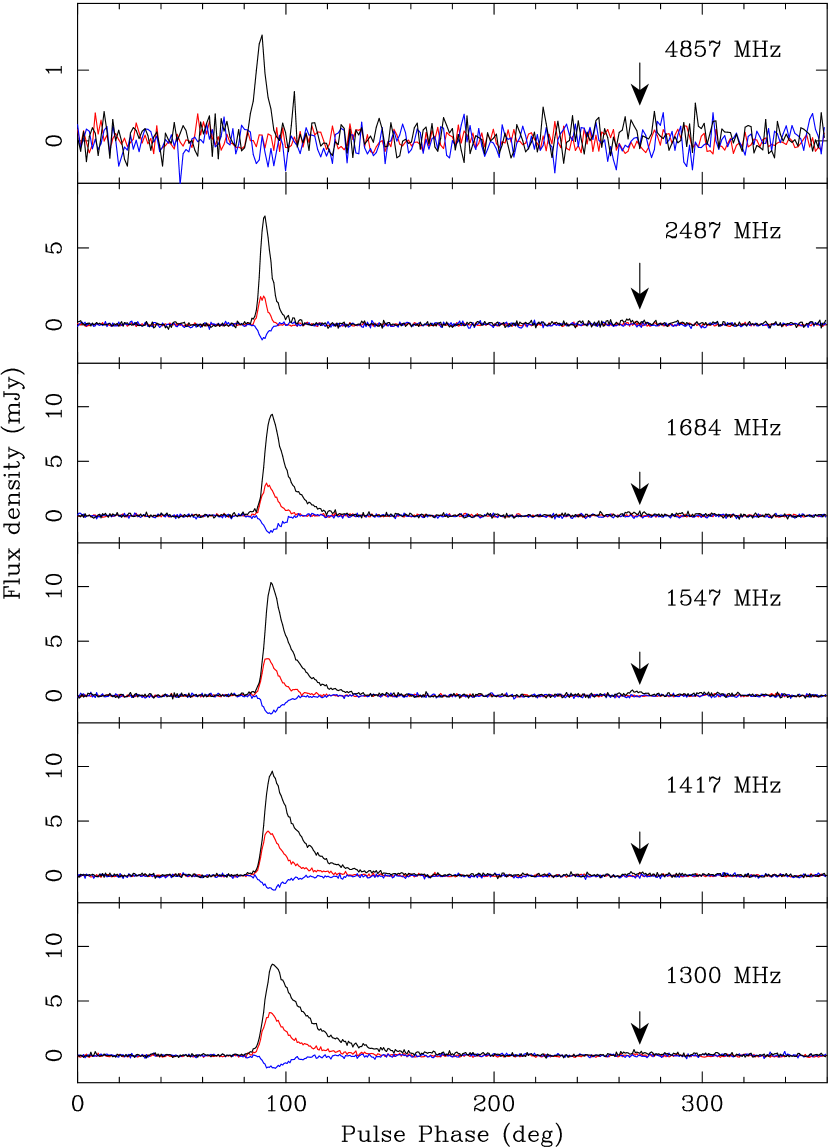
The discovery plot (see Fig. 8) and the data from the various frequency bands shown in Fig. 10 show a profile with a single scattered component. Integrating the L-band data, as in Fig. 11, reveals another weak component separated by half a rotation. Because of the lower S/N of the S-band data, there is only a tentative detection of this second component at this frequency. This suggests that PSR J22056012 might be an orthogonal rotator. Unfortunately, the L-band profile is quite scatter broadened and the S-band profile shows little linear polarisation, with a narrow duty cycle. Assuming a dipolar magnetic field, the Rotating Vector Model (RVM; Radhakrishnan & Cooke, 1969) describes the position angle (PA) of the linear polarisation as the projection of the magnetic field lines rotates with the magnetic axis around the spin axis of the pulsar. Unfortunately, fitting the RVM to the PA does not reliably constrain the magnetic inclination angle or viewing geometry of the pulsar and we are not able to confirm whether or not PSR J22056012 is indeed an orthogonal rotator.
The pulse width at the 50% peak intensity, s, is significantly narrower than that of the precisely timed pulsar J19093744 (Jacoby et al., 2003). From the S-band, C-band, and sub-banded L-band data, we estimate the spectral index to be -2.2(4), which is consistent with the value for the MSP population (Kramer et al., 1998). Assuming an exponential scattering tail and an intrinsic Gaussian pulse profile, we applied the scatternest tool121212https://github.com/gdesvignes/scattering to the total averaged pulse profile reduced to eight sub-channels to estimate the scatter parameters. We find the scattering time at 1 GHz, ms, the scatter index and pc cm-3.
| PSR Name | J22056012 |
| MJD range | 56400 – 59294 |
| Number of TOAs | 899 |
| rms residuals (s) | 1.50 |
| rms averaged residuals (s) | 0.752 |
| TOA median uncertainty at 2.5 GHz, (s) | 0.61 |
| Reference epoch (MJD) | 56400 |
| Measured timing parameters | |
| Right ascension, (hms, J2000) | 22:05:34.201416(20) |
| Declination, (dms, J2000) | +60:12:55.14068(14) |
| Proper motion in , (mas yr-1) | -4.318(27) |
| Proper motion in , (mas yr-1) | -3.082(24) |
| Period, (ms) | 2.41554794898110(4) |
| Period derivative, () | 1.979391(29) |
| DM (cm-3pc) | 157.6435(6) |
| DM derivative, DM1 (cm-3pc yr-1) | -0.0015(4) |
| DM second derivative, DM2 (cm-3pc yr-2) | -0.00017(6) |
| Orbital period, (d) | 1.094551337704(12) |
| Projected semi-major axis, (lt-s) | 1.18410030(8) |
| ELL1 Laplace-Lagrange parameter | |
| ELL1 Laplace-Lagrange parameter | |
| Time of ascending node (MJD) | 56306.555782949(22) |
| — | |
| Derived parameters | |
| Gal. longitude, (deg) | 103.7 |
| Gal. latitude, (deg) | 3.7 |
| Radio flux at 1.30 GHz (mJy) | 0.55 |
| Radio flux at 1.42 GHz (mJy) | 0.49 |
| Radio flux at 1.55 GHz (mJy) | 0.42 |
| Radio flux at 1.68 GHz (mJy) | 0.34 |
| Radio flux at 2.50 GHz (mJy) | 0.14 |
| Radio flux at 4.85 GHz (mJy) | 0.03 |
| Flux density spectrum | -2.2(4) |
| Rotation measure, RM (rad m-2) | -85(2) |
| Scattering time at 1GHz (ms) | 0.32(1) |
| Scattering index | -3.71(6) |
| Pulse width at 2.55 GHz () | 35 |
| Spindown power (erg s-1) | |
| Integral energy flux MeV, (erg cm-2 s-1) | 3.7(1.0) |
| Distance (YMW16, kpc) | 3.54 |
| Distance (NE2001, kpc) | 5.50 |
| Luminosity (YMW16 distance, erg s-1) | |
| Luminosity (NE2001 distance, erg s-1) | |
| Efficiency (YMW16 distance, percent) | 8.8 |
| Efficiency (NE2001 distance, percent) | 21. |
| Total proper motion, (mas yr-1) | 5.336(15) |
| Characteristic age, (Gyr) | 1.93 |
| Surface magnetic field, ( G) | 2.2 |
4.2.3 Gamma-ray pulsations
In the erg s-1 decade where PSR J2205+6012 lies, with being the spindown power (assuming a moment of inertia for the neutron star of g cm-2), over 70% of MSPs show gamma-ray pulsations in Fermi LAT data (Smith et al., 2019). In comparison, % of MSPs in the next lower decade (like PSR J2055+3829, erg s-1) pulse in gamma rays. Only a few percent of middle-aged pulsars in the decade, like PSR J2048+4951, are seen by the LAT.
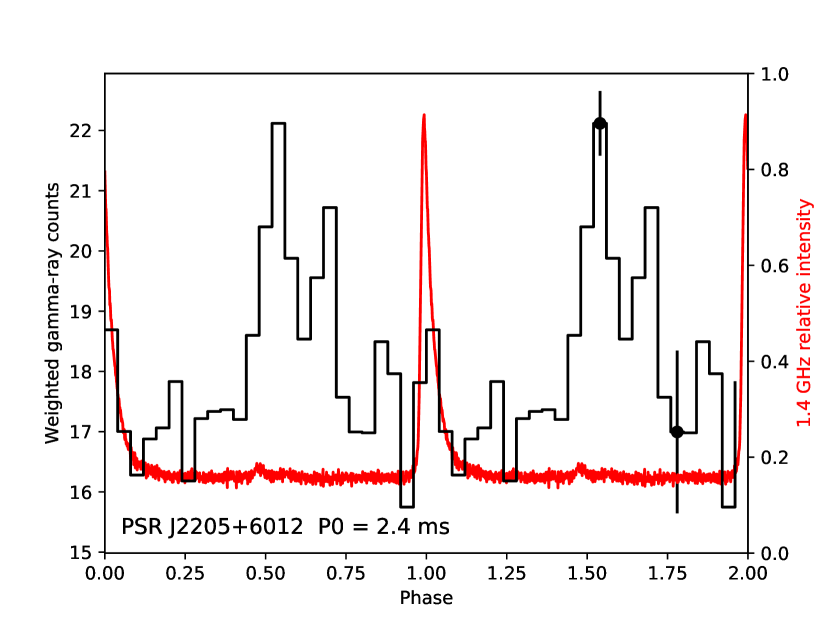
PSR J2055+3829 shows no hint of gamma-ray emission (Guillemot et al., 2019). To search for gamma-ray pulsations from PSRs J2048+4951 and J2205+6012, we selected gamma-ray photons within of the pulsar position, near the energy-dependent point-spread-function of the LAT for our MeV data sample. We converted their arrival times in the LAT to neutron star rotational phases using the ephemeris parameters in Tables 4 and 5 and the fermi plug-in (Ray et al., 2011) to Tempo2. Weighting the photons according to their angular distance from the pulsar and their energy optimises the S/N in the presence of background from nearby sources and diffuse emission. We used the ‘simple’ method described by Bruel (2019). The parameter of this latter method gauges pulsar spectral hardness relative to that of the local background. Smith et al. (2019) found that values cover the range observed to maximise signal significance for a large sample of gamma-ray pulsars, while maintaining a small number of trials. Smaller (larger) values correspond to softer (harder) pulsar spectra. PSR J2048+4951 shows no hint of gamma-ray emission, but PSR J2205+6012 is clearly detected, as in Figure 11. A weighting parameter value maximises the weighted H-test value to 57, for pulsed significance (de Jager & Büsching, 2010; Kerr, 2011), without trial corrections.
Figure 11 also shows the phase-aligned -GHz radio profile. Phase is set to the peak in the radio profile, and the possible error of the gamma-ray alignment due to the uncertainty in the DM is in phase. The gamma-ray peak is roughly aligned with the small radio peak near in phase, which is typical of the aligned MSP category defined by Espinoza et al. (2013).
Table 5 includes some gamma-ray properties. The integral energy flux above 100 MeV, , comes from 4FGL-DR3, the Fermi LAT fourth source catalogue, using 12 years of data (Abdollahi et al., 2022). In 4FGL, the source is too faint ( significance) to fit a curved spectral shape. However, the spectral points extend beyond 10 GeV, and suggests that the spectrum is hard, with a cut-off energy at the high end of the range shown in Figure 7 of the Fermi LAT pulsar catalogue, 2PC (Abdo et al., 2013). On the other hand, the gamma-ray efficiency is typical for a millisecond pulsar (see 2PC Figure 10), albeit dominated by the large uncertainties for the distance and the beaming fraction (defined in 2PC Equation 16, and used in ).
4.3 Single pulse and FRB search
All SPAN512 pointings were searched for radio transients using the PRESTO single_pulse_search.py, which is similar to the P-ALFA pipeline as described in Lazarus et al. (2015). This search applied matched-filters with boxcars up to 0.1s, retaining only pulses with S/N¿6. Assuming the single pulse radiometer equation (McLaughlin & Cordes, 2003), this translates into a fluence of 0.2 to 1 Jy ms for single pulse widths of 1 to 25 ms, respectively. No FRBs were detected. Even assuming the upper range value for an FRB rate of to sky-1 day-1 with fluence Jy ms (Cordes & Chatterjee, 2019), our current sky coverage of 200 sq. deg. with 18 min pointings gives FRB event potentially detectable by our survey, which is consistent with our actual lack of detection.
5 Discussion
5.1 Expected yield
We estimated the Galactic population of non-recycled pulsars covered by the SPAN512 sky area using the PsrPopPy package (Bates et al., 2014). Following Lorimer et al. (2006) and Faucher-Giguère & Kaspi (2006), we assume log-normal distributions to describe the pulsar periods and luminosities with , and , , respectively. The simulated pulsar populations follow a radial distribution with a normal distribution around the plane defined by a scale height of 0.33 kpc (Lorimer et al., 2006). We ran 500 simulations with a population large enough for 1121 pulsars to be detected by the PMPS. For each simulation, PsrPopPy uses the Declination-dependent beam shape of the NRT and the grid of observed SPAN512 pointings to compute the number of pulsars detectable with a S/N threshold of 8. We find that the SPAN512 survey should detect between 9 and 25 non-recycled pulsars (taken as the 95% probability contours).
Our detection (discovery) of 7 (1) young non-recycled pulsars is below the predicted range. One reason may be that the predictions are sensitive to the , and scale-height parameters, which may overestimate the pulsar population in the survey region. Another cause described by Lazarus et al. (2015) is the presence of RFI and red noise in the data that degrades sensitivity towards slow pulsars compared to the theoretical prediction from the radiometer equation (Eq. 4). Similar issues may have caused our pipeline to miss some pulsars.
For MSPs, an adaptation of the simple population synthesis of Johnston et al. (2020) using parameter distributions similar to those of Levin et al. (2013) predicts about two MSPs for the survey zone, one of which would be detectable in gamma rays141414Simon Johnston, private communication.. We did indeed detect two MSPs, both new discoveries, with gamma rays from one of them. Four other known MSPs are in the region, but are undetected by the survey, as discussed above; half of these are detected in gamma rays.
5.2 Distance to PSR J22056012
With a DM pc cm-3 for PSR J22056012, the NE2001 model predicts a distance of 5.5 kpc, placing the pulsar between the Perseus and Outer arms. NE2001 also predicts a scattering time scale of 0.013 ms at 1 GHz for this line of sight, which is 25 times less than the observed value. Yao et al. (2017) predict a smaller distance of 3.54 kpc, placing the pulsar within the Perseus arm.
PSR J22056012 lies 0.45 degrees from Cep 15, a B1-type star at a distance of 810 pc, for a projected distance of 6.4 pc between the star and the line of sight to the pulsar. Cep 15 is hot enough to have a Strömgren sphere (Strömgren, 1939) of tens of parsecs of ionised material that could contribute to the observed DM and scattering. Subtracting an extra contribution of e.g. 30 pc cm-3 due to the Strömgren sphere from the DM, the NE2001 and YMW16 distances become and kpc, respectively, and the gamma-ray luminosity remains in the typical range. On the other hand, if such a large fraction of the electron column density along the line of sight was concentrated near Cep 15, it might explain the large scattering tail.
6 Conclusions
We present SPAN512, a new survey for pulsars and transients with the Nançay Radio Telescope, with observations made between 2012 and 2016. We described the processing pipeline, which is designed to remain sensitive to high-DM millisecond pulsars and to binaries with orbital periods 3 h. The survey discovered one non-recycled pulsar and two MSPs, and redetected all previously known pulsars in the survey sky region bright enough for the sensitivity of the survey. Some unknown pulsars could have potentially been missed due to the incomplete survey. We characterise the newly discovered MSP using Nançay and Effelsberg radio data, and using gamma-ray data from the Large Area Telescope on the Fermi satellite. A comparison of the yield of the survey with preliminary population synthesis predictions suggests that far from the Galactic centre and the Galactic plane, the ratio of MSPs to non-recycled pulsars may be larger than currently believed.
We timed PSR J2205+6012 for 8 years with sub-microsecond precision. The TempoNest noise and timing analysis shows that the current timing precision is only limited by radiometer noise. A TOA median uncertainty at 2.5 GHz of 0.6 s and a timing rms of 0.75 s set this pulsar as one of the most precisely timed EPTA pulsars (Desvignes et al., 2016; Chen et al., 2021). This promises exciting prospects for future observations with ultra-wide-band receivers being commissioned at various telescopes in the Northern hemisphere such as Effelsberg and the Green Bank Telescope. Meanwhile, this dataset will be included in a future EPTA data release. With the highly scattered pulse profile observed at L-band and the large DM variations inferred from our analysis, novel wide-band pulsar timing techniques such as PulsePortraiture (Pennucci, 2019) or the Bayesian profile domain timing software TempoNest2 (Lentati et al., 2017) will be of great interest.
Acknowledgements.
The authors acknowledge the use of the MPIfR Hercules cluster hosted at the Max Planck Computing and Data Facility in Garching and the CNRS/IN2P3’s Computing Centre. We also acknowledge support from the CNRS/IN2P3 Computing Center (Lyon - France) for providing computing and data-processing resources needed for this work. The Nançay Radio Observatory is operated by the Paris Observatory, associated with the French Centre National de la Recherche Scientifique. This publication is partly based on observations with the 100-m telescope of the MPIfR (Max-Planck-Institut für Radioastronomie) at Effelsberg. This research has made extensive use of NASA’s Astrophysics Data System. The Fermi LAT Collaboration acknowledges generous ongoing support from a number of agencies and institutes that have supported both the development and the operation of the LAT as well as scientific data analysis. These include the National Aeronautics and Space Administration and the Department of Energy in the United States, the Commissariat à l’Energie Atomique and the Centre National de la Recherche Scientifique / Institut National de Physique Nucléaire et de Physique des Particules in France, the Agenzia Spaziale Italiana and the Istituto Nazionale di Fisica Nucleare in Italy, the Ministry of Education, Culture, Sports, Science and Technology (MEXT), High Energy Accelerator Research Organization (KEK) and Japan Aerospace Exploration Agency (JAXA) in Japan, and the K. A. Wallenberg Foundation, the Swedish Research Council and the Swedish National Space Board in Sweden. Additional support for science analysis during the operations phase is gratefully acknowledged from the Istituto Nazionale di Astrofisica in Italy and the Centre National d’Études Spatiales in France. This work performed in part under DOE Contract DE-AC02-76SF00515. GD was supported by the European Research Council for the ERC Synergy Grant BlackHoleCam under contract no. 610058. DAS thanks the International Space Science Institute (ISSI, Bern, Switzerland) for financial support of team 459 meetings that helped to improve the present work.References
- Abdo et al. (2013) Abdo, A. A., Ajello, M., Allafort, A., et al. 2013, ApJS, 208, 17, (2nd Fermi Pulsar Catalog, 2PC)
- Abdollahi et al. (2022) Abdollahi, S., Acero, F., Baldini, L., et al. 2022, ApJS, 260, 53
- Alam et al. (2021) Alam, M. F., Arzoumanian, Z., Baker, P. T., et al. 2021, ApJS, 252, 5
- Antoniadis et al. (2013) Antoniadis, J., Freire, P. C. C., Wex, N., et al. 2013, Science, 340, 448
- Barr et al. (2013) Barr, E. D., Champion, D. J., Kramer, M., et al. 2013, MNRAS, 435, 2234
- Bates et al. (2014) Bates, S. D., Lorimer, D. R., Rane, A., & Swiggum, J. 2014, MNRAS, 439, 2893
- Bruel (2019) Bruel, P. 2019, A&A, 622, A108
- Caballero et al. (2016) Caballero, R. N., Lee, K. J., Lentati, L., et al. 2016, MNRAS, 457, 4421
- Chen et al. (2021) Chen, S., Caballero, R. N., Guo, Y. J., et al. 2021, MNRAS, 508, 4970
- Cognard et al. (2011) Cognard, I., Guillemot, L., Johnson, T. J., et al. 2011, ApJ, 732, 47
- Cordes & Chatterjee (2019) Cordes, J. M. & Chatterjee, S. 2019, ARA&A, 57, 417
- Cordes et al. (2006) Cordes, J. M., Freire, P. C. C., Lorimer, D. R., et al. 2006, ApJ, 637, 446
- Cordes & Lazio (2002) Cordes, J. M. & Lazio, T. J. W. 2002, astro-ph/0207156
- de Jager & Büsching (2010) de Jager, O. C. & Büsching, I. 2010, A&A, 517, L9
- Desvignes (2009) Desvignes, G. 2009, PhD thesis, Université d’Orléans
- Desvignes et al. (2011) Desvignes, G., Barott, W. C., Cognard, I., Lespagnol, P., & Theureau, G. 2011, in American Institute of Physics Conference Series, Vol. 1357, American Institute of Physics Conference Series, ed. M. Burgay, N. D’Amico, P. Esposito, A. Pellizzoni, & A. Possenti, 349–350
- Desvignes et al. (2016) Desvignes, G., Caballero, R. N., Lentati, L., et al. 2016, MNRAS, 458, 3341
- Desvignes et al. (2019) Desvignes, G., Kramer, M., Lee, K., et al. 2019, Science, 365, 1013
- Detweiler (1979) Detweiler, S. 1979, ApJ, 234, 1100
- Espinoza et al. (2013) Espinoza, C. M., Guillemot, L., Çelik, Ö., et al. 2013, MNRAS, 430, 571
- Faucher-Giguère & Kaspi (2006) Faucher-Giguère, C.-A. & Kaspi, V. M. 2006, ApJ, 643, 332
- Faulkner et al. (2004) Faulkner, A. J., Stairs, I. H., Kramer, M., et al. 2004, MNRAS, 355, 147
- FERMI-LAT Collaboration et al. (2022) FERMI-LAT Collaboration, Ajello, M., Atwood, W. B., et al. 2022, Science, 376, 521
- Feroz et al. (2009) Feroz, F., Hobson, M. P., & Bridges, M. 2009, MNRAS, 398, 1601
- Foster & Backer (1990) Foster, R. S. & Backer, D. C. 1990, ApJ, 361, 300
- Foster et al. (1997) Foster, R. S., Ray, P. S., Cadwell, B. J., et al. 1997, in Bulletin of the American Astronomical Society, Vol. 29, American Astronomical Society Meeting Abstracts, 1392
- Good et al. (2021) Good, D. C., Andersen, B. C., Chawla, P., et al. 2021, ApJ, 922, 43
- Guillemot et al. (2012) Guillemot, L., Freire, P. C. C., Cognard, I., et al. 2012, MNRAS, 422, 1294
- Guillemot et al. (2019) Guillemot, L., Octau, F., Cognard, I., et al. 2019, A&A, 629, A92
- Han et al. (2021) Han, J. L., Wang, C., Wang, P. F., et al. 2021, Research in Astronomy and Astrophysics, 21, 107
- Hessels et al. (2008) Hessels, J. W. T., Ransom, S. M., Kaspi, V. M., et al. 2008, in American Institute of Physics Conference Series, Vol. 983, 40 Years of Pulsars: Millisecond Pulsars, Magnetars and More, ed. C. Bassa, Z. Wang, A. Cumming, & V. M. Kaspi, 613–615
- Hessels et al. (2011) Hessels, J. W. T., Roberts, M. S. E., McLaughlin, M. A., et al. 2011, in AIP Conference Series, Vol. 1357, Radio Pulsars: An Astrophysical Key to Unlock the Secrets of the Universe, ed. M. Burgay, N. D’Amico, P. Esposito, A. Pellizzoni, & A. Possenti, 40–43
- Hewish et al. (1968) Hewish, A., Bell, S. J., Pilkington, J. D. H., Scott, P. F., & Collins, R. A. 1968, Nature, 217, 709
- Hobbs et al. (2006) Hobbs, G. B., Edwards, R. T., & Manchester, R. N. 2006, MNRAS, 369, 655
- Hotan et al. (2004) Hotan, A. W., van Straten, W., & Manchester, R. N. 2004, PASA, 21, 302
- Hunter (2007) Hunter, J. D. 2007, Computing in Science & Engineering, 9, 90
- Jacoby et al. (2003) Jacoby, B. A., Bailes, M., van Kerkwijk, M. H., et al. 2003, ApJ, 599, L99
- Jankowski et al. (2017) Jankowski, F., van Straten, W., Keane, E. F., et al. 2017, MNRAS, 473, 4436
- Johnston et al. (2020) Johnston, S., Smith, D. A., Karastergiou, A., & Kramer, M. 2020, MNRAS, 497, 1957
- Keane et al. (2018) Keane, E. F., Barr, E. D., Jameson, A., et al. 2018, MNRAS, 473, 116
- Keith et al. (2009) Keith, M. J., Eatough, R. P., Lyne, A. G., et al. 2009, MNRAS, 395, 837
- Keith et al. (2010) Keith, M. J., Jameson, A., van Straten, W., et al. 2010, MNRAS, 409, 619
- Kerr (2011) Kerr, M. 2011, ApJ, 732, 38
- Kerr et al. (2020) Kerr, M., Reardon, D. J., Hobbs, G., et al. 2020, PASA, 37, e020
- Kramer et al. (2021) Kramer, M., Stairs, I. H., Manchester, R. N., et al. 2021, Physical Review X, 11, 041050
- Kramer et al. (1998) Kramer, M., Xilouris, K. M., Lorimer, D. R., et al. 1998, ApJ, 501, 270
- Lange et al. (2001) Lange, C., Camilo, F., Wex, N., et al. 2001, MNRAS, 326, 274
- Lazarus (2016) Lazarus, P. 2016, PhD thesis, Rheinische Friedrich-Wilhelms-Universität Bonn
- Lazarus et al. (2015) Lazarus, P., Brazier, A., Hessels, J. W. T., et al. 2015, ApJ, 812, 81
- Lee (2016) Lee, K. J. 2016, in Astronomical Society of the Pacific Conference Series, Vol. 502, Frontiers in Radio Astronomy and FAST Early Sciences Symposium 2015, ed. L. Qain & D. Li, 19
- Lee et al. (2013) Lee, K. J., Stovall, K., Jenet, F. A., et al. 2013, MNRAS, 433, 688
- Lentati et al. (2014) Lentati, L., Alexander, P., Hobson, M. P., et al. 2014, MNRAS, 437, 3004
- Lentati et al. (2017) Lentati, L., Kerr, M., Dai, S., et al. 2017, MNRAS, 466, 3706
- Levin et al. (2013) Levin, L., Bailes, M., Barsdell, B. R., et al. 2013, MNRAS, 434, 1387
- Lorimer et al. (2006) Lorimer, D. R., Faulkner, A. J., Lyne, A. G., et al. 2006, MNRAS, 372, 777
- Lynch et al. (2018) Lynch, R. S., Swiggum, J. K., Kondratiev, V. I., et al. 2018, ApJ, 859, 93
- Manchester et al. (2005) Manchester, R. N., Hobbs, G. B., Teoh, A., & Hobbs, M. 2005, AJ, 129, 1993
- Manchester et al. (2001) Manchester, R. N., Lyne, A. G., Camilo, F., et al. 2001, MNRAS, 328, 17
- McLaughlin & Cordes (2003) McLaughlin, M. A. & Cordes, J. M. 2003, ApJ, 596, 982
- NANOGrav Collaboration et al. (2015) NANOGrav Collaboration, Arzoumanian, Z., Brazier, A., et al. 2015, ApJ, 813, 65
- Parent et al. (2022) Parent, E., Sewalls, H., Freire, P. C. C., et al. 2022, ApJ, 924, 135
- Paul et al. (2019) Paul, A., Susobhanan, A., Gopakumar, A., et al. 2019, in 2019 URSI Asia-Pacific Radio Science Conference (AP-RASC), 1–1
- Pennucci (2019) Pennucci, T. T. 2019, ApJ, 871, 34
- Perera et al. (2019) Perera, B. B. P., DeCesar, M. E., Demorest, P. B., et al. 2019, MNRAS, 490, 4666
- Pletsch et al. (2012) Pletsch, H. J., Guillemot, L., Allen, B., et al. 2012, ApJ, 744, 105
- Raaijmakers et al. (2021) Raaijmakers, G., Greif, S. K., Hebeler, K., et al. 2021, ApJ, 918, L29
- Radhakrishnan & Cooke (1969) Radhakrishnan, V. & Cooke, D. J. 1969, Astrophysical Letters, 3, 225
- Ransom et al. (2003) Ransom, S. M., Cordes, J. M., & Eikenberry, S. S. 2003, ApJ, 589, 911
- Ransom et al. (2002) Ransom, S. M., Eikenberry, S. S., & Middleditch, J. 2002, ApJ, 124, 1788
- Ray et al. (2011) Ray, P. S., Kerr, M., Parent, D., et al. 2011, ApJS, 194, 17
- Sanidas et al. (2019) Sanidas, S., Cooper, S., Bassa, C. G., et al. 2019, A&A, 626, A104
- Sanpa-Arsa (2016) Sanpa-Arsa, S. 2016, PhD thesis, University of Virginia
- Sazhin (1978) Sazhin, M. V. 1978, Soviet Astronomy, 22, 36
- Siemens et al. (2013) Siemens, X., Ellis, J., Jenet, F., & Romano, J. D. 2013, Classical and Quantum Gravity, 30, 224015
- Smith et al. (2019) Smith, D. A., Bruel, P., Cognard, I., et al. 2019, ApJ, 871, 78
- Stovall et al. (2014) Stovall, K., Lynch, R. S., Ransom, S. M., et al. 2014, ApJ, 791, 67
- Strömgren (1939) Strömgren, B. 1939, ApJ, 89, 526
- Tauris (2011) Tauris, T. M. 2011, in Astronomical Society of the Pacific Conference Series, Vol. 447, Evolution of Compact Binaries, ed. L. Schmidtobreick, M. R. Schreiber, & C. Tappert, 285
- Theureau et al. (2011) Theureau, G., Parent, D., Cognard, I., et al. 2011, A&A, 525, A94
- van Straten et al. (2012) van Straten, W., Demorest, P., & Oslowski, S. 2012, Astronomical Research and Technology, 9, 237
- Voisin et al. (2020) Voisin, G., Cognard, I., Freire, P. C. C., et al. 2020, A&A, 638, A24
- Yao et al. (2017) Yao, J. M., Manchester, R. N., & Wang, N. 2017, ApJ, 835, 29
- Zhu et al. (2014) Zhu, W. W., Berndsen, A., Madsen, E. C., et al. 2014, ApJ, 781, 117