Impact of radiation from primordial black holes on the 21-cm angular-power spectrum in the dark ages
Abstract
We investigate the impact of radiation from primordial black holes (PBHs), in the mass range of and , on the 21-cm angular-power spectrum in the dark ages. PBHs in the former mass range affect the 21-cm angular-power spectrum through the evaporation known as Hawking radiation, while the radiation from the accretion process in the latter mass range. In the dark ages, radiation from PBHs can increase the ionization fraction and temperature of the intergalactic medium, change the global 21-cm differential brightness temperature and then affect the 21-cm angular-power spectrum. Taking into account the effects of PBHs, we find that in the dark ages, , the amplitude of the 21-cm angular-power spectrum is decreased depending on the mass and mass fraction of PBHs. We also investigate the potential constraints on the mass fraction of PBHs in the form of dark matter for the future radio telescope in lunar orbit or on the far side surface of the Moon.
I introduction
In the standard cosmological model, dark matter makes up about of the Universe Aghanim et al. (2020). Although many astronomical observations have confirmed the existence of dark matter, its nature has so far been unknown. Among the many dark matter models, weakly interacting massive particles (WIMPs) is the most important one Bertone et al. (2005); Jungman et al. (1996). However, so far, all relevant experiments to detect WIMPs have not found any signs of them. Other dark matter models, such as primordial black holes (PBHs), have attracted extensive attention again Zou and Huang (2022); Carr et al. (2010); Bird et al. (2022); Carr and Kuhnel (2022); Wu et al. (2022); Flores and Kusenko (2021); Zhang et al. (2021); Villanueva-Domingo et al. (2021); Hasinger (2020); Zhang et al. (2022); Belotsky et al. (2014); Laha (2019); Dasgupta et al. (2020); Laha et al. (2020, 2021). Recently, the gravitational waves generated by the merger of black holes detected by LIGO/Virgo may be partly caused by PBHs Bird et al. (2016); Clesse and Garcia-Bellido (2020); Deng (2021); Franciolini et al. (2022); Chen et al. (2022); Hütsi et al. (2021); Ashoorioon et al. (2022).
PBHs can be formed by the collapse of large density perturbation existing in the early Universe and their masses spread a wide range (see, e.g., Refs. Carr (2005); Carr et al. (2010); Khlopov (2010)). A PBH smaller than loses mass through evaporation due to Hawking radiation Josan et al. (2009); Carr et al. (2010); Tashiro and Sugiyama (2008); Page (1976a, b, 1977); Kohri et al. (2014); Ray et al. (2021). A massive PBH with mass radiates energy in the process of accretion Ricotti (2007); Ricotti et al. (2008); Poulin et al. (2017); Ali-Haïmoud and Kamionkowski (2017); Yang (2021a); Carr et al. (2021); D’Agostino et al. (2022). The extra energy injection from PBHs can affect the evolution of the intergalactic medium (IGM). The changes in the thermal history of the IGM will be reflected in, e.g., the anisotropy of the cosmic microwave background (CMB) and the global 21-cm signal Mukhopadhyay et al. (2022); Cang et al. (2022); Yang (2021b); Natwariya et al. (2021); Mittal et al. (2022); Tashiro and Kadota (2021); Yang (2020a); Chen et al. (2016); Mack and Wesley (2008); Cang et al. (2021); Mena et al. (2019); Saha and Laha (2022).
Recently, the Experiment to Detect the Global Epoch of Reionization Signature reported the detection of the global 21-cm signal centered at redshift with an amplitude twice as large as expected Bowman et al. (2018). Although this result needs to be further verified by other experiments, the observation can be used to study the related properties of PBHs, such as limiting their mass fraction. According to the theory, there are also 21-cm absorption signals in the dark ages of the Universe () Pritchard and Loeb (2012); Furlanetto et al. (2006a), and these radio signals have been redshifted to the low frequency range (MHz). The Earth’s ionosphere makes it impossible to detect these low-frequency signals from the Earth. Radio telescopes in orbit around the moon or on the far side of the moon have been proposed to avoid the influence of the ionosphere Chen et al. (2019); Burns et al. (2021a); Burns (2020); Burns et al. (2021b); Plice et al. (2017); Chen et al. (2019); Shi et al. (2022). In Ref. Yang (2021a), the authors have investigated the effect of PBH accretion radiation on the global 21-cm signal in the dark ages, and explored the ability of future radio telescopes to limit the mass fraction of PBHs for the mass range of . Although the resulting constraints are not the strongest, they are still competitive with that of the lower redshift period because the dark ages are less affected by the formation of cosmic structures. Similar to the anisotropy of the cosmic microwave background, the 21-cm signals can also be studied using the angular-power spectrum Lewis and Challinor (2007); Loeb and Zaldarriaga (2004); Santos et al. (2005); Zaldarriaga et al. (2004). The influence of dark matter annihilation on the 21-cm angular-power spectrum in the cosmic dawn has been studied in, e.g., Ref. Natarajan and Schwarz (2009).
In this paper, we focus on the influence of PBHs on the 21-cm angular-power spectrum in the dark ages. We mainly investigate the radiation from the evaporation and accretion process of PBHs, corresponding to the mass range of and , respectively 111A PBH with mass has a shorter lifetime than the age of the Universe Carr et al. (2010). Here we only consider PBH with mass greater than . It should be pointed out that the lower mass PBH can still affect the 21-cm angular-power spectrum in the dark ages.. In view of a future extraterrestrial radio telescope, we investigate the ability of future detection of the 21-cm angular-power spectrum to limit the abundance of PBHs.
This paper is organized as follows. In Sec. II we investigate the influence of PBHs on the thermal history of the IGM and the global 21-cm signal in the dark ages. The 21-cm angular-power spectrum including PBHs and the future potential upper limits on the abundance of PBHs are discussed in Sec. III. The conclusions are given in Sec. IV. Throughout the paper we will use the cosmological parameters from Planck-2018 results Aghanim et al. (2020).
II The global 21-cm signal in the dark ages including PBHs
II.1 The thermal history of the IGM including PBHs
The changes in the thermal history of the Universe due to the injection of extra energy have been investigated by previous works (see, e.g., Refs. Chen and Kamionkowski (2004); Zhang et al. (2007); Slatyer (2016)). Here we review the main points and one can refer to, e.g., Refs. Chen and Kamionkowski (2004); Slatyer (2016) for more details.
The interactions between the particles emitted from PBHs with that existing in the Universe result in the changes of the thermal history of the IGM. Taking into account the effects of heating, ionization, and excitation, the changes of the degree of ionization () and the temperature of IGM () with the redshift are governed by the following equations Chen and Kamionkowski (2004); Zhang et al. (2006):
| (1) |
| (2) | |||||
where and are the recombination and ionization rate for the case with no PBHs, respectively. The ionization and heating rate caused by PBHs can be written as follows Yang (2019); Clark et al. (2018); Yang (2015, 2021b):
| (3) |
| (4) |
where is the number density of baryon. stands for the ground state energy of the hydrogen atom. corresponds to the energy fraction injected into the IGM for ionization, heating and exciting, respectively. It has been studied in detail, e.g., Refs. Madhavacheril et al. (2014); Slatyer (2016); Poulin et al. (2017), and we use the public code ExoCLASS Stöcker et al. (2018); Blas et al. (2011) to calculate numerically.
For evaporating PBHs, the energy injection rate per unit volume is given by Clark et al. (2018); Yang (2020b)
| (5) |
where . Here we have adopted a monochromatic PBH mass function for our calculations. The mass-loss rate of a black hole is Carr et al. (2010); Josan et al. (2009)
| (6) |
where is the number of particle species emitted directly and we have used the formula given in Ref. Tashiro and Sugiyama (2008).
For accreting PBHs, the energy injection rate per unit volume can be written as Poulin et al. (2017); Ali-Haïmoud and Kamionkowski (2017)
| (7) |
where is the accretion luminosity, which is proportional to the Bondi-Hoyle rate Poulin et al. (2017):
| (8) |
where is the radiative efficiency depending on the accretion details. The authors of Ali-Haïmoud and Kamionkowski (2017) made a detailed analysis of the accretion process of PBHs, finding for collisional ionization (photoionization). Here we use for our calculations, corresponding to the conservative case. is the dimensionless Bondi-Hoyle accretion rate, which is in the form of the Eddington luminosity as .
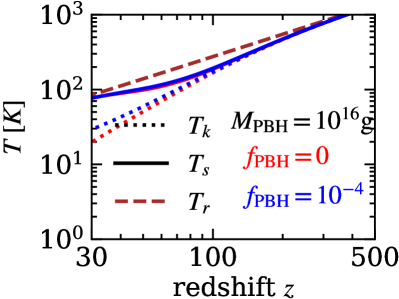
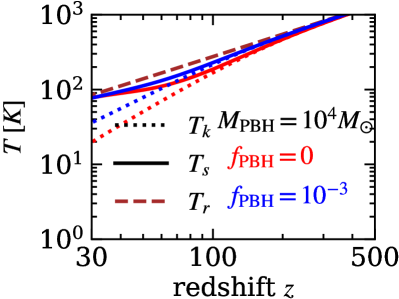
In order to get the thermal history of the IGM for the case with PBHs, we have modified the public code RECFAST in CAMB222https://camb.info/ to solve the differential equations (1) and (2) numerically Yang (2019, 2015); Chen and Kamionkowski (2004); Zhang et al. (2007); Yang (2020b); Clark et al. (2018). The changes of with redshift are shown in Fig. 1. In general, the injection of extra energy from PBHs raises the temperature of the IGM, and these effects are more pronounced at lower redshifts.
II.2 The global 21-cm signal including PBHs
Here we review the main issues about the global 21-cm signal. For more details and in-depth discussion, one can refer to, e.g., Refs. Pritchard and Loeb (2012); Furlanetto et al. (2006a) and references therein.
The global 21-cm signal is usually described by the differential brightness temperature . Relative to the CMB background, can be written as follows Cumberbatch et al. (2010); Ciardi and Madau (2003); Yang (2018):
| (9) | |||||
where and are the density parameters of baryonic matter and dark matter, respectively. is the reduced Hubble constant. is the spin temperature defined as Pritchard and Loeb (2012); Furlanetto et al. (2006a)
| (10) |
where and are the number densities of hydrogen atoms in triplet and singlet states, respectively. Specifically, the spin temperature can be written in the form of a weighted mean of the CMB temperature () and the IGM temperature () Cumberbatch et al. (2010); Yuan et al. (2010)
| (11) |
where corresponds to the Wouthuysen-Field effect and we use the formula given in, e.g., Refs. Yuan et al. (2010); Yang (2019); Kuhlen et al. (2006):
| (12) |
where is the Einstein coefficient of hyperfine spontaneous transition. is the radiative deexcitation rate due to Ly photons Pritchard and Loeb (2012); Furlanetto et al. (2006a). Taking into account the collisions between hydrogen atoms and other particles, can be written as Yuan et al. (2010); Yang (2018); Kuhlen et al. (2006); Liszt (2001); Yang (2016)
| (13) |
where are the deexcitation rates of collisions Yang (2018, 2016); Kuhlen et al. (2006); Liszt (2001).
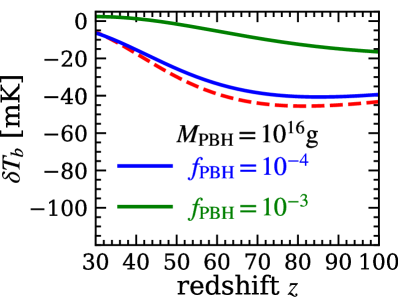
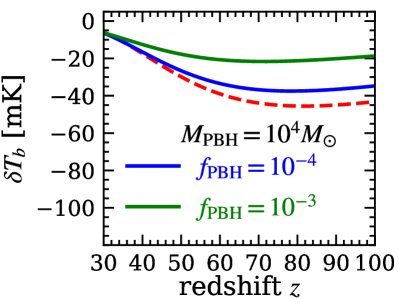
The changes of the spin temperature with redshift are shown in Fig. 1. It can be seen that becomes larger than that with no PBH, depending on the mass and mass fraction of PBH. The changes of the differential brightness temperature with redshift are shown in Fig. 2. The amplitude of the 21-cm absorption signal is decreased due to the influence of PBH. For a larger mass fraction of PBH with a fixed mass, the emission signal appears as shown in Fig. 2 for with .
III The 21-cm angular-power spectrum and upper limits on the mass fraction of PBHs
Similar to the CMB anisotropy, the fluctuations of can also be described by the 21-cm angular-power spectrum, which can be calculated by using a standard Boltzmann code. The calculation details of 21-cm angular-power spectrum can be found in Ref. Lewis and Challinor (2007) and the numerical code is available in CAMB. Here we have used the public code CAMB for our calculations, which has been used in the previous section to investigate the thermal history of the IGM including the effects of PBHs. The 21-cm angular-power spectrum at redshift is shown in Fig. 3.
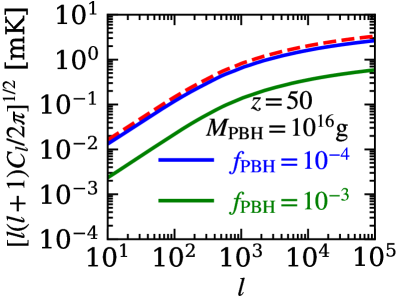
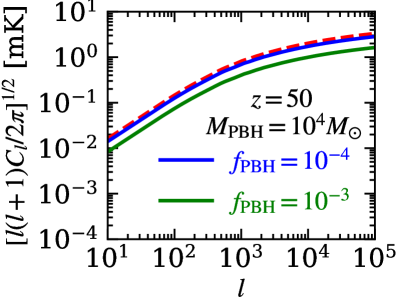
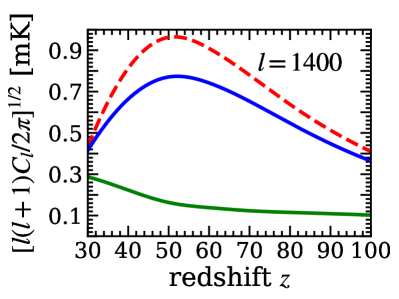
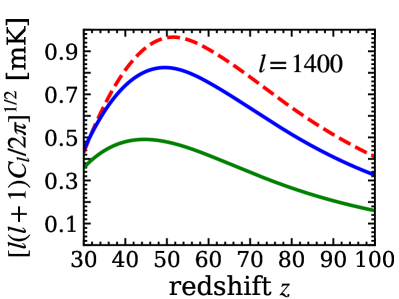
For the case with no PBH, the amplitude of the 21-cm angular-power spectrum is about 1 3mK for . Since the angular-power spectrum is roughly proportional to Lewis and Challinor (2007); Furlanetto et al. (2006a), therefore, for the case with PBH, the angular-power spectrum is decreased depending on the mass and mass fraction of PBH. In Fig. 4, we also show the 21-cm angular-power spectrum for a scale in the redshift range . For the case with no PBH, the largest amplitude of the angular-power spectrum appears at redshift 333Similar results can also be found for other scales Pritchard and Loeb (2012); Furlanetto et al. (2006b).. Including the effects of PBH, the largest amplitude shifts to the lower redshifts.
The 21-cm signal ( MHz) from the redshift range has been redshifted into the frequency range MHz. Due to the influence of the Earth’s ionosphere, it is difficult to detect these low frequency signals from the Earth. A radio telescope, either in lunar orbit or on the far side surface of the Moon, has been proposed to detect these radio signals Chen et al. (2019); Burns et al. (2021a); Burns (2020); Burns et al. (2021b); Plice et al. (2017); Chen et al. (2019). For a radio telescope, the uncertainty of the at a mutlipole is Bernal et al. (2018); Zaldarriaga et al. (2004); Kesden et al. (2002)
| (15) |
where is the observation time, is the maximum multipole observable, and is the array covering factor. is the sky temperature. For the low frequency range, , is dominated by the galactic synchrotron radiation background and scales as Furlanetto et al. (2006a); Oberoi and Pincon (2003); Jester and Falcke (2009a, b); Platania et al. (1998); Haslam et al. (1982); Lawson et al. (1987). A more detailed analysis of can be also found in, e.g., Ref. Planck Collaboration (2016). Here we adopted the approximated form given in Ref. Jester and Falcke (2009b):
| (16) |
Another approximated form usually used is , see, e.g., Refs. Furlanetto et al. (2006a); Valdes et al. (2007). Note that the differences between two formulas have a negligible impact on the estimation of our final results.
For a future radio telescope, e.g., on the lunar surface Bernal et al. (2018); Burns (2021), with an array size km, the maximum multipole could reach at redshift . Therefore, for the array covering factor and bandwidth MHz, the uncertainty of the at for could be mK for 1000 hours observation time and . Therefore, a large deviation of the 21-cm angular-power spectrum from the default case could be detected for the future radio telescope. On the other hand, future observations of the 21-cm angular-power spectrum can be used to put limits on the abundance of PBHs. Here we will make a simple study of the abundance of PBHs for the future detection, and more detailed studies are left for future work.
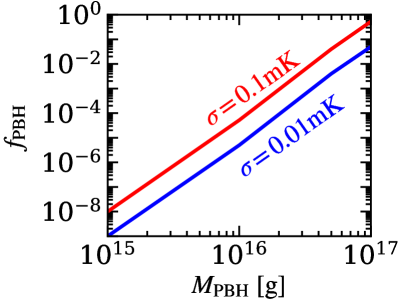
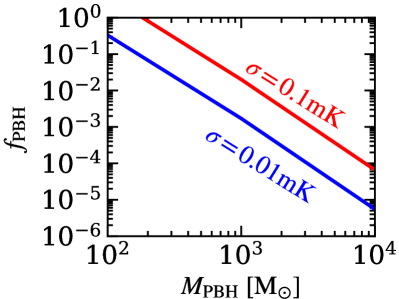
Instead of focusing on the sensitivity of a specific radio telescope, we have set and mK for our calculations, which could be achieved in the future. Moreover, for simply, we have focused on the maximum sensitivity at a specific scale instead of all scales Zaldarriaga et al. (2004). By requiring the deviation of the 21-cm angular-power spectrum less than for at redshift , we find the upper limits on the mass fraction of PBHs , which are shown in Fig. 5. For evaporating PBHs, the strongest limit is for (0.01) for . For accreting PBHs, the strongest limit is for (0.01) for . Note that these constraints are comparable to the existing ones Carr et al. (2010). Since these limits are from the dark ages, where the influence of astrophysical factors is smaller than that in the later period, therefore, future extraterrestrial detection of the radio signal can give very competitive results for limiting the mass fraction of PBHs.
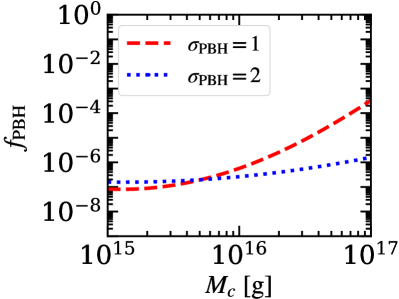
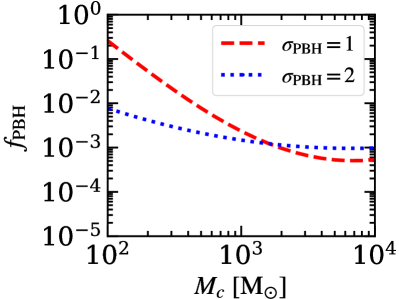
Although the monochromatic PBH mass function has been used usually, the extended mass function should be more realistic as predicted by many formation scenarios; see, e.g., Refs. Dolgov and Silk (1993); Carr et al. (2016); Clesse and García-Bellido (2015); Kannike et al. (2017); Yokoyama (1998); Niemeyer and Jedamzik (1999); Carr et al. (2017); Green (2016); Bellomo et al. (2018). Here we also investigate the constraints on for extended PBH mass function. We consider one of the typical extended PBH mass functions, log-normal distribution Carr et al. (2017); Carr and Kuhnel (2020), as follows:
| (17) |
Using the constraints from the monochromatic PBH mass function, one can derive the upper limits on for extended PBH mass distribution Carr et al. (2017); Cang et al. (2021, 2022); Kühnel and Freese (2017),
| (18) |
where is the constraint for monochromatic PBH mass function shown in Fig. 5. The upper limits on for extended PBH mass function are shown in Fig. 6. 444Note that the extended mass function should be also included in the calculations of the energy injection into IGM Cang et al. (2021); Bellomo et al. (2018). The final constraints should be different by several factors Cang et al. (2021); Clark et al. (2018).
Another important issue for the influence of PBHs on the 21-cm angular-power spectrum is the Poissonian fluctuation in the number density of PBHs, which has an extra contribution to the standard matter power spectrum Villanueva-Domingo and Ichiki (2021); Bernal et al. (2018); Tashiro and Sugiyama (2013); Cole and Silk (2021); Afshordi et al. (2003). Compared with the effects of PBHs considered here, the amplitude of the 21-cm angular-power spectrum is increased due to Poissonian fluctuation. As shown in, e.g., Refs. Bernal et al. (2018); Cole and Silk (2021), Poissonian fluctuation has a large effect at lower redshifts () or on smaller scales (), depending on the related parameters. At higher redshifts, the Poissonian contribution becomes smaller even on smaller scales Bernal et al. (2018); Cole and Silk (2021). Given the opposite effects of the radiation and Poissonian fluctuation of PBHs on the 21-cm angular-power spectrum, it is expected that the future detection of power spectrum at higher redshifts can significantly reduce the impact of Poissonian contribution.
Many other factors can also affect the 21-cm angular-power spectrum Lewis and Challinor (2007). Correspondingly, the detection of the 21-cm angular-power spectrum can be used to investigate those factors, such as the primordial power spectrum (), which is related to the formation scenario of PBHs. The primordial power spectrum at large scales (small ) has been constrained by many observations, which is basically consistent with the scale invariant spectrum predicted by the popular inflation model Hlozek et al. (2012); Bird et al. (2011); Tinker et al. (2012). In general, the primordial power spectrum at small scales (large ) should be enhanced in order to form PBHs; see, e.g., Refs. Cole and Silk (2021); Germani and Prokopec (2017); Byrnes et al. (2019); Passaglia et al. (2019); Zhai et al. (2022); Raveendran et al. (2022); Cai et al. (2022); Heydari and Karami (2022); Yi et al. (2021); Ünal et al. (2021); Cai et al. (2020); Mishra and Sahni (2020); Kalaja et al. (2019); Carrilho et al. (2019); Gao and Guo (2018); Zhou et al. (2020); Cai et al. (2018); Ashoorioon et al. (2021a, b). Many different formation scenarios of PBHs, corresponding to the different forms of and matching the measurements on small scales, have been proposed. As shown in, e.g., Ref Cole and Silk (2021), the 21-cm power spectrum (three dimensions) can be used to investigate these different scenarios since the 21-cm signal covers smaller scales and many more modes than those such as CMB measurements. In theory, the 21-cm angular-power spectrum can also be used to study different formation scenarios of PBHs. Compared with the scale invariant spectrum, the enhancement of at small scale (larger ) can result in the increasing of the 21-cm angular-power spectrum at small scale (large ) Cole and Silk (2021). It is expected that these deviations from the standard power spectrum, corresponding to the different formation scenarios of PBHs, would also be examined by future detection of the 21-cm angular-power spectrum. We will conduct a detailed analysis of the relevant issues in future work.
Note that in obtaining the above limits, we have fixed other cosmological parameters except . On the other hand, the parameter can affect the estimation of cosmological parameters Loeb and Zaldarriaga (2004), and the details of these effects are complicated to analyze. Roughly, for example, the 21-cm angular-power spectrum is proportional to Lewis and Challinor (2007); Furlanetto et al. (2006a), which is related to as shown in Eq. (9). Decreasing (increasing) the baryon density will result in lowering (boosting) the amplitude of 21-cm angular-power spectrum. Therefore, it is expected that and should be positively correlated in view of the 21-cm angular-power spectrum in the dark ages. Note that the analysis here is simple. A complete multiparameter analysis should be carried out by the statistical method such as Markov chain Monte Carlo, and we will perform these analyses in future work.
IV CONCLUSIONS
We have investigated the impact of PBHs on the thermal history of IGM and the 21-cm angular-power spectrum in the dark ages. Previous works mainly focused on the effects of the radiation from accreting PBHs on the global 21-cm signal and 21-cm power spectrum in the cosmic dawn and epoch of reionization. Here we have also focused on the evaporating PBHs in the mass range of , besides the accreting PBHs in the mass range of . The radiation from PBHs results in increasing the gas and spin temperature compared with the case with no PBHs. The amplitude of the 21-cm absorption signal is decreased, and the emission signal appears for a larger mass fraction of PBHs. The fluctuations of the 21-cm differential brightness temperature can be described by the 21-cm angular-power spectrum. Taking into account the effects of PBHs, the 21-cm angular-power spectrum is decreased in the dark ages depending on the mass and mass fraction of PBHs. The peak value of the 21-cm angular-power spectrum appears at redshift for the case with no PBHs, and shifts to the lower redshifts including PBHs.
The 21-cm signals from the dark ages have been redshifted into the lower frequency (). It is difficult to detect these radio signals from the Earth due to the influence of Earth’s ionosphere. Extraterrestrial radio telescopes, such as in lunar orbit or on the lunar surface, have been proposed. In view of the future radio telescopes, we have estimated the upper limits on the mass fraction of PBHs. Instead of focusing on a specific radio telescope, we have set the uncertainty = 0.1 and 0.01mK, which can be achieved in the future, for our calculations. For a evaporating PBH with mass , the upper limit is for . For a accreting PBH with mass , the upper limit is for . Compared with the cosmic dawn and epoch of reionization, the dark ages is less affected by the astrophyscial factors. Therefore, the detection of the 21-cm signal or angular-power spectrum in the dark ages will be of great significance to reveal the relevant properties of PBHs.
V Acknowledgements
Y. Yang thanks Dr. Bin Yue, Yan Gong and Yidong Xu for the helpful discussions and suggestions. This work is supported by the Shandong Provincial Natural Science Foundation (Grant No.ZR2021MA021). Y. Yang is supported in part by the Youth Innovations and Talents Project of Shandong Provincial Colleges and Universities (Grant No. 201909118).
References
- Aghanim et al. (2020) N. Aghanim et al. (Planck), Astron. Astrophys. 641, A6 (2020), [Erratum: Astron.Astrophys. 652, C4 (2021)], arXiv:1807.06209 [astro-ph.CO] .
- Bertone et al. (2005) G. Bertone, D. Hooper, and J. Silk, Phys. Rept. 405, 279 (2005), arXiv:hep-ph/0404175 [hep-ph] .
- Jungman et al. (1996) G. Jungman, M. Kamionkowski, and K. Griest, Phys. Rept. 267, 195 (1996), arXiv:hep-ph/9506380 [hep-ph] .
- Zou and Huang (2022) Z.-C. Zou and Y.-F. Huang, Astrophys. J. Lett. 928, L13 (2022), arXiv:2201.00369 [astro-ph.HE] .
- Carr et al. (2010) B. J. Carr, K. Kohri, Y. Sendouda, and J. Yokoyama, Phys. Rev. D 81, 104019 (2010).
- Bird et al. (2022) S. Bird et al., (2022), arXiv:2203.08967 [hep-ph] .
- Carr and Kuhnel (2022) B. Carr and F. Kuhnel, SciPost Phys. Lect. Notes 48, 1 (2022), arXiv:2110.02821 [astro-ph.CO] .
- Wu et al. (2022) Y.-P. Wu, E. Pinetti, and J. Silk, Phys. Rev. Lett. 128, 031102 (2022), arXiv:2109.09875 [astro-ph.CO] .
- Flores and Kusenko (2021) M. M. Flores and A. Kusenko, (2021), arXiv:2108.08416 [hep-ph] .
- Zhang et al. (2021) F. Zhang, J. Lin, and Y. Lu, Phys. Rev. D 104, 063515 (2021), [Erratum: Phys.Rev.D 104, 129902 (2021)], arXiv:2106.10792 [gr-qc] .
- Villanueva-Domingo et al. (2021) P. Villanueva-Domingo, O. Mena, and S. Palomares-Ruiz, Front. Astron. Space Sci. 8, 87 (2021), arXiv:2103.12087 [astro-ph.CO] .
- Hasinger (2020) G. Hasinger, JCAP 07, 022 (2020), arXiv:2003.05150 [astro-ph.CO] .
- Zhang et al. (2022) X.-F. Zhang, J.-G. Cheng, B.-Y. Zhu, T.-C. Liu, Y.-F. Liang, and E.-W. Liang, Phys. Rev. D 105, 043011 (2022), arXiv:2109.09575 [astro-ph.CO] .
- Belotsky et al. (2014) K. M. Belotsky, A. D. Dmitriev, E. A. Esipova, V. A. Gani, A. V. Grobov, M. Y. Khlopov, A. A. Kirillov, S. G. Rubin, and I. V. Svadkovsky, Mod. Phys. Lett. A 29, 1440005 (2014), arXiv:1410.0203 [astro-ph.CO] .
- Laha (2019) R. Laha, Phys. Rev. Lett. 123, 251101 (2019), arXiv:1906.09994 [astro-ph.HE] .
- Dasgupta et al. (2020) B. Dasgupta, R. Laha, and A. Ray, Phys. Rev. Lett. 125, 101101 (2020), arXiv:1912.01014 [hep-ph] .
- Laha et al. (2020) R. Laha, J. B. Muñoz, and T. R. Slatyer, Phys. Rev. D 101, 123514 (2020), arXiv:2004.00627 [astro-ph.CO] .
- Laha et al. (2021) R. Laha, P. Lu, and V. Takhistov, Phys. Lett. B 820, 136459 (2021), arXiv:2009.11837 [astro-ph.CO] .
- Bird et al. (2016) S. Bird, I. Cholis, J. B. Muñoz, Y. Ali-Haïmoud, M. Kamionkowski, E. D. Kovetz, A. Raccanelli, and A. G. Riess, Phys. Rev. Lett. 116, 201301 (2016), arXiv:1603.00464 [astro-ph.CO] .
- Clesse and Garcia-Bellido (2020) S. Clesse and J. Garcia-Bellido, (2020), arXiv:2007.06481 [astro-ph.CO] .
- Deng (2021) H. Deng, JCAP 04, 058 (2021), arXiv:2101.11098 [astro-ph.CO] .
- Franciolini et al. (2022) G. Franciolini, V. Baibhav, V. De Luca, K. K. Y. Ng, K. W. K. Wong, E. Berti, P. Pani, A. Riotto, and S. Vitale, Phys. Rev. D 105, 083526 (2022), arXiv:2105.03349 [gr-qc] .
- Chen et al. (2022) Z.-C. Chen, C. Yuan, and Q.-G. Huang, Phys. Lett. B 829, 137040 (2022), arXiv:2108.11740 [astro-ph.CO] .
- Hütsi et al. (2021) G. Hütsi, M. Raidal, V. Vaskonen, and H. Veermäe, JCAP 03, 068 (2021), arXiv:2012.02786 [astro-ph.CO] .
- Ashoorioon et al. (2022) A. Ashoorioon, K. Rezazadeh, and A. Rostami, (2022), arXiv:2202.01131 [astro-ph.CO] .
- Carr (2005) B. J. Carr, in 59th Yamada Conference on Inflating Horizon of Particle Astrophysics and Cosmology (2005) arXiv:astro-ph/0511743 .
- Khlopov (2010) M. Y. Khlopov, Res. Astron. Astrophys. 10, 495 (2010), arXiv:0801.0116 [astro-ph] .
- Josan et al. (2009) A. S. Josan, A. M. Green, and K. A. Malik, Phys. Rev. D79, 103520 (2009), arXiv:0903.3184 [astro-ph.CO] .
- Tashiro and Sugiyama (2008) H. Tashiro and N. Sugiyama, Phys. Rev. D78, 023004 (2008), arXiv:0801.3172 [astro-ph] .
- Page (1976a) D. N. Page, Phys. Rev. D 13, 198 (1976a).
- Page (1976b) D. N. Page, Phys. Rev. D 14, 3260 (1976b).
- Page (1977) D. N. Page, Phys. Rev. D 16, 2402 (1977).
- Kohri et al. (2014) K. Kohri, T. Nakama, and T. Suyama, Phys. Rev. D 90, 083514 (2014), arXiv:1405.5999 [astro-ph.CO] .
- Ray et al. (2021) A. Ray, R. Laha, J. B. Muñoz, and R. Caputo, Phys. Rev. D 104, 023516 (2021), arXiv:2102.06714 [astro-ph.CO] .
- Ricotti (2007) M. Ricotti, Astrophys. J. 662, 53 (2007), arXiv:0706.0864 [astro-ph] .
- Ricotti et al. (2008) M. Ricotti, J. P. Ostriker, and K. J. Mack, Astrophys. J. 680, 829 (2008), arXiv:0709.0524 [astro-ph] .
- Poulin et al. (2017) V. Poulin, P. D. Serpico, F. Calore, S. Clesse, and K. Kohri, Phys. Rev. D96, 083524 (2017), arXiv:1707.04206 [astro-ph.CO] .
- Ali-Haïmoud and Kamionkowski (2017) Y. Ali-Haïmoud and M. Kamionkowski, Phys. Rev. D95, 043534 (2017), arXiv:1612.05644 [astro-ph.CO] .
- Yang (2021a) Y. Yang, Mon. Not. Roy. Astron. Soc. 508, 5709 (2021a), arXiv:2110.06447 [astro-ph.CO] .
- Carr et al. (2021) B. Carr, F. Kuhnel, and L. Visinelli, Mon. Not. Roy. Astron. Soc. 501, 2029 (2021), arXiv:2008.08077 [astro-ph.CO] .
- D’Agostino et al. (2022) R. D’Agostino, R. Giambò, and O. Luongo, (2022), arXiv:2204.02098 [gr-qc] .
- Mukhopadhyay et al. (2022) U. Mukhopadhyay, D. Majumdar, and A. Halder, (2022), arXiv:2203.13008 [astro-ph.CO] .
- Cang et al. (2022) J. Cang, Y. Gao, and Y.-Z. Ma, JCAP 03, 012 (2022), arXiv:2108.13256 [astro-ph.CO] .
- Yang (2021b) Y. Yang, Phys. Rev. D 104, 063528 (2021b), arXiv:2108.11130 [astro-ph.CO] .
- Natwariya et al. (2021) P. K. Natwariya, A. C. Nayak, and T. Srivastava, Mon. Not. Roy. Astron. Soc. 510, 4236 (2021), arXiv:2107.12358 [astro-ph.CO] .
- Mittal et al. (2022) S. Mittal, A. Ray, G. Kulkarni, and B. Dasgupta, JCAP 03, 030 (2022), arXiv:2107.02190 [astro-ph.CO] .
- Tashiro and Kadota (2021) H. Tashiro and K. Kadota, Phys. Rev. D 103, 123532 (2021), arXiv:2104.09738 [astro-ph.CO] .
- Yang (2020a) Y. Yang, Eur. Phys. J. Plus 135, 690 (2020a), arXiv:2008.11859 [astro-ph.CO] .
- Chen et al. (2016) L. Chen, Q.-G. Huang, and K. Wang, JCAP 1612, 044 (2016), arXiv:1608.02174 [astro-ph.CO] .
- Mack and Wesley (2008) K. J. Mack and D. H. Wesley, (2008), arXiv:0805.1531 [astro-ph] .
- Cang et al. (2021) J. Cang, Y. Gao, and Y. Ma, JCAP 05, 051 (2021), arXiv:2011.12244 [astro-ph.CO] .
- Mena et al. (2019) O. Mena, S. Palomares-Ruiz, P. Villanueva-Domingo, and S. J. Witte, Phys. Rev. D100, 043540 (2019), arXiv:1906.07735 [astro-ph.CO] .
- Saha and Laha (2022) A. K. Saha and R. Laha, Phys. Rev. D 105, 103026 (2022), arXiv:2112.10794 [astro-ph.CO] .
- Bowman et al. (2018) J. D. Bowman, A. E. E. Rogers, R. A. Monsalve, T. J. Mozdzen, and N. Mahesh, Nature 555, 67 (2018), arXiv:1810.05912 [astro-ph.CO] .
- Pritchard and Loeb (2012) J. R. Pritchard and A. Loeb, Rept. Prog. Phys. 75, 086901 (2012), arXiv:1109.6012 [astro-ph.CO] .
- Furlanetto et al. (2006a) S. Furlanetto, S. P. Oh, and F. Briggs, Phys. Rept. 433, 181 (2006a), arXiv:astro-ph/0608032 [astro-ph] .
- Chen et al. (2019) X. Chen, J. Burns, L. Koopmans, H. Rothkaehi, J. Silk, J. Wu, A.-J. Boonstra, B. Cecconi, C. H. Chiang, L. Chen, L. Deng, M. Falanga, H. Falcke, Q. Fan, G. Fang, A. Fialkov, L. Gurvits, Y. Ji, J. C. Kasper, K. Li, Y. Mao, B. Mckinley, R. Monsalve, J. B. Peterson, J. Ping, R. Subrahmanyan, H. Vedantham, M. Klein Wolt, F. Wu, Y. Xu, J. Yan, and B. Yue, arXiv e-prints , arXiv:1907.10853 (2019), arXiv:1907.10853 [astro-ph.IM] .
- Burns et al. (2021a) J. Burns et al., (2021a), arXiv:2103.05085 [astro-ph.CO] .
- Burns (2020) J. O. Burns, Philosophical Transactions of the Royal Society A: Mathematical, Physical and Engineering Sciences 379, 20190564 (2020).
- Burns et al. (2021b) J. Burns et al., (2021b), arXiv:2103.08623 [astro-ph.IM] .
- Plice et al. (2017) L. Plice, K. Galal, and J. O. Burns, arXiv e-prints , arXiv:1702.00286 (2017), arXiv:1702.00286 [astro-ph.IM] .
- Chen et al. (2019) X. Chen et al., in ISSI-BJ Forum: Discover the Sky by Longest Wavelength with Small Satellite Constellation (2019) arXiv:1907.10853 [astro-ph.IM] .
- Shi et al. (2022) Y. Shi, F. Deng, Y. Xu, F. Wu, Q. Yan, and X. Chen, Astrophys. J. 929, 32 (2022), arXiv:2203.01124 [astro-ph.IM] .
- Lewis and Challinor (2007) A. Lewis and A. Challinor, Phys. Rev. D 76, 083005 (2007), arXiv:astro-ph/0702600 .
- Loeb and Zaldarriaga (2004) A. Loeb and M. Zaldarriaga, Phys. Rev. Lett. 92, 211301 (2004), arXiv:astro-ph/0312134 .
- Santos et al. (2005) M. G. Santos, A. Cooray, and L. Knox, Astrophys. J. 625, 575 (2005), arXiv:astro-ph/0408515 .
- Zaldarriaga et al. (2004) M. Zaldarriaga, S. R. Furlanetto, and L. Hernquist, Astrophys. J. 608, 622 (2004), arXiv:astro-ph/0311514 .
- Natarajan and Schwarz (2009) A. Natarajan and D. J. Schwarz, Phys. Rev. D 80, 043529 (2009).
- Chen and Kamionkowski (2004) X. Chen and M. Kamionkowski, Phys. Rev. D 70, 043502 (2004).
- Zhang et al. (2007) L. Zhang, X. Chen, M. Kamionkowski, Z.-g. Si, and Z. Zheng, Phys. Rev. D 76, 061301 (2007).
- Slatyer (2016) T. R. Slatyer, Phys. Rev. D93, 023521 (2016), arXiv:1506.03812 [astro-ph.CO] .
- Zhang et al. (2006) L. Zhang, X.-L. Chen, Y.-A. Lei, and Z.-G. Si, Phys. Rev. D 74, 103519 (2006), arXiv:astro-ph/0603425 .
- Yang (2019) Y. Yang, Mon. Not. Roy. Astron. Soc. 486, 4569 (2019), arXiv:1904.09104 [astro-ph.CO] .
- Clark et al. (2018) S. Clark, B. Dutta, Y. Gao, Y.-Z. Ma, and L. E. Strigari, Phys. Rev. D98, 043006 (2018), arXiv:1803.09390 [astro-ph.HE] .
- Yang (2015) Y. Yang, Phys. Rev. D91, 083517 (2015), arXiv:1504.01195 [astro-ph.CO] .
- Madhavacheril et al. (2014) M. S. Madhavacheril, N. Sehgal, and T. R. Slatyer, Phys. Rev. D89, 103508 (2014), arXiv:1310.3815 [astro-ph.CO] .
- Stöcker et al. (2018) P. Stöcker, M. Krämer, J. Lesgourgues, and V. Poulin, JCAP 1803, 018 (2018), arXiv:1801.01871 [astro-ph.CO] .
- Blas et al. (2011) D. Blas, J. Lesgourgues, and T. Tram, Journal of Cosmology and Astroparticle Physics 2011, 034 (2011).
- Yang (2020b) Y. Yang, Phys. Rev. D 102, 083538 (2020b), arXiv:2009.11547 [astro-ph.CO] .
- Cumberbatch et al. (2010) D. T. Cumberbatch, M. Lattanzi, J. Silk, M. Lattanzi, and J. Silk, Phys. Rev. D82, 103508 (2010), arXiv:0808.0881 [astro-ph] .
- Ciardi and Madau (2003) B. Ciardi and P. Madau, Astrophys. J. 596, 1 (2003), arXiv:astro-ph/0303249 [astro-ph] .
- Yang (2018) Y. Yang, Phys. Rev. D98, 103503 (2018), arXiv:1803.05803 [astro-ph.CO] .
- Yuan et al. (2010) Q. Yuan, B. Yue, X.-J. Bi, X. Chen, and X. Zhang, JCAP 1010, 023 (2010), arXiv:0912.2504 [astro-ph.CO] .
- Kuhlen et al. (2006) M. Kuhlen, P. Madau, and R. Montgomery, Astrophys. J. 637, L1 (2006), arXiv:astro-ph/0510814 [astro-ph] .
- Liszt (2001) H. Liszt, Astron. Astrophys. 371, 698 (2001), arXiv:astro-ph/0103246 [astro-ph] .
- Yang (2016) Y. Yang, Eur. Phys. J. Plus 131, 432 (2016), arXiv:1612.06559 [astro-ph.CO] .
- Furlanetto et al. (2006b) S. R. Furlanetto, S. P. Oh, and E. Pierpaoli, Phys. Rev. D 74, 103502 (2006b), arXiv:astro-ph/0608385 .
- Bernal et al. (2018) J. L. Bernal, A. Raccanelli, L. Verde, and J. Silk, JCAP 05, 017 (2018), [Erratum: JCAP 01, E01 (2020)], arXiv:1712.01311 [astro-ph.CO] .
- Kesden et al. (2002) M. Kesden, A. Cooray, and M. Kamionkowski, Phys. Rev. Lett. 89, 011304 (2002), arXiv:astro-ph/0202434 .
- Oberoi and Pincon (2003) D. Oberoi and J.-L. Pincon, (2003), arXiv:astro-ph/0312171 .
- Jester and Falcke (2009a) S. Jester and H. Falcke, New Astronomy Reviews 53, 1 (2009a).
- Jester and Falcke (2009b) S. Jester and H. Falcke, New Astron. Rev. 53, 1 (2009b), arXiv:0902.0493 [astro-ph.CO] .
- Platania et al. (1998) P. Platania, M. Bensadoun, M. Bersanelli, G. De Amici, A. Kogut, S. Levin, D. Maino, and G. F. Smoot, Astrophys. J. 505, 473 (1998), arXiv:astro-ph/9707252 .
- Haslam et al. (1982) C. G. T. Haslam, C. J. Salter, H. Stoffel, and W. E. Wilson, Astronomy and Astrophysics Supplement 47, 1 (1982).
- Lawson et al. (1987) K. D. Lawson, C. J. Mayer, J. L. Osborne, and M. L. Parkinson, Mon. Not. Roy. Astron. Soc. 225, 307 (1987).
- Planck Collaboration (2016) Planck Collaboration, A&A 594, A25 (2016).
- Valdes et al. (2007) M. Valdes, A. Ferrara, M. Mapelli, and E. Ripamonti, Mon. Not. Roy. Astron. Soc. 377, 245 (2007), arXiv:astro-ph/0701301 .
- Burns (2021) J. O. Burns, Philosophical Transactions of the Royal Society of London Series A 379, 20190564 (2021), arXiv:2003.06881 .
- Dolgov and Silk (1993) A. Dolgov and J. Silk, Phys. Rev. D 47, 4244 (1993).
- Carr et al. (2016) B. J. Carr, K. Kohri, Y. Sendouda, and J. Yokoyama, Phys. Rev. D 94, 044029 (2016), arXiv:1604.05349 [astro-ph.CO] .
- Clesse and García-Bellido (2015) S. Clesse and J. García-Bellido, Phys. Rev. D 92, 023524 (2015), arXiv:1501.07565 [astro-ph.CO] .
- Kannike et al. (2017) K. Kannike, L. Marzola, M. Raidal, and H. Veermäe, JCAP 09, 020 (2017), arXiv:1705.06225 [astro-ph.CO] .
- Yokoyama (1998) J. Yokoyama, Phys. Rev. D 58, 107502 (1998), arXiv:gr-qc/9804041 .
- Niemeyer and Jedamzik (1999) J. C. Niemeyer and K. Jedamzik, Phys. Rev. D 59, 124013 (1999), arXiv:astro-ph/9901292 .
- Carr et al. (2017) B. Carr, M. Raidal, T. Tenkanen, V. Vaskonen, and H. Veermäe, Phys. Rev. D 96, 023514 (2017), arXiv:1705.05567 [astro-ph.CO] .
- Green (2016) A. M. Green, Phys. Rev. D 94, 063530 (2016), arXiv:1609.01143 [astro-ph.CO] .
- Bellomo et al. (2018) N. Bellomo, J. L. Bernal, A. Raccanelli, and L. Verde, JCAP 01, 004 (2018), arXiv:1709.07467 [astro-ph.CO] .
- Carr and Kuhnel (2020) B. Carr and F. Kuhnel, Ann. Rev. Nucl. Part. Sci. 70, 355 (2020), arXiv:2006.02838 [astro-ph.CO] .
- Kühnel and Freese (2017) F. Kühnel and K. Freese, Phys. Rev. D 95, 083508 (2017), arXiv:1701.07223 [astro-ph.CO] .
- Villanueva-Domingo and Ichiki (2021) P. Villanueva-Domingo and K. Ichiki, (2021), 10.1093/pasj/psab119, arXiv:2104.10695 [astro-ph.CO] .
- Tashiro and Sugiyama (2013) H. Tashiro and N. Sugiyama, Mon. Not. Roy. Astron. Soc. 435, 3001 (2013), arXiv:1207.6405 [astro-ph.CO] .
- Cole and Silk (2021) P. S. Cole and J. Silk, Mon. Not. Roy. Astron. Soc. 501, 2627 (2021), arXiv:1912.02171 [astro-ph.CO] .
- Afshordi et al. (2003) N. Afshordi, P. McDonald, and D. N. Spergel, Astrophys. J. Lett. 594, L71 (2003), arXiv:astro-ph/0302035 .
- Hlozek et al. (2012) R. Hlozek, J. Dunkley, G. Addison, J. W. Appel, J. R. Bond, C. S. Carvalho, S. Das, M. J. Devlin, R. Dünner, T. Essinger-Hileman, J. W. Fowler, P. Gallardo, A. Hajian, M. Halpern, M. Hasselfield, M. Hilton, A. D. Hincks, J. P. Hughes, K. D. Irwin, J. Klein, A. Kosowsky, T. A. Marriage, D. Marsden, F. Menanteau, K. Moodley, M. D. Niemack, M. R. Nolta, L. A. Page, L. Parker, B. Partridge, F. Rojas, N. Sehgal, B. Sherwin, J. Sievers, D. N. Spergel, S. T. Staggs, D. S. Swetz, E. R. Switzer, R. Thornton, and E. Wollack, The Astrophysical Journal 749, 90 (2012).
- Bird et al. (2011) S. Bird, H. V. Peiris, M. Viel, and L. Verde, Monthly Notices of the Royal Astronomical Society 413, 1717 (2011).
- Tinker et al. (2012) J. L. Tinker, E. S. Sheldon, R. H. Wechsler, M. R. Becker, E. Rozo, Y. Zu, D. H. Weinberg, I. Zehavi, M. R. Blanton, M. T. Busha, and B. P. Koester, The Astrophysical Journal 745, 16 (2012).
- Germani and Prokopec (2017) C. Germani and T. Prokopec, Phys. Dark Univ. 18, 6 (2017), arXiv:1706.04226 [astro-ph.CO] .
- Byrnes et al. (2019) C. T. Byrnes, P. S. Cole, and S. P. Patil, JCAP 06, 028 (2019), arXiv:1811.11158 [astro-ph.CO] .
- Passaglia et al. (2019) S. Passaglia, W. Hu, and H. Motohashi, Phys. Rev. D 99, 043536 (2019), arXiv:1812.08243 [astro-ph.CO] .
- Zhai et al. (2022) R. Zhai, H. Yu, and P. Wu, Phys. Rev. D 106, 023517 (2022), arXiv:2207.12745 [gr-qc] .
- Raveendran et al. (2022) R. N. Raveendran, K. Parattu, and L. Sriramkumar, Gen. Rel. Grav. 54, 91 (2022), arXiv:2206.05760 [astro-ph.CO] .
- Cai et al. (2022) Y.-F. Cai, X.-H. Ma, M. Sasaki, D.-G. Wang, and Z. Zhou, (2022), arXiv:2207.11910 [astro-ph.CO] .
- Heydari and Karami (2022) S. Heydari and K. Karami, JCAP 03, 033 (2022), arXiv:2111.00494 [gr-qc] .
- Yi et al. (2021) Z. Yi, Q. Gao, Y. Gong, and Z.-h. Zhu, Phys. Rev. D 103, 063534 (2021), arXiv:2011.10606 [astro-ph.CO] .
- Ünal et al. (2021) C. Ünal, E. D. Kovetz, and S. P. Patil, Phys. Rev. D 103, 063519 (2021), arXiv:2008.11184 [astro-ph.CO] .
- Cai et al. (2020) R.-G. Cai, Z.-K. Guo, J. Liu, L. Liu, and X.-Y. Yang, JCAP 06, 013 (2020), arXiv:1912.10437 [astro-ph.CO] .
- Mishra and Sahni (2020) S. S. Mishra and V. Sahni, JCAP 04, 007 (2020), arXiv:1911.00057 [gr-qc] .
- Kalaja et al. (2019) A. Kalaja, N. Bellomo, N. Bartolo, D. Bertacca, S. Matarrese, I. Musco, A. Raccanelli, and L. Verde, JCAP 10, 031 (2019), arXiv:1908.03596 [astro-ph.CO] .
- Carrilho et al. (2019) P. Carrilho, K. A. Malik, and D. J. Mulryne, Phys. Rev. D 100, 103529 (2019), arXiv:1907.05237 [astro-ph.CO] .
- Gao and Guo (2018) T.-J. Gao and Z.-K. Guo, Phys. Rev. D 98, 063526 (2018), arXiv:1806.09320 [hep-ph] .
- Zhou et al. (2020) Z. Zhou, J. Jiang, Y.-F. Cai, M. Sasaki, and S. Pi, Phys. Rev. D 102, 103527 (2020), arXiv:2010.03537 [astro-ph.CO] .
- Cai et al. (2018) Y.-F. Cai, X. Tong, D.-G. Wang, and S.-F. Yan, Phys. Rev. Lett. 121, 081306 (2018), arXiv:1805.03639 [astro-ph.CO] .
- Ashoorioon et al. (2021a) A. Ashoorioon, A. Rostami, and J. T. Firouzjaee, JHEP 07, 087 (2021a), arXiv:1912.13326 [astro-ph.CO] .
- Ashoorioon et al. (2021b) A. Ashoorioon, A. Rostami, and J. T. Firouzjaee, Phys. Rev. D 103, 123512 (2021b), arXiv:2012.02817 [astro-ph.CO] .