ID and OOD Performance Are Sometimes
Inversely Correlated on Real-world Datasets
Abstract
Context. Several studies have compared the in-distribution (ID) and out-of-distribution (OOD) performance of models in computer vision and NLP. They report a frequent positive correlation and some surprisingly never even observe an inverse correlation indicative of a necessary trade-off. The possibility of inverse patterns is important to determine whether ID performance can serve as a proxy for OOD generalization capabilities.
Findings. This paper shows with multiple datasets that inverse correlations between ID and OOD performance do happen in real-world data — not only in theoretical worst-case settings. We also explain theoretically how these cases can arise even in a minimal linear setting, and why past studies could miss such cases due to a biased selection of models.
Implications. Our observations lead to recommendations that contradict those found in much of the current literature.
-
•
High OOD performance sometimes requires trading off ID performance.
-
•
Focusing on ID performance alone may not lead to optimal OOD performance. It may produce diminishing (eventually negative) returns in OOD performance.
-
•
In these cases, studies on OOD generalization that use ID performance for model selection (a common recommended practice) will necessarily miss the best-performing models, making these studies blind to a whole range of phenomena.
1 Introduction
Past observations.
This paper complements existing studies that empirically compare in-distribution (ID) and out-of-distribution111We use “OOD” to refer to test data conforming to covariate shifts [40] w.r.t. the training data. (OOD) performance of deep learning models [2, 6, 24, 21, 23, 41, 48]. It has long been known that models applied to OOD data suffer a drop in performance, e.g. in classification accuracy. The above studies show that, despite this gap, ID and OOD performance are often positively correlated222We use “correlation” to refer both to linear and non-linear relationships. across models on benchmarks in computer vision [24] and NLP [23].
Past explanations.
Frequent positive correlations are surprising because nothing forbids opposite, inverse ones. Indeed, ID and OOD data contain different associations between labels and features. One could imagine e.g. that an image background is associated with class ID and class OOD. The more a model relies on the presence of this background, the better its ID performance but the worse its OOD performance, resulting in an inverse correlation. Never observing inverse correlations has been explained with the possibility that real-world benchmarks only contain mild distribution shifts [21]. We will show that it can also result from of a flawed experimental design.
[figure]capposition=beside,capbesideposition=center,floatwidth=0.41capbesidewidth=0.55
| Toy representations (one point = one model) | ||
| Positive correlation | Inverse correlation | |
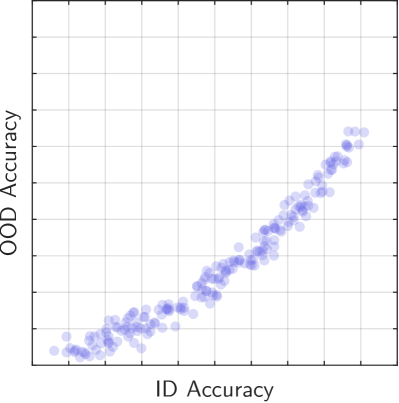 |
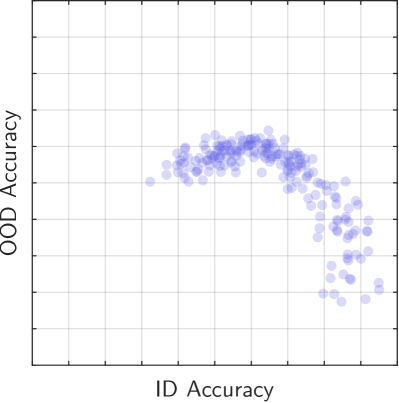 |
|
[figure]capposition=below,floatwidth=
A recent large-scale study by [48] shows that not all datasets display a clear positive correlation. The authors observe other patterns that sometimes reveal underspecification [5] or severe shifts that prevent any training / test transfer. Surprisingly however, they never observe inverse correlations:
This does not match our own general experience, and this paper presents several cases of inverse correlations on popular real-world datasets used for OOD research (on Camelyon17 in Section 3 and on 4 out of 5 other datasets in Appendix B). Our experiments reveal inverse correlations across models trained with varying numbers of epochs and random seeds. They are even more striking when models are trained with a regularizer that diversifies the solutions to the ERM objective [45].
Explaining inverse correlations.
We refer to the underlying cause as misspecification, by extension of underspecification which was used to explain why models with similar ID performance can vary in OOD performance [5, 16, 46]. In cases of misspecification, the standard ERM objective (empirical risk minimization) drives ID performance but conflicts with the goal of OOD performance. ID and OOD metrics can then vary independently and inversely to one another. In Section 6, we present a minimal theoretical example to illustrate how inverse correlations originate from the presence of both robust and spurious features in the data. In Section 7, we show that different patterns of ID / OOD performance occur with different magnitudes of distribution shifts.
Summary of contributions.
-
•
An empirical examination of ID vs. OOD performance on several real-world datasets showing inverse correlation patterns that conflict with past evidence (Section 3).
-
•
An explanation and an empirical verification of why past studies missed such patterns (Section 4).
- •
-
•
A revision of conclusions and recommendations made in past studies (Section 8).
2 Previously-observed ID vs. OOD patterns
Multiple studies conclude that ID and OOD performance vary jointly across models on many real-world datasets [6, 24, 41]. Miller et al. [24] report an almost-systematic linear correlation333The “linear trend” is not really linear: it applies to probit-scaled accuracies (a non-linear transform). between probit-scaled ID and OOD accuracies. Mania and Sra [21] explain this trend with the fact that many benchmarks contain only mild shifts.444[21] explains linear trends with (1) data points having similar probabilities of occurring ID and OOD, and (2) a low probability that a model correctly classifies points that a higher-accuracy model misclassifies. Andreassen et al. [2] find that pretrained models perform “above the linear trend” in early stages of fine-tuning. The OOD accuracy then rises more quickly than the ID accuracy early on, though the final accuracies agree with a linear trend across models.
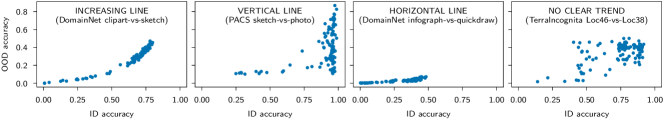
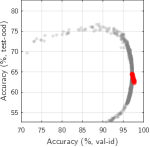
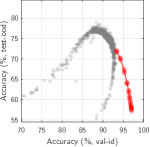
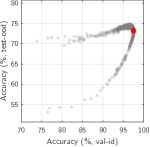
Most recently, the large-scale study of Wenzel et al. [48] is more nuanced: they observe a linear trend only on some datasets. Their setup consists in fine-tuning an ImageNet-pretrained model on a chosen dataset and evaluating it on ID and OOD splits w.r.t. this dataset. They repeat the procedure with a variety of datasets, architectures, and other implementation choices such as data augmentations. The scatter plots of ID / OOD accuracy in [48] show four typical patterns (Figure 2).
-
1.
Increasing line (positive correlation): mild distribution shift. ID and OOD accuracies are positively correlated. Focusing on classical (ID) generalization brings concurrent OOD improvements.
-
2.
Vertical line: underspecification [5, 16, 46]. Different models obtain a similar high ID performance but different OOD performance. The objective of high ID performance does not sufficiently constrains the learning. Typically, multiple features in the data (a.k.a. biased or spurious features) can be used to obtain high ID performance, but not all of them are equally reliable on OOD data. To improve OOD performance, additional task-specific information is necessary, e.g. additional supervision or inductive biases (custom architectures, regularizers, etc.).
-
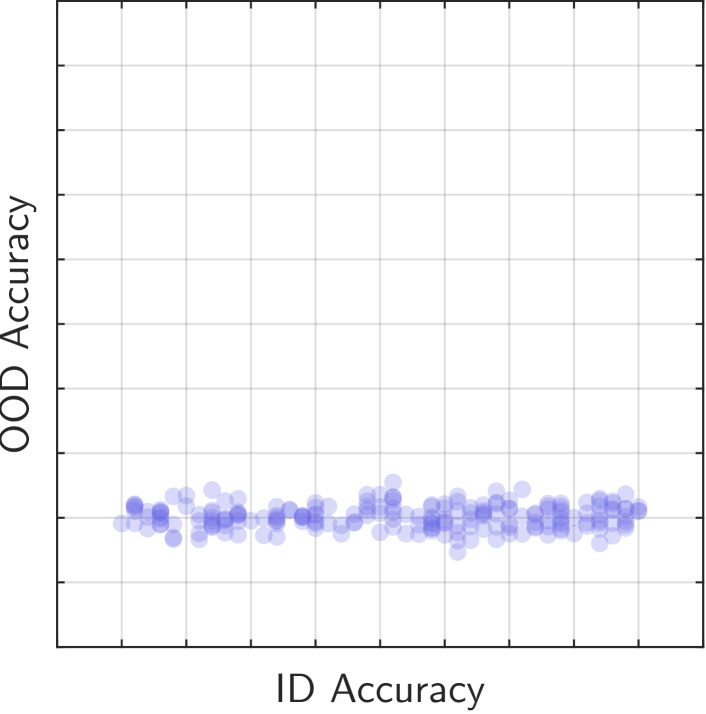
3.
Horizontal line, low OOD accuracy: severe distribution shift. No model performs well OOD. A severe shift prevents any transfer between training and OOD test data. The task needs to be significantly more constrained e.g. with task-specific inductive biases.
-
4.
No clear trend: underspecification. Models show a variety of ID and OOD accuracies. The difference with (2) is the wider variety along the ID axis, e.g. because a difficult learning task yields solutions of lower ID accuracy from local minima of the ERM objective.
The authors note the absence of decreasing patterns, which are however possible in theory.
-
5.
Decreasing line (inverse correlation): misspecification. The highest accuracy ID and OOD are achieved by different models. Optima of the ERM objective, which are expected to be optima in ID performance, do not correspond to optima in OOD performance. This implies a trade-off: higher OOD performance is possible at the cost of lower ID performance.

3 New observations: inversely correlated ID / OOD performance
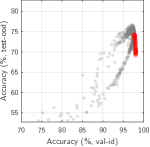
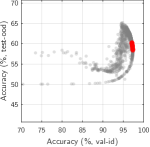
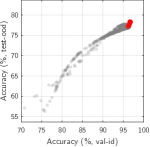
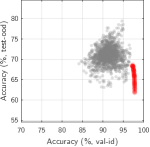
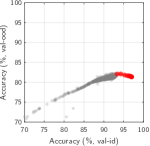
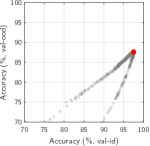
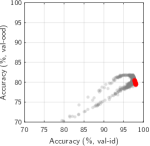
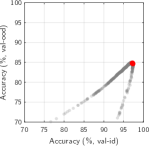
This section is an in-depth examination using the WILDS-Camelyon17 dataset [15]. We include experiments on other datasets in Section 5 and Appendix B. Here, we use Camelyon17 in a manner similar to Wenzel et al. [48]. These authors evaluated different architectures and assumed that their different inductive biases can produce models that cover a range of ID / OOD accuracies. In contrast and for simplicity, we rely instead on different random seeds since [5] showed that this is sufficient to cover a variety of ID / OOD accuracies on this dataset. We also want to minimize the experimenter’s bias. Therefore, to further increase variety without the manual arbitrary selection of architectures of [48], we also train models with the general-purpose, diversity-inducing method of [45].
Experimental details.
We use 10 DenseNet-121 models pretrained by the authors of the dataset with different seeds [15]. For each, we re-train the last linear layer from a random initialization for 1 to 10 epochs, keeping other layers frozen. These are referred to as ERM models. We perform this re-training with 10 different seeds which gives ERM models (10 pretraining seeds 10 re-training seeds 10 numbers of epochs). In addition, we repeat this re-training of the last layer with the diversity-inducing method of [45] (details in the box below). These are referred to as diverse models. Each run of the methods produces 24 different models, giving a total of such models.
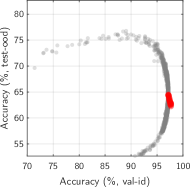
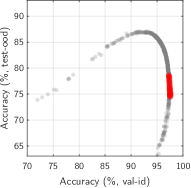
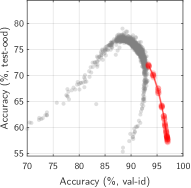
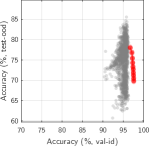
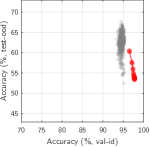
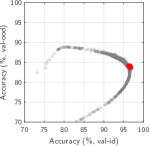
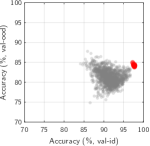
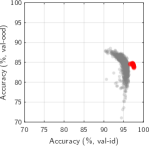
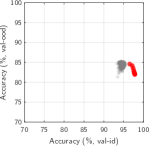
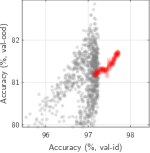
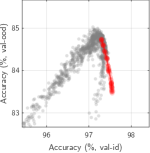
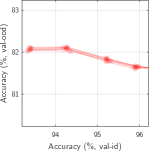
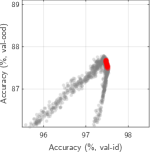
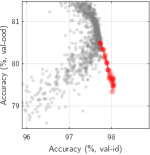
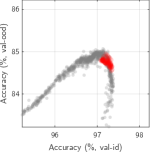
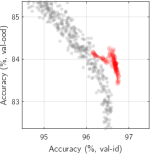
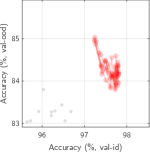
Results with ERM models.
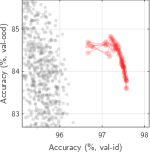
In Figure 3 we plot the ID vs. OOD accuracy of ERM models as red dots ( ). Each panel corresponds to a different pretraining seed. The variation across panels (note the different Y-axis limits) shows that OOD performance varies across pre-training seeds even though the ID accuracy is similar, as noted by [15]. Our new observations are visible within each panel. The dots (models) in any panel differ in their re-training seed and/or number of epochs. The seeds induce little variation, but the number of epochs produce patterns of decreasing trend (negative correlation). Despite the narrow ID variation (X axis), careful inspection confirms that the pattern appears in nearly all cases (see Appendix A for zoomed-in plots).
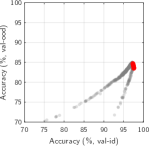
Results with diverse models.
We plot models trained with the diversity method [45] as gray dots ( ). These models cover a wider range of accuracies and form patterns that extend those of ERM models. The decreasing trend is now obvious. This trend is clearly juxtaposed with a rising trend of positive ID / OOD correlation. This suggests a point of highest OOD performance after which the model overfits to ID data. Appendix A shows similar results with other pretraining seeds. The patterns are not always clearly discernible because large regions of the performance landscape are not covered, despite the diversity-inducing method. We further discuss this issue next.
4 Past studies missed negative correlations due to biased sampling of models
We identified several factors explaining the discrepancy between our observations and past studies.
-
•
ERM models alone do not always form clear patterns (red dots in Figure 3). In our observations, the models trained with a diversity-inducing method (gray dots ) were key in making the suspected patterns more obvious, because they cover a wider range of accuracies.
-
•
The ID / OOD trade-off varies during training, as noted by [2]. This variation across training epochs is responsible for much of the newly observed patterns. However, models of different architectures or pretraining seeds are not always comparable with one another because of shifts in their overall performance (see e.g. different Y-axis limits across panels in Figure 3). Therefore the performance across epochs should be analyzed individually per model.
-
•
The “inverse correlation” patterns are not equally visible with all pretraining seeds. In some cases, a careful examination of zoomed-in plots is necessary, see Appendix A. This is a reminder that stochastic factors in deep learning can have large effects and that empirical studies should randomize them as much as possible.
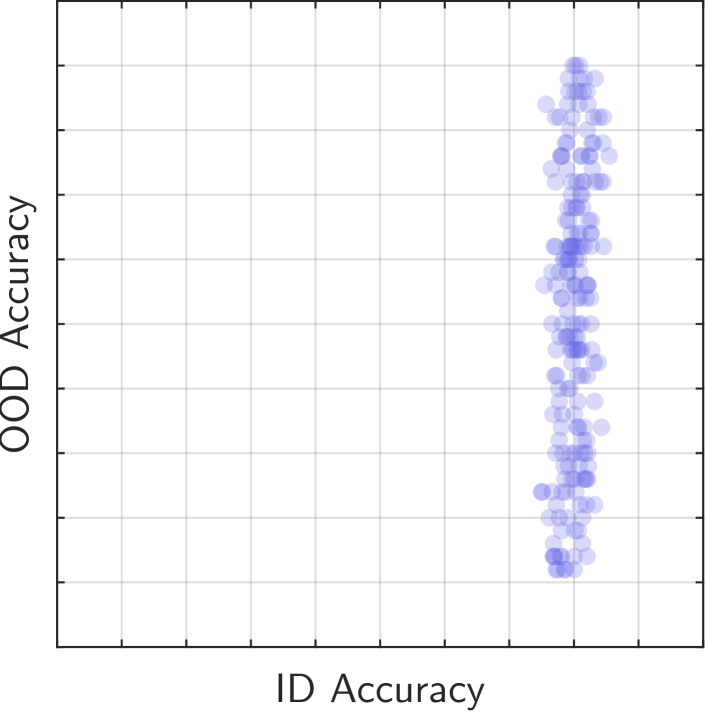
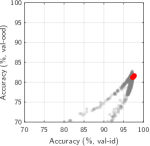
To demonstrate these points, we plot our data (same as in Figure 3) while keeping only the ERM models trained for 10 epochs and including all pretraining seeds on the same panel. Figure 5 shows that these small changes reproduce the vertical line observed by Wenzel et al. [48], which completely misses the inverse correlations patterns visible in Figure 3.
[figure]capposition=beside,capbesideposition=center,right,floatwidth=0.26capbesidewidth=0.66
[figure]capposition=below,floatwidth=
A general explanation is that past studies undersample regions of the ID / OOD performance space. They usually consider a variety of architectures in an attempt to sample this space. However, different architectures do not necessarily behave very differently from one another (see the box below). We lack methods to reliably identify models of high OOD performance, but the diversity-inducing method that we use yields models spanning a wide range of the performance spectrum.
5 Occurrences in other datasets
We performed experiments on five additional datasets used in OOD research and found inverse correlations to different extent on four out of five. See Appendix B for full details and results.
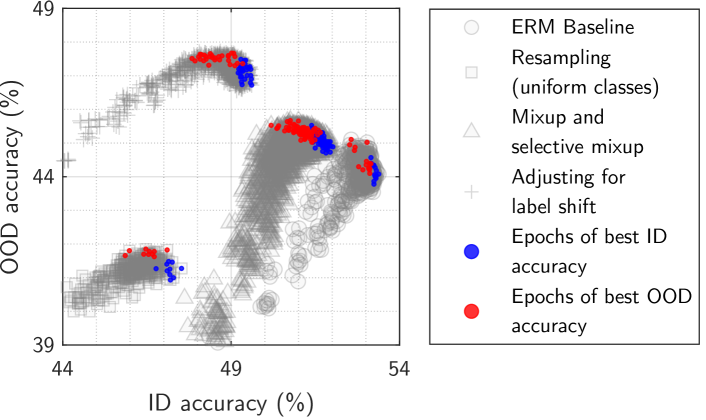
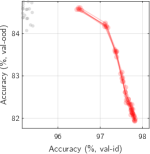
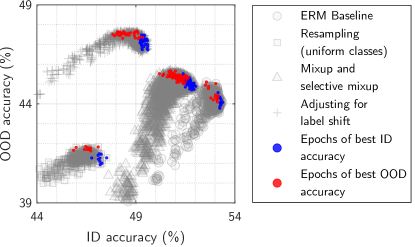
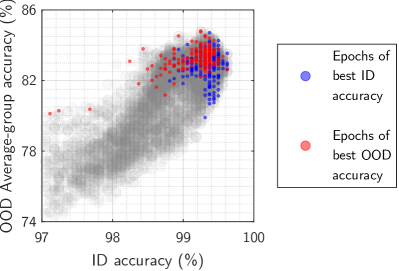
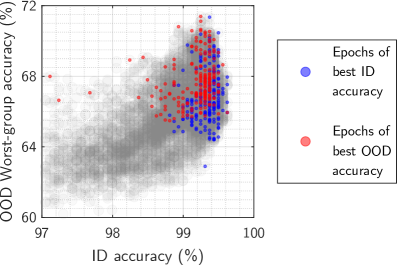
In these experiments, we train standard architectures with well-known methods: standard ERM, simple class balancing [12], mixup [58], selective mixup [54], and post hoc adjustment for label shift [19] (we did not use the diversification method from Section 3). We repeat every experiment with 10 seeds and plot the ID / OOD accuracy from every epoch in Figure 6.
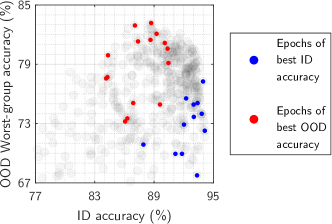
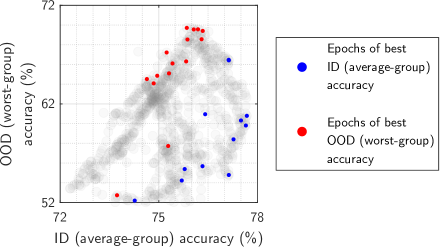
On the WildTime-arXiv [53] and waterbirds datasets [36], we observe wide variations in both ID and OOD performance across seeds, epochs, and methods. For every run, we highlight the epochs of highest ID (blue) or OOD performance (red), which would likely be selected based on these validation criteria. There is a clear trade-off, both within and across methods. In other words, ID validation is ill-suited for early stopping as well as model selection.

5.1 Occurrences in the existing literature
A literature review reveals other cases across a range of topics, many of which were not particularly highlighted by their authors and required close examination.
-
•
A close examination of [9, Table 2] reveals a clear inverse pattern on three benchmarks for natural language inference (NLI). This task is known for biases and shortcuts in the training data, and the OOD test sets in these benchmarks correspond to severe distribution shifts. Our proposed explanation (right end of the spectum in Figure 7) therefore aligns with these observations. Experiments on question answering from the same authors use data with milder distribution shifts. Correspondingly, they show instead a positive correlation.
-
•
Kaplun et al. [14, Figure 7] find that the CIFAR dataset contains a subset (CIFAR-10-Neg) on which the performance of visual classifiers is inversely correlated with their ID performance.
-
•
Xie et al. [51, Section 5.3] discuss cases of inverse correlation on the CelebA dataset with their In-N-Out method – albeit within an overall positive trend.
-
•
McCoy et al. [22] show that BERT models trained with different seeds vary widely in performance on the HANS benchmark for NLI while their ID performance on MNLI is similar.
-
•
Naganuma et al. [25] performed an extensive evaluation on OOD benchmarks after the initial release of this paper. They consider a wider range of hyperparameters than existing works, and as expected from our claims, they observe a broader range of ID / OOD relations than the “linear trend”.
-
•
Liang et al. [18] focused on datasets with subpopulation shifts and analyzed the relation between performance across subgroups. They also find a linear trend to be an inaccurate description. They observe non-linear relations with a transition point between models showing a negative correlation and others showing a positive one.
-
•
In their paper on Model recycling, Ramé et al. [30] include plots of ID / OOD performance (Appendix A) that are nothing like linear correlations. Instead, bell-shaped curves unambiguously indicate a necessary trade-off between ID and OOD performance.
- •
-
•
The literature on transfer learning has previously shown occasional cases of negative transfer, a related phenomenon where improving performance in one domain hurts in others.
6 Theoretical analysis
We present a minimal case of a trade-off between ID and OOD performance to aid understanding its cause and show it can occur even in a simple linear setting. Let be the target variable predicted by the model and the features used as input. Without loss of generality, we consider a regression setting for mathematical convenience, though the results are valid for classification as well. The purpose of this analysis is to investigate theoretically how variations in certain input features correspond to changes in risk (i.e. expected loss) on OOD data. We consider the input features to be a concatenation of invariant and spurious elements: with and . Following [4, 33, 59], we consider the simple data-generating process defined by the following structural equations: , and where is an environment index referring to ID or OOD data, is a vector of ones and denotes the element-wise product. The random variables and represent symmetric independent random noise with zero-mean, sub-Gaussian tail probabilities such that , , . The vector determines the linear relation between the target variable and the invariant features, which is identical across environments. In contrast, the vector acts on the spurious features and is environment-specific. Invariant features are similarly predictive on ID and OOD data while spurious ones are not.
Let us now study the relationship between ID and OOD performance of a predictive model that relies on a subset of the features (not that the subset could be spurious or invariant). This subset is represented with a binary mask . Suppose we have selected invariant features and spurious features, with the number of selected features.We denote the selected features by with . To investigate the changes in model performance, we consider a simple linear regression model. This enables us to theoretically measure the sensitivity of predictions when additional spurious features are added without complications from non-linearities. We denote with and the in- and out-of-domain expectation, and with the optimal parameters of the linear regression for a certain domain, i.e. . The MSE loss of the fitted linear regressor is then . Given the feature mask , we denote with and the risk of the model on the in and out-of-domain distribution, respectively. Theorem 1 below (see complete form including assumptions and proof in Appendix C) examines how the ID and OOD risks of the model vary as additional spurious features are included into to obtain .
Theorem 1.
Under Assumption 1 and sufficient changes in , including an additional spurious feature leads to:
Theorem 1 shows that adding a spurious feature to those used by the model can affect its ID and OOD losses in opposite directions, implying a trade-off between ID and OOD accuracy. In other words, this minimal case shows that a simple model without/with an extra (spurious) feature can exhibit an inverse correlation between its ID and OOD performance.
7 Ordering ID / OOD patterns according to shift magnitude
The above analysis shows that inverse correlation patterns are essentially due to the presence of spurious features, i.e. features whose predictive relation with the target in ID data becomes misleading OOD. Occurrences of spurious features increase with the magnitude of the distribution shift. Therefore, the possible patterns in ID / OOD performance presented in Section 2 can be ordered according to the magnitude of the distribution shift they are likely to occur with (see Figure 7).
| Positive transfer | Underspecification | Misspecification | No transfer | |||||
| Distribution shift | Mild (Too?) Severe | |||||||
| Typical pattern | Positive correlation | Vertical line/no clear trend | Negative correlation | Low horizontal line | ||||
| (toy representation) |

|
|

|
|
||||
| Valid approaches | Simply focus | Task-relevant inductive biases e.g. arch., regularizers. | Open | |||||
| for improving OOD | on improving | Data augmentation with task-relevant transformatiofns. | question | |||||
| performance | ID performance | Non-i.i.d. training data e.g. multiple training domains. | ||||||
| Example | ImageNet | PACS sketch | WILDS | DomainNet | ||||
| datasets | ImageNet v2 | photograph | Camelyon17 | infographquickdraw | ||||
| [31] | [17] | [15] | [15] | |||||
With the smallest distribution shifts (leftmost case in Figure 7), for example training on ImageNet and testing on its replication ImageNet v2 [31], ID validation performance closely correlates with OOD test performance. This OOD setting is the easiest because one can focus on improving classical generalization and reap concurrent improvements OOD.
With a larger distribution shift, more features are likely to be spurious, which is likely to break the ID / OOD correlation. The task of improving OOD performance is likely to be under- or misspecified, i.e. there is not enough information to determine which features a model should rely on.
Valid approaches include modifying the training objective, injecting task-specific information (e.g. building-in invariance to rotations as in [42]), well-chosen data augmentations, or inhomogeneous training data such as multiple training environments [17] or counterfactuals [43, 1].
With extreme distribution shifts, most predictive features are overwhelmingly spurious and it is very difficult to learn any one relevant in OOD data (rightmost case in Figure 7).
The proposed ordering of patterns is rather informal and could be further developed following the two axes of diversity shifts and correlation shifts proposed by [56] (see also [50]). More recently, [47] showed that the suitability of various methods for OOD generalization depends on particularities of the underlying causal structure of the task – which must therefore be known to select a suitable method. Identifying which ID / OOD patterns occur with particular causal structures might serve as a tool to understand the type of OOD situation one is facing and identify a suitable method.
8 Revisiting advice from past studies
We have established that observations in past studies were incomplete. We now bring nuance to some recommendations and conclusions made in these studies.
-
•
Focusing on a single metric. “We see the following potential prescriptive outcomes (…) correlation between OOD and ID performance can simplify model development since we can focus on a single metric.” [24]
We demonstrated that inverse correlations do occur, hence there exist scenarios where ID performance is misleading. Relying on a single metric for model development is ill-advised [44] especially if it cannot capture necessary trade-offs. We recommend tracking multiple metrics e.g. performance on multiple distributions or interpretable predictions on representative test points.
-
•
Improving ID performance for OOD robustness. “If practitioners want to make the model more robust on OOD data, the main focus should be to improve the ID classification error. (…) We speculate that the risk of overfitting large pretrained models to the downstream test set is minimal, and it seems to be not a good strategy to, e.g., reduce the capacity of the model in the hope of better OOD generalization.” [48]
This recommendation assumes the persistence of a positive correlation. On the opposite, we saw that a positive correlation can precede a regime of inverse correlation (Figure 3, left panels). If the goal is to improve OOD, focusing on ID performance is a blind alley since this goal requires to increase ID performance at times and reduce it at others.
- •
As obvious as it is, it feels necessary to point out that empirical studies only chart regimes achievable with existing methods. Observations have limited predictive power, hence more care seems warranted when deriving prescriptive recommendations from empirical evidence.
The best possible performance e.g. on Camelyon17 is obviously not limited to the Pareto front of our experiments. The state of the art on this dataset [32, 49] injects additional task knowledge to bypass the under/misspecification of ERM, and exceeds both our highest ID and OOD performance. The important message remains that a given hypothesis class (DenseNet architecture in our case) admits parametrizations on which ID and OOD metrics do not necessarily correlate.
Possible invalidation of existing studies. The possibility of inverse correlations may invalidate studies that implicitly assume a positive one. For example, Angarano et al. [3] evaluate the OOD robustness of computer vision backbones. They find modern architectures surpass domain generalization methods. However, they discard any model with submaximal ID performance by performing “training domain validation” as in [10]. Any model with high OOD performance but suboptimal ID is ignored. They also train every model for a fixed, large number of epochs. And this may additionally prevent from finding models with high OOD performance since robustness is often progressively lost during fine-tuning [2].
By design, this study [3] is incapable of finding OOD benefits of architectures or methods that require trading off some ID performance. Most importantly, once the assumption of a positive correlation is enacted by throwing away models with submaximal ID performance, there is no more opportunity to demonstrate its validity.
An even more recent example of this fallacy is found in [20]. The authors construct a new OOD benchmark, train and tune baselines for maximum ID performance, then observe: “We find no [positive nor inverse] correlation between in- and out-of-distribution environment performance. All methods consistently achieve 98-99% ID test performance.” [20]
But the authors did not give the chance to make any other observation. As in Figure 5, the ID criterion means that we only get to observe a thin vertical slice of the ID vs. OOD plot.555Statements in [20] are factually correct but misleading. They are equivalent to “we did not detect X” but leave it to the reader to figure out “we designed our experiments such that there is no way of detecting X”.
9 Discussion
This paper highlighted that inverse correlations between ID / OOD performance are possible, not only theoretically but also with real-world data. It is difficult to estimate how frequent this situation is. Although we examined a single counterexample,we also showed that past studies may have systematically overlooked such cases. This suffices to show that one cannot know a priori where a task falls on the spectrum of Figure 7. It is clearly ill-advised to blindly assume a positive correlation.
Can we avoid inverse correlations with more training data?
Scaling alone without data curation seems unlikely to prevent inverse correlations. [8] examined a more general question and determined that the impressive robustness of the large vision-and-language model CLIP is determined by the distribution of its training data rather than its quantity. Similarly, inverse correlations stem from biases in the training distribution (e.g. a class appearing more frequently with image background than any other). And biases in a distribution do not vanish with more i.i.d. samples. Indeed, more data can cover more of the support of the distribution, but this coverage will remain uneven, i.e. biased. The problem can become one of “subpopulation shift” [37] rather than distribution shift, but it remains similarly challenging.
Training full networks with a diversity-inducing method.
We showed inverse correlations with standard ERM models and with linear classifiers trained with a diversity-inducing method [45]. To the best of our knowledge, this diversity method has not been applied to deep models because of its computational expense. It would be interesting to confirm our observations on networks trained entirely with diversity-inducing methods.
Qualitative differences along the Pareto frontier.
Besides quantitative performance, interpretability methods could examine whether various ID / OOD trade-off models rely on different features and generalization strategies as done in NLP in [13].
Model selection for OOD generalization
has recently seen promising advances. [7] get around selection based on either ID or OOD validation data with a tunable trade-off in their Quantile Risk Minimization method. And [47] examined existing approaches to OOD generalization from their suitability to various distribution shifts and causal structures.
References
- Abbasnejad et al. [2020] Ehsan Abbasnejad, Damien Teney, Amin Parvaneh, Javen Shi, and Anton van den Hengel. Counterfactual vision and language learning. In Proceedings of the IEEE/CVF Conference on Computer Vision and Pattern Recognition (CVPR), June 2020.
- Andreassen et al. [2021] Anders Andreassen, Yasaman Bahri, Behnam Neyshabur, and Rebecca Roelofs. The evolution of out-of-distribution robustness throughout fine-tuning. arXiv preprint arXiv:2106.15831, 2021.
- Angarano et al. [2022] Simone Angarano, Mauro Martini, Francesco Salvetti, Vittorio Mazzia, and Marcello Chiaberge. Back-to-bones: Rediscovering the role of backbones in domain generalization. arXiv preprint arXiv:2209.01121, 2022.
- Arjovsky et al. [2019] Martin Arjovsky, Léon Bottou, Ishaan Gulrajani, and David Lopez-Paz. Invariant risk minimization. arXiv preprint arXiv:1907.02893, 2019.
- D’Amour et al. [2020] Alexander D’Amour, Katherine Heller, Dan Moldovan, Ben Adlam, Babak Alipanahi, Alex Beutel, Christina Chen, Jonathan Deaton, Jacob Eisenstein, Matthew D Hoffman, et al. Underspecification presents challenges for credibility in modern machine learning. arXiv preprint arXiv:2011.03395, 2020.
- Djolonga et al. [2021] Josip Djolonga, Jessica Yung, Michael Tschannen, Rob Romijnders, Lucas Beyer, Alexander Kolesnikov, Joan Puigcerver, Matthias Minderer, Alexander D’Amour, Dan Moldovan, et al. On robustness and transferability of convolutional neural networks. In Proc. IEEE Conf. Comp. Vis. Patt. Recogn., 2021.
- Eastwood et al. [2022] Cian Eastwood, Alexander Robey, Shashank Singh, Julius von Kügelgen, Hamed Hassani, George J Pappas, and Bernhard Schölkopf. Probable domain generalization via quantile risk minimization. arXiv preprint arXiv:2207.09944, 2022.
- Fang et al. [2022] Alex Fang, Gabriel Ilharco, Mitchell Wortsman, Yuhao Wan, Vaishaal Shankar, Achal Dave, and Ludwig Schmidt. Data determines distributional robustness in contrastive language image pre-training (CLIP). arXiv preprint arXiv:2205.01397, 2022.
- Gokhale et al. [2022] Tejas Gokhale, Swaroop Mishra, Man Luo, Bhavdeep Singh Sachdeva, and Chitta Baral. Generalized but not robust? comparing the effects of data modification methods on out-of-domain generalization and adversarial robustness. arXiv preprint arXiv:2203.07653, 2022.
- Gulrajani and Lopez-Paz [2021] Ishaan Gulrajani and David Lopez-Paz. In search of lost domain generalization. In Proc. Int. Conf. Learn. Representations, 2021.
- Heljakka et al. [2022] Ari Heljakka, Martin Trapp, Juho Kannala, and Arno Solin. Representational multiplicity should be exposed, not eliminated. arXiv preprint arXiv:2206.08890, 2022.
- Idrissi et al. [2022] Badr Youbi Idrissi, Martin Arjovsky, Mohammad Pezeshki, and David Lopez-Paz. Simple data balancing achieves competitive worst-group-accuracy. In Conference on Causal Learning and Reasoning, 2022.
- Juneja et al. [2022] Jeevesh Juneja, Rachit Bansal, Kyunghyun Cho, João Sedoc, and Naomi Saphra. Linear connectivity reveals generalization strategies. arXiv preprint arXiv:2205.12411, 2022.
- Kaplun et al. [2022] Gal Kaplun, Nikhil Ghosh, Saurabh Garg, Boaz Barak, and Preetum Nakkiran. Deconstructing distributions: A pointwise framework of learning. arXiv preprint arXiv:2202.09931, 2022.
- Koh et al. [2021] Pang Wei Koh, Shiori Sagawa, Henrik Marklund, Sang Michael Xie, Marvin Zhang, Akshay Balsubramani, Weihua Hu, Michihiro Yasunaga, Richard Lanas Phillips, Irena Gao, et al. WILDS: A benchmark of in-the-wild distribution shifts. In Proc. Int. Conf. Mach. Learn., 2021.
- Lee et al. [2022] Yoonho Lee, Huaxiu Yao, and Chelsea Finn. Diversify and disambiguate: Learning from underspecified data. arXiv preprint arXiv:2202.03418, 2022.
- Li et al. [2017] Da Li, Yongxin Yang, Yi-Zhe Song, and Timothy M Hospedales. Deeper, broader and artier domain generalization. In Proc. IEEE Conf. Comp. Vis. Patt. Recogn., pages 5542–5550, 2017.
- Liang et al. [2022] Weixin Liang, Yining Mao, Yongchan Kwon, Xinyu Yang, and James Zou. On the nonlinear correlation of ml performance across data subpopulations. In ICML 2022: Workshop on Spurious Correlations, Invariance and Stability, 2022.
- Lipton et al. [2018] Zachary Lipton, Yu-Xiang Wang, and Alexander Smola. Detecting and correcting for label shift with black box predictors. In Proc. Int. Conf. Mach. Learn., 2018.
- Lynch et al. [2023] Aengus Lynch, Gbètondji JS Dovonon, Jean Kaddour, and Ricardo Silva. Spawrious: A benchmark for fine control of spurious correlation biases. arXiv preprint arXiv:2303.05470, 2023.
- Mania and Sra [2020] Horia Mania and Suvrit Sra. Why do classifier accuracies show linear trends under distribution shift? arXiv preprint arXiv:2012.15483, 2020.
- McCoy et al. [2019] R Thomas McCoy, Junghyun Min, and Tal Linzen. Berts of a feather do not generalize together: Large variability in generalization across models with similar test set performance. arXiv preprint arXiv:1911.02969, 2019.
- Miller et al. [2020] John Miller, Karl Krauth, Benjamin Recht, and Ludwig Schmidt. The effect of natural distribution shift on question answering models. In Proc. Int. Conf. Mach. Learn., 2020.
- Miller et al. [2021] John P Miller, Rohan Taori, Aditi Raghunathan, Shiori Sagawa, Pang Wei Koh, Vaishaal Shankar, Percy Liang, Yair Carmon, and Ludwig Schmidt. Accuracy on the line: on the strong correlation between out-of-distribution and in-distribution generalization. In Proc. Int. Conf. Mach. Learn., 2021.
- Naganuma et al. [2022] Hiroki Naganuma, Kartik Ahuja, Ioannis Mitliagkas, Shiro Takagi, Tetsuya Motokawa, Rio Yokota, Kohta Ishikawa, and Ikuro Sato. Empirical study on optimizer selection for out-of-distribution generalization. NeurIPS 2022 Workshop DistShift, 2022.
- Ortiz-Jimenez et al. [2021] Guillermo Ortiz-Jimenez, Itamar Franco Salazar-Reque, Apostolos Modas, Seyed-Mohsen Moosavi-Dezfooli, and Pascal Frossard. A neural anisotropic view of underspecification in deep learning. In Proc. Int. Conf. Learn. Representations, 2021.
- Pagliardini et al. [2022] Matteo Pagliardini, Martin Jaggi, François Fleuret, and Sai Praneeth Karimireddy. Agree to disagree: Diversity through disagreement for better transferability. arXiv preprint arXiv:2202.04414, 2022.
- Pinto et al. [2022] Francesco Pinto, Philip HS Torr, and Puneet K Dokania. An impartial take to the CNN vs transformer robustness contest. arXiv preprint arXiv:2207.11347, 2022.
- Raghunathan et al. [2020] Aditi Raghunathan, Sang Michael Xie, Fanny Yang, John Duchi, and Percy Liang. Understanding and mitigating the tradeoff between robustness and accuracy. arXiv preprint arXiv:2002.10716, 2020.
- Ramé et al. [2022] Alexandre Ramé, Kartik Ahuja, Jianyu Zhang, Matthieu Cord, Léon Bottou, and David Lopez-Paz. Recycling diverse models for out-of-distribution generalization. arXiv preprint arXiv:2212.10445, 2022.
- Recht et al. [2019] Benjamin Recht, Rebecca Roelofs, Ludwig Schmidt, and Vaishaal Shankar. Do imagenet classifiers generalize to imagenet? In Proc. Int. Conf. Mach. Learn., 2019.
- Robey et al. [2021] Alexander Robey, George J Pappas, and Hamed Hassani. Model-based domain generalization. Proc. Advances in Neural Inf. Process. Syst., 2021.
- Rosenfeld et al. [2020] Elan Rosenfeld, Pradeep Ravikumar, and Andrej Risteski. The risks of invariant risk minimization. arXiv preprint arXiv:2010.05761, 2020.
- Ross et al. [2020] Andrew Ross, Weiwei Pan, Leo Celi, and Finale Doshi-Velez. Ensembles of locally independent prediction models. In Proc. Conf. AAAI, 2020.
- Ross et al. [2018] Andrew Slavin Ross, Weiwei Pan, and Finale Doshi-Velez. Learning qualitatively diverse and interpretable rules for classification. arXiv preprint arXiv:1806.08716, 2018.
- Sagawa et al. [2019] Shiori Sagawa, Pang Wei Koh, Tatsunori B Hashimoto, and Percy Liang. Distributionally robust neural networks for group shifts: On the importance of regularization for worst-case generalization. arXiv preprint arXiv:1911.08731, 2019.
- Santurkar et al. [2020] Shibani Santurkar, Dimitris Tsipras, and Aleksander Madry. BREEDS: Benchmarks for subpopulation shift. arXiv preprint arXiv:2008.04859, 2020.
- Scimeca et al. [2022] Luca Scimeca, Seong Joon Oh, Sanghyuk Chun, Michael Poli, and Sangdoo Yun. Which shortcut cues will dnns choose? a study from the parameter-space perspective. In Proc. Int. Conf. Learn. Representations, 2022.
- Shah et al. [2020] Harshay Shah, Kaustav Tamuly, Aditi Raghunathan, Prateek Jain, and Praneeth Netrapalli. The pitfalls of simplicity bias in neural networks. arXiv preprint arXiv:2006.07710, 2020.
- Shimodaira [2000] Hidetoshi Shimodaira. Improving predictive inference under covariate shift by weighting the log-likelihood function. Journal of statistical planning and inference, 2000.
- Taori et al. [2020] Rohan Taori, Achal Dave, Vaishaal Shankar, Nicholas Carlini, Benjamin Recht, and Ludwig Schmidt. Measuring robustness to natural distribution shifts in image classification. Proc. Advances in Neural Inf. Process. Syst., 2020.
- Teney and Hebert [2016] Damien Teney and Martial Hebert. Learning to extract motion from videos in convolutional neural networks. In Asian Conference on Computer Vision, pages 412–428. Springer, 2016.
- Teney et al. [2020a] Damien Teney, Ehsan Abbasnedjad, and Anton van den Hengel. Learning what makes a difference from counterfactual examples and gradient supervision. arXiv preprint arXiv:2004.09034, 2020a.
- Teney et al. [2020b] Damien Teney, Kushal Kafle, Robik Shrestha, Ehsan Abbasnejad, Christopher Kanan, and Anton van den Hengel. On the value of out-of-distribution testing: An example of Goodhart’s law. In Proc. Advances in Neural Inf. Process. Syst., 2020b.
- Teney et al. [2022a] Damien Teney, Ehsan Abbasnejad, Simon Lucey, and Anton van den Hengel. Evading the simplicity bias: Training a diverse set of models discovers solutions with superior OOD generalization. In Proc. IEEE Conf. Comp. Vis. Patt. Recogn., 2022a.
- Teney et al. [2022b] Damien Teney, Maxime Peyrard, and Ehsan Abbasnejad. Predicting is not understanding: Recognizing and addressing underspecification in machine learning. arXiv preprint arXiv:2207.02598, 2022b.
- Wang and Veitch [2022] Zihao Wang and Victor Veitch. A unified causal view of domain invariant representation learning. arXiv preprint arXiv:2208.06987, 2022.
- Wenzel et al. [2022] Florian Wenzel, Andrea Dittadi, Peter Vincent Gehler, Carl-Johann Simon-Gabriel, Max Horn, Dominik Zietlow, David Kernert, Chris Russell, Thomas Brox, Bernt Schiele, et al. Assaying out-of-distribution generalization in transfer learning. arXiv preprint arXiv:2207.09239, 2022.
- [49] WILDS Leaderboard. https://wilds.stanford.edu/leaderboard/.
- Wiles et al. [2021] Olivia Wiles, Sven Gowal, Florian Stimberg, Sylvestre Alvise-Rebuffi, Ira Ktena, Taylan Cemgil, et al. A fine-grained analysis on distribution shift. arXiv preprint arXiv:2110.11328, 2021.
- Xie et al. [2020] Sang Michael Xie, Ananya Kumar, Robbie Jones, Fereshte Khani, Tengyu Ma, and Percy Liang. In-n-out: Pre-training and self-training using auxiliary information for out-of-distribution robustness. arXiv preprint arXiv:2012.04550, 2020.
- Yang et al. [2020] Yao-Yuan Yang, Cyrus Rashtchian, Hongyang Zhang, Russ R Salakhutdinov, and Kamalika Chaudhuri. A closer look at accuracy vs. robustness. Proc. Advances in Neural Inf. Process. Syst., 2020.
- Yao et al. [2022a] Huaxiu Yao, Caroline Choi, Bochuan Cao, Yoonho Lee, Pang Wei W Koh, and Chelsea Finn. Wild-time: A benchmark of in-the-wild distribution shift over time. Proc. Advances in Neural Inf. Process. Syst., 2022a.
- Yao et al. [2022b] Huaxiu Yao, Yu Wang, Sai Li, Linjun Zhang, Weixin Liang, James Zou, and Chelsea Finn. Improving out-of-distribution robustness via selective augmentation. In Proc. Int. Conf. Mach. Learn., 2022b.
- Yashima et al. [2022] Shingo Yashima, Teppei Suzuki, Kohta Ishikawa, Ikuro Sato, and Rei Kawakami. Feature space particle inference for neural network ensembles. arXiv preprint arXiv:2206.00944, 2022.
- Ye et al. [2022] Nanyang Ye, Kaican Li, Haoyue Bai, Runpeng Yu, Lanqing Hong, Fengwei Zhou, Zhenguo Li, and Jun Zhu. Ood-bench: Quantifying and understanding two dimensions of out-of-distribution generalization. In Proc. IEEE Conf. Comp. Vis. Patt. Recogn., 2022.
- Zhang et al. [2019] Hongyang Zhang, Yaodong Yu, Jiantao Jiao, Eric Xing, Laurent El Ghaoui, and Michael Jordan. Theoretically principled trade-off between robustness and accuracy. In Proc. Int. Conf. Mach. Learn., 2019.
- Zhang et al. [2017] Hongyi Zhang, Moustapha Cisse, Yann N Dauphin, and David Lopez-Paz. mixup: Beyond empirical risk minimization. arXiv preprint arXiv:1710.09412, 2017.
- Zhou et al. [2022] Xiao Zhou, Yong Lin, Weizhong Zhang, and Tong Zhang. Sparse invariant risk minimization. In Proc. Int. Conf. Mach. Learn., 2022.
Appendix
Appendix A Additional results on Camelyon17

Appendix B Results on other datasets
In addition to Camelyon17, we performed experiments on five other datasets. We selected these datasets from the current literature on OOD generalization with no a priori knowledge of particular patterns of ID vs. OOD performance. We find inverse patterns to different extent on four out of five.
B.1 WildTime-arXiv
Data.
The WildTime-arXiv [53] dataset contains text abstracts from arXiv preprints. The task is to predict each paper’s category among 172 classes. The ID and OOD splits are made of data from different time periods.
Methods.
We fine-tune a standard BERT-tiny model with a new linear head, using any of these well-known methods: standard ERM, simple class balancing [12], mixup [58], selective mixup [54], and post hoc adjustment for label shift [19] (we did not use the diversification method from Section 3). We repeat every experiment with 10 seeds and record the ID and OOD accuracy at every training epoch. We then plot each of these points in Figure 11 and highlight the epoch of highest ID or OOD accuracy per run (method/seed combination).
Results.
As discussed in Section 5, there is a clear trade-off both within methods (i.e. across seeds and epochs) and across methods.
B.2 Waterbirds
Data.
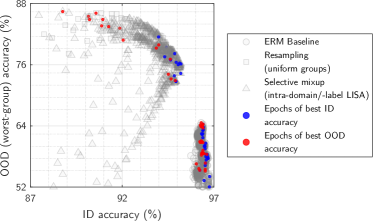
The waterbirds dataset [36] is a synthetic dataset widely used for evaluating OOD generalization. The task is to classify images of birds into 2 classes. The image backgrounds are also of two types, and the correlation between birds and background is reversed across the training and test splits. The standard metric is the worst-group accuracy, where each group is any of the 4 combinations of bird/background.
Methods.
We follow the same procedure as described above. We experiment two classes of architectures: ResNet-50 models pretrained on ImageNet and fine-tuned on waterbirds, and linear classifiers trained of features from the same frozen (non-fine-tuned) ResNet-50.
Results.
We observe in Figure 12 patterns of inverse correlations in both cases.
B.3 CivilComments
Data.
The CivilComments dataset [15] is another widely-used dataset in OOD research. It contains text comments from internet forums to be classified as toxic or not. Each example is labeled with a topical attribute (e.g. Christian, male, LGBT, etc.) that is spuriously associated with ground truth labels in the training data. The target metric is again worst-group accuracy, where a group is any label/attribute combination.
Methods.
We follow the same procedure as described above. We experiment two classes of architectures: pretrained BERT-tiny fine-tuned on CivilComments, and linear classifiers trained of features from the same frozen BERT-tiny models (a.k.a. linear probing).
Results.
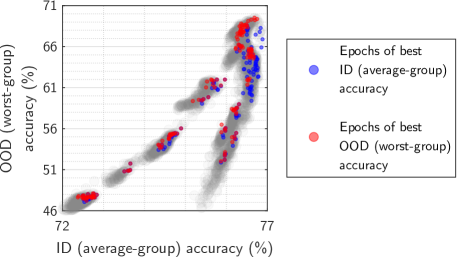
We observe in Figures 13–14 different patterns with the two classes of architectures. With linear probing, the ID vs. OOD trade-off is minimal, and the model of highest ID performance within a run as well as across methods is very similar to the model of highest OOD performance. With fine-tuning however, the trade-off is more pronounced. The ID and OOD performance usually peak then diminish at different epochs during the fine-tuning. This agrees with previous reports [2] of OOD robustness being progressively lost during fine-tuning.
B.4 WildTime-MIMIC-Readmission
Data.
The WildTime-MIMIC-Readmission [53] dataset contains hospital records (sequences of codes representing diagnoses and treatments) to be classified into two classes, corresponding to the readmission of the patient within a short time. ID and OOD splits contain records from different time periods.
Methods.
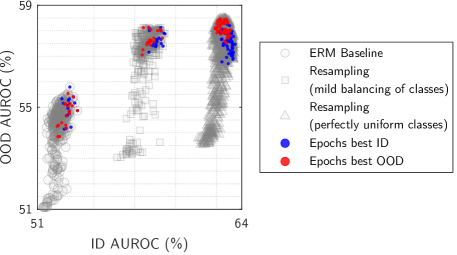
We follow the same procedure as described above. We train a standard bag-of-embeddings architecture, which associate each diagnosis/treatment with a learned embedding, then summed and fed to a linear classifier. We train this model with standard ERM, and with a resampling to balance the classes in the training data [12], which is a standard approach for imbalanced datasets. We also train models with a “mild balancing”, where classes are sampled according to a distribution half-way between the original one of the training data, and a uniform (50%–50%) one.
Results.
In Figure 15 we observe that ID and OOD performance are mostly positively correlated across methods. The best models are obtained with uniform balancing of classes, in which case model selection based on OOD performance could give a small advantage, but it is marginal compared to the improvement over the ERM baseline, which can be clearly detected on both the ID and OOD performance.
B.5 WildTime-Yearbook
Data.
The WildTime-Yearbook [53] dataset contains yearbook portraits. Each image is to be classified as male or female, and the ID and OOD splits contain images from different time periods.
Methods.
Results.
The patterns are slightly different in the two cases but similar conclusions can be drawn from both. There is a mostly-positive correlation, but at the highest accuracies (upper-right quadrant), some small trade-off exists. This suggests that fine-grained differences exist that are useful for either ID or OOD generalization, but not both. Although differences are small, this “pointy end” of the spectrum is where the state-of-the-art models compete, hence the relevance of this observation.
Appendix C Proof of Theorem 1
Theorem 1.
Including an additional spurious feature leads to the following change in the risks:
with , , defined as:
Further, if the new feature is sufficiently unstable in the test domain, i.e. if is sufficiently large such that:
then we have and therefore .
Let be the features already selected, the features after adding a new spurious feature to , the eigenvalues of and the corresponding eigenvectors.
Assumption 1.
The projection of on each basis corresponding to feature is non zero, i.e.
This ensures that coefficients of a feature can not be always , otherwise we can simply remove it.
Proof.
Let and denote the solution of linear regression in the ID and OOD domains, i.e.,
| (2) | ||||
| (3) |
Now let us compare the OOD loss after we include . In practice, we can only obtain and then apply it on both the ID and OOD domains, which elicits the following errors:
| (4) | ||||
| (5) |
It is well known that the residual of the linear fitting by on the ID domain is
| (6) |
Similarly, we have
| (7) |
Since does not lies in the space spaned by , so the space spanned by is strictly larger than . Together with Assumption 1, we have
| (8) |
and also
| (9) |
By the proof in Appendix B.6.3 (above Eq. 29) in [59], we have
| (10) |
By Eq. (20) in [59], we have
| (11) |
So we have:
| (12) |