aUniversity of Kentucky, Lexington, Kentucky, USA; bQingdao University, Qingdao, Shandong, China
PRIME: Uncovering Circadian Oscillation Patterns and Associations with AD in Untimed Genome-wide Gene Expression across Multiple Brain Regions
Abstract
The disruption of circadian rhythm is a cardinal symptom for Alzheimer’s disease (AD) patients. The full circadian rhythm orchestration of gene expression in the human brain and its inherent associations with AD remain largely unknown. We present a novel comprehensive approach, PRIME, to detect and analyze rhythmic oscillation patterns in untimed high-dimensional gene expression data across multiple datasets. To demonstrate the utility of PRIME, firstly, we validate it by a time course expression dataset from mouse liver as a cross-species and cross-organ validation. Then, we apply it to study oscillation patterns in untimed genome-wide gene expression from 19 human brain regions of controls and AD patients. Our findings reveal clear, synchronized oscillation patterns in 15 pairs of brain regions of control, while these oscillation patterns either disappear or dim for AD. It is worth noting that PRIME discovers the circadian rhythmic patterns without requiring the sample’s timestamps. The codes for PRIME, along with codes to reproduce the figures in this paper, are available at https://github.com/xinxingwu-uk/PRIME.
Introduction
Alzheimer’s disease (AD) is the leading form of dementia. Unlike other chronic diseases such as heart disease and cancer, it has an increasing death rate worldwide. Multiple studies have shown that circadian rhythm and AD have a two-way relationship, and most circadian disruptions typically occur in the early stage of AD, even preceding the development of cognitive symptoms 1, 2, 3, 4. The circadian clock system is endogenously generated by an internal circadian biological clock 5, 6. In mammals, circadian rhythm is governed by a brain region called suprachiasmatic nucleus (SCN), a group of cells in the hypothalamus that respond to light and dark signals. There is growing evidence showing the circadian clock controls behavioral phenotypic rhythms and harmonizes peripheral clocks located in almost every organ, such as the brain, liver, kidney, and heart 7, 8, 9, 10. A plethora of clinical, molecular, and genomic studies analyze the pathophysiology of AD and its associations with circadian disorders 11, 12, 13, 14, and accumulating evidence indicates that the disorder of circadian rhythm is not only a pathological marker but a putative risk factor of AD. Currently, a clear understanding of the relationships between the disturbances of the human brain’s circadian rhythms and AD from genome-wide gene expression remains elusive.
Existing studies on the relationships between circadian rhythm and AD mainly focus on a limited number of single clock genes, for instance, Bmal1 (also known as ARNTL), Cry1, Per1, and Per2 15, 16, 17, or brain regions such as pineal gland and cingulate cortex and bed-nucleus of the stria terminalis 16. Almost all these studies are based on mouse models, while little is known regarding the impact on humans. More intriguingly, these prior analyses of circadian rhythm all depend on time labels of samples, such as time-of-death, while such time labels are practically difficult or inaccurate, if not impossible, to obtain through clinically interval sampling for human brain tissue due to the highly invasive nature. As pointed out in 18, more than 1 million human gene expression samples in the National Center for Biotechnology Information Gene Expression Omnibus (GEO) repository are available for discovery, but these samples’ collection time was rarely recorded. Recently, two computational approaches have been developed that allow an analysis of a single clock gene’s circadian rhythms of untimed sample data 18, 19. Such single gene-based studies can facilitate our understanding of the principles of the biological clock at the gene level. However, the circadian clock and peripheral clocks are macroscopically reflected at the tissue and organ level for organisms. Also, different clock genes may have much varied circadian expression levels. For example, Bmal1 and Per1 display antiphase circadian expressions 20; ARNTL and Clock present different seasonality expressions 21. Because the circadian and peripheral clocks are the overall orchestration of the circadian rhythms or oscillation patterns of many clock genes that comprise these tissues and organs, it is overly simplistic to take the single clock genes’ circadian rhythms as a direct characterization of the tissues and organs. In the literature, another research line is to study oscillation patterns for untimed samples at a single cell level, e.g., the studies in 22, 23. Nonetheless, the core of their studies along such a research line is mainly to analyze the periodicity of cell cycles rather than circadian patterns at the tissue level.
The orchestration of circadian oscillation patterns of all relevant genes of the human brain and the potential dysregulation impact on AD remain unknown; there is an urgent need to develop methods to analyze whole-genome gene expression data to find circadian oscillation patterns of different brain regions. One main barrier to studying circadian patterns of genome-wide gene expression is the requirement of time labels of brain tissues, which are hard to obtain or inaccurate. This paper explores the relationships between circadian rhythms of brain regions and AD with genome-wide gene expression data. We present an innovative, comprehensive approach based on principal component analysis (PCA) and matrix factorization (MF), called PRIME, to detect and analyze oscillation patterns in untimed high-dimensional data across multiple brain regions. To validate PRIME, we first apply it to a time course expression dataset from mouse livers. Then, we use it to analyze the connections of AD with circadian rhythms based on a dozen of large-scale gene expression datasets from 19 cortical regions of about 60 human subjects. Furthermore, we comprehensively evaluate and validate our discovery using statistical correlation analyses, such as Pearson, Spearman, and Kendall correlations, on 8 well-known circadian clock genes, i.e., ARNTL, ACSNK1E, ANPAS2, ANR1D2, APER1, APER2, APER3, and ARORA 13, 14, 24 in various brain regions. Our study reveals the genome-wide gene expression-based correlations between circadian disorders in different brain regions and AD: There exist clear, synchronized oscillation patterns in 15 pairs of brain regions of control, including middle temporal gyrus and inferior temporal gyrus, frontal pole and anterior cingulate, frontal pole and dorsolateral prefrontal cortex, hippocampus and dorsolateral prefrontal cortex, and hippocampus and prefrontal cortex. Notably, these circadian rhythmic oscillation patterns either disappear or dim for AD.
Our approach consists of four steps: Firstly, it merges cross-region datasets from 19 brain regions such as the middle temporal gyrus, inferior temporal gyrus, and frontal pole; Secondly, by doing sample cross-reference on union brain regions, it obtains the overlap of samples on different brain regions, see Figure 1 (a); Thirdly, it uses PRIME listed in Algorithm 1 to obtain circadian rhythmic oscillation patterns; Finally, it computes the Pearson, Spearman, and Kendall correlation coefficients for controls and AD patients on different brain regions. According to whether labels are used or not, circadian rhythm-related analysis can be classified into supervised, such as ZeitZeiger 25 which is used to estimate a periodic variable from high-dimensional observations, and unsupervised 18, 19, 22. Our proposed approach belongs to the latter, with no need for massive labeled samples to do training. To the best of our knowledge, it is the first systematic study to investigate the associations between multiple brain regions’ circadian rhythms and AD quantitatively based on untimed genome-wide gene expression, which permits the most direct glimpse into the circadian events in the human brain at the brain region- or tissue-level.
Methods
Notations
Let and be the numbers of samples and probes, respectively. Denote , ; let be the sample matrix, and be the genome-wide gene expression of a sample, with denoting the expression value of probe for sample . For each sample, its label is known as either control or AD.
Data normalization
The gene expression for each probe of sample is normalized as , where is the averaged expression of probe across all samples, , . We denote .
PRIME for capturing oscillatory patterns in the latent space
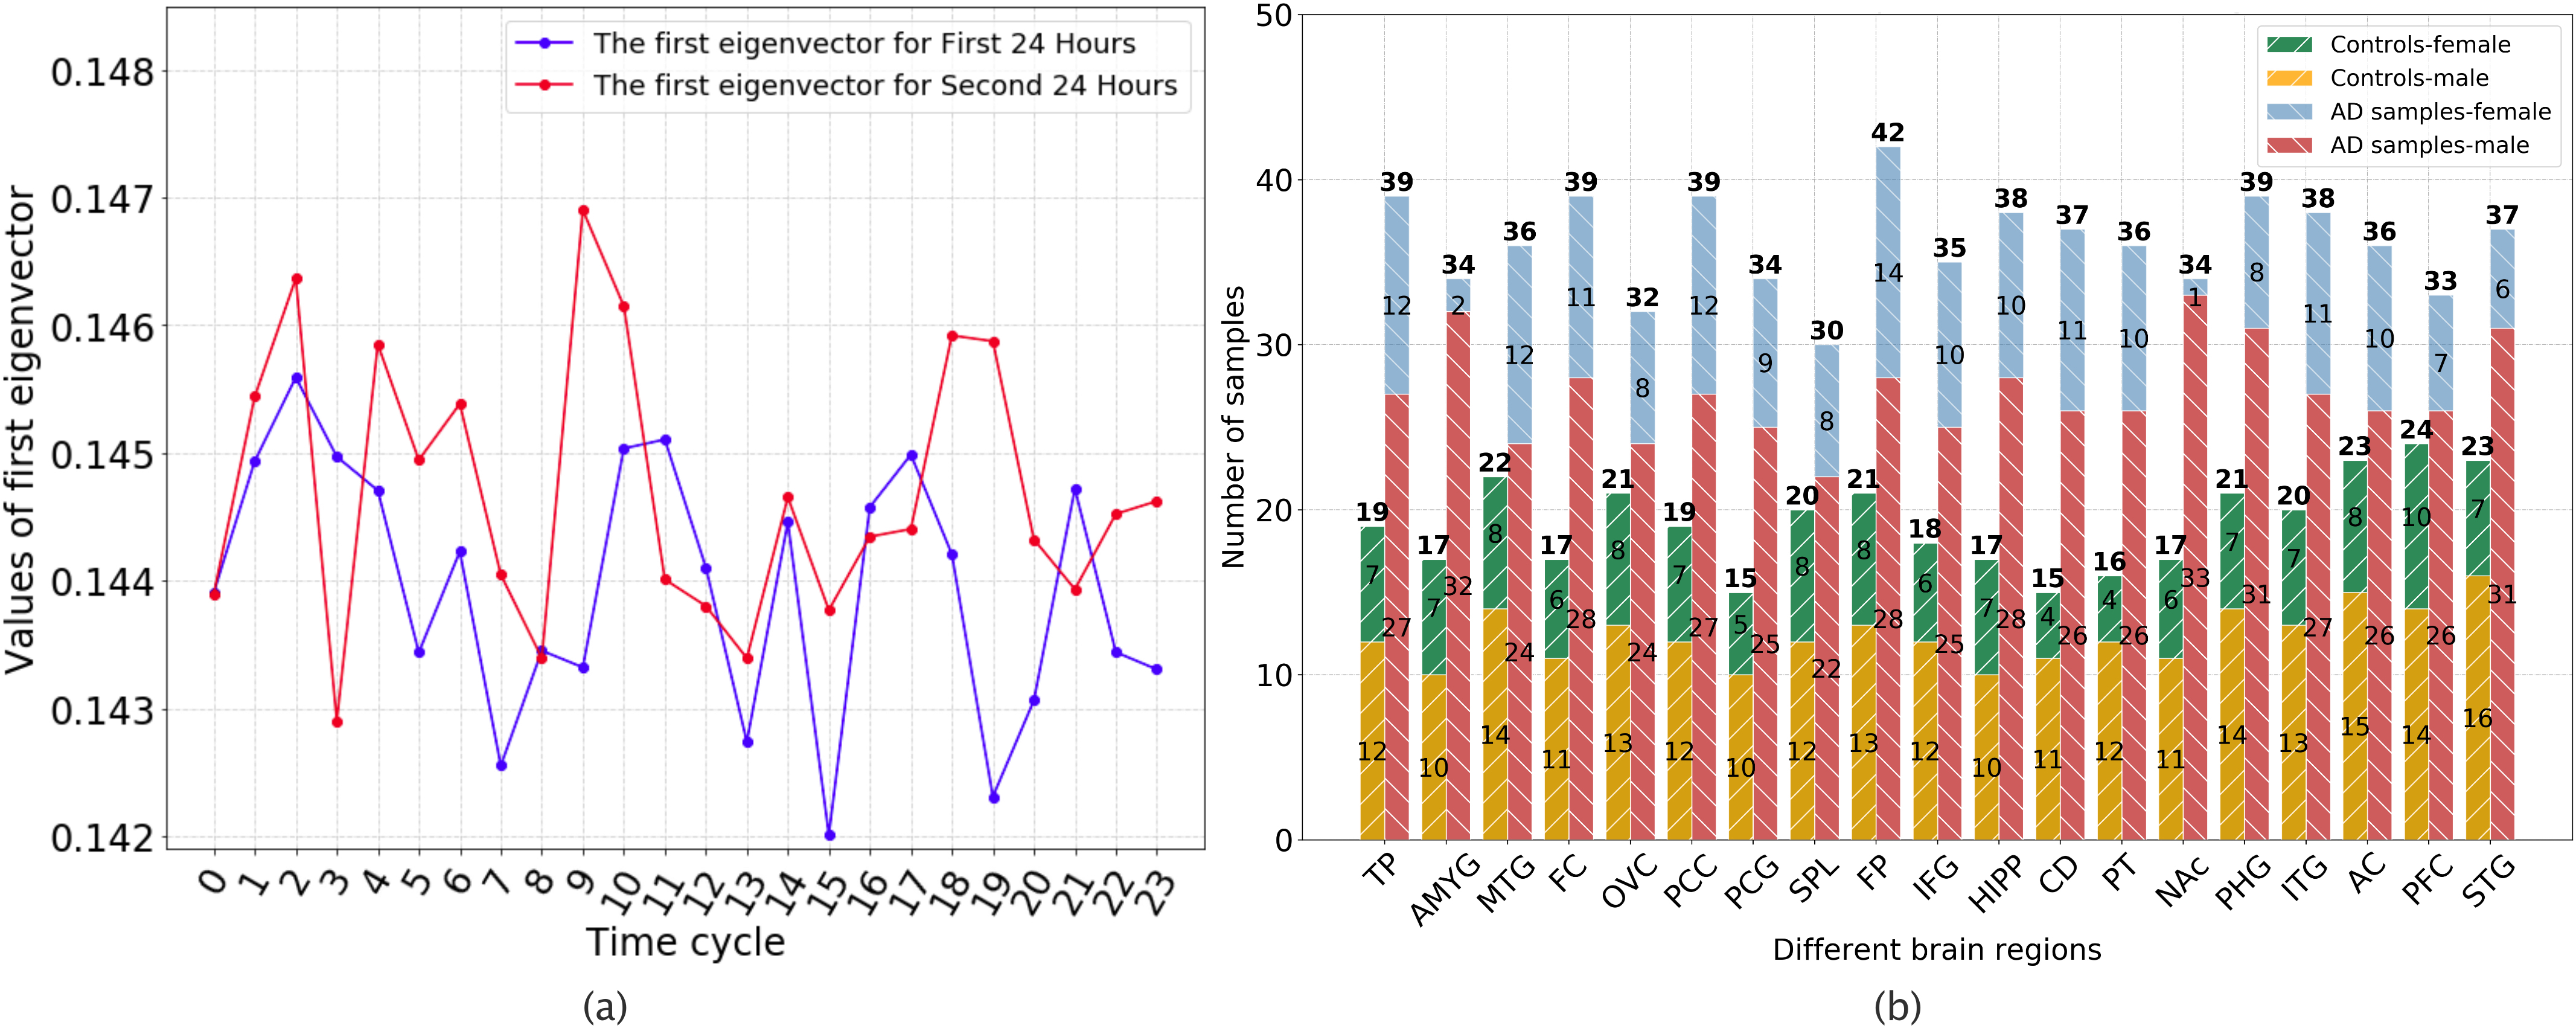
By applying the singular value decomposition (SVD) on the gene expression data, 26 obtained the “eigengenes,” which are the eigenvectors corresponding to the singular values. 26 also pointed out that the first “eigengene” could be used to obtain out-of-phase sinusoidal oscillations. All these first “eigengenes” with the samples’ collection times construct an ellipse 18.222Note that 18 appears loose to use a circular neural network to extract angles or phases, because a circle implies a uniform velocity, whereas an ellipse implies a non-uniform velocity. However, the genome-wide expression data is high-dimensional, comprising a large number of genes that are essentially irrelevant to circadian rhythms and can be regarded as noise. Therefore, the direct use of “eigengenes” is strongly susceptible to noise and possible corruption in the data.333Taking the mouse liver dataset as an example, we compute and plot the first “eigengenes” from two entire periodic cycles in Figure 1 (a). To have an effective algorithm resilient to irrelevant genes and noise, we will capture the circadian rhythmic patterns in the latent space underlying the gene expression data. Our technique first relies on PCA to reduce the dimension of the gene expression data, followed by applying MF to reveal the latent groups in an intrinsic low-dimensional subspace and the hidden relationship between these latent groups and the subjects. Finally, PRIME extracts potential oscillatory patterns in the resultant latent space. We describe the methodological details in three main steps below:
Step 1. Applying PCA to the normalized data, we obtain the dimension-reduced data , where . Then we utilize the singular value decomposition of the normalized data matrix to compute PCA.
Step 2. Using MF, we decompose as follows:
| (1) |
where , and , with being a pre-specified parameter for the latent space’s dimension. represents the multiplication of and . is the Frobenius norm, . Generally speaking, comprises the representatives of latent clusters in the space spanned by , and represents the (soft) membership metrics of all samples on clusters in the latent space 27.
Step 3. Performing enhancement of the membership metrics. Denoting as the Hadamard product of matrices, we compute as our result containing the oscillatory patterns in the latent space. This operation is analogous to the contrast enhancement performed in image processing 28. We denote by for notational simplicity.
The overall algorithm consists of the above three steps, which we summarize in Algorithm 1.
Data preprocessing
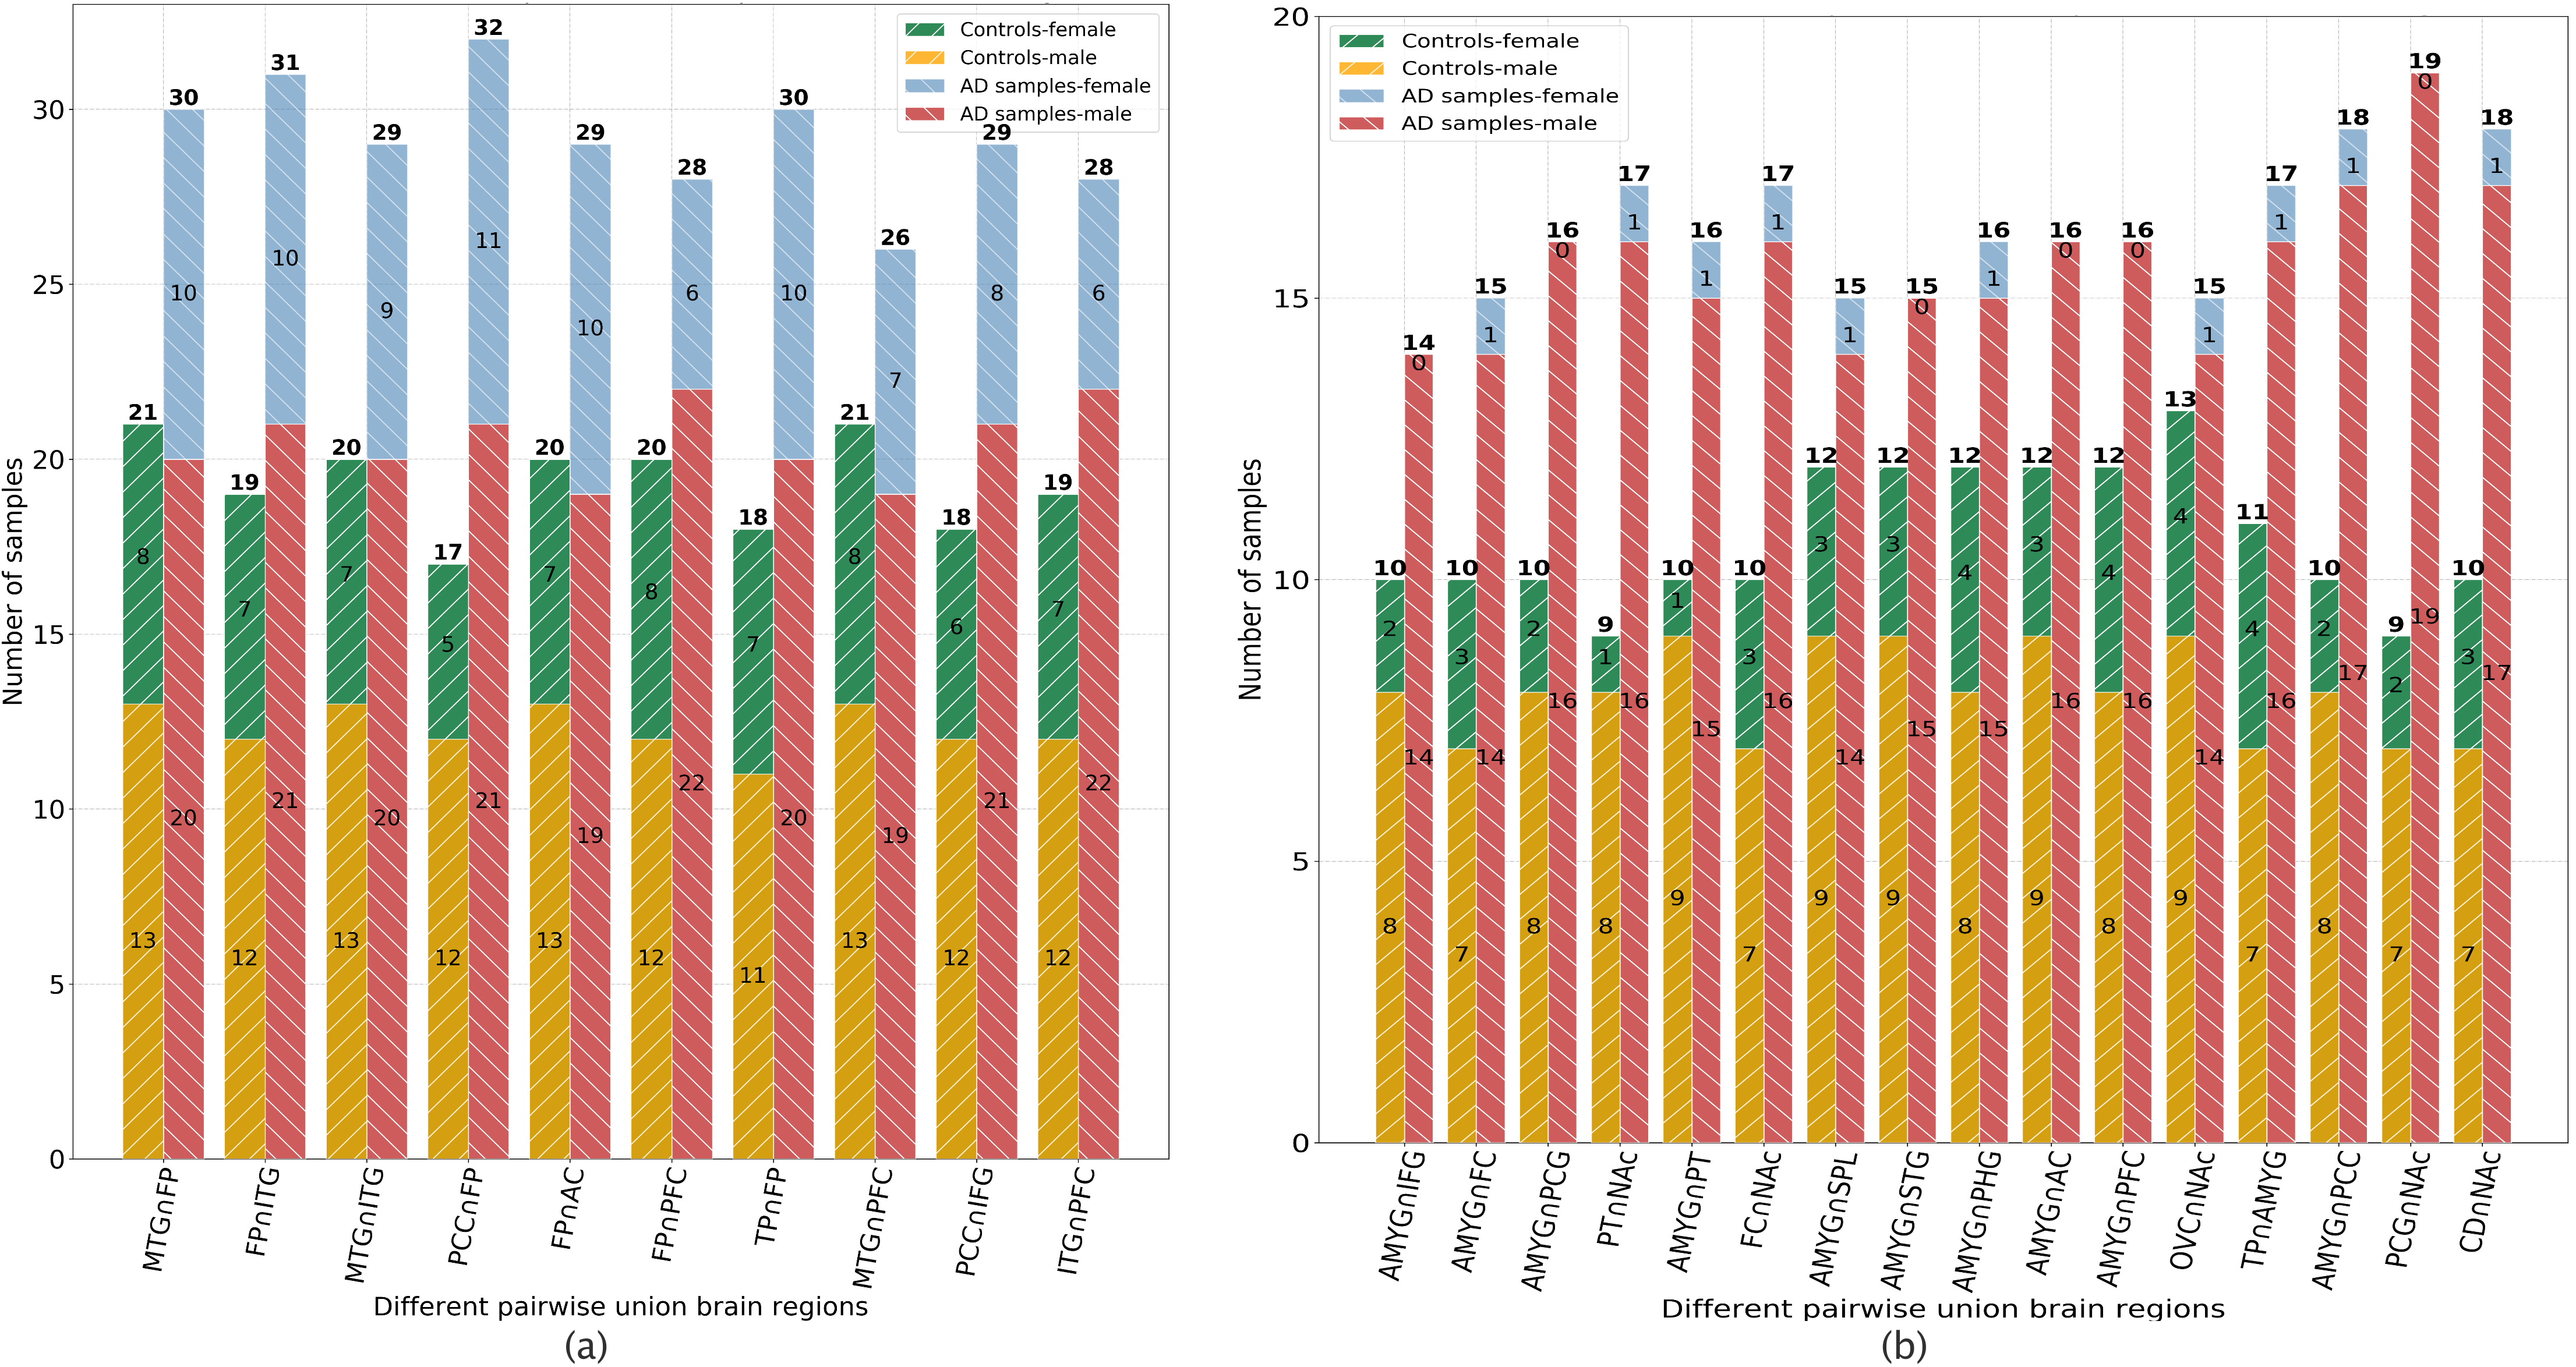
We perform data preprocessing of sample cross-referencing on different union brain regions, selecting the brain regions with the required number of overlap samples. The step-by-step details of the sample cross-referencing are listed in Procedure 1. For statistical power analysis, we select 10 union brain regions with at least overlap samples (See Figure 3 (a)) in subsequent experiments.
Results
Genome-wide gene expression datasets were obtained from the Accelerating Medicines Partnership-Alzheimer’s Disease (AMP-AD) Knowledge Portal.444See link https://www.synapse.org/#!Synapse:syn2580853/wiki/409840 The gene samples used in this study are part of the Mount Sinai Medical Center Brain Bank (MSBB). All samples were generated by two Affymetrix microarray platforms, Human Genome (HG) U133A and U133B, except two brain regions, amygdala (AMYG) and nucleus accumbens (NAc), by the Affymetrix HG U133 Plus 2.0 array. The gene expression data used in this study were from 19 brain cortical regions of approximately 60 individuals,555Control samples denote the devoid of AD neuropathological changes in the brain, with . AD samples are those with extensive AD neuropathological changes in the brain, with . See link https://www.synapse.org/#!Synapse:syn3157699 and the brain regions include the frontal pole (FP), occipital visual cortex (OVC), inferior temporal gyrus (ITG), middle temporal gyrus (MTG), superior temporal gyrus (STG), posterior cingulate cortex (PCC), anterior cingulate (AC), parahippocampal gyrus (PHG), temporal pole (TP), precentral gyrus (PCG), inferior frontal gyrus (IFG), dorsolateral prefrontal cortex (PFC), superior parietal lobule (SPL), prefrontal cortex (FC), caudate nucleus (CD), hippocampus (HIPP), putamen (PT), AMYG, and NAc.
In addition, we also used a time course expression dataset from mouse liver 29,666See link https://www.ncbi.nlm.nih.gov/geo/query/acc.cgi?acc=GSE11923 which was adopted solely to validate PRIME in a cross-species and cross-organ fashion. The mouse liver samples were collected every hour for 48 hours from 3-5 mice livers. These samples were pooled and analyzed using Affymetrix microarray suite 5.0.
Validation
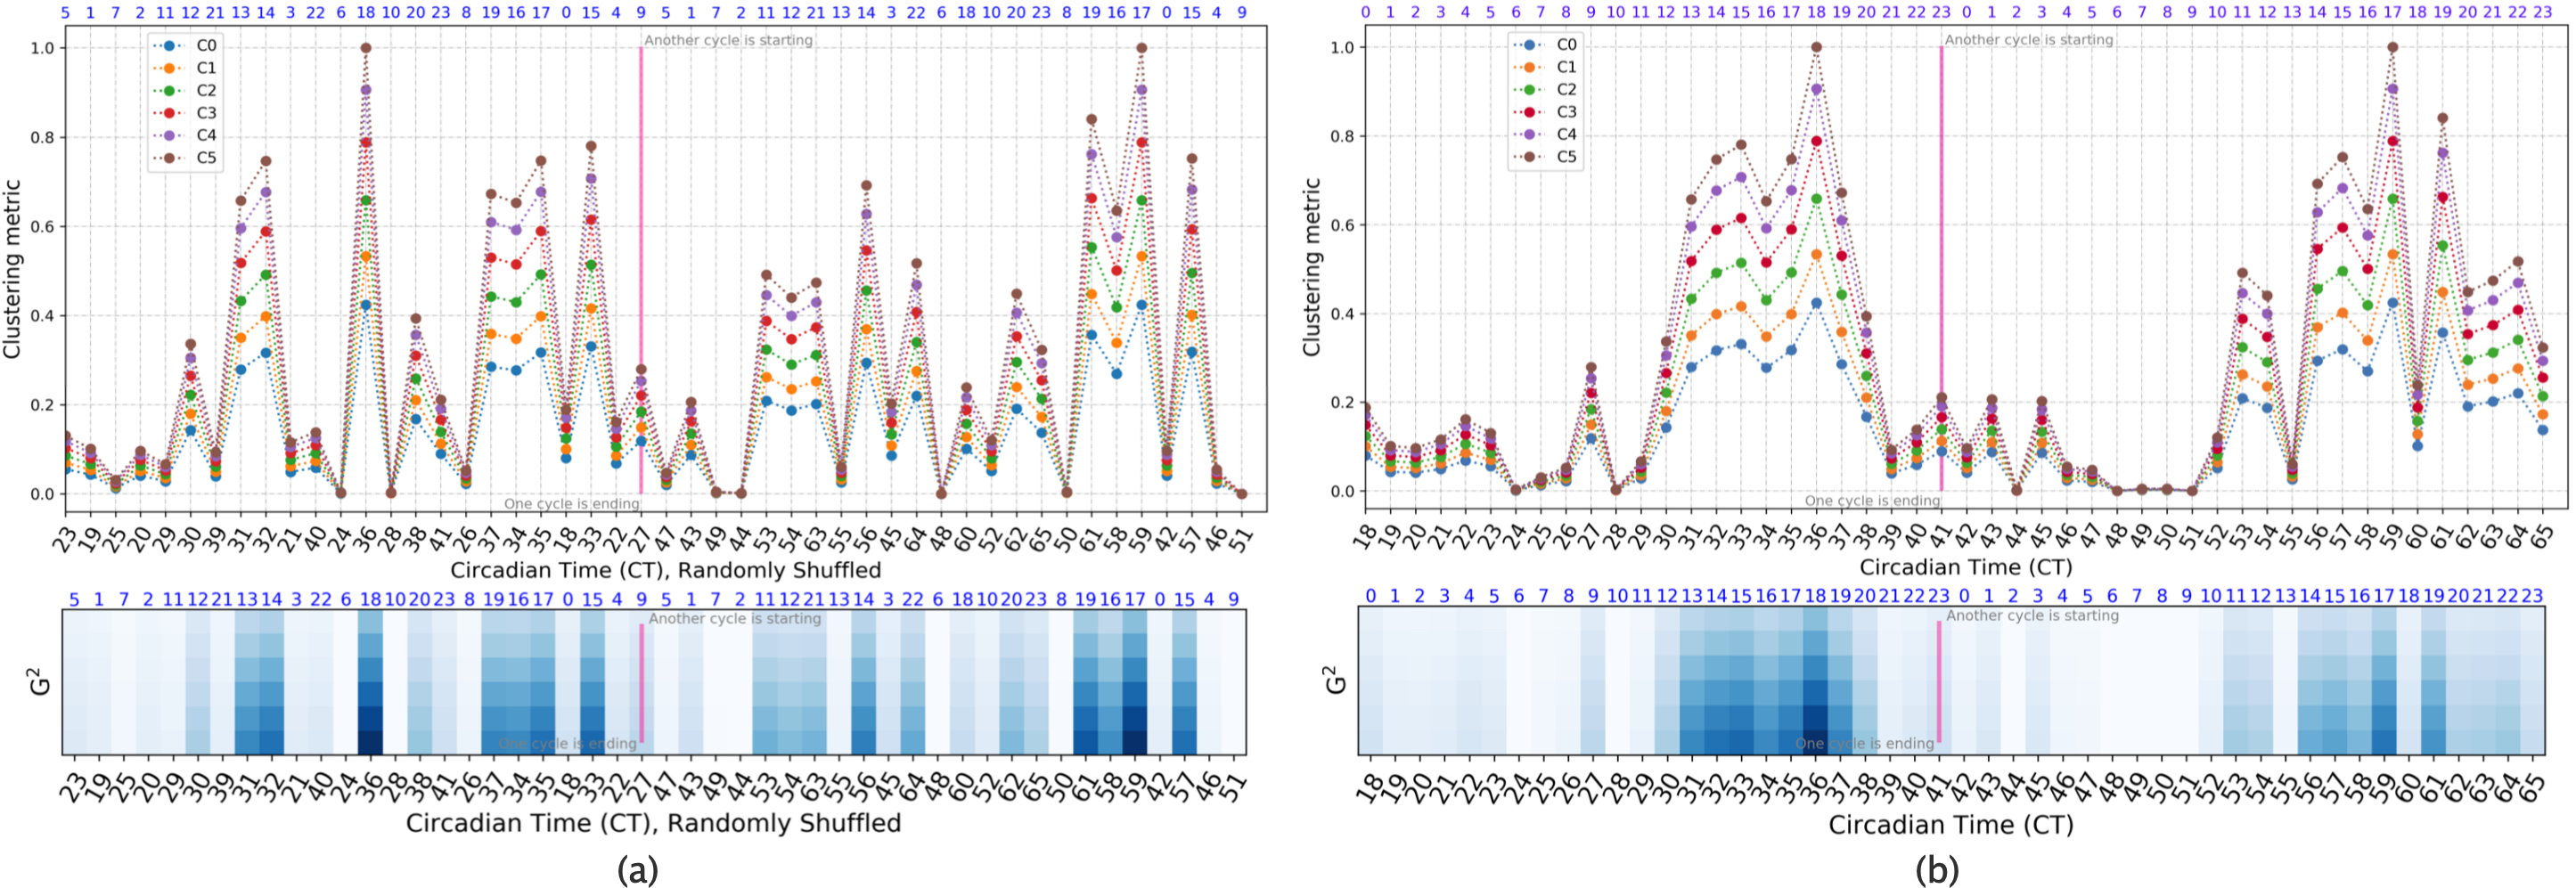
We first randomly shuffle the mouse liver time series data in the first cycle. Then, we obtain the same shuffling of time series data in the second cycle. Subsequently, we apply PRIME to handle these disordered data and obtain Figure 2 (a). It can be observed that the circadian oscillation patterns in the two different cycles resemble each other despite random shuffling. For validating the observations, we compute 3 different statistical correlations, including the Pearson, Spearman, and Kendall correlations, of circadian curves in two cycles. We obtain that Pearson correlation , Spearman correlation , and Kendall correlation . These correlation results are substantial and demonstrate the effectiveness of PRIME on untimed data.
Furthermore, PRIME does not require the data to cover the time points in the whole periodic cycle. For example, if the two cycles’ data includes only the time points 7, 2, 21, 13, 14, 3, 6, 18, 10, 20, 19, 17, and 4 among the numbers in blue on the horizontal axis, PRIME can still be used to get the (partial) oscillation patterns in Figure 2 (a). Subsequently, we can compute their correlation coefficients to obtain that Pearson , Spearman , and Kendall . It is notable that PRIME effectively reveals the circadian rhythmic oscillation patterns in the absence of timestamps.
Additionally, if the time order of samples is available, we can reorder the timestamps of data in Figure 2 (a) to recover the periodic curve; See Figure 2 (b). However, it is noted that recovering the periodicity curve is not essential for PRIME.
Therefore, by performing a cross-species cross-organ internal validation over the mouse liver dataset, we demonstrate that PRIME can detect circadian patterns without requiring timestamped periodic data.
Analysis of untimed gene expression
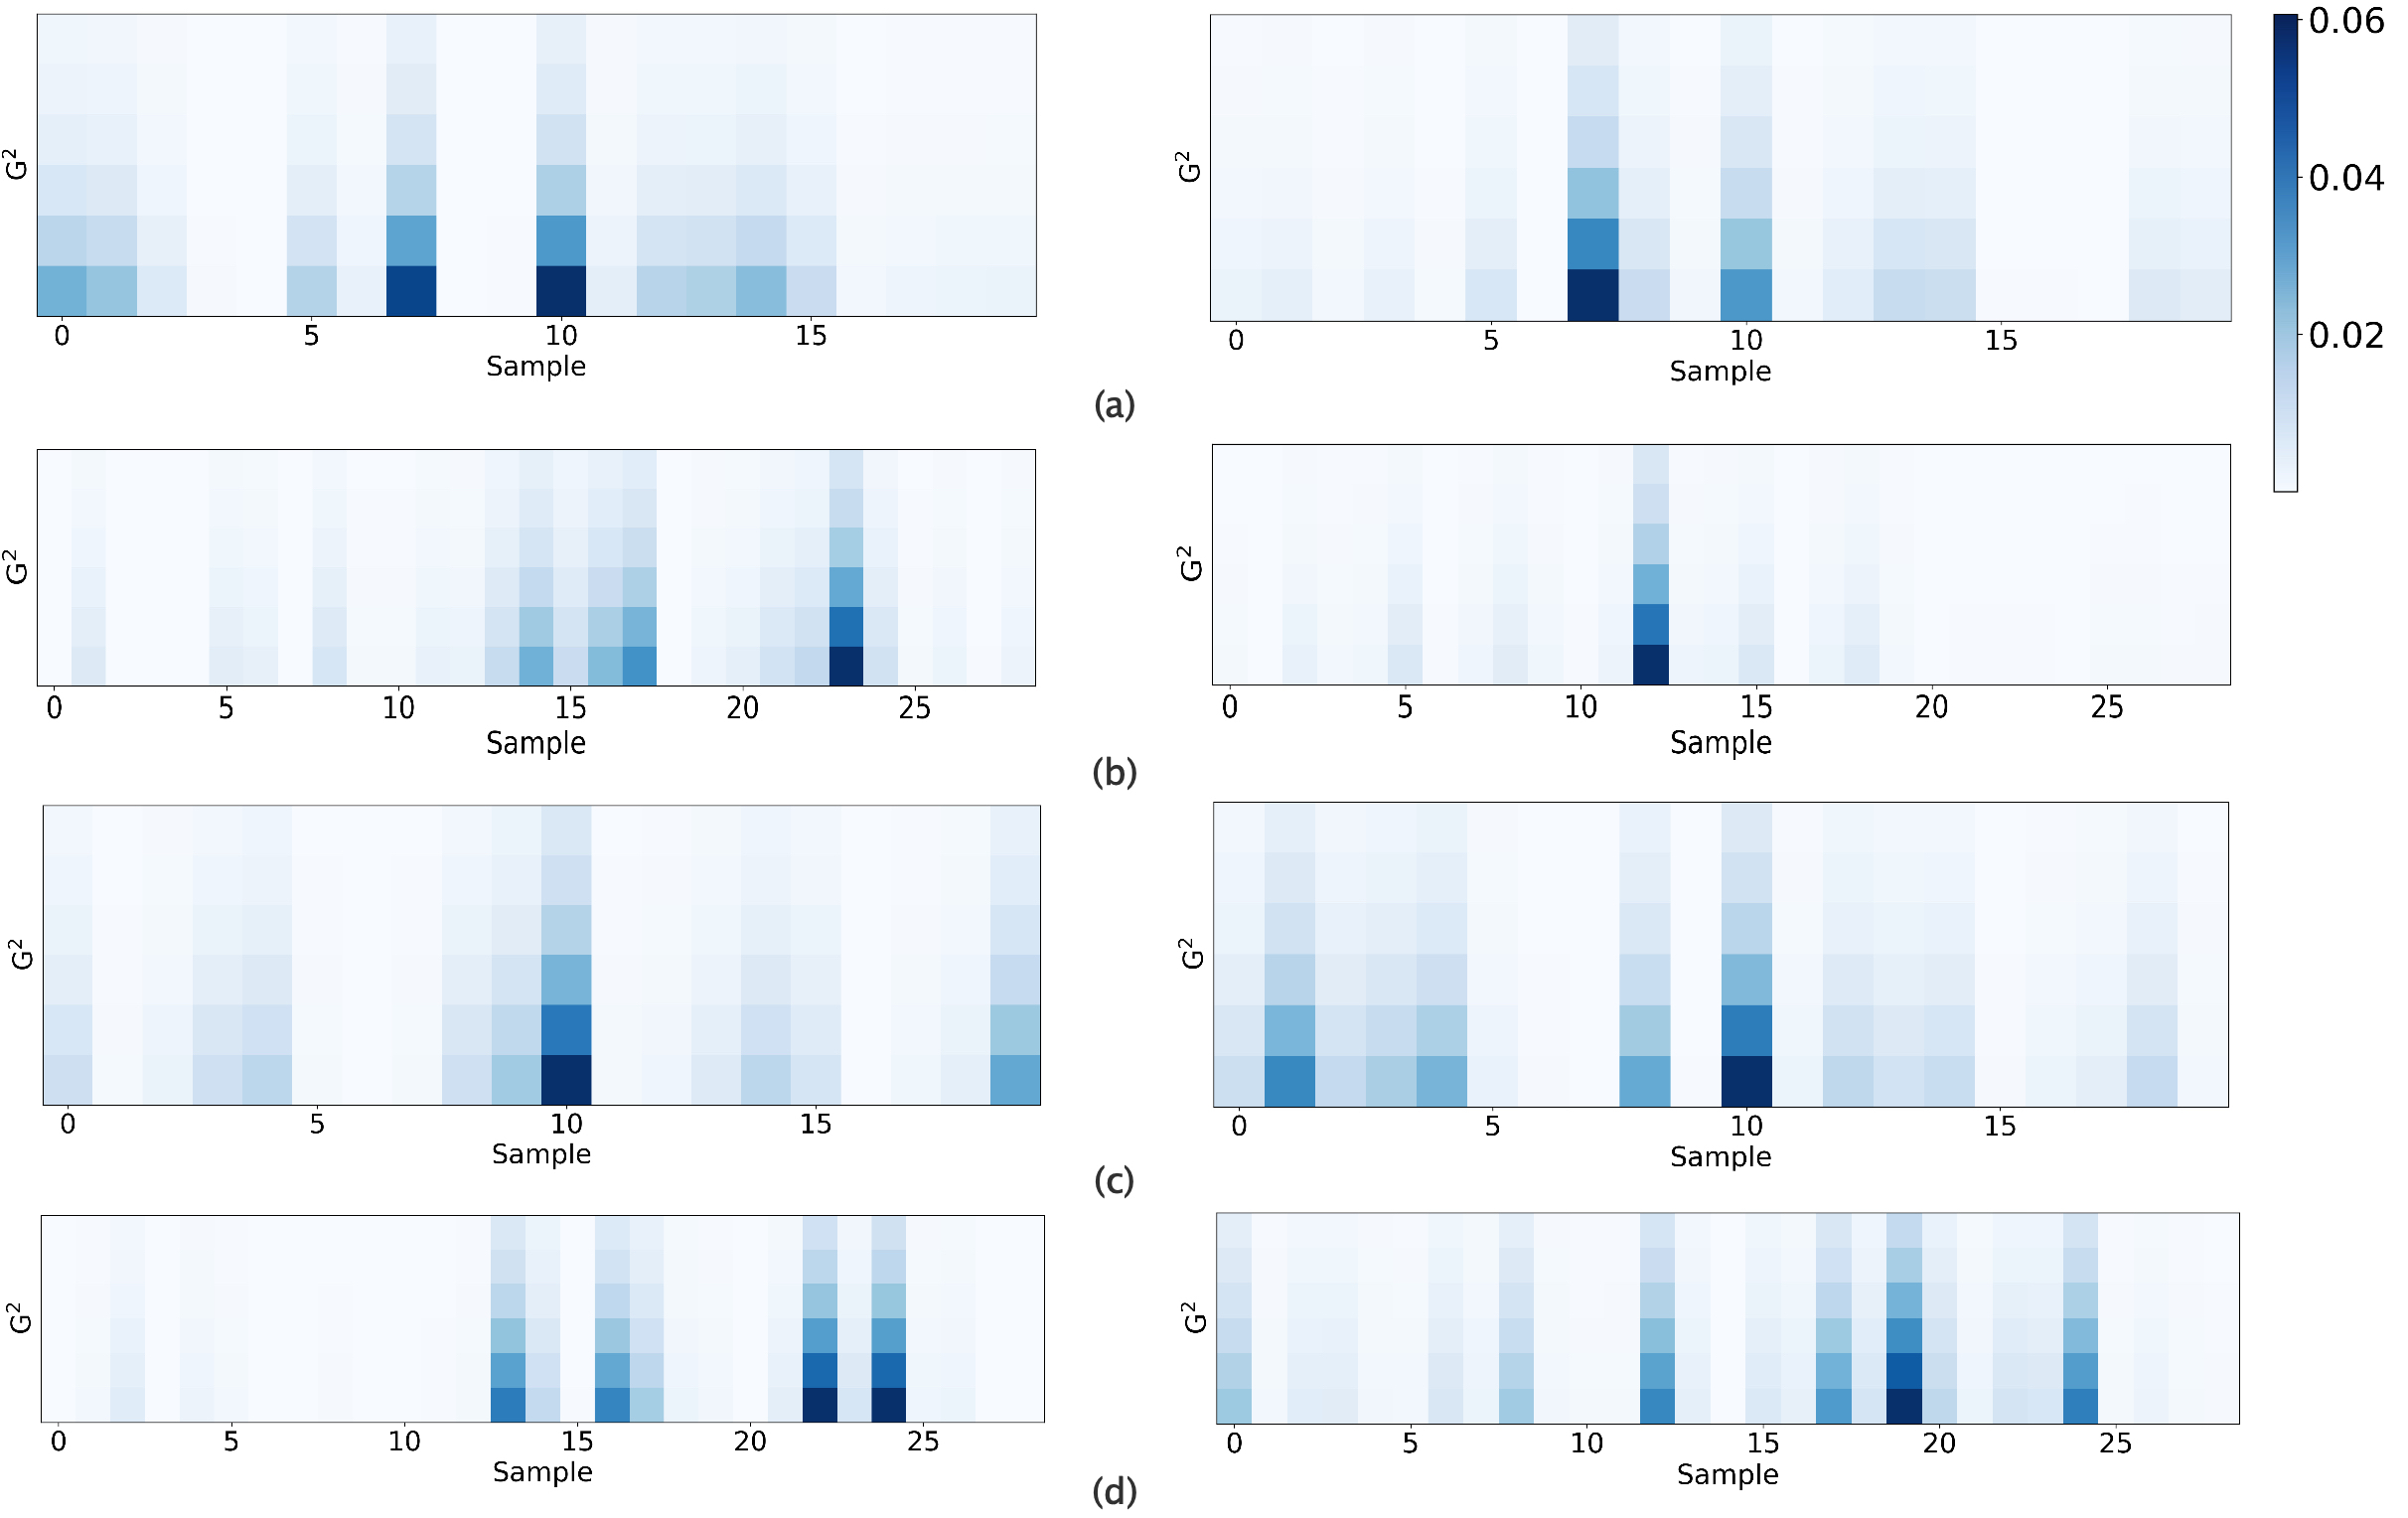
Links based on genome-wide gene expression are computed for 10 union brain regions selected by sample cross-referencing with at least 47 overlap samples (See Figure 3 (a)). Further, correlations based on circadian rhythm clock genes are compared with those based on genome-wide gene expression to further verify our discoveries. From the existing studies on circadian clock genes 13, 14, 24, we select 8 circadian clock genes, including ARNTL, CSNK1E, NPAS2, NR1D2, PER1, PER2, PER3, and RORA. We discover three clear, synchronized union brain regions of healthy controls, which are MTGITG, FPAC, and FPPFC. However, such patterns either disappear or dim for AD cases. Taking the calculation on FPAC as an example, we visualize the heat maps of the rhythmic patterns for the genome-wide gene expression and the synthesis of the 8 circadian rhythm clock genes in Figure 4.
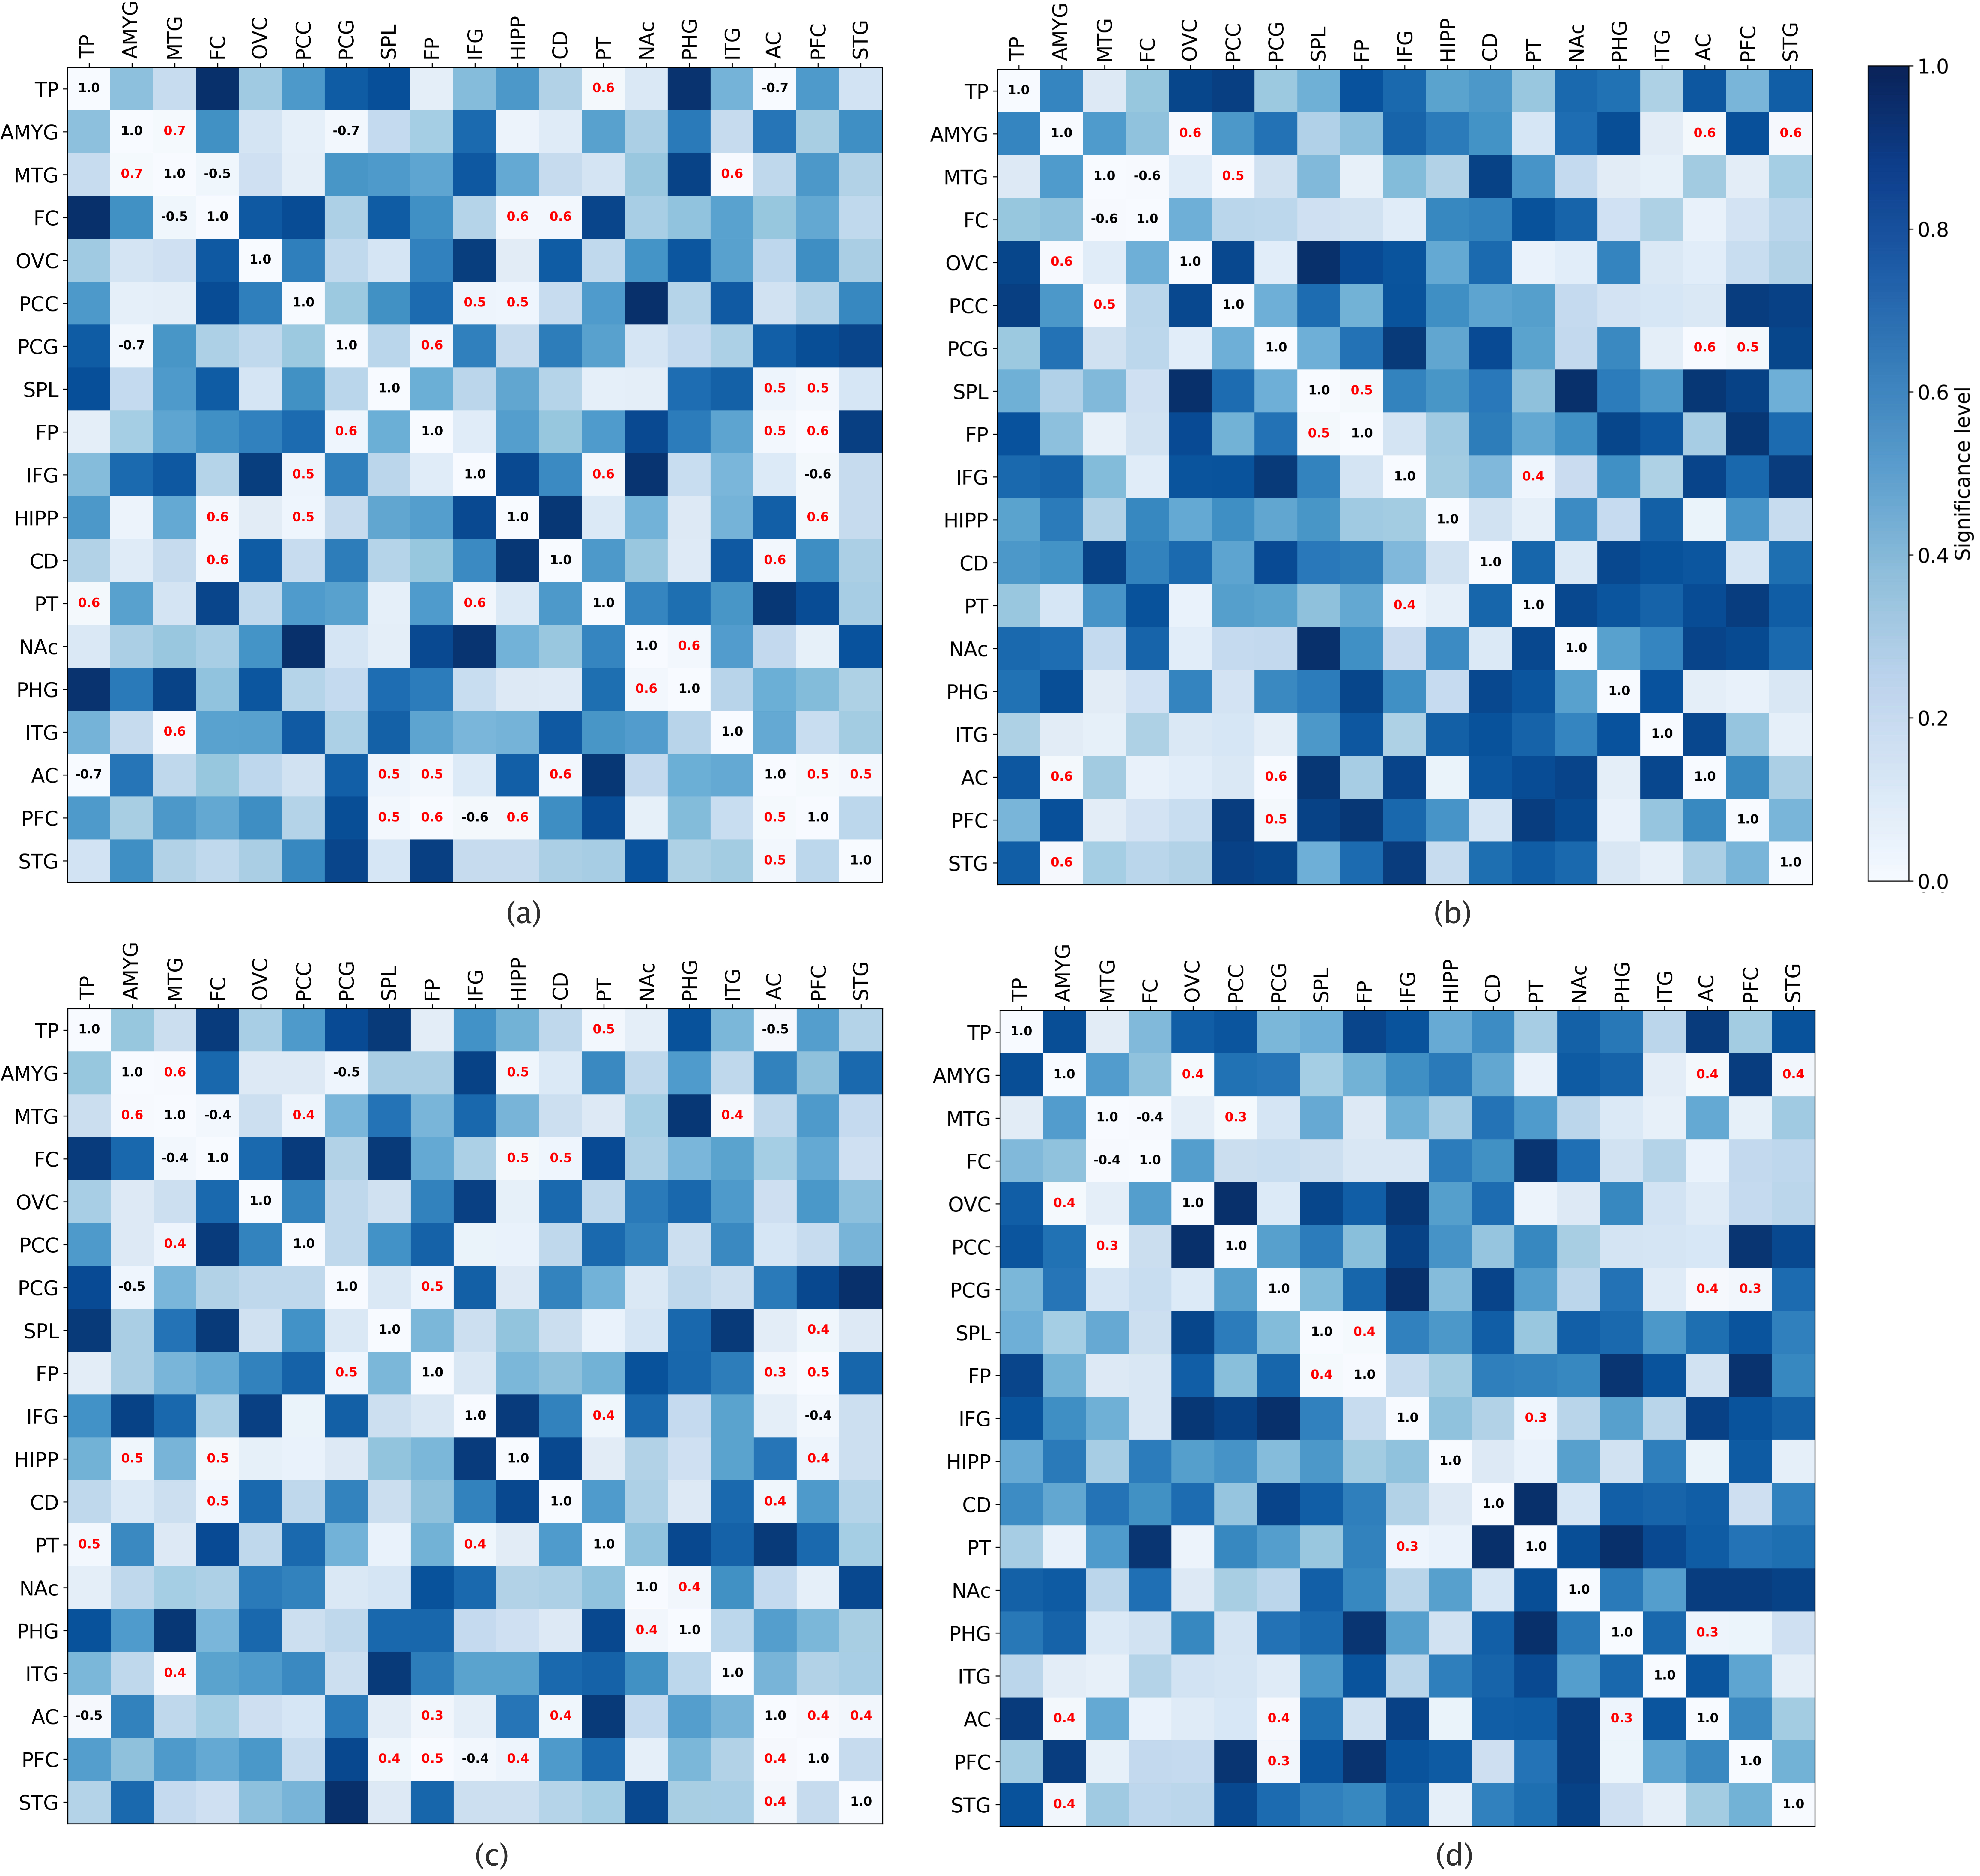
Further, pairwise correlations of 19 brain regions are computed for control and AD. We illustrate the brain regions with clear correlations in Figure 5. It is evident that there exist 15 (by Spearman) and 16 (by Kendall) union brain regions showing significant correlations for control, and only 6 (by Spearman) and 7 (by Kendall) union brain regions showing significant correlations for AD cases, respectively. And for both Spearman and Kendall correlations, there are 15 overlap union brain regions of significant correlations for control, whereas only 6 overlap union brain regions for AD. Moreover, the circadian oscillation patterns of 14 union brain regions exist for control but disappear for AD. Only PTIFG manifests correlations for control and for AD, but those for control are stronger than for AD. The correlations on the other 5 union brain regions appear to be associated with the pathology of AD.
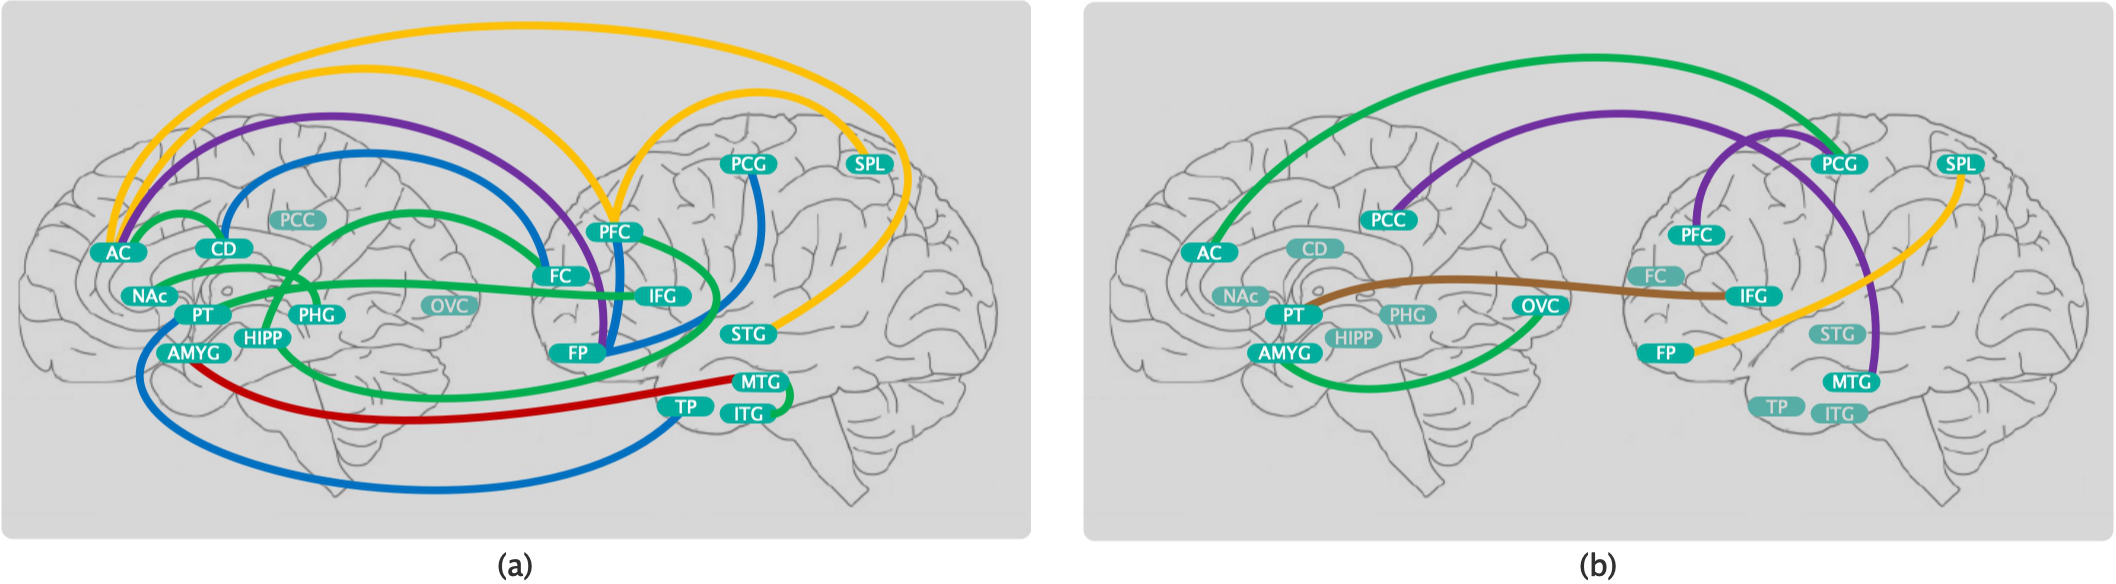
Notably, the two overlap union brain regions are related to the hippocampus, HIPPFC and PFCHIPP, whereas they disappear for AD (see Figure 5). Different parts of the brain are known to have specific functions; In particular, the hippocampus is pivotal for learning and memory. An emerging study has shown that auditory stimulation combined with light-induced 40-hertz gamma oscillations in the hippocampus and auditory cortex regions of the brain attenuates amyloid levels and improves cognition and memory in AD animal models 30. Our findings pinpoint the human brain regions where the inherent circadian rhythms in the brains of AD patients become out of phase or lost, thereby revealing putative human brain regions for taking a similar strategy to that for the hippocampus 30 as a potential intervention or treatment for AD. In order to visualize our findings, we schematically depict the computed correlations for control and AD on the human brain regions in Figure 6.
In brief, our findings include 1) the consistent circadian oscillation patterns of the genome-wide profile of gene expression and the synthesis of clock genes on MTGITG, ACFP, and PFCFP for control; 2) The manifestation of more substantially correlated brain regions for control than for AD. These findings demonstrate that the synchronized oscillation patterns in many brain regions of AD cases become disarrayed compared to healthy controls. Our discovery provides new genome-wide gene expression-based evidence for the close ties of AD with circadian rhythm disorder.
Discussion
AD damages an individual’s thoughts, memory, speech, and ability to carry out basic daily activities. While a few drugs may temporarily relieve certain mild or early cognitive symptoms of AD, they could not help permanently reduce or reverse the cognitive and functional impairment of AD. Almost all previous treatment strategies have failed in clinical trials. If AD continues to be uncontrolled, the economic burden would exceed one trillion dollars annually by 2050 31. Therefore, effective ways for early diagnosis and intervention of AD are urgently needed.
A research thrush has recently emerged as a potential intervening means by looking beyond traditional drug strategies. It successfully uses light flickering and pulsing sounds at the frequency 40 hertz of a key brain rhythm to stimulate and reinstate the circadian rhythm of an AD affected brain region of model mice 30, 32, 33, 34, 35, leading to effective amelioration of the pathological load and improvement of the cognition. A better understanding of the associations of circadian rhythms with AD would potentially benefit the development of new treatment strategies for AD. Our study has demonstrated the important role circadian rhythms play in human brain functions and provided quantitative evidence regarding how AD affects the rhythmic oscillation patterns of the human brain; thus, it should help advance our understanding of the relationship of AD with circadian rhythms of multiple brain regions.
Our approach focuses on identifying the circadian oscillation patterns in untimed data across multiple datasets and provides a new and feasible way for systematically characterizing the circadian rhythm or clock reflected on brain regions. For the first time, correlations between multiple brain regions’ circadian rhythms and AD are revealed quantitatively based on untimed genome-wide gene expression. Recently, two approaches have been developed to analyze the single clock gene’s circadian rhythm from untimed samples. 19 has presented a statistical approach, Oscope, to extract the transcriptional dynamics of oscillating genes in single-cell gene expression data. Oscope has a prohibitively high computational complexity for genome-wide study because of the comparisons of every gene-by-gene pairing. Also, Oscope is sensitive to nonrhythmic intersubject variation. 18 has proposed a method called cyclic ordering by periodic structure (CYCLOPS) to order periodic data without timestamps by global descriptors of expression structure. The critical step of CYCLOPS is to associate the potential temporal order with angles (uniformly) distributed in by using a circular neural network. Thus, if the analyzed samples are only parts of a whole periodic cycle, as 18 pointed out, CYCLOPS will be difficult to detect the potential oscillation pattern. It also implicitly assumes the unrealistic uniform periodic variation of circadian rhythms. Both CYCLOPS and Oscope are intended to characterize the circadian rhythms of single genes. In contrast, they are unable to analyze the orchestration of the circadian rhythmic patterns of genome-wide gene expression. However, single clock genes’ circadian rhythms can hardly be taken as a direct characterization of the circadian clocks of the brain, and the circadian rhythm of a brain region is based on coordinated regulation from all relevant genes rather than a single one. These two approaches cannot be applied to our genome-wide study.
Limitations and assumptions. In this study, if all samples’ collection times had been the same, our approach would have become inoperative. Thus, throughout the study, our entire analysis and discussions are based on a critical assumption:777This assumption is weak, because sample’s timestamps such as time-of-death are hardly, if not impossible, all the same. All samples’ collection times were not particularly arranged to be simultaneous; that is, the samples’ timestamps were not all the same.
Conclusions
The disruption of brain circadian rhythm is a crucial symptom for patients with AD. Current studies and accumulating clinic evidence suggest that such a symptom usually occurs in the early phase of AD and probably precedes the development of cognitive impairment. However, the full and systematic circadian rhythm orchestration of genome-wide gene expression in the human brain and its potential dysregulation in AD remains unknown. This study explores the relationships between circadian rhythms of different brain regions and AD with untimed genome-wide gene expression data. To this end, we developed an unsupervised machine learning-based approach, PRIME, to detect and analyze oscillation patterns in untimed high-dimensional data across multiple brain regions. This innovative approach is able to discover potential circadian oscillation patterns from untimed high-dimensional expression data across multiple datasets. It does not need the data from an entire periodic cycle, nor does it need to impose a high complexity for high-dimensional gene expression data. It mainly leverages unsupervised learning and thus does not need any timestamps or labels that may be tedious to obtain. By PRIME, we reveal clear, synchronized oscillation patterns in 15 pairs of brain regions of control, whereas these oscillation patterns either disappear or dim for AD.
Acknowledgments
This work was partially supported by the NIH grants R21AG070909, R56NS117587, R01HD101508, and ARO W911NF-17-1-0040.
The results published here are in whole or in part based on data obtained from the AD Knowledge Portal. These data were provided by the Rush Alzheimer’s Disease Center, Rush University Medical Center, Chicago.
References
- [1] Gagnon JF, Lafrenire A, Rauchs G, Petit D, Carrier J. Sleep in normal aging, Alzheimer’s disease, and mild cognitive impairment. Handbook of Behavioral Neuroscience. 2019;30:677–692.
- [2] Leng Y, Musiek ES, Hu K, Cappuccio FP, Yaffe K. Association between circadian rhythms and neurodegenerative diseases. The Lancet Neurol. 2019 February;18(3):307–318.
- [3] Irwin MR, Vitiello MV. Implications of sleep disturbance and inflammation for Alzheimer’s disease dementia. The Lancet Neurology. 2019 January;18(3):296–306.
- [4] Noble W, Spires-Jones TL. Sleep well to slow Alzheimer’s progression. Science. 2019 February;363(6429):813–814.
- [5] Dunlap JC. Molecular bases for circadian clocks. Cell. 1999 January;96(2):271–290.
- [6] King DP, Takahashi JS. Molecular genetics of circadian rhythms in mammals. Annual Review of Neuroscience. 2000 March;23:713–742.
- [7] Schibler U, Sassone-Corsi P. A web of circadian pacemakers. Cell. 2002 December;111(7):919–922.
- [8] Hastings MH, Reddy AB, Maywood ES. A clockwork web: Circadian timing in brain and periphery, in health and disease. Nature Reviews Neuroscience. 2003 August;4(8):649–661.
- [9] Reddy AB, Maywood ES. Circadian rhythms: Per2bations in the liver clock. Current Biology. 2007 April;17(8):292–294.
- [10] Dibner C, Schibler U, Albrecht U. The mammalian circadian timing system: organization and coordination of central and peripheral clocks. Annual Review of Physiology. 2010 March;72(1):517–549.
- [11] Cordone S, Annarumma L, Rossini PM, Gennaro LD. Sleep and -Amyloid deposition in Alzheimer disease: Insights on mechanisms and possible innovative treatments. Frontiers in Pharmacology. 2019 June;10:695.
- [12] Lucey BP, McCullough A, Landsness EC, Toedebusch CD, McLeland JS, Zaza AM, et al. Reduced non-rapid eye movement sleep is associated with tau pathology in early Alzheimer’s disease. Science Translational Medicine. 2019 January;11(474):eaau6550.
- [13] Li JZ, Bunney BG, Meng F, Hagenauer MH, Walsh DM, Vawter MP, et al. Circadian patterns of gene expression in the human brain and disruption in major depressive disorder. The Proceedings of the National Academy of Sciences. 2013 April;110(24):9950–9955.
- [14] Chen CY, Logan RW, Ma T, Lewis DA, Tseng GC, Sibille E, et al. Effects of aging on circadian patterns of gene expression in the human prefrontal cortex. The Proceedings of the National Academy of Sciences. 2016 January;113(1):206–211.
- [15] Wu YH, Fischer DF, Kalsbeek A, Garidou-Boof ML, van der Vliet J, van Heijningen C, et al. Pineal clock gene oscillation is disturbed in Alzheimer’s disease, due to functional disconnection from the “master clock”. The FASEB Journal. 2006 September;20(11):E1171–E1180,1874–1876.
- [16] Cermakian N, Lamont EW, Boudreau P, Boivin DB. Circadian clock gene expression in brain regions of Alzheimer’s disease patients and control subjects. Journal of Biological Rhythms. 2011 April;26(2):160–170.
- [17] Song H, Moon M, Choe HK, Han DH, Jang C, Kim A, et al. A-induced degradation of BMAL1 and CBP leads to circadian rhythm disruption in Alzheimer’s disease. Molecular Neurodegeneration. 2015 March;10(13).
- [18] Anafi RC, Francey LJ, Hogenesch JB, Kim J. CYCLOPS reveals human transcriptional rhythms in health and disease. The Proceedings of the National Academy of Sciences. 2017 April;114(20):5312–5317.
- [19] Leng N, Chu LF, Barry C, Li Y, Choi J, Li X, et al. Oscope identifies oscillatory genes in unsynchronized single-cell RNA-seq experiments. Nature Methods. 2015 August;12(10):947–950.
- [20] Caldelas I, Poirel VJ, Sicard B, Pvet P, Challet E. Circadian profile and photic regulation of clock genes in the suprachiasmatic nucleus of a diurnal mammal Arvicanthis ansorgei. Neuroscience. 2003 January;116(2):583–591.
- [21] Dopico XC, Evangelou M, Ferreira RC, Guo H, Pekalski ML, Smyth DJ, et al. Widespread seasonal gene expression reveals annual differences in human immunity and physiology. Mature communications. 2015 May;6(7000).
- [22] Gut G, Tadmor MD, Pe’er D, Pelkmans L, Liberali P. Trajectories of cell-cycle progression from fixed cell populations. Nature Methods. 2015 August;12(10):951–954.
- [23] Ye Y, Gao L, Zhang S. Circular trajectory reconstruction uncovers cell-cycle progression and regulatory dynamics from single-cell Hi-C maps. Advanced Science. 2019 December;6(23):1900986.
- [24] Morales-Santana S, Morell S, Leon J, Carazo-Gallego A, Jimenez-Lopez JC, Morell M. An overview of the polymorphisms of circadian genes associated with endocrine cancer. Frontiers in Endocrinology. 2019 February;10(104).
- [25] Hughey JJ, Hastie T, Butte AJ. ZeitZeiger: Supervised learning for high-dimensional data from an oscillatory system. Nucleic Acids Research. 2016 May;44(8):e80.
- [26] Alter O, Brown PO, Botstein D. Singular value decomposition for genome-wide expression data processing and modeling. The Proceedings of the National Academy of Sciences. 2000 August;97(18):10101–10106.
- [27] Ding CHQ, Li T, Jordan MI. Convex and semi-nonnegative matrix factorizations. IEEE Transactions on Pattern Analysis and Machine Intelligence. 2010 January;32(1):45–55.
- [28] Pratt WK. Digital image processing. 4th ed. Wiley-Interscience; 2007.
- [29] Hughes ME, DiTacchio L, Hayes KR, Vollmers C, Pulivarthy S, Baggs JE, et al. Harmonics of circadian gene transcription in mammals. PLOS Genetics. 2009 April;5(4):e1000442.
- [30] Martorell AJ, Paulson AL, Suk HJ, Abdurrob F, Drummond GT, Guan W, et al. Multi-sensory gamma stimulation ameliorates Alzheimer’s-associated pathology and improves cognition. Cell. 2019 April;177(2):256–271.
- [31] Murphy MP. Amyloid-beta solubility in the treatment of Alzheimer’s disease. The New England Journal of Medicine. 2018 January;378(4):391–392.
- [32] Canter RG, Penney J, Tsai LH. The road to restoring neural circuits for the treatment of Alzheimer’s disease. Nature. 2016 November;539(7628):187–196.
- [33] Iaccarino HF, Singer AC, Martorell AJ, Rudenko A, Gao F, Gillingham TZ, et al. Gamma frequency entrainment attenuates amyloid load and modifies microglia. Nature. 2016 December;540(7632):230–235.
- [34] Adaikkan C, Tsai LH. Gamma entrainment: Impact on neurocircuits, glia, and therapeutic opportunities. Trends in Neurosciences. 2019 December;43(1):24–41.
- [35] Adaikkan C, Middleton SJ, Marco A, Pao PC, Mathys H, Kim DNW, et al. Gamma entrainment binds higher-order brain regions and offers neuroprotection. Neuron. 2019 June;102(5):929–943.