2022
[1,2,3]\fnmSoroush \surArabi
[2,8]\fnmRuslan \surTemirov
[1,2,4]\fnmMarkus \surTernes
1]\orgdivInstitute of Physics IIB, \orgnameRWTH Aachen University, \orgaddress52074 Aachen, \countryGermany
2]\orgdivPeter-Grünberg-Institute for Quantum Nanoscience, \orgnameResearch Center Jülich, \orgaddress\city52425 Jülich, \countryGermany
3]Max Planck Institute for Solid State Research, Heisenbergstraße 1, 70569 Stuttgart, Germany 4]Jülich Aachen Research Alliance, Fundamentals of Future Information Technology, 52425 Jülich, Germany
5]\orgdivInstitute of Physics IV, \orgnameRWTH Aachen University, \orgaddress\city52074 Aachen, \countryGermany
6]King’s College London, Theory and Simulation of Condensed Matter (TSCM), The Strand, London WC2R 2LS, UK
7]Institut de Physique, École Polytechnique Fédérale de Lausanne, 1015 Lausanne, Switzerland
8]Institute of Physics II, University of Cologne, 50937 Cologne, Germany
Portrait of locally driven quantum phase transition cascades in a molecular monolayer
Abstract
Strongly interacting electrons in layered materials give rise to a plethora of emergent phenomena, such as unconventional superconductivity cao2018(1) ; Yankowitz2019 ; Chen2019 , heavy fermions Vano2021 ; Yazdani2016 ; Hunt2013 , and spin textures with non-trivial topology sharpe2019 ; Liu2022 ; Du2009 . Similar effects can also be observed in bulk materials, but the advantage of two dimensional (2D) systems is the combination of local accessibility by microscopic techniques and tuneability. In stacks of 2D materials, for example, the twist angle can be employed to tune their properties Novoselov2016 ; Andrei2021 . However, while material choice and twist angle are global parameters, the full complexity and potential of such correlated 2D electronic lattices will only reveal itself when tuning their parameters becomes possible on the level of individual lattice sites. Here, we discover a lattice of strongly correlated electrons in a perfectly ordered 2D supramolecular network by driving this system through a cascade of quantum phase transitions using a movable atomically sharp electrostatic gate. As the gate field is increased, the molecular building blocks change from a Kondo-screened to a paramagnetic phase one-by-one, enabling us to reconstruct their complex interactions in detail. We anticipate that the supramolecular nature of the system will in future allow to engineer quantum correlations in arbitrary patterned structures Khajetoorians2019 ; Gomes2012 ; Drost2017 ; Green2014 .
The prototypical building block in strongly correlated systems is a localised magnetic moment immersed in a bath of itinerant electrons. Below a characteristic temperature, the Kondo temperature , the hybridisation between the local moment and the itinerant electrons forms a many-body singlet state at the Fermi energy , the so-called Kondo singlet, and results in the quenching of the local moment. Arranging such building blocks periodically leads to the lattice version of this phenomenon, i. e., a Kondo lattice. Despite their complexities, these systems are typically understood in terms of the competition of two antagonistic effects: The local antiferromagnetic Kondo interaction which screens the local moments at every site of the lattice by the spin of the conduction electrons, and a long-range interaction between different local moments that favours magnetic ordering and breaking the Kondo singlets Doniach1977 . In a subtle balance of these two effects, close to absolute zero temperature, the systems become critical, and quantum fluctuations dominate the physics Coleman2005 ; Lohneysen2007 ; Kirchner2020 .
Whereas the understanding of the Kondo lattice physics has been developed to a high degree through the study of transition-metal and heavy-fermion crystals, attempts to access the local information regarding the quantum degrees of freedom (spins) and to coherently manipulate them Heinrich2021 ; ternes2017 are still intensively stimulating the field. Naturally, this striving has redirected the approach to realising strongly correlated lattices from three-dimensional stoichiometric compounds Aynajian2010 ; Kavai2021 towards artificial spin structures in reduced dimensions and also promoted the utilisation of local probes for measurements. In this regard, studies have shown the formation of correlated lattices using moiré superlattices in 2D transition metal dichalcogenides Vano2021 ; Kumar2022 , and alternatively, in bottom-up approaches using molecular/atomic building blocks which have been arranged either by atomic manipulation techniques Figgins2019 ; Moro-Lagares2019 or by self-assembly Jiang2011 ; Ternes2004 . Yet, despite the enormous progress, a detailed microscopic understanding, particularly from the local real-space perspective, is still out of reach.
Therefore, to fill this gap, we study a self-assembled relaxed monolayer of 1,4,5,6-naphthalene tetracarboxylic acid dianhydride (NTCDA) on an Ag(111) substrate Stahl1998 ; Fink1999 . In gas phase the molecule is charge neutral, but upon adsorption to Ag(111) its (formerly) lowest unoccupied molecular orbital shifts below ( eV) and becomes a singly occupied molecular orbital (SOMO) with spin 1/2 Bendounan2007 ; Schoell2010 ; Tonner2016 ; Jakob2016 . In low-temperature scanning tunnelling microscopy (STM), the molecules are imaged at low bias as dumbbell-shaped objects forming a brick wall lattice with alternating rows of topographically higher (brighter) and lower (darker) appearance (Fig. 1a) Eickhoff2019 . The superlattice unit cell contains, therefore, two slightly different molecules: a bright one and a dark one.
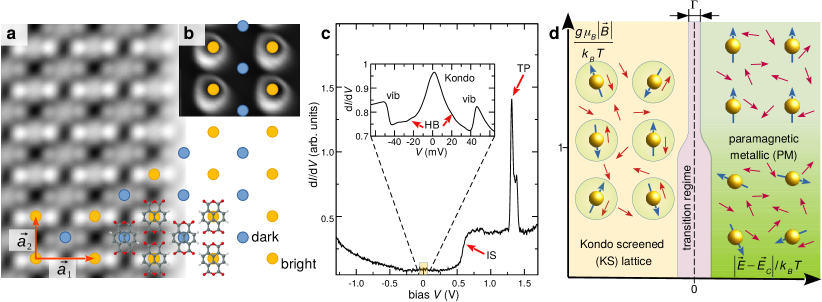
Interestingly, imaging the same lattice at large positive bias V reveals ring-like structures in the differential conductance maps, centred on the bright molecules (Fig. 1b). These rings originate from a strong transition peak (TP) which can also be seen in the single-point spectroscopy above the bright molecules (Fig. 1c). In the following, we will show that the TP indicates a quantum phase transition (QPT) in the molecular layer in which the electric field of the STM tip drives the Kondo-screened molecules of the lattice successively into a paramagnetic free spin phase (Fig. 1d).
We focus now on energies close to where we find very complex and strongly position-dependent spectra in the lattice (see Supplementary Note 1). A spectrum spatially averaged over the lattice (Fig. 1c inset) reveals a broad peak close to zero bias as a manifestation of Kondo singlets. Furthermore, the spectrum contains conductance steps at meV, which are due to inelastic vibrational excitations of the individual molecules Braatz2012 ; Tonner2016 ; Eickhoff2019 . At the flanks of the Kondo peak, we see well-resolved electron- and hole-like quasiparticle excitations, which will turn out to be Hubbard bands (HB).
To disentangle the spectroscopic features, we analyse individual spectra taken on a grid of points on the molecular lattice (see Methods). In this dataset, we search for peak structures and plot their weighted occurrence in an energy distribution histogram (Fig. 2a). This histogram shows two peaks very close to whose averaged spectra correspond to the Kondo resonances of the bright and dark molecules, apparent in the occurrence maps (Fig. 2b II and III). Compared to the bright molecules’ K, the averaged spectrum of the dark molecules’ Kondo resonance reveals, in agreement with ref. Eickhoff2019 , a higher K due to a stronger hybridisation with the Ag(111). It shows instead of a peak an asymmetric Fano line-shape which is the result of interference between two possible tunnelling channels in the STM junction, i. e., electrons can tunnel from the tip either via the resonance or directly into the substrate Fano1961 ; Ternes2009 . The Kondo resonances are strongly localised at the ends of the dumbbell-like topographic shape of the molecules, which correspond to their C–H sites Eickhoff2019 . At the centre of the molecule, however, the resonance vanishes. Such distribution cannot originate from a symmetric orbital, but points to a -like molecular orbital with a nodal plane along the molecular long axis Eickhoff2019 . This -like orbital contains the spatially distributed spin with a phase shift between the two lobes and enables a significant intermolecular coupling Esat2016 .
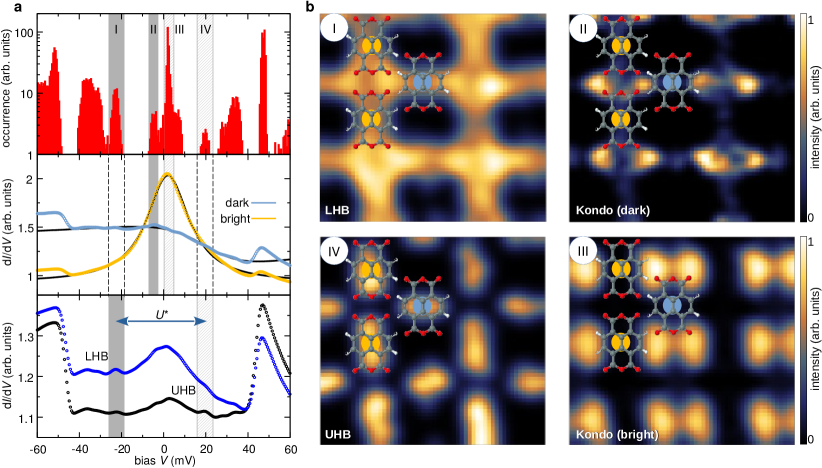
Also, the states in the flanks of the Kondo peak are clearly distinguishable in the histogram with the maximum occurrence at mV and mV. Due to their low intensity, their averaged spectra are outshone by the vibrational excitations and the Kondo resonance. Their mapping (see Methods), however, clearly reveals that the occupied state at negative bias is most strongly located between the molecules, while the unoccupied one is localised at each dark and bright molecule’s centre (Fig. 2b I and IV). This distribution, which is reminiscent of bonding and antibonding combinations between the states on the three neighbouring molecules indicated in Fig. 2b, reveals that the flank peaks are a consequence of the formation of a correlated lattice and hence can be naturally understood as lower and upper Hubbard bands (LHB/UHB) coleman_2015 . They have a composite structure containing contributions from the localised -electrons of the molecules as well as from the conduction electrons. Note that their meV is much smaller than the Coulomb repulsion of the SOMO. The additional bands energetically further away from also show spatial dependence (see Supplementary Note 2), but are for the following not important.
We now turn to the prominent TP feature of Fig. 1c by recording spectra above the centre of the bright molecules by changing the tip-sample tunnelling distance at successively reduced constant bias (Fig. 3a). We define as the extrapolated height at which quantum of conductance would be reached. The at which the peak occurs is proportional to (Fig. 3c), leading us to an electric field driven origin of the TP. Simplifying the STM junction as a plate capacitor with an electrical field between tip apex and sample of , with as the unit vector along the -direction (Fig. 3b), the linear relation corresponds to a critical field GVm-1 at which the TP occurs.
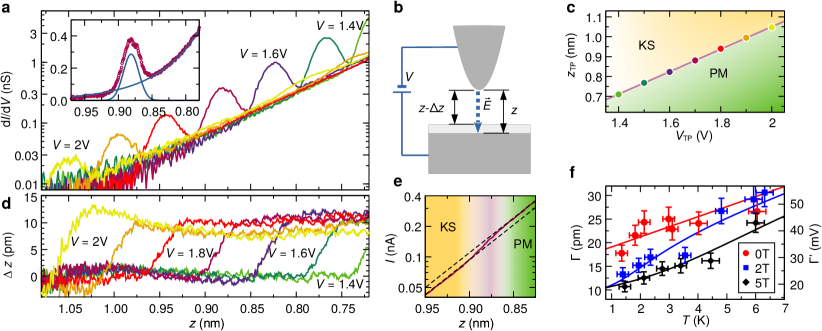
The TP in is equivalent to an increase in conductance, as the example of a simultaneously recorded trace in Fig. 3e illustrates. Until the TP is reached the current increases exponentially with and a nm-1. Past the TP, increases further with identical , excluding a modification of the tunnel barrier by any significant charge accumulation on the molecule. Thus, the TP is tantamount to a change of the effective tip-sample distance from to . This pm is bias independent (Fig. 3d), meaning that its origin lies in an increase of the molecular lattice conductivity.
Gating of a molecular charge state by exerting the -field of an STM tip has been observed Fernandez_Torrente2012 ; Pham2019 ; Kumar2019 ; Mohammed2020 ; Li2021 ; Yan2021 and is usually explained in the framework of a double barrier tunnel junction model in which the electric field shifts a single particle molecular state across , thereby changing the number of electrons on the molecule. This is different here. The only charge-like (and therefore gateable) state which lies close to is the LHB which is a composite state of the lattice with relatively weak intensity. The prominent Kondo resonance is fixed to and, therefore, cannot be gated.
The width of the TP shows a peculiar behaviour: With increasing temperature , increases linearly as expected from the thermal broadening of the Fermi edge of the tip (Fig. 3f red line). However, an additionally applied -field perpendicular to the surface of strength (with as Bohr’s magneton, and as Boltzmann’s constant) decreases significantly, as shown in Fig. 3f. This behaviour is reminiscent of the freezing out of spin-fluctuations in an ideal paramagnetic metal with and can be well described by assuming a broadening due to the sum of intrinsic quantum and thermal fluctuations:
| (1) |
with pm as the finite resolution of our experimental setup and pm as the extrapolated quantum fluctuations per (spin) degree of freedom at where all thermal fluctuations are frozen out. The average number of available spin states, is given by the entropy of the paramagnetic spin 1/2 in the field and at temperature . is the slope of the -dependent broadening of the TP. Note, however, that this model neglects any magnetic interactions between neighbouring spins. Significant magnetic ordering would reduce by freezing out fluctuations similar to the -field here (for further details see Methods).
The proportionality between and allows us to express also as a width in , mV (see Supplementary Note 3). From the applied bias only a small fraction shifts the LHB (see Supplementary Note 4), which we can estimate for V as . This allows to estimate the width of the quantum fluctuation per degree of freedom in energy as meV, and with this the timescale of the quantum fluctuation ps (with as the reduced Planck’s constant) of the QPT extrapolated for .
This QPT is driven by the -field of the tip. For a radially symmetric tip, the field decreases with the lateral distance to the tip apex as , whereby and approximate the decay of the -field due to the shape of the tip Battisti2017 . At biases and tip heights where the TP occurs at a certain lateral distance from the molecular centre, leading to growing ring-like structures when images are taken at successively increased . Fig. 4a shows a set of such images. At V similar rings as in Fig. 1b form. The small deviation from perfect circularity can be assigned to some tip shape asymmetries. When rings from neighbouring bright molecules cross along the short direction, they overlap. Contrarily, when they cross along the long direction a gap opens (at V), signalling an avoided crossing due to intermolecular interaction Li2021 .
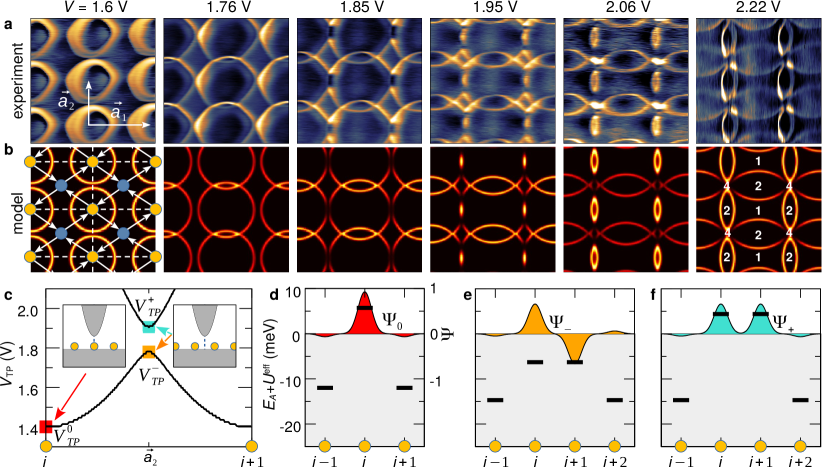
To rationalise the ring formation in our bipartite lattice we use a single-particle tight-binding model in which we include the effect of the -field of the tip. We use a complex hybridisation amplitude between nearest-neighbour bright (A) and dark (B) molecules and different next-nearest-neighbour hopping between bright molecules along the directions and as illustrated in Fig. 4b, left panel (for details see Methods).
The use of a finite phase is inspired by the seminal work of Haldane on graphene, in which he assumes a phase-dependent hopping between next-nearest neighbours Haldane1988 , which is based on the observation that electrons face different energy landscapes on their left and right while hopping forward and backward Kane2005 . Similarly, but for nearest-neighbours, this argument holds for the NTCDA lattice: electrons hopping from the marked dark molecule in Fig. 2b to the lower-left bright molecule face on their right side the broad Kondo resonance of the dark molecule, while on the left side, they face the strong Kondo resonance of the bright molecule (see maps in Fig. 2). For electrons in opposite directions, the situation is reversed. This symmetry breaking does not occur for hopping between two bright or two dark molecules.
With this model, we can reproduce our observations as the comparison of Fig. 4a and 4b shows. When the tip is placed above a bright molecule at site and (Fig. 4c), the wavefunction which crosses is mainly localised at the site underneath the tip (Fig. 4d). However, when the tip is placed between two bright molecules along the direction, two transitions occur: At the antisymmetric superposition crosses (Fig. 4e), where is the orbital wavefunction of the individual bright molecule at site . This is then followed by the observed gap between the rings, and finally by the crossing of the symmetric superposition from at (Fig. 4f). Thus, at this tip position, each QPT involves a coherent superposition between two neighbours.
When we increase the bias further, more and more rings cross each other, and when the tip is placed on a dark molecule, as many as four lattice sites are coherently brought into the paramagnetic state at V. This is remarkable because even though the gated molecules have a lateral distance of nm from the tip apex, we only see a minor reduction of the TP intensity compared to the situation when the tip is on top of a bright molecule, clearly revealing the coherent lattice nature of the effect. Importantly, without the complex hybridisation between the sublattices, we cannot reproduce correctly the experimentally observed intensity modulation (see Supplementary Note 5).
To summarise, taking advantage of sub-angstrom-resolution spectroscopic imaging offered by STM, we unraveled the role of strong electronic correlations in the formation of Hubbard bands and Kondo resonances in a self-assembled molecular lattice. Build out of simple molecular building blocks, the lattice can reach macroscopic dimensions. We demonstrated that the ground state of the lattice can be controlled and manipulated by the local electric field of the STM tip, which drives the charge localised in the Hubbard bands across and leads to a fundamental change of the lattice properties from a KS lattice to a PM metal. We found clear signals of the quantum nature of this transition as finite fluctuations drive the transition even at zero temperature. For specific tip positions, interactions between neighbouring building blocks lead to a closed sequence of QPTs involving several molecules. These sequences manifest themselves in ring-like structures which coherently interact with each other even nanometres away from the tip’s position and create an interference pattern in real space. Finally, we showed that these interference patterns in the maps can be effectively simulated with a single-particle model Hamiltonian which has a complex hybridisation.
The observed QPTs shed light on the fragility of the correlations in supramolecular Kondo lattices. Even though the single-ion Kondo effect in our system has a high originating from the strong interactions between the substrate and the SOMO, which would require a very large -field to be brought to , the lattice singlets are fragile objects that can be broken by relatively moderate fields.
Our study not only expands the current understanding of strong correlations and topological properties in 2D materials but also offers a new supramolecular platform for further explorations. This can be done particularly by engineering complex structures out of molecular building blocks with the possibility of arbitrary pattering using molecular manipulation techniques and application of long-range gate operations at atomic scales.
Methods
Experimental procedure
The measurements were taken using a home-built combined STM and atomic force microscope operating in ultrahigh vacuum ( mbar), at fields perpendicular to the sample surface of up to T, and, if not mentioned otherwise, at a base temperature of K. spectra were acquired by modulating the bias voltage with a sinusoidal of frequency Hz and employing a lock-in amplifier. Note, the number of gated molecules is only limited by tip induced instabilities of the molecular lattice that start to occur at biases V. The bare Pt tip was conditioned by indentation into the Ag(111) surface. The Ag(111) crystal was prepared by repeated cycles of Ar+ sputtering and annealing. Afterwards, NTCDA molecules were deposited onto the clean Ag(111) surface held at room temperature from a Knudsen cell molecule evaporator.
Data analysis and fitting
The statistical analysis of the grid spectra in Fig. 2 was performed by using feature-detection scanning tunnelling spectroscopy (FD STS) Sabitova2018 . For that a second order Savitzky-Golay filter (SGF) with a sliding window of was applied at each data point. The SGF performs a quadratic fit , enabling the determination of peak positions when changes sign and . Subsequently, a weight is assigned to each peak by determining the intensity difference between the neighbouring extrema in the first derivative of the signal, i. e. at . This is then mapped producing the images in Fig. 2b, and used as weight for the averaged spectra shown in Fig. 2a.
The fits of Fig. 2a are least-square fits of the Fano line-shape , with as the differential conductance (), as the background conductance, , as the center of the resonance, as its width, and as the Fano form-factor Fano1961 . Because and , we neglected temperature and modulation broadening effects.
The empirical Eq. 1 is motivated by the following assumptions: The quantum fluctuations are linearly dependent on the number of available states which can be reached when crossing the QPT, i. e., for the transition from the non-magnetic Kondo singlet state to the paramagnetic state it depends on the ratio between magnetic field energy and thermal energy . This changes from =1 when the spin degrees are frozen out, to =2 when resulting in a total broadening of . At , an additional thermal broadening occurs due to the Fermi-Dirac distribution of the tip’s electrons which smears out any measurement in STM spectroscopy. Additionally, we have to account for the thermally activated broadening of the paramagnetic spin when . Both thermal broadening can be combined to . Thus, for only the tip effect is accounted for, while at , the two thermally activated broadening sources are geometrically added to the prefactor .
Tight-binding calculation
We used a single-particle tight-binding Hamiltonian:
| (2) |
Here, accounts for the on-site energies and the hopping within each sublattice (A bright, B dark molecules) and is given by:
| (3) |
and for the hybridisation between the two sublattices:
| (4) |
The creation and annihilation operators act on the quasiparticle at site of the sublattice . The single bracket and double bracket in the sums stand for the nearest- and next-nearest-neighbour sites, where we allowed the hopping amplitude to differ in each sub-lattice () and also along the short and long unit vectors. We used the energies of the LHB and UHB for the on-site energies and . However, the simulations remain indifferent to the exact value of as long as . To include the local -field of the tip we added at each lattice site , where is the lateral distance between the tip apex and site at sublattice . The maps of Fig. 4b were then calculated by diagonalization of Eq. 2 at each pixel and by taking the absolute square of the coherent sum of all spatially extended wavefunctions which energy lie within the derivative of Fermi-Dirac distribution
| (5) |
Note, that each wavefuction is a sum of spatially extending Warnier-like orbitals which are centred at the molecules at site , with complex coefficients . We used -like orbitals for the representation in Fig. 4d-f, whereby we mark that the shape of the did not play a role in the calculation of the . \bmheadAcknowledgments We thank Christian Ast, Johann Kroha, Christopher Leon, and Nicolás Lorente for fruitful discussions. M.T. acknowledges support from the Heisenberg Program (Grant No. TE 833/2-1) and the Priority Program (SPP 2244) of the German Research Foundation. \bmheadAuthor contributions R.T., F.S.T., and M.T. conceived the experiment. S.A., T.E., R.T., A.S., and Y.W. performed the STM measurements. S.A., M.T., T.E., and R.T. analysed the experimental data. S.A. and M.T. developed the theoretical modelling and tight-binding calculations. S.A. and M.T. wrote the manuscript with significant input from T.E., H.L., C.W., F.S.T., and R.T. All authors discussed the results and reviewed the manuscript.
References
- (1) Cao, Y. et al. Unconventional superconductivity in magic-angle graphene superlattices. Nature 556, 43–50 (2018).
- (2) Yankowitz, M. et al. Tuning superconductivity in twisted bilayer graphene. Science 363, 1059–1064 (2019).
- (3) Chen, G. et al. Signatures of tunable superconductivity in a trilayer graphene moiré superlattice. Nature 572, 215–219 (2019).
- (4) Vaňo, V. et al. Artificial heavy fermions in a van der Waals heterostructure. Nature 599, 582–586 (2021).
- (5) Yazdani, A., da Silva Neto, E. H. & Aynajian, P. Spectroscopic imaging of strongly correlated electronic states. Annual Review of Condensed Matter Physics 7, 11–33 (2016).
- (6) Hunt, B. et al. Massive Dirac Fermions and Hofstadter butterfly in a van der Waals heterostructure. Science 340, 1427–1430 (2013).
- (7) Sharpe, A. L. et al. Emergent ferromagnetism near three-quarters filling in twisted bilayer graphene. Science 365, 605–608 (2019).
- (8) Liu, X. et al. Visualizing broken symmetry and topological defects in a quantum Hall ferromagnet. Science 375, 321–326 (2022).
- (9) Du, X., Skachko, I., Duerr, F., Luican, A. & Andrei, E. Y. Fractional quantum Hall effect and insulating phase of Dirac electrons in graphene. Nature 462, 192–195 (2009).
- (10) Novoselov, K. S., Mishchenko, A., Carvalho, A. & Neto, A. H. C. 2D materials and van der Waals heterostructures. Science 353, aac9439 (2016).
- (11) Andrei, E. Y. et al. The marvels of moiré materials. Nature Reviews Materials 6, 201–206 (2021).
- (12) Khajetoorians, A. A., Wegner, D., Otte, A. F. & Swart, I. Creating designer quantum states of matter atom-by-atom. Nature Reviews Physics 1, 703–715 (2019).
- (13) Gomes, K. K., Mar, W., Ko, W., Guinea, F. & Manoharan, H. C. Designer Dirac fermions and topological phases in molecular graphene. Nature 483, 306–310 (2012).
- (14) Drost, R., Ojanen, T., Harju, A. & Liljeroth, P. Topological states in engineered atomic lattices. Nature Physics 13, 668–671 (2017).
- (15) Green, M. F. B. et al. Patterning a hydrogen-bonded molecular monolayer with a hand-controlled scanning probe microscope. Beilstein Journal of Nanotechnology 5, 1926–1932 (2014).
- (16) Doniach, S. The Kondo lattice and weak antiferromagnetism. Physica B+C 91, 231–234 (1977).
- (17) Coleman, P. & Schofield, A. J. Quantum criticality. Nature 433, 226–229 (2005).
- (18) Löhneysen, H. v., Rosch, A., Vojta, M. & Wölfle, P. Fermi-liquid instabilities at magnetic quantum phase transitions. Rev. Mod. Phys. 79, 1015–1075 (2007).
- (19) Kirchner, S. et al. Colloquium: Heavy-electron quantum criticality and single-particle spectroscopy. Rev. Mod. Phys. 92, 011002 (2020).
- (20) Heinrich, A. J. et al. Quantum-coherent nanoscience. Nature Nanotechnology 16, 1318–1329 (2021).
- (21) Ternes, M. Probing magnetic excitations and correlations in single and coupled spin systems with scanning tunneling spectroscopy. Prog. Surf. Sci. 92, 83–115 (2017).
- (22) Aynajian, P. et al. Visualizing the formation of the Kondo lattice and the hidden order in URu2Si2. Proceedings of the National Academy of Sciences 107, 10383–10388 (2010).
- (23) Kavai, M. et al. Inhomogeneous Kondo-lattice in geometrically frustrated Pr2Ir2O7. Nature Communications 12, 1377 (2021).
- (24) Kumar, A., Hu, N. C., MacDonald, A. H. & Potter, A. C. Gate-tunable heavy fermion quantum criticality in a moiré Kondo lattice. Phys. Rev. B 106, L041116 (2022).
- (25) Figgins, J. et al. Quantum engineered Kondo lattices. Nature Communications 10, 55–88 (2019).
- (26) Moro-Lagares, M. et al. Real space manifestations of coherent screening in atomic scale Kondo lattices. Nature Communications 10, 2211 (2019).
- (27) Jiang, Y., Zhang, Y. N., Cao, J. X., Wu, R. Q. & Ho, W. Real-space imaging of Kondo screening in a two-dimensional O2 lattice. Science 333, 324–328 (2011).
- (28) Ternes, M. et al. Scanning tunneling spectroscopy of surface-state electrons scattered by a slightly disordered two-dimensional dilute “solid”: Ce on Ag(111). Phys. Rev. Lett. 93, 146805 (2004).
- (29) Stahl, U., Gador, D., Soukopp, A., Fink, R. & Umbach, E. Coverage-dependent superstructures in chemisorbed NTCDA monolayers: a combined LEED and STM study. Surface Science 414, 423–434 (1998).
- (30) Fink, R., Gador, D., Stahl, U., Zou, Y. & Umbach, E. Substrate-dependent lateral order in naphthalene-tetracarboxylic-dianhydride monolayers. Phys. Rev. B 60, 2818–2826 (1999).
- (31) Bendounan, A. et al. Electronic structure of 1ML NTCDA/Ag(111) studied by photoemission spectroscopy. Surface Science 601, 4013–4017 (2007).
- (32) Schöll, A. et al. Disordering of an organic overlayer on a metal surface upon cooling. Science 329, 303–305 (2010).
- (33) Tonner, R., Rosenow, P. & Jakob, P. Molecular structure and vibrations of NTCDA monolayers on Ag(111) from density-functional theory and infrared absorption spectroscopy. Phys. Chem. Chem. Phys. 18, 6316–6328 (2016).
- (34) Jakob, P. et al. Adsorption geometry and interface states: Relaxed and compressed phases of NTCDA/Ag(111). Phys. Rev. B 94, 125–436 (2016).
- (35) Eickhoff, F. et al. Inelastic electron tunneling spectroscopy for probing strongly correlated many-body systems by scanning tunneling microscopy. Phys. Rev. B 101, 125–405 (2020).
- (36) Braatz, C. R., Öhl, G. & Jakob, P. Vibrational properties of the compressed and the relaxed 1,4,5,8-naphthalene-tetracarboxylic dianhydride monolayer on Ag(111). The Journal of Chemical Physics 136, 134706 (2012).
- (37) Fano, U. Effects of configuration interaction on intensities and phase shifts. Phys. Rev. 124, 1866–1878 (1961).
- (38) Ternes, M., Heinrich, A. J. & Schneider, W.-D. Spectroscopic manifestations of the Kondo effect on single adatoms. Journal of Physics: Condensed Matter 21, 053001 (2009).
- (39) Esat, T. et al. A chemically driven quantum phase transition in a two-molecule kondo system. Nature Physics 12, 867–873 (2016).
- (40) Coleman, P. Introduction to Many-Body Physics (Cambridge University Press, 2015).
- (41) Fernández-Torrente, I., Kreikemeyer-Lorenzo, D., Stróecka, A., Franke, K. J. & Pascual, J. I. Gating the charge state of single molecules by local electric fields. Phys. Rev. Lett. 108, 036–801 (2012).
- (42) Pham, V. D. et al. Selective control of molecule charge state on graphene using tip-induced electric field and nitrogen doping. npj 2D Materials and Applications 3, 5 (2019).
- (43) Kumar, D., Krull, C., Yin, Y., Medhekar, N. V. & Schiffrin, A. Electric field control of molecular charge state in a single-component 2D organic nanoarray. ACS Nano 13, 11882–11890 (2019).
- (44) Mohammed, M. S. G. et al. Electronic decoupling of polyacenes from the underlying metal substrate by carbon atoms. Communications Physics 3, 159 (2020).
- (45) Li, H. et al. Imaging local discharge cascades for correlated electrons in WS2/WSe2 moiré superlattices. Nature Physics 17, 1114–1119 (2021).
- (46) Yan, L. et al. Synthesis and local probe gating of a monolayer metal-organic framework. Advanced Functional Materials 31, 2100519 (2021).
- (47) Battisti, I. et al. Poor electronic screening in lightly doped Mott insulators observed with scanning tunneling microscopy. Phys. Rev. B 95, 235141 (2017).
- (48) Haldane, F. D. M. Model for a quantum Hall effect without Landau levels: Condensed-matter realization of the “parity anomaly”. Phys. Rev. Lett. 61, 2015–2018 (1988).
- (49) Kane, C. L. & Mele, E. J. Quantum spin Hall effect in graphene. Phys. Rev. Lett. 95, 226801 (2005).
- (50) Sabitova, A., Temirov, R. & Tautz, F. S. Lateral scattering potential of the PTCDA/Ag(111) interface state. Phys. Rev. B 98, 205429 (2018).