PersDet: Monocular 3D Detection in Perspective Bird’s-Eye-View
Abstract
Currently, detecting 3D objects in Bird’s-Eye-View (BEV) is superior to other 3D detectors for autonomous driving and robotics. However, transforming image features into BEV necessitates special operators to conduct feature sampling. These operators are not supported on many edge devices, bringing extra obstacles when deploying detectors. To address this problem, we revisit the generation of BEV representation and propose detecting objects in perspective BEV — a new BEV representation that does not require feature sampling. We demonstrate that perspective BEV features can likewise enjoy the benefits of the BEV paradigm. Moreover, the perspective BEV improves detection performance by addressing issues caused by feature sampling. We propose PersDet for high-performance object detection in perspective BEV space based on this discovery. While implementing a simple and memory-efficient structure, PersDet outperforms existing state-of-the-art monocular methods on the nuScenes benchmark, reaching 34.6% mAP and 40.8% NDS when using ResNet-50 as the backbone.
1 Introduction
3D object detection is pivotal in helping intelligent agents perceive the environment in autonomous driving systems and robotics. Sensors like cameras (Chen et al. 2016; Mousavian et al. 2017; Ku, Pon, and Waslander 2019), LiDARs (Ku et al. 2018; Shi et al. 2020; Lang et al. 2019), and RaDARs (Zhou and Tuzel 2018; Shi, Wang, and Li 2019) are broadly used for this task, among which camera-based methods have drawn growing attention due to their lower cost.
According to the view that detection is conducted, camera-based 3D object detectors can be categorized into two major classes: Camera-View (CV) detectors and Bird’s-Eye-View (BEV) detectors. CV detectors, such as FCOS3D (Wang et al. 2021) and PGD (Wang et al. 2022), follow the design of 2D detectors, extend the detection head for 3D tasks. These methods often show inferior performance to BEV methods, according to the nuScenes leaderboard. However, since CV detectors directly detect objects on images, they can retain a fully convolutional structure just like 2D detectors. This character makes them deploy-friendly and thus popular in the industry.
In contrast, detecting 3D objects in BEV (Reading et al. 2021; Huang et al. 2021; Huang and Huang 2022) is a new paradigm designed for 3D scenarios, showing excellent performance in 3D tasks. To conduct detection in BEV space, they use a view transforming stage that transforms features from Camera-View into Bird’s-Eye-View. An extended 2D detecting head (Yin, Zhou, and Krahenbuhl 2021) is then applied to the transformed BEV features. Among existing transforming methods, Lift-Splat (Philion and Fidler 2020) based methods have drawn growing attention due to their high efficiency and efficacy. The Lift-Splat-based (Philion and Fidler 2020) methods transform views in three steps: 1) Projecting 2D image features to 3D space using estimated depth. This step produces a 3D representation that allows one to view features from BEV. 2) Aligning 3D image features to pre-defined BEV grids/anchors. These anchors are often distributed regularly (i.e., uniformly) in space. Since the 3D representation carries perspective distortion derived from perspective images, this step adopts feature sampling operation to align features with the BEV anchors and remove the distortion. 3) Collapse the 3D feature along height dimension to obtain the 2D BEV feature. While other steps in the Lift-Splat transformation show a simple pipeline, the second step adopts the feature sampling operator that can not be deployed or accelerated on many devices, being the major impediment to making BEV detectors feasible in industrial scenarios. This situation makes us wonder: Can we enjoy the benefits of the BEV paradigm while retaining a simple pipeline?
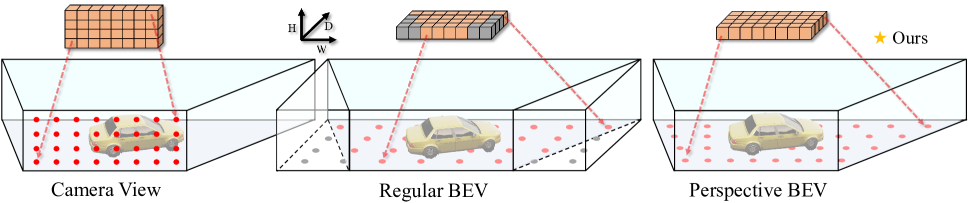
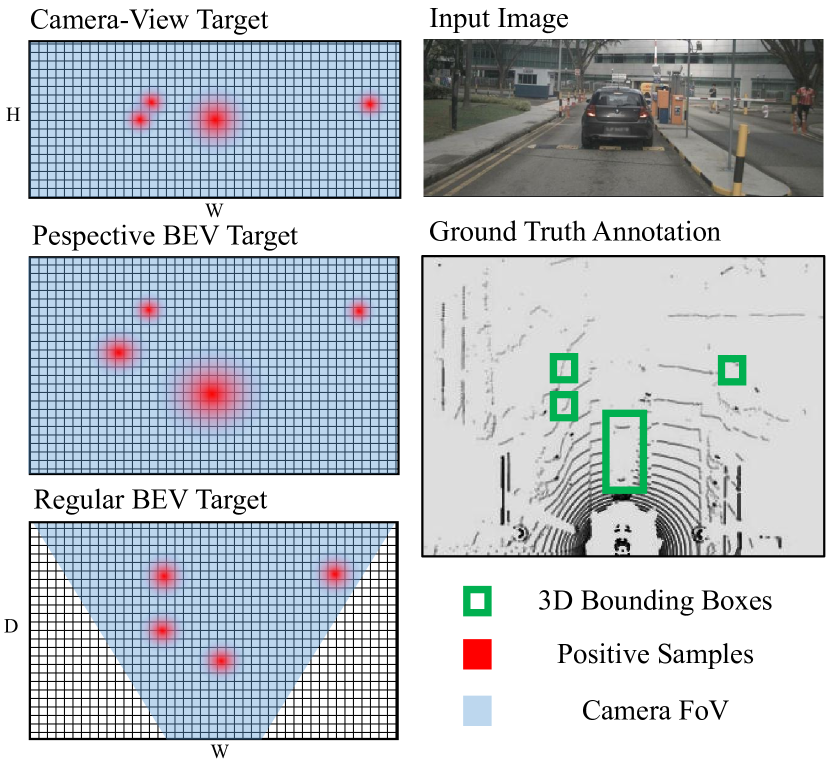
To answer this question, we delve into the details of the alignment between features and anchors. As demonstrated in Fig. 1, CV detectors lay anchors in the image plain along the height and width axes. These anchors are naturally aligned to the down-sampled feature map extracted from the image. In contrast, the anchors of BEV detectors distribute among the width and depth axes since the semantics of the BEV feature correspond to objects on the horizontal reference plane. Since the Lift-Splat method is initially designed for segmentation tasks, these anchors conventionally distribute uniformly on the reference plane (Philion and Fidler 2020). Such distribution introduces the requirement of feature sampling — the perspective effect is carried in the projected feature but not in the anchors. In this paper, we propose introducing the perspective effect to the anchors rather than removing it from the features. In that case, the semantic information can be aligned with real-world anchors without feature sampling. Furthermore, since the feature sampling operations in existing methods often accompany by information loss and structural distortion (see Fig. 3) caused by over-sampling and under-sampling phenomena, the removal of feature sampling results in extra performance gains.
With this improvement, we build a high-performance detector that directly conducts detection on perspective BEV features — PersDet. Concretely, we first project image features into the perspective BEV space following a Lift-Splat (Philion and Fidler 2020) like pattern. Then, instead of sampling the features, we directly collapse this 3D representation and put our PersHead onto the BEV features with perspective distortion. The PersHead deploys anchors for regression in the perspective space, where anchors are sparse in the remote area and dense on the contrary. In that case, the feature produced by outer production is naturally aligned to anchors.
We conclude our contributions as follows:
-
1.
We show the drawbacks of feature sampling and propose perspective BEV to avoid this process.
-
2.
We propose PersDet, which performs object detection on perspective BEV features, validating the effectiveness of perspective BEV features.
-
3.
The proposed PersDet achieved state-of-the-art performance on the nuScenes benchmark while showing the advantage of being deploy-friendly.
2 Related Works
2.1 Camera-View 3D Object Detection
Image data is the most convenient and economical to obtain among data forms in autonomous driving and robotics. Image-based 3D object detectors use image data and associated camera parameters as input to detect objects within the image range and predict their 3D bounding boxes. Camera-View detectors like FCOS3D (Wang et al. 2021) and PGD (Wang et al. 2022), inspired by 2D object detector FCOS (Tian et al. 2019), extend the FCOS detection head for extra bounding box attributes and depth prediction. These detectors retain a fully convolutional structure and show fair performance on several benchmarks (Geiger et al. 2015; Caesar et al. 2020) but have the problem of perceiving target translation. SS3D (Jörgensen, Zach, and Kahl 2019) proposes a single-stage monocular 3D object detector that produces a redundant representation of each relevant object in the image together with uncertainty estimations. MonoDIS (Simonelli et al. 2019) presents decoupled regression losses to better multi-task training. Our work, using a single image as input, differs from previous work that extracts features on the image view. We project the features onto the BEV space and perform 3D object detection on the BEV space. PGD propose using geometric constraints and depth probabilities to improve depth estimation accuracy base on FCOS3D. It considerably reduces the depth estimation problem while increasing the compute budget and inference delay.
2.2 BEV Representation
The Bird’s Eye View (BEV) representation was firstly proposed for segmentation task (Pan et al. 2020; Roddick and Cipolla 2020; Philion and Fidler 2020) in 3D scenarios, in which models aim to predict surrounding maps from images. These models use an image encoder to obtain the image feature and then apply view-transformation to get the BEV feature. The transformation can be implemented by data-driven methods or depth-based methods.
Among data-driven methods, VPN (Pan et al. 2020) uses MLP to transform flatten CV features into BEV features. PON (Roddick and Cipolla 2020) uses column-wise (rather than image-wise) MLP to perform transformation on each direction. These methods efficiently implement transformation but perform poorly in detection and segmentation tasks.
For depth-based methods, they often outer product the image feature and categorical depth distribution to obtain BEV features. OFT (Roddick, Kendall, and Cipolla 2018) uses a uniformly distributed depth to perform projection. LSS (Philion and Fidler 2020) predicts categorical depth distribution in an unsupervised way, using 3D bounding boxes for implicit depth supervision. CaDDN (Reading et al. 2021) introduces depth supervision from LiDAR to obtain high-quality depth prediction. These methods efficiently generate high-quality BEV features, but they all apply feature sampling methods like grid sampling (Reading et al. 2021) or voxel pooling (Li et al. 2022) on the projected BEV feature to obtain a non-perspective BEV feature. That is because previous works generate BEV features for segmentation tasks, where a canonical feature is required. This operation becomes the major impediment to deploying and accelerating these models.
2.3 BEV 3D Object Detection
Based on LSS, BEVDet (Huang et al. 2021) introduces the detection head to the generated BEV feature and implements object detection in BEV space. Unlike BEVDet, CaDDN (Reading et al. 2021) generates a BEV feature map for each camera rather than a single BEV feature for each scene. BEVDepth (Li et al. 2022) introduces depth supervision based on BEVDet. This work also proposes an individual DepthNet for better depth prediction. BEVDet4D (Huang and Huang 2022) propose concatenating multi-frame BEV features to predict object velocity better.
This work explores the detection capability of the “uncorrected” BEV feature. By implementing object detection on the perspective BEV feature, we eliminate any complex operation and propose a fully convolutional BEV detector.
3 PersDet
In this section, we first introduce the pipeline of existing monocular BEV detectors in Sec 3.1. Then, in Sec. 3.2 we analyze the disadvantages of feature sampling adopted in existing methods. To overcome these problems, we propose PersDet as our solution in the remaining part, detailed information, including structural design and learning target design, is introduced.
3.1 BEV Detection Framework
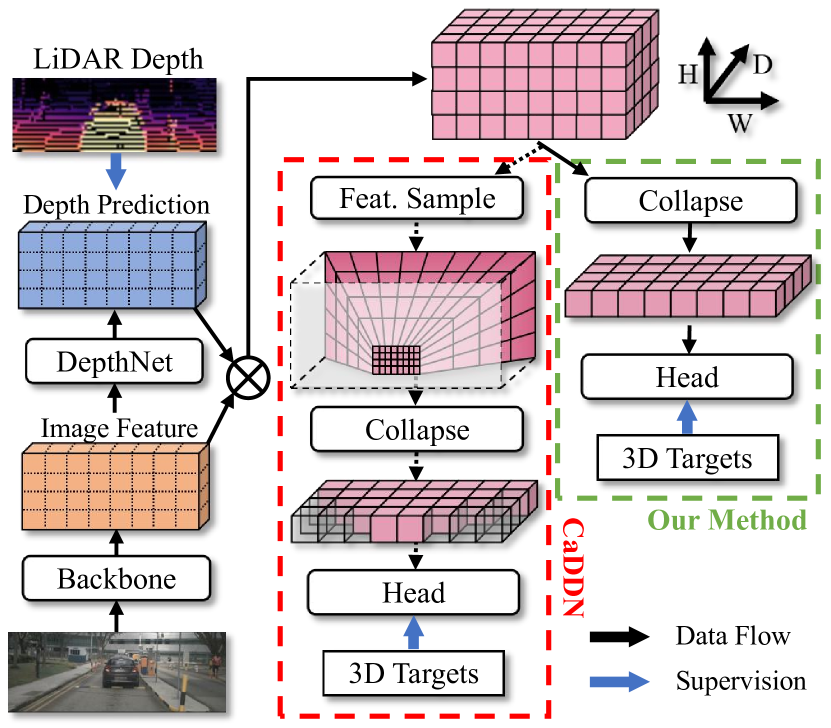
Existing BEV detectors represented by CaDDN (Reading et al. 2021) follow a Lift-splat pattern, in which a feature extractor and a DepthNet are adopted for feature extraction and depth prediction. The depth prediction is individually supervised by the ground truth depth obtained by LiDAR. Note that the LiDAR depth is only utilized during training; the detector takes only images for testing and validation. As illustrated in Fig. 2, the BEV detection framework performs uniformed training using both 3D bounding boxes and depth supervision. The overall loss of PersDet is defined as:
| (1) |
where is the detection loss, and is the depth loss and its weight.
With the extracted image features and depths , the projection is performed by doing the outer product of these tensors. Traditionally, the generated 3D features is then sampled or pooled to align with regular anchors and remove the perspective effect. A CollapseConv is used after feature sampling to obtain the 2D BEV feature representation :
| (2) |
| (3) |
| (4) |
However, in the below section, we show that the feature sampling operation can bring several disadvantages and thus be sub-optimal.
3.2 Disadvantages of Feature Sampling
In this section, we analyze the behavior of feature sampling. We take CaDDN as a representative monocular BEV detector, which adopt Grid Sampling to align BEV feature.
Over-Sampling and Under-Sampling
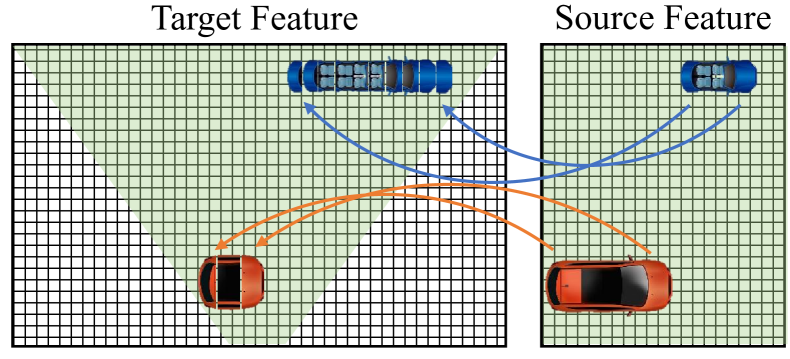
The Grid Sampling (Reading et al. 2021) operation samples features based on spatial coordinate information and pre-defined grids (anchors). The anchors’ setting has a decisive impact on the performance and efficiency of this process. As illustrated in Fig. 3, when giving a dense anchor distribution, the problem of over-sampling could result in duplicated feature representation. The over-sampling phenomenon will cause a waste of memory and deterioration of structural integrity. In contrast, a sparse distribution could cause an under-sampling problem where some source features are not sampled, resulting in information loss. Worse still, the over-sampling and the under-sampling problem can not be solved entirely since they always occur simultaneously. Because the perspective camera FOV has different widths at different depths (wide in the distance and narrow on the contrary), there is always an under-sampling problem in the near field and an over-sampling problem at a distance. The best performance obtained by adjusting the hyper-parameter is only a trade-off. Therefore, the deterioration of features is inevitable once feature sampling is adopted.
Memory Inefficiency
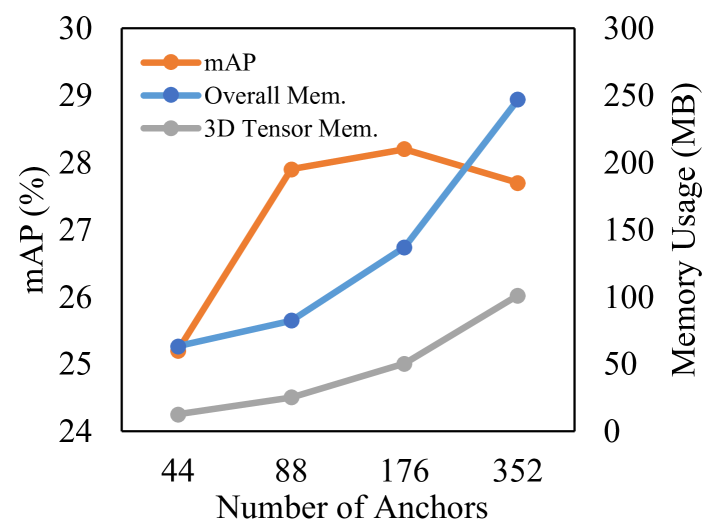
The irregular camera Field Of View (FOV, the green region in Fig. 3) causes the memory inefficiency of the regular BEV feature. Since computing devices store and calculate data in the form of matrices, and the FOV of the camera is a frustum, there is a large portion of the memory area that does not contain valid information. Such inefficiency leads to a dramatic increase in the size of the 3D tensor, accompanied by significant memory waste. In Fig. 4 we present the performance and memory consumption of the CaDDN detector under different anchor densities on the X-axis (horizontal axis of images). It shows that the memory consumption of the 3D tensor grows quadratically with increasing anchor density and leads to increasing overall memory consumption. When the number of anchors increases to 176, the under-sampling problem is alleviated, allowing an adequate performance. However, the expansion of the 3D tensor has doubled the overall memory consumption of the detector. In other words, to get a suitable performance, the feature sampling operation could significantly increase the memory consumption of detectors, leading to higher model application costs.
Troublesome Operator
As mentioned in the above sections, the feature sampling uses custom operations like Grid Sampling or Voxel Pooling (Li et al. 2022). These operations can be deployed and accelerated by employing custom operators on flexible platforms represented by CUDA. However, there are also many other platforms on edge devices where a such complex operator can not be performed or accelerated. Therefore, the advantages of the BEV detector cannot be enjoyed by many low-end scenes due to the feature sampling.
Considering the above shortcomes of feature sampling, we explore performing detection directly on projected BEV features where the perspective effect has not been removed. The PersHead, as the solution to the above problems, is proposed for simple and high-performance object detection.
3.3 Object Detection in Pespective BEV Space
Anchors and Targets
We design the perspective anchors to align with the perspective BEV features. Specifically, we apply inverse projection to the uniformly distributed frustum anchors to obtain anchors in real-world coordinates. Giving frustum anchors , the inverse projection is applied as:
| (5) |
where is the camera intrinsic matrix. After this inverse projection, the distribution of perspective anchors is sparse in the distance and dense on the contrary. Since these anchor points contain a perspective effect, corresponding changes are required for the heatmap target (i.e., objectness score targets). As shown in Fig. 5, the perspective effect is introduced to the target to align with perspective features.
PersHead
We design the PersHead following the CenterPoint head (Yin, Zhou, and Krahenbuhl 2021), using task-specific branches for classification and regression. Giving BEV feature produced by the Lift-Splat module, the PersHead performs shared convolution on the BEV feature and makes predictions using task-specific sub-nets in a dense form. For each grid of the BEV feature , the PersHead predicts its objectness score and bounding box attributes including center offsets, center height, box size, box local yaw (Wang et al. 2021), direction category, and velocity. The overall detection loss is calculated as:
| (6) |
where is the objectness score target and is the attributes of boundingbox on each grid.
Finally, with the predicted box attributes, the real coordinates of the box center can be obtained by adding the center offsets to the coordinates of corresponding anchors.
| Methods | Image Size | mAP | mATE | mASE | mAOE | mAVE | mAAE | NDS |
|---|---|---|---|---|---|---|---|---|
| CaDDN (Reading et al. 2021) | 0.294 | 0.702 | 0.283 | 0.579 | 0.988 | 0.222 | 0.370 | |
| BEVDet§ (Huang et al. 2021) | 0.298 | 0.725 | 0.279 | 0.589 | 0.860 | 0.245 | 0.379 | |
| PersDet | 0.319 | 0.676 | 0.284 | 0.589 | 0.924 | 0.229 | 0.389 | |
| FCOS3D* (Wang et al. 2021) | 0.288 | 0.777 | 0.266 | 0.544 | 1.228 | 0.170 | 0.368 | |
| PGD* (Wang et al. 2022) | 0.320 | 0.735 | 0.266 | 0.492 | 1.114 | 0.170 | 0.394 | |
| PersDet | 0.346 | 0.660 | 0.279 | 0.540 | 0.964 | 0.207 | 0.408 |
4 Experiments
4.1 Implementation Details
Dataset
We conduct experiments on the nuScenes (Caesar et al. 2020) dataset, which is a challenging autonomous driving benchmark. For the detection task, 1.4M annotated bounding boxes from nuScenes are categorized into six meta-classes (tasks) and ten classes. Following previous works (Huang et al. 2021; Li et al. 2022), we only detect and evaluate objects within 58 meters. We report the evaluation metrics defined in the official nuScenes API, including mAP, ATE, ASE, AOE, AVE, AAE, and the NuScenes Detection Score (NDS). We mainly focus on the mAP and the NDS metrics for monocular detection. The mAP is evaluated as the 2D mAP on the ground plane. The NDS is a reweighted combination of other metrics, indicating an overall detecting capability.
Training Settings
Our experiments are implemented on PyTorch (Paszke et al. 2019) with CUDA acceleration. If not otherwise specified, we use ResNet-50 (He et al. 2016) as our backbone, and a SECOND FPN (Yan, Mao, and Li 2018) is adopted to merge multi-level image features. Following BEV detectors that report performances on nuScenes (Huang et al. 2021; Li et al. 2022), most of our experiments were performed under resolution with batchsize 8 ( images for six images per sample). Data augmentation, including RandomFlip, Random Rotate, Random Scaling, and Random Cropping as in BEVDepth (Li et al. 2022) are used. We train our models on the nuScenes dataset for 24 epochs, using learning rate 2e-4, depth weight 3, and EMA strategy. When comparing with other methods on nuScenes, CBGS (Zhu et al. 2019) is adopted.
Reproduction of CaDDN
In order to conduct a fair comparison, we reproduce CaDDN (Reading et al. 2021) on our code base. We align the backbone, FPN, task-specific head, image feature size, and the training setting of the reproduced CaDDN and our model. For the new nuScenes dataset, we use the voxel grid range (m) and voxel grid size (m) since our feature down-sample rate is 16.
4.2 Comparison with State-of-the-Arts
We compare our method with both monocular and multi-ocular detectors since they adopt a similar pipeline. For multi-ocular detectors, BEVDet (Huang et al. 2021) is taken as a representative method. As demonstrated in Tab. 1, PersDet outperforms existing monocular detectors with significant advantages. Besides, thanks to the explicit modeling of depth and depth supervision, PersDet shows a greater performance over the multi-ocular detector — BEVDet by a margin of 2.2% mAP. When giving high-resolution images as input to compare with FCOS3D (Wang et al. 2021) and PGD (Wang et al. 2022), PersDet also shows better performance even when taking images of lower resolution (for simplicity, we scale the inputs by an integer multiple).
| View | Depth / Depth Sup. | Feat. Sample | Feat. Size | mAP | mATE | mASE | mAOE | mAVE | mAAE | NDS |
|---|---|---|---|---|---|---|---|---|---|---|
| CV | bboxes | - | 0.189 | 0.925 | 0.293 | 0.636 | 1.056 | 0.269 | 0.282 | |
| BEV | bboxes & LiDAR | GS | 0.252 | 0.838 | 0.295 | 0.708 | 1.087 | 0.269 | 0.315 | |
| BEV | bboxes & LiDAR | GS | 0.276 | 0.758 | 0.290 | 0.658 | 1.042 | 0.260 | 0.341 | |
| BEV | bboxes & LiDAR | VP | 0.245 | 0.914 | 0.302 | 0.695 | 0.992 | 0.268 | 0.306 | |
| BEV | bboxes & LiDAR | VP | 0.275 | 0.766 | 0.293 | 0.657 | 1.075 | 0.257 | 0.340 | |
| BEV | bboxes & LiDAR | 0.300 | 0.735 | 0.296 | 0.678 | 1.104 | 0.312 | 0.348 | ||
| BEV | bboxes | 0.290 | 0.795 | 0.289 | 0.685 | 1.068 | 0.293 | 0.339 | ||
| BEV | static random | 0.249 | 0.849 | 0.293 | 0.722 | 1.100 | 0.325 | 0.306 | ||
| BEV | uniform | 0.052 | 0.908 | 0.306 | 0.739 | 1.099 | 0.323 | 0.200 |
4.3 Boosts of BEV Feature
In order to sort out the boost of PersDet from the BEV paradigm, we conduct a series of experiments to compare detectors with different feature distributions. We use detectors with the same backbone, same FPN, and same head structure to fairly compare the impact of feature distribution. For the Camera-View detector, we remove the view transformer and let the detector predict object depth using an individual branch.
Features on Depth Dimension
To demonstrate the effect of feature distribution, we first replace the categorical depth prediction of PersDet with a random tensor (static during training and evaluation) to remove the boost of any depth information. Image features are projected into BEV space with random intensity with the static random depth distribution. In this case, the PersDet decreased 4.1% mAP, still showing a gap of 5% mAP with its CV counterpart. We then set the categorical depth of PersDet to uniformly 1. Since the BEV feature is the very same at any depth, the feature distribution along the depth dimension is counterbalanced. Under this setting, the PersDet shows really poor performance and gets to 5.2% mAP, even lower than the CV detector. These results show that the BEV detector obtains most of the performance boost by distributing features along the depth dimension. Since the mAP metric in autonomous driving does not require precise height, the locating ability of detectors is dependent on horizontal and depth-wise perception. By modeling depth positions and horizontal positions into a unified heatmap, BEV detectors learn to locate objects in an end-to-end pattern, thus leading to better performance.
Precise Depth Prediction
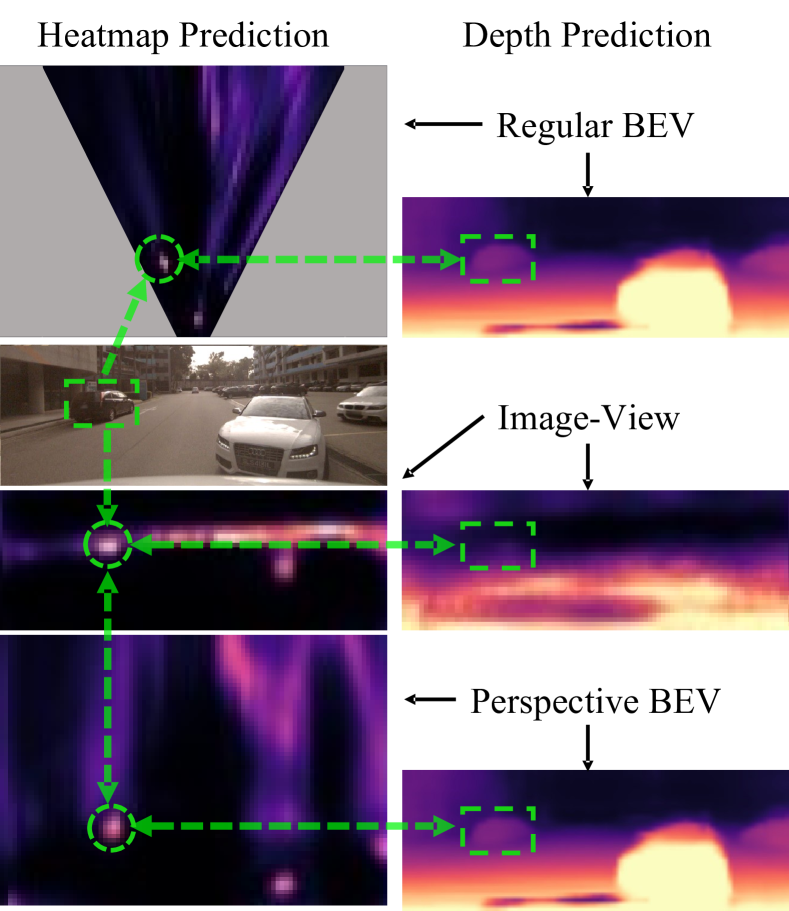
We also note that the differences between the CV and BEV detectors are mainly represented in the ATE (Average Transition Error) and mAP metrics. Considering the fancy performance of CV detectors in 2D tasks, it is fair to attribute such low performance to imprecise depth. While the CV detector predicts object depth using an individual branch, the BEV representation transforms the depth prediction from a regression task into a classification task, learning depth in a joint pattern. Such a joint training scheme enables the detector to produce depth fit for the detection task. Furthermore, the experimental results show that the extra depth supervision during training could boost 1% mAP and 1% NDS. The improvement of depth prediction can also be seen in the depth prediction visualization (see right of Fig. 6), in which BEV detectors clearly address the target car in depth prediction, while the CV detector fails to sort out the car from the background.
4.4 Information Loss of Feature Sampling
As stated in Sec. 3.2, the performance of CaDDN is affected by voxel-grid resolution due to under-sample and over-sample problems. In Sec. 4.2, we follow the original implementation of CaDDN, use fixed grid size and obtains a feature size (widthdepth) of . In this section, we scale this feature to a different shape to demonstrate its effect on performance. It can be seen from Tab. 2 and Tab. 3 that as the density of the sample grid increases, the model performance firstly shows an observable boost. However, when the sampling grid is too dense, the detector performance shows a significant drop. This phenomenon validates our under-sampling and over-sampling analysis, indicating that feature sampling methods are sensitive to this hyper-parameter, bringing extra obstacles when transplanting the model to a new area.
Furthermore, even when CaDDN obtains the best performance, there is still a significant performance drop caused by feature sampling. As seen in Tab. 2 and Tab. 3, the PersDet shows a boost of 1.4% mAP compared with the best performance of CaDDN. We attribute this gain to the efficient and high-quality perspective BEV features.
4.5 Latency Improvements
 |
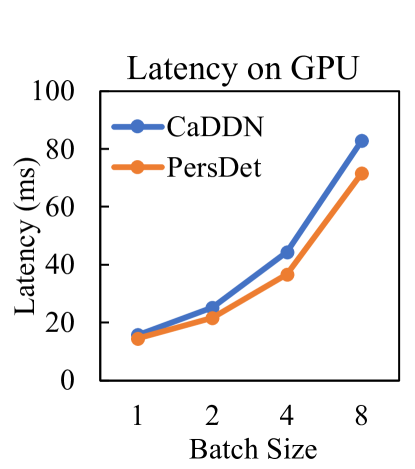 |
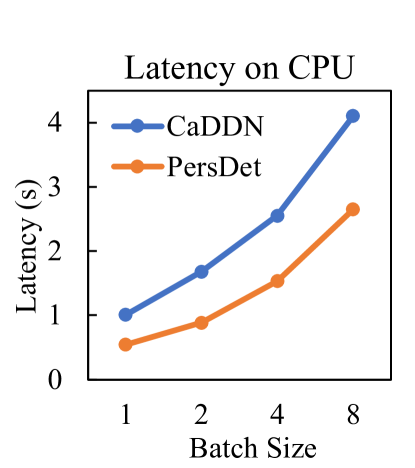
By removing the feature sampling, PersDet improves its inference speed by a large margin. We measure the inference speed on GPU with CUDA acceleration and CPU without any acceleration in Fig. 7. The CaDDN takes a sampling density of , the same as the source feature. The latency data indicate that PersDet has a significant advantage in speed over methods using Grid Sampling (Reading et al. 2021). On CPU platforms without custom operators (like the case of edge devices), the latency of PersDet is reduced by 46% for a single image (batch 1). Although CUDA accelerates the feature sampling on the GPU platform, the latency still decreased by 14%.
These results show that the pipeline of PersDet brings notable acceleration for the detector, making it suit for edge devices.
4.6 Efficient BEV Representation
| Density | mAP | mATE | NDS | Mem. (MB) |
|---|---|---|---|---|
| 0.254 | 0.841 | 0.318 | 61 | |
| 0.281 | 0.768 | 0.336 | 83 | |
| 0.286 | 0.759 | 0.341 | 137 | |
| 0.277 | 0.758 | 0.342 | 247 |
According to Tab. 3, when the CaDDN detector achieves its best performance, it takes twice as much memory as PersDet needs. This colossal memory consumption is caused by inefficient representation. As shown in Fig. 6, the regular BEV feature leaves a large portion of space as “invalid”. The existence of these areas limited the space for valuable information. In that case, larger overall memory space is required for the same amount of information. This observation indicates that the perspective BEV space enjoys the benefit of memory efficiency; thus, the PersDet achieves better performance while requiring less memory space.
4.7 Ablation Study
| L.Y. | Dir.Cls. | mAP | mAOE | mAAE | NDS |
|---|---|---|---|---|---|
| 0.309 | 0.809 | 0.337 | 0.339 | ||
| 0.298 | 0.805 | 0.282 | 0.336 | ||
| 0.300 | 0.678 | 0.312 | 0.348 |
Local Yaw and Categorical Direction
In PersHead, we use local yaw and categorical direction derived from FCOS3D (Wang et al. 2021) to predict the yaw angle of objects. We show the different performances of the head under several settings in Tab. 4. As can be seen in the table, the categorical direction reduces the Average Attribute Error (mAAE). This indicates that categorical direction also helps the model to classify objects better. When changing the yaw angle target to local yaw, the Average Orientation Error (mAOE) is further improved since the local yaw exactly corresponds to the image pattern.
| DepthBins | mAP | mATE | mAOE | mAAE | NDS |
|---|---|---|---|---|---|
| 14 | 0.272 | 0.823 | 0.645 | 0.282 | 0.332 |
| 28 | 0.304 | 0.751 | 0.637 | 0.286 | 0.356 |
| 56 | 0.300 | 0.735 | 0.678 | 0.312 | 0.348 |
| 112 | 0.290 | 0.725 | 0.693 | 0.327 | 0.342 |
Number of Depth Categories
Since the partition density of depth affects the density of anchors, the granularity of the DepthNet, and the receptive field of a single BEV grid, we conduct experiments on this hyper-parameter. As the experimental results in Tab. 5 show, the model achieves the best mAP and NDS when dividing the depth into 28 bins. However, the Transition Error (mATE) increased by 1.6% compared with the 56 bins setting due to inaccurate depth prediction. When the partition becomes denser, a lower Transition Error is obtained at the cost of lower mAP. In that case, the division granularity of depth is a trade-off between two metrics.
5 Conclusion
In this paper, we analyze the BEV paradigm for 3D object detection and point out that the essential difference between BEV and Camera-View detectors is the distribution of features on the depth dimension. By revisiting the view-transformation procedure that generates BEV features, we propose PersDet, which performs object detection on perspective BEV features without feature sampling. We demonstrate that the PersDet solved problems caused by feature sampling in existing BEV detectors and achieved state-of-the-art performance among monocular 3D detectors. According to detailed results and ablation studies, our approach performs better than existing methods while being simpler and deploy-friendly for edge devices.
References
- Caesar et al. (2020) Caesar, H.; Bankiti, V.; Lang, A. H.; Vora, S.; Liong, V. E.; Xu, Q.; Krishnan, A.; Pan, Y.; Baldan, G.; and Beijbom, O. 2020. nuscenes: A multimodal dataset for autonomous driving. In Proceedings of the IEEE/CVF conference on computer vision and pattern recognition, 11621–11631.
- Chen et al. (2016) Chen, X.; Kundu, K.; Zhang, Z.; Ma, H.; Fidler, S.; and Urtasun, R. 2016. Monocular 3d object detection for autonomous driving. In Proceedings of the IEEE conference on computer vision and pattern recognition, 2147–2156.
- Geiger et al. (2015) Geiger, A.; Lenz, P.; Stiller, C.; and Urtasun, R. 2015. The KITTI vision benchmark suite. URL http://www. cvlibs. net/datasets/kitti, 2.
- He et al. (2016) He, K.; Zhang, X.; Ren, S.; and Sun, J. 2016. Deep residual learning for image recognition. In Proceedings of the IEEE conference on computer vision and pattern recognition, 770–778.
- Huang and Huang (2022) Huang, J.; and Huang, G. 2022. Bevdet4d: Exploit temporal cues in multi-camera 3d object detection. arXiv preprint arXiv:2203.17054.
- Huang et al. (2021) Huang, J.; Huang, G.; Zhu, Z.; and Du, D. 2021. Bevdet: High-performance multi-camera 3d object detection in bird-eye-view. arXiv preprint arXiv:2112.11790.
- Jörgensen, Zach, and Kahl (2019) Jörgensen, E.; Zach, C.; and Kahl, F. 2019. Monocular 3d object detection and box fitting trained end-to-end using intersection-over-union loss. arXiv preprint arXiv:1906.08070.
- Ku et al. (2018) Ku, J.; Mozifian, M.; Lee, J.; Harakeh, A.; and Waslander, S. L. 2018. Joint 3d proposal generation and object detection from view aggregation. In 2018 IEEE/RSJ International Conference on Intelligent Robots and Systems (IROS), 1–8. IEEE.
- Ku, Pon, and Waslander (2019) Ku, J.; Pon, A. D.; and Waslander, S. L. 2019. Monocular 3d object detection leveraging accurate proposals and shape reconstruction. In Proceedings of the IEEE/CVF conference on computer vision and pattern recognition, 11867–11876.
- Lang et al. (2019) Lang, A. H.; Vora, S.; Caesar, H.; Zhou, L.; Yang, J.; and Beijbom, O. 2019. Pointpillars: Fast encoders for object detection from point clouds. In Proceedings of the IEEE/CVF conference on computer vision and pattern recognition, 12697–12705.
- Li et al. (2022) Li, Y.; Ge, Z.; Yu, G.; Yang, J.; Wang, Z.; Shi, Y.; Sun, J.; and Li, Z. 2022. BEVDepth: Acquisition of Reliable Depth for Multi-view 3D Object Detection. arXiv preprint arXiv:2206.10092.
- Mousavian et al. (2017) Mousavian, A.; Anguelov, D.; Flynn, J.; and Kosecka, J. 2017. 3d bounding box estimation using deep learning and geometry. In Proceedings of the IEEE conference on Computer Vision and Pattern Recognition, 7074–7082.
- Pan et al. (2020) Pan, B.; Sun, J.; Leung, H. Y. T.; Andonian, A.; and Zhou, B. 2020. Cross-view semantic segmentation for sensing surroundings. IEEE Robotics and Automation Letters, 5(3): 4867–4873.
- Paszke et al. (2019) Paszke, A.; Gross, S.; Massa, F.; Lerer, A.; Bradbury, J.; Chanan, G.; Killeen, T.; Lin, Z.; Gimelshein, N.; Antiga, L.; et al. 2019. Pytorch: An imperative style, high-performance deep learning library. Advances in neural information processing systems, 32.
- Philion and Fidler (2020) Philion, J.; and Fidler, S. 2020. Lift, splat, shoot: Encoding images from arbitrary camera rigs by implicitly unprojecting to 3d. In European Conference on Computer Vision, 194–210. Springer.
- Reading et al. (2021) Reading, C.; Harakeh, A.; Chae, J.; and Waslander, S. L. 2021. Categorical depth distribution network for monocular 3d object detection. In Proceedings of the IEEE/CVF Conference on Computer Vision and Pattern Recognition, 8555–8564.
- Roddick and Cipolla (2020) Roddick, T.; and Cipolla, R. 2020. Predicting semantic map representations from images using pyramid occupancy networks. In Proceedings of the IEEE/CVF Conference on Computer Vision and Pattern Recognition, 11138–11147.
- Roddick, Kendall, and Cipolla (2018) Roddick, T.; Kendall, A.; and Cipolla, R. 2018. Orthographic feature transform for monocular 3d object detection. arXiv preprint arXiv:1811.08188.
- Shi et al. (2020) Shi, S.; Guo, C.; Jiang, L.; Wang, Z.; Shi, J.; Wang, X.; and Li, H. 2020. Pv-rcnn: Point-voxel feature set abstraction for 3d object detection. In Proceedings of the IEEE/CVF Conference on Computer Vision and Pattern Recognition, 10529–10538.
- Shi, Wang, and Li (2019) Shi, S.; Wang, X.; and Li, H. 2019. Pointrcnn: 3d object proposal generation and detection from point cloud. In Proceedings of the IEEE/CVF conference on computer vision and pattern recognition, 770–779.
- Simonelli et al. (2019) Simonelli, A.; Bulo, S. R.; Porzi, L.; López-Antequera, M.; and Kontschieder, P. 2019. Disentangling monocular 3d object detection. In Proceedings of the IEEE/CVF International Conference on Computer Vision, 1991–1999.
- Tian et al. (2019) Tian, Z.; Shen, C.; Chen, H.; and He, T. 2019. Fcos: Fully convolutional one-stage object detection. In Proceedings of the IEEE/CVF international conference on computer vision, 9627–9636.
- Wang et al. (2022) Wang, T.; Xinge, Z.; Pang, J.; and Lin, D. 2022. Probabilistic and geometric depth: Detecting objects in perspective. In Conference on Robot Learning, 1475–1485. PMLR.
- Wang et al. (2021) Wang, T.; Zhu, X.; Pang, J.; and Lin, D. 2021. Fcos3d: Fully convolutional one-stage monocular 3d object detection. In Proceedings of the IEEE/CVF International Conference on Computer Vision, 913–922.
- Yan, Mao, and Li (2018) Yan, Y.; Mao, Y.; and Li, B. 2018. Second: Sparsely embedded convolutional detection. Sensors, 18(10): 3337.
- Yin, Zhou, and Krahenbuhl (2021) Yin, T.; Zhou, X.; and Krahenbuhl, P. 2021. Center-based 3d object detection and tracking. In Proceedings of the IEEE/CVF conference on computer vision and pattern recognition, 11784–11793.
- Zhou and Tuzel (2018) Zhou, Y.; and Tuzel, O. 2018. Voxelnet: End-to-end learning for point cloud based 3d object detection. In Proceedings of the IEEE conference on computer vision and pattern recognition, 4490–4499.
- Zhu et al. (2019) Zhu, B.; Jiang, Z.; Zhou, X.; Li, Z.; and Yu, G. 2019. Class-balanced grouping and sampling for point cloud 3d object detection. arXiv preprint arXiv:1908.09492.