Towards Spatio-Temporal Cross-Platform Graph Embedding Fusion for Urban Traffic Flow Prediction
Abstract.
In this paper, we have proposed STC-GEF, a novel Spatio-Temporal Cross-platform Graph Embedding Fusion approach for the urban traffic flow prediction. We have designed a spatial embedding module based on graph convolutional networks (GCN) to extract the complex spatial features within the traffic flow data. Furthermore, to capture the temporal dependencies between the traffic flow data from various time intervals, we have designed a temporal embedding module based on recurrent neural networks. Based on the observations that different transportation platforms’ trip data (e.g., taxis, Uber, and Lyft) can be correlated, we have designed an effective fusion mechanism that combines the trip data from different transportation platforms and further uses them for cross-platform traffic flow prediction (e.g., integrating taxis and ride-sharing platforms for taxi traffic flow prediction). We have conducted extensive real-world experimental studies based on real-world trip data of yellow taxis and ride-sharing (Lyft) from New York City (NYC), and validated the accuracy and effectiveness of STC-GEF in fusing different transportation platform data and predicting traffic flows.
1. Introduction
Urban traffic prediction for transportation platforms such as taxis, ride-sharing, as well as other public/private vehicles has attracted much attention recently due to the important social and business values (tra, 2019; Alexander and González, 2015; Tabatabaie et al., 2022, 2021). With urban traffic prediction and emerging big mobility data, various ubiquitous and urban computing applications have been enabled or strengthened, including vehicle routing (Santos et al., 2018), event monitoring (Kaiser et al., 2017), and autonomous driving. However, two major technical challenges remain when deploying a large-scale data-driven traffic prediction system:
-
•
Dynamic and complex mobility activity/usage patterns in different regions: To predict the traffic flow in a future time interval, one may use the historical traffic flow data to calculate spatial and temporal features. However, there exist various types of traffic patterns in the historical data and designing a model to effectively capture the most critical and related ones based on different conditions is highly challenging.
-
•
Absence of cross-platform mobility data fusion: The traffic flow is highly correlated to different transportation platforms such as bike sharing or ride-sharing systems (e.g., Lyft and Uber). Therefore, to have an accurate prediction of the traffic flow, such correlation must be identified and effectively taken into account, which is a challenging task.
To address the above challenges, we propose STC-GEF, the novel Spatio-Temporal Cross-platform Graph Embedding Fusion approach for the urban taxi flow prediction. In this prototype study, we have made the following three major contributions:
-
(1)
Spatial and Temporal Graph Embedding Learning: To extract the complex spatial features within traffic flow data, we propose a spatial embedding module based on graph convolutional networks (GCN). Additionally, to capture the temporal dependencies between the traffic flow data from various time intervals, we leverage a temporal embedding module based on recurrent neural networks.
-
(2)
Cross-platform Mobility Data Fusion: Based on our data analysis, we have identified that different transportation platforms’ trip data (e.g., taxis, Uber, and Lyft) may be highly correlated. Therefore, we have proposed an effective fusion mechanism that combines the trip data from different transportation platforms and further uses them for cross-platform traffic flow prediction. In particular, in the preliminary studies, we leverage historical taxi and Lyft trip data to predict the future traffic flow of the taxis in NYC.
-
(3)
Extensive Experimental Evaluations: We have performed data analytics and experimental studies on two public real-world datasets to evaluate the effectiveness of our STC-GEF. Specifically, we have studied a total of 4,464,090 yellow taxi and Lyft trip records provided by the NYC’s open data program (nyc, 2022b; tlc, 2022) and shown that our proposed framework outperforms the baseline methods for traffic flow prediction.
The rest of our paper is organized as follows. We first review some of the previous studies for traffic flow prediction in Sec. 2. Then, we present an overview of our framework in Sec. 3 followed by dataset details, problem formulation, and framework designs in Sec. 4. We demonstrate our experimental studies in Sec. 5, and finally conclude our work in Sec. 6.
2. Related Works
We briefly go through the related studies as follows. Various traditional time series forecasting methods have been explored for traffic flow prediction. Chen et al. (Chen et al., 2011) leveraged the auto-regressive integrated moving average for traffic prediction. On the other hand, Kumar et al. (Kumar, 2017) designed a Kalman Filter to forecast the traffic flow. Dong et al. (Dong et al., 2018) used the Gradient Boosting Decision Tree algorithm to perform short-term traffic flow prediction.
With the recent advances of big mobility data (Yang et al., 2021) and deep learning, many recent studies have proposed various network architectures based on convolutional neural networks (CNN), long short-term memory (LSTM) or residual neural networks (ResNet (He et al., 2016)) to perform traffic flow prediction. Zhang et al. (Zhang et al., 2017) proposed DeepST, a network based on CNN and ResNet modules to predict the crowd flow. Yang et al. (Yang et al., 2021) proposed a method based on graph neural networks and attention mechanism to predict the crowd inflow/outflow of different buildings. Zheng et al. (Zheng et al., 2020) converted the road network to a weighted graph and leveraged graph neural networks with attention mechanisms for traffic flow prediction. Likewise, Shi et al. (Shi et al., 2020) proposed a graph neural network with a novel attention mechanism that considers both long-term and short-term periodical dependencies. Pan et al. (Pan et al., 2020) proposed a framework based on graph neural networks, which is trained based on meta learning to predict the traffic flow for multiple locations at the same time. Zhang et al. (Zhang and Kabuka, 2018) combined the external factors such as weather conditions to better predict the traffic flow. Different from these prior studies, we propose a novel graph embedding approach that fuses the different transportation platforms to further enhance the prediction accuracy. We have designed a novel mobility data fusion approach and validated the performance with real-world transportation platform data.
3. Core Model Overview
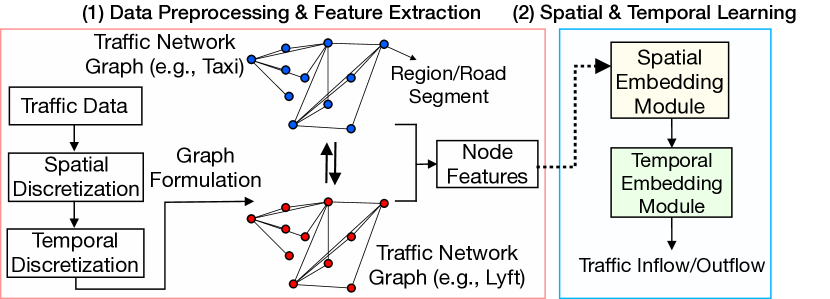
We present the overall workflow of our proposed framework in Fig. 1, which consists of two main stages as follows:
(1) Data Preprocessing and Feature Extraction: In the preprocessing stage, we first perform spatial discretization. Specifically, we use the same taxi regions specified by the NYC open data program (nyc, 2022b), which are visualized in (nyc, 2022a) to divide the target city into multiple regions. Moreover, each region is a polygon with its coordinates specified on the city map. Then, a unique number is assigned to each region, which is used to specify the pickup and drop-off location of the trips. Next, we perform temporal discretization by dividing each day into equal time intervals. Afterward, we convert the traffic data into multiple directed weighted graphs represented by adjacency matrices, in which the nodes represent the taxi regions and the edges are the traffic inflow/outflow between different regions. Finally, for each node, we calculate the sum of the traffic inflow and outflow from other regions and consider them as the node features.
(2) Spatial and Temporal Learning: After the preprocessing and feature extraction stage, we feed the extracted node features and graph adjacency matrices to the spatial embedding module that converts them into spatial embeddings. Then, the output of the spatial embedding module is further processed by the temporal embedding module to produce the final spatial and temporal embedding of the input graphs, which is used to predict the traffic inflow/outflow for the future time interval.
4. Datasets & Problem Definition
4.1. Overview of Datasets
Our datasets used in this paper are presented as follows.
4.2. Model Design Motivations
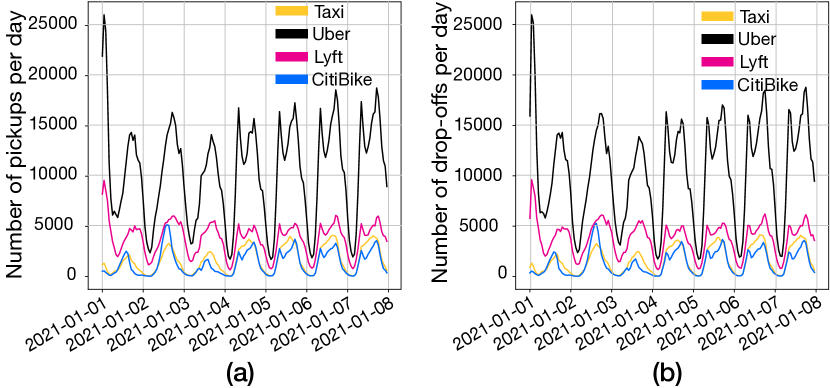
To support our motivations, we illustrate the pickup and drop-off data of different transportation platforms (i.e., Taxi (nyc, 2022b), Citi Bike (bik, 2022), Uber, and Lyft (tlc, 2022)) for a week in January 2021, which are accumulated for each day in Fig. 2. From the figures, we can observe that different transportation platforms have similar and correlated pickup (Fig. 2(a)) and drop-off (Fig. 2(b)) trends. Therefore, we are motivated to combine different traffic flow data from various transportation platforms to improve our model’s prediction accuracy.
4.3. Problem Formulation
As stated earlier, we formulate the traffic flow data as graphs to further use for future inflow/outflow predictions. Moreover, we consider each taxi region shown in (nyc, 2022a) as a node and calculate the number of the taxi/Lyft trips between them as the weight of their edges and form the adjacency matrices. We denote the adjacency matrices created for the taxi trips on the -th day and the -th time interval by , where is the number of the taxi regions (265 in this study). Similarly, we denote the adjacency matrices based on the Lyft trips for the -th day and the -th time interval by .
Taking the taxi trips as an example, given the adjacency matrices of the -th time interval in the -th day, we calculate the sum of the inflow and outflow trips to each node (i.e., region) and consider them as two node features. We denote the node features extracted from the taxi trips at -th time interval in the -th day by . Similarly, we denote the node features of the Lyft trips at the -th time interval in the -th day by , which are similarly calculated as mentioned above.
Given the historical adjacency matrices and node features of the taxi trip data for the time intervals prior to target time interval of the -th day, , , and the historical Lyft adjacency matrices and node features of the Lyft trip data for the target time interval -th of the -th day, , , the goal of STC-GEF is to predict the traffic inflow and outflow of the taxi regions for the the -th time interval of the -th day, . We note that since our target is to predict for a future -th time interval of the -th day, it would be impractical to assume the availability of the Lyft trip data for the exact same -th time interval in the -th day. Therefore, we consider the Lyft trip data of the same time period of a day before the target date, , as we observed that two consecutive days may exhibit correlations regarding their traffic inflow/outflow patterns (Fig. 2).
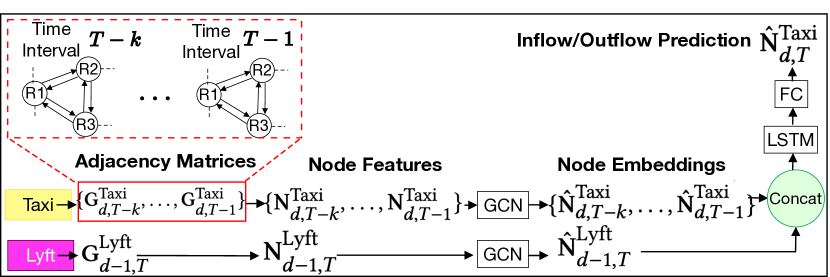
We present the overall architecture of STC-GEF in Fig. 3. In particular, it first inputs the historical adjacency matrices and node features of the taxi trip data from the time interval to of the -th day to the graph convolutional network (GCN) to produce the spatial node embeddings, . Similarly, the historical adjacency matrices and node features of the Lyft trip data in the -th time interval of the -th day are converted to spatial embeddings, . Next, the output spatial embedding is concatenated together and passed through the temporal embedding module to produce the spatial and temporal embeddings, which are finally processed by fully connected layers to generate the final traffic inflow/outflow prediction, , for the -th time interval of the -th day.
4.4. Spatial and Temporal Embedding Modules
The role of this module is to process the traffic flow graph adjacency matrices and node features and produce spatial embeddings. Specifically, given adjacency matrix , and node features , , we process them by graph convolutional network (GCN), followed by a Dropout layer (Goodfellow et al., 2016) for regularization and a fully connected layer (FC) to get the spatial node embeddings , i.e.,
| (1) |
The role of this module is to process the output of the spatial embedding module to produce spatial and temporal embeddings. In particular, given spatial taxi node embeddings in time interval to , of the -th day and the spatial Lyft node embeddings in -th time interval of the -th day, denoted as , we process them by an long short-term memory (LSTM) layer followed by three fully connected (FC) layers to produce the final traffic inflow/outflow prediction for, i.e.,
| (2) |
5. Experimental Studies
5.1. Experimental Settings
Baselines: In this prototype study, we compare our proposed method with the following deep learning-based baselines:
-
(1)
GCN: We consider a model based on graph convolutional neural networks (GCN) as a baseline, which accepts the same input as our proposed framework.
-
(2) – (4)
LSTM, GRU, and RNN: We implement neural networks based on recurrent long short-term memory (LSTM), gated recurrent unit (GRU) and simple recurrent neural network (RNN) modules to compare with our framework, which consists of one recurrent layer followed by fully connected (FC) layers. We input the node features to these baselines to predict the inflow/outflow of the target time interval .
-
(5)
GAT: We implement a neural network based on graph convolutional layers with attention mechanism (Veličković et al., 2017) to generate the graph embeddings, which is followed by fully connected layers to generate the final inflow/outflow of the target time interval .
-
(6)
CGCN: We implement a network based on Chebyshev convolutional layer (Defferrard et al., 2016) to produce the graph embeddings, which is similarly followed by fully connected layers to generate the final output.
Parameter Settings: We set and divide each day into 8 equal 3-hour time intervals. Also, we set and predict the inflow/outflow of each region for the time interval using the historical data of the last three time intervals. We use 70% of our dataset for training and the rest for evaluation. Also, we use the Adam optimizer (Goodfellow et al., 2016) with a learning rate of to train our framework and the baselines. Moreover, we use 32 and 16 neurons for the GCN and the fully connected layers of the graph embedding module. Additionally, we use an LSTM layer with 32 neurons for the temporal embedding module with a linear activation function. Furthermore, all our STC-GEF and the baselines all consist of three fully connected layers consisting of 32, 128, and neurons to generate the output with the appropriate shape. For baselines (2)–(4), we use 32 neurons for the recurrent components. Finally, for baselines (5) and (6), we use 32 neurons for the graph neural layers to generate the node embeddings.
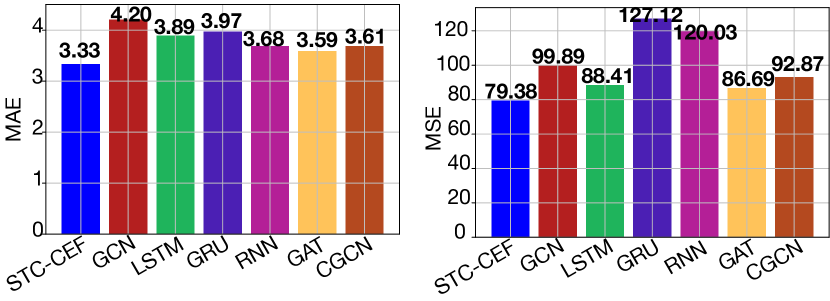
Performance Metrics: We use the mean absolute error (MAE) and mean squared error (MSE) as metrics to measure the difference between the predictions and ground-truths of traffic inflows and outflows.
5.2. Experimental Results
We present our experimental results as follows.
Overall Performance: We feed the historical taxi and Lyft trip data to our STC-GEF and the baselines for performance evaluation and present the overall results in Fig. 4. We can observe that our STC-GEF outperforms the other baselines in terms of MSE and MAE errors. Furthermore, the figure implies that models based on graph neural networks perform better than the methods based on recurrent neural networks. However, the combination of both graph and recurrent neural layers is required for more effective traffic flow prediction.
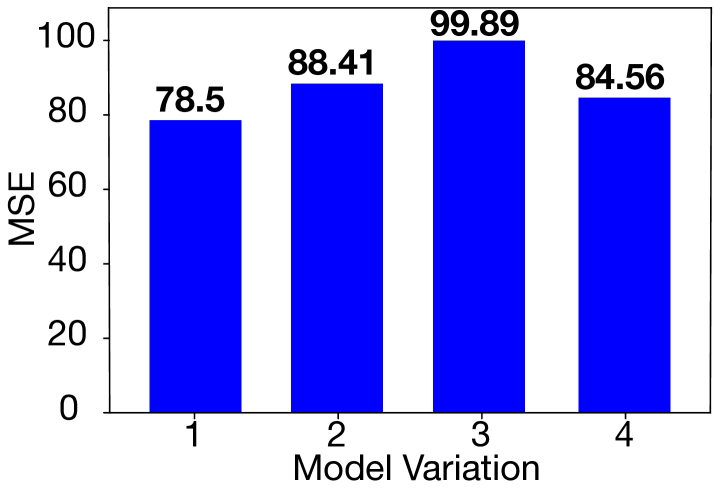
Ablation Studies: To show the importance and role of each component in our framework, we perform ablation studies on different variations of our framework. In particular, we consider the following variations: (1) the complete model, (2) without the graph embedding module, (3) without the temporal embedding module, and (4) without fusing other transportation platform data (Lyft trip data in our studies). We illustrate the results in Fig. 6, from which we can see that the highest performance drop is caused by removing the temporal embedding module (variation 3). Furthermore, we can observe that removing the spatial embedding module (variation 2) also reduced the model’s performance, thus showing the effectiveness of this module. Finally, we can see that by removing the Lyft trip data, the model’s error is increased, which implies that the fusion of different transportation data is necessary for higher traffic flow prediction accuracy.
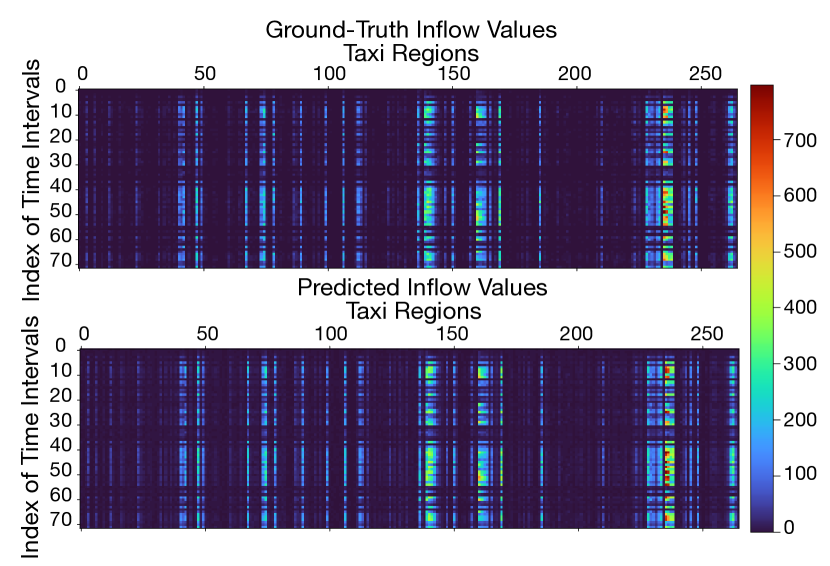
Visualization: We illustrate the predictions of our model compared to the ground truth traffic inflow values for the test data in Fig. 5, in which the warm colors indicate a high inflow/outflow rate between the corresponding regions while cooler colors represent otherwise. We can observe that our model’s prediction is significantly close to the ground truth values. Additionally, by calculating the difference between the ground truth and the predicted values, we realized only 5% of the regions had an error higher than the average error reported in Table. 4, which further shows the effectiveness of our model.
6. Conclusion
We have proposed STC-GEF, a novel traffic prediction architecture based on graph convolutional and recurrent neural networks that extracts spatial and temporal information from the traffic flow data across different transportation platforms. We have designed a novel spatio-temporal graph embedding approach to fuse the traffic flow data from taxis and ride-sharing platforms. We have performed experimental studies to show the effectiveness of STC-GEF, and our results have demonstrated that our model has outperformed the baseline models in traffic flow prediction. In our future work, we will further conduct extensive data analytics for more comprehensive model studies, including comparison with more state-of-the-art approaches.
7. Acknowledgment
This project is supported, in part, by the 2021 Google Research Scholar Program Award and the 2021 NVIDIA Applied Research Accelerator Program Award.
References
- (1)
- tra (2019) 2019. INRIX RESEARCH SHOWS AMERICANS LOSE 97 HOURS PER YEAR TO CONGESTION. Retrieved May, 2022 from https://www.roadsbridges.com/inrix-research-shows-americans-lose-97-hours-year-congestion
- bik (2022) 2022. Citi Bike Trip Histories. Retrieved May, 2022 from https://ride.citibikenyc.com/system-data
- nyc (2022a) 2022a. NYC Taxi Zones. Retrieved May, 2022 from https://data.cityofnewyork.us/Transportation/NYC-Taxi-Zones/d3c5-ddgc
- nyc (2022b) 2022b. Open Data for All New Yorkers. Retrieved May, 2022 from https://opendata.cityofnewyork.us/
- tlc (2022) 2022. TLC Trip Record Data. Retrieved May, 2022 from https://www1.nyc.gov/site/tlc/about/tlc-trip-record-data.page
- Alexander and González (2015) Lauren P Alexander and Marta C González. 2015. Assessing the impact of real-time ridesharing on urban traffic using mobile phone data. Proc. UrbComp 15 (2015), 1–9.
- Chen et al. (2011) Chenyi Chen, Jianming Hu, Qiang Meng, and Yi Zhang. 2011. Short-time traffic flow prediction with ARIMA-GARCH model. In 2011 IEEE Intelligent Vehicles Symposium (IV). IEEE, 607–612.
- Defferrard et al. (2016) Michaël Defferrard, Xavier Bresson, and Pierre Vandergheynst. 2016. Convolutional neural networks on graphs with fast localized spectral filtering. Advances in neural information processing systems 29 (2016).
- Dong et al. (2018) Xuchen Dong, Ting Lei, Shangtai Jin, and Zhongsheng Hou. 2018. Short-term traffic flow prediction based on XGBoost. In Proc. IEEE 7th Data Driven Control and Learning Systems Conference (DDCLS). IEEE, 854–859.
- Goodfellow et al. (2016) Ian Goodfellow, Yoshua Bengio, and Aaron Courville. 2016. Deep learning. MIT press.
- He et al. (2016) Kaiming He, Xiangyu Zhang, Shaoqing Ren, and Jian Sun. 2016. Deep Residual Learning for Image Recognition. In Proc. IEEE CVPR. 770–778.
- Kaiser et al. (2017) Mohammed Shamim Kaiser, Khin T Lwin, Mufti Mahmud, Donya Hajializadeh, Tawee Chaipimonplin, Ahmed Sarhan, and Mohammed Alamgir Hossain. 2017. Advances in crowd analysis for urban applications through urban event detection. IEEE Transactions on Intelligent Transportation Systems 19, 10 (2017), 3092–3112.
- Kumar (2017) Selvaraj Vasantha Kumar. 2017. Traffic flow prediction using Kalman filtering technique. Procedia Engineering 187 (2017), 582–587.
- Pan et al. (2020) Zheyi Pan, Wentao Zhang, Yuxuan Liang, Weinan Zhang, Yong Yu, Junbo Zhang, and Yu Zheng. 2020. Spatio-temporal meta learning for urban traffic prediction. IEEE Transactions on Knowledge and Data Engineering (2020).
- Santos et al. (2018) Frances A Santos, Diego O Rodrigues, Thiago H Silva, Antonio AF Loureiro, Richard W Pazzi, and Leandro A Villas. 2018. Context-aware vehicle route recommendation platform: Exploring open and crowdsourced data. In Proc. IEEE International Conference on Communications (ICC). IEEE, 1–7.
- Shi et al. (2020) Xiaoming Shi, Heng Qi, Yanming Shen, Genze Wu, and Baocai Yin. 2020. A Spatial–Temporal Attention Approach for Traffic Prediction. IEEE Transactions on Intelligent Transportation Systems 22, 8 (2020), 4909–4918.
- Tabatabaie et al. (2021) Mahan Tabatabaie, Suining He, and Xi Yang. 2021. Reinforced Feature Extraction and Multi-Resolution Learning for Driver Mobility Fingerprint Identification. In Proc. ACM SIGSPATIAL (Beijing, China) (SIGSPATIAL ’21). Association for Computing Machinery, New York, NY, USA, 69–80.
- Tabatabaie et al. (2022) Mahan Tabatabaie, Suining He, and Xi Yang. 2022. Driver Maneuver Identification with Multi-Representation Learning and Meta Model Update Designs. Proc. ACM Interact. Mob. Wearable Ubiquitous Technol. 6, 2, Article 74 (jul 2022), 23 pages.
- Veličković et al. (2017) Petar Veličković, Guillem Cucurull, Arantxa Casanova, Adriana Romero, Pietro Lio, and Yoshua Bengio. 2017. Graph attention networks. arXiv preprint arXiv:1710.10903 (2017).
- Yang et al. (2021) Xi Yang, Suining He, Bing Wang, and Mahan Tabatabaie. 2021. Spatio-Temporal Graph Attention Embedding for Joint Crowd Flow and Transition Predictions: A Wi-Fi-based Mobility Case Study. Proceedings of the ACM on Interactive, Mobile, Wearable and Ubiquitous Technologies 5, 4 (2021), 1–24.
- Zhang and Kabuka (2018) Da Zhang and Mansur R Kabuka. 2018. Combining weather condition data to predict traffic flow: A GRU-based deep learning approach. IET Intelligent Transport Systems 12, 7 (2018), 578–585.
- Zhang et al. (2017) Junbo Zhang, Yu Zheng, and Dekang Qi. 2017. Deep spatio-temporal residual networks for citywide crowd flows prediction. In Proc. AAAI Conference on Artificial Intelligence (AAAI).
- Zheng et al. (2020) Chuanpan Zheng, Xiaoliang Fan, Cheng Wang, and Jianzhong Qi. 2020. GMAN: A graph multi-attention network for traffic prediction. In Proc. AAAI Conference on Artificial Intelligence (AAAI), Vol. 34. 1234–1241.