22email: miguel.pereira@oan.es 33institutetext: Department of Physics, University of Oxford, Keble Road, Oxford OX1 3RH, UK 44institutetext: Telespazio UK for the European Space Agency, ESAC, Camino Bajo del Castillo s/n, 28692 Villanueva de la Cañada, Spain 55institutetext: Centro de Astrobiología (CSIC-INTA), ESAC Campus, E-28692 Villanueva de la Cañada, Madrid, Spain 66institutetext: Departamento de Física de la Tierra y Astrofísica, Fac. de CC Físicas, Universidad Complutense de Madrid, 28040, Madrid, Spain 77institutetext: Instituto de Física de Partículas y del Cosmos IPARCOS, Fac. CC Físicas, Universidad Complutense de Madrid, 28040 Madrid, Spain 88institutetext: Department of Physics & Astronomy, University of Southampton, Hampshire, SO17 1BJ, Southampton, UK 99institutetext: Instituto de Astrofísica de Canarias, Calle Vía Láctea, s/n, 38205 La Laguna, Tenerife, Spain 1010institutetext: Departamento de Astrofísica, Universidad de La Laguna, 38206, La Laguna, Tenerife, Spain 1111institutetext: School of Mathematics, Statistics and Physics, Newcastle University, NE1 7RU, Newcastle upon Tyne, UK
Low-power jet–interstellar medium interaction in NGC 7319 revealed by JWST/MIRI MRS
We present JWST/MIRI MRS spectroscopy of NGC 7319, the largest galaxy in the Stephan’s Quintet, observed as part of the Early Release Observations (ERO). NGC 7319 hosts a type 2 active galactic nucleus (AGN) and a low-power radio jet (=3.31022 W Hz-1) with two asymmetric radio hotspots at 430 pc (N2) and 1.5 kpc (S2) projected distances from the unresolved radio core. The MRS data suggest that the molecular material in the disk of the galaxy decelerates the jet and causes this length asymmetry. We find enhanced emission from warm and hot H2 (=33040 K, =90060 K) and ionized gas at the intersection between the jet axis and dust lanes in the disk. This emission is coincident with the radio hotspot N2, the hotspot closer to the core, suggesting that the jet–interstellar medium (ISM) interaction decelerates the jet. Conversely, the mid-infrared emission at the more distant hotspot is fainter, more highly ionized, and with lower H2 excitation, suggesting a more diffuse atomic environment where the jet can progress to farther distances. At the N2 radio hotspot, the ionized gas mass (=(2.4–12)105 ) is comparable to that of the warm H2, but the former is more turbulent ( vs. km s-1), so the mechanical energy of the ionized gas is 1.3–10 times higher. From these estimates, we find that only 1% of the jet energy remains as mechanical energy in these two ISM phases at N2. We also find extended (0.3–1.5 kpc) high-ionization emission ([Mg v], [Ne vi], and [Ne v]) close to the radio hotspots.
This initial analysis of NGC 7319 shows the potential of MIRI/MRS to investigate the AGN feedback mechanisms due to radio jets and their radiation field in the, often heavily dust-enshrouded, central regions of galaxies. Understanding these mechanisms is an essential ingredient in the development of cosmological simulations of galaxy evolution.
Key Words.:
galaxies: ISM – galaxies: jets – infrared: galaxies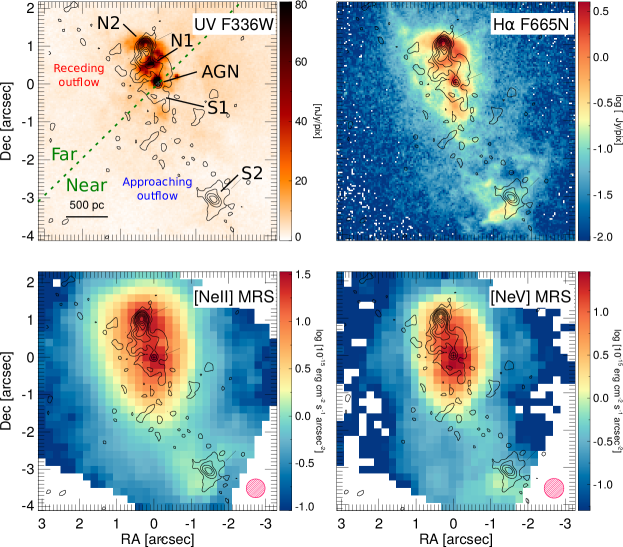
1 Introduction
James Webb Space Telescope (JWST) observations of NGC 7319 were obtained as part of the Early Release Observations (ERO; Program ID #2732; Pontoppidan et al. 2022). In this Letter we focus on the analysis of the Mid-Infrared Instrument (MIRI) medium resolution spectrograph (MRS) data (Rieke et al. 2015; Wells et al. 2015; Wright et al. 2015).
NGC 7319 is the largest galaxy in the Stephan’s Quintet interacting group (Arp 319, HCG 092; Mpc). NGC 7319 lost most of its atomic neutral gas during the interactions (Williams et al. 2002), but some atomic ionized and cold molecular gas is still present in its nuclear region (Rodríguez-Baras et al. 2014; Gao & Xu 2000). This galaxy hosts a type 2 active galactic nucleus (AGN), which dominates the energy output of this object since no strong nuclear starburst signatures are found (Sulentic et al. 2001). From X-ray spectral fitting in Ricci et al. (2017), the intrinsic hard X-ray (14–195 keV) luminosity of 1043.8 erg s-1 places the AGN in the range of local Seyferts, while the high column density (=1023.8 cm-2) is consistent with its obscured nature. Two asymmetric radio lobes and a compact core are detected, suggesting the presence of a low-power radio jet with =1022.5 W Hz-1 (Aoki et al. 1999; Xanthopoulos et al. 2004).
Low-power radio jets produced by AGN seem to have an important role in galaxy evolution, providing kinetic feedback to the host interstellar medium (ISM) and regulating the formation of stars (e.g., Weinberger et al. 2017; Davé et al. 2019). The jet interaction with the cold molecular and ionized ISM phases has been studied in a few local galaxies and AGN with low and , similar to NGC 7319, using submillimeter and optical data (e.g., Alatalo et al. 2011; García-Burillo et al. 2014, 2019; Alonso-Herrero et al. 2018; Fernández-Ontiveros et al. 2020; García-Bernete et al. 2021; Venturi et al. 2021). Previous mid-IR spectroscopic studies, however, focused on more luminous radio galaxies (e.g., Ogle et al. 2010; Guillard et al. 2012; Dasyra et al. 2014; Zakamska et al. 2016) and were unable to provide spatially resolved information. In kinetic feedback studies, mid-IR emission lines are particularly valuable because they can trace warm molecular gas (100–1000 K) to highly ionized gas (coronal lines) and are less subject to extinction effects than optical/UV lines. In this Letter we analyze the low-power jet–ISM interaction in NGC 7319 using MIRI/MRS data, which provides, for the first time, spatially resolved morphologies and kinematics.
2 Data reduction and analysis
We processed the MIRI/MRS observations using the JWST calibration pipeline to produce 12 spectral cubes with the default spatial and spectral sampling. Technical details on the data reduction are described in Appendix A.1.
We obtained maps of the brightest emission lines in this spectral range (Table 2) by subtracting the local continuum (estimated with a linear fit) and integrating the line flux spaxel by spaxel between 1100 km s-1, which is the velocity range where emission is detected for the broader ionized gas lines. We also measured the first moment (velocity field) and second moment (velocity dispersion, ) of the line emission profile. Line maps are presented in Figs. 1-4.
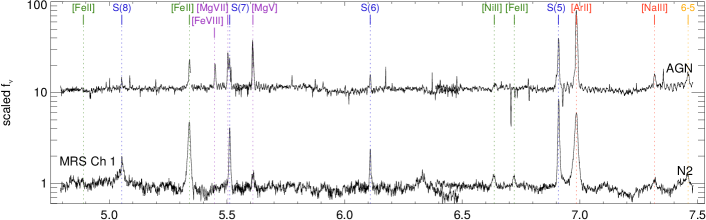
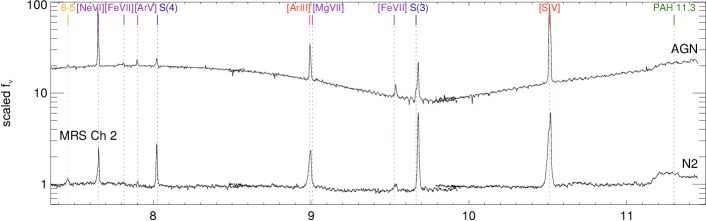
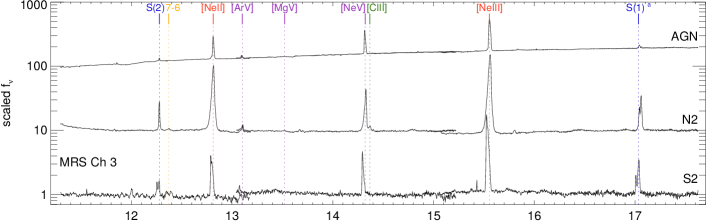
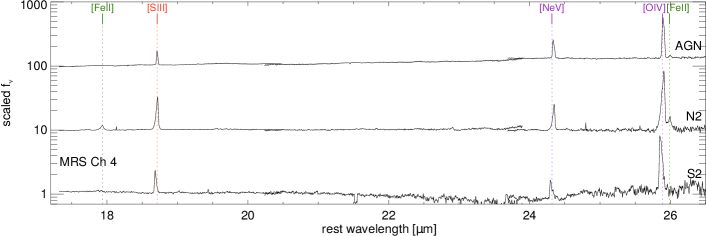
We extracted the spectra of three regions (AGN, N2, and S2; Figs. 1, 2, and 4) using a 1″ (450 pc) diameter aperture, which is 2 times the channel 3 point spread function (PSF) full-width half-maximum (FWHM). We applied a point-source correction to the AGN spectrum (see Appendix A.1). For N2 and S2, we did not apply any aperture correction since the emission appears more extended. The spectra are presented in Fig. 6.
In addition, we used JWST and Hubble Space Telescope (HST) imaging data to trace the UV, H, and dust lane morphologies (see Appendices A.2 and A.3).
3 Jet–ISM interaction in NGC 7319
Interferometric radio observations at 1.4, 5, and 8 GHz revealed an unresolved core, with a flat radio spectrum, and two synchrotron hotspots at the ends of the radio lobes. The hotspots are asymmetrically located at 430 pc and 1.5 kpc projected distances, respectively, from the core, which implies a high arm-length ratio of 3.5 (Fig. 1 and Aoki et al. 1999; Xanthopoulos et al. 2004). Relativistic beaming can produce asymmetric arm-length ratios. Assuming intrinsically symmetric jet propagation, the approaching side is brighter and its apparent distance higher (Boettcher et al. 2012). On the contrary, in NGC 7319 the brighter side is closer to the core and coincident with the receding side of the ionized outflow (see below and Fig. 1). Alternatively, the length asymmetry can be produced by the interaction of the northern radio jet with the ISM (e.g., Xanthopoulos et al. 2004).
This galaxy contains a 400 km s-1 ionized gas outflow, detected in [O iii]5007Å and H. This outflow is co-spatial with the radio lobes, and its kinematic major axis is aligned with the core-hotspots axis (see Yttergren et al. 2021), which suggests that the outflow is driven by the radio jet (Aoki et al. 1996).
Assuming that the large-scale spiral pattern and tidal features of NGC 7319 resulting from prograde galaxy interactions are trailing (Renaud et al. 2010), the stellar disk is rotating counterclockwise. This assumption, together with the stellar kinematics (Yttergren et al. 2021), determines the far and near sides of the disk (see the top-left panel of Fig. 1). Therefore, the northern side of the jet (receding outflow) is seen in projection on the far side of the disk, while the southern side (approaching outflow) is over the near side of the disk. This geometry and outflow kinematics is at odds with a perpendicular-to-the-disk jet orientation. Instead, it is consistent with the jet axis being close to the plane of the disk, and, therefore, it favors jet–ISM interactions.
The top panels of Fig. 1 show the near-UV/blue continuum and H emissions, which are spatially coincident with the radio lobes and peak close to the northern hotspot, N2. Bow shocks are also present at both the northern and southern lobes, especially in the H image. The bottom panels show the MRS maps of the [Ne ii]12.81 m (ionization potential, IP, = 22 eV) and the high-ionization [Ne v]14.32 m (IP = 97 eV) emission lines. Both mid-IR lines have morphologies that follow the radio jet axis and resemble that of the higher angular resolution UV/optical imaging data. So they are likely connected to the jet as well. Nevertheless, a contribution to these lines from the AGN extended narrow line region is also possible.
3.1 Jet–molecular gas interaction: Northern radio hotspot
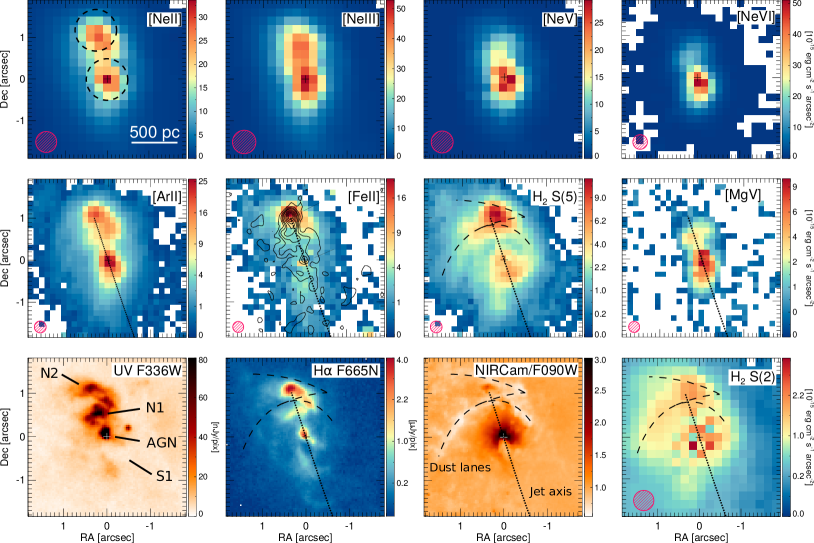
Figure 2 shows the line maps centered on the more luminous northern radio lobe. The first row compares the Ne emission from Ne+ to Ne5+ (IP=126 eV). These maps trace the ionization state of the gas, avoiding uncertainties due to relative atomic abundances. We find that the extent of the Ne emission decreases with increasing ionization stage. The lower-ionization [Ne ii] emission peaks close to N2, with reduced emission at N1 closer to the nucleus. Intermediate [Ne iii] emission seems to peak between N1 and N2, while the highest-ionization [Ne v] and [Ne vi] lines, instead, are brighter at N1. The latter indicates that the intense UV radiation from N1 is unlikely produced by star formation. To examine the excitation at higher angular resolution, we used the short wavelength channel 1 [Ar ii]6.99 m (IP=15.8 eV) and [Mg v]5.61 m (IP=109 eV) emission lines as proxies of the low- and high-ionization gas (second row of Fig. 2). The better angular resolution allows us to establish that the high-ionization emission is mostly concentrated at N1 to the north and at S1 to the south of the nucleus, while lower-ionization gas dominates the emission at the N2 radio hotspot. The [Ar ii] morphology is also similar to that of the H map (bottom row).
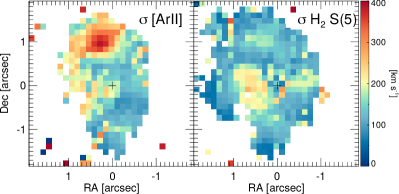
Radio jets interact with the ISM, transferring energy and momentum to the ISM clouds through shock waves (Sutherland & Bicknell 2007). These shock waves enhance the mid-IR rotational H2 emission in radio galaxies (Guillard et al. 2012; Ogle et al. 2010). In NGC 7319, the H2 S(5) 6.91 m emission peaks close to the N2 hotspot. Both H2 S(2) 12.28 m and H2 S(5) also trace the dust lanes visible in the F090W image (see Fig. 2). Therefore, the radio hotspot seems to be located 100 pc away from the intersection between the dust lanes and the jet axis. We note, however, that the contrast between the dust lanes and hotspot emission is smaller for the lower excitation H2 S(2) transition. The jet–ISM interaction at N2 is also supported by the bright [Fe ii]5.34 m emission, which is enhanced in shocks (Allen et al. 2008; Koo et al. 2016).
The polycyclic aromatic hydrocarbon (PAH) emission at N2 is weak relative to the H2 lines (Fig. 6), as seen in shock-excited regions (Guillard et al. 2012; Beirão et al. 2015). The ratio between the 11.3 m PAH flux, estimated by subtracting a local continuum and integrating the spectrum between 11.0 and 11.8 m, and the H2 S(1) line flux is 2.5, which is 10 times lower than in local starburst galaxies (see Pereira-Santaella et al. 2010a). Therefore, photodissociation region excitation at N2 is unlikely. In addition, the 7.7 m PAH feature is extremely weak at N2 (Fig. 6), and only the 11.3 m PAH, which is more resilient in hard environments (García-Bernete et al. 2022), is clearly detected. Similar spectra are seen in radio galaxies with strong jets, which differ from star-forming galaxies where the 7.7 m PAH feature is dominant (Ogle et al. 2010; Zakamska et al. 2016; Smith et al. 2007).
3.2 Jet–atomic gas interaction: Southern radio hotspot
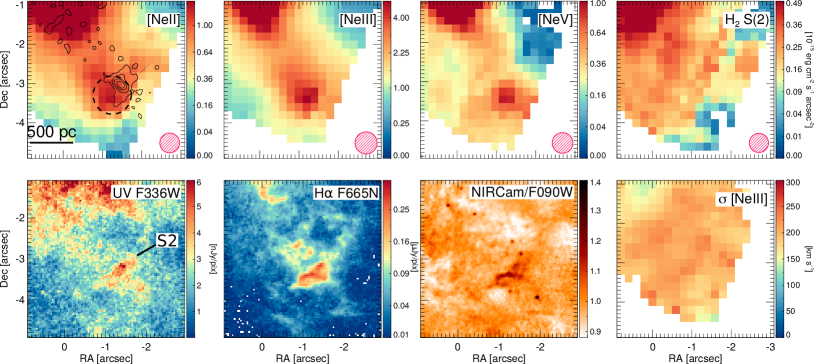
The more distant southern lobe was only observed with the longer wavelength MRS channels 3 and 4 due to the larger field of view (FoV) at those wavelengths. For this reason, a reduced set of mid-IR lines is available (Fig. 4). The three Ne lines peak at the same location close to the S2 radio hotspot, although, we note that the offset between the Ne and radio peaks is larger at S2 than at N2 (02 vs. 05). In the higher spatial resolution HST and JWST/Near Infrared Camera (NIRCam) continuum and H images, this region appears as an arc or bow-shock. This structure was already identified by Aoki et al. (1999). The velocity dispersion of the ionized gas is high, 220–300 km s-1 (Table 2), and similar to that of N2, although the S2 hotspot does not stand out in the velocity dispersion map (last panel of Fig. 4). Contrary to the N2 hotspot, at S2 the H2 emission is not enhanced, although in this case the S(5) line, more sensitive to the jet-excited molecular gas, is not available. The higher H2 S(1) to S(2) ratio in this region also supports a lower excitation of the molecular gas in S2 (Table 1). Conversely, the higher [Ne iii] and [Ne v] to [Ne ii] ratios indicate that the ionized gas phase is more highly ionized in S2 (Table 1). These results suggest that the jet is interacting more strongly with the atomic gas phase, relative to the molecular, at S2 than at N2.
| Ratio | AGN | N2 | S2 |
|---|---|---|---|
| [Ne iii]/[Ne ii] | 2.08 | 1.16 | 3.31 |
| [Ne v]/[Ne ii] | 0.96 | 0.22 | 0.60 |
| [Ne v]/[Ne iii] | 0.46 | 0.19 | 0.18 |
| [Ne v]/H2 S(1) | 10.6 | 1.85 | 1.43 |
| H2 S(1)/H2 S(2) | 0.92 | 1.27 | 2.70 |
4 Ionized and warm/hot molecular gas mass affected by the jet
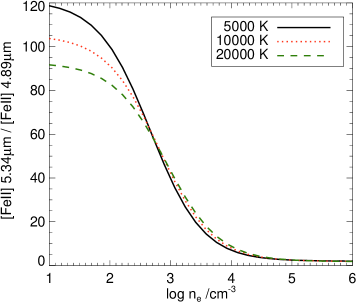
We derived the ionized gas mass using Eq. 1 of Venturi et al. (2021). The ratio between H and H i 6–5 7.46 m (Pf) is 112 at 10 000 K (Storey & Hummer 1995). We assumed that the electron density, , in the ionized gas in the shock is between 100 cm-3 and the upper limit, ¡500 cm-3, obtained from the [Fe ii]5.34 m/[Fe ii]4.89 m 60 ratio (Fig. 8). The resulting mass range is (2.4–12)105 .
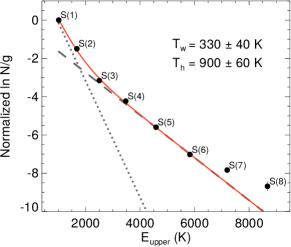
The warm and hot molecular gas mass at N2 is derived using the H2 S(1) to S(8) transitions. The critical densities of these transitions are relatively low, = 102 to 105 cm-3 at 500 K (Le Bourlot et al. 1999), so we can assume local thermodynamic equilibrium (LTE) conditions. Under this assumption, the S(1) to S(6) transitions can be fit with a two-temperature model: a warm component with =33040 K and =(6.01.4)105 , which dominates the S(1) and S(2) emission; and a hotter component with =90060 K and =(0.440.12)105 , which dominates the S(3)–S(6) emission (Fig. 5). The higher transitions S(7) and S(8) deviate from this fit, suggesting the existence of a hotter component, whose temperature is 1000 K but not well constrained by these transitions alone.
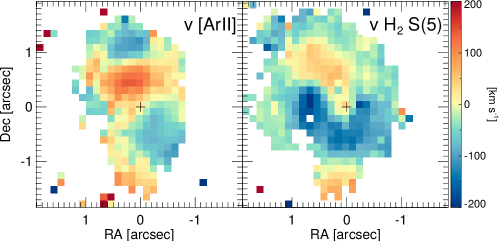
Molecular gas is expected to reform in post-shock regions (Hollenbach & McKee 1989). However, the lower H2 velocity dispersion compared to that of the ionized gas (Fig. 3) suggests that the origin of the H2 emission is not reformed H2 molecules after the cooling of that ionized gas. Instead, it is plausible that this H2 was already present and is being excited by the shock waves produced by the jet.
The ionized gas velocity dispersion is 2 times higher than that of the warm H2, and the / ratio is 0.3–2.5. Therefore, the mechanical energy of the ionized phase, =3/2 =(0.6–3.2)1054 erg, is 1.3–10 times higher than that of the warm H2, =(0.40.1)1054 erg.
We estimated a jet cavity power of 21043 erg s-1 using Eq. 16 of Bîrzan et al. (2008) and =3.31022 W Hz-1 (Aoki et al. 1999), which is similar to NGC 1068 (García-Burillo et al. 2014), and we assume that half of it reaches the northern radio hostspot N2. The ratio (+/() is (2.4–9.7)10-3, where the jet life, 1.1106 yr, is estimated from the jet travel time to S2 following Venturi et al. (2021). This indicates that only a small fraction of the jet energy (1%) remains as mechanical energy in the ionized and warm molecular ISM phases.
5 Summary and conclusions
We have analyzed the low-power (=3.31022 W Hz-1) jet–ISM interaction in the Seyfert 2 galaxy NGC 7319 using JWST/MIRI MRS data. We find evidence suggesting that molecular gas in dust lanes decelerates the jet at the northern hotspot, N2, which is three times closer to the nucleus than the southern hotspot, S2. Enhanced warm and hot H2 emission ( 330 K and 900 K) and ionized gas tracers, as well as [Fe ii]5.34 m emission, which is a shock tracer, are detected at N2 at the intersection between the jet axis and dust lanes. On the contrary, at the more distant S2 hotspot, the H2 excitation is lower and the atomic gas is more highly ionized. This suggests that the jet interacts more strongly with the atomic gas there. Therefore, the reduced molecular gas–jet interaction at the southern radio lobe could make it easier for the jet to reach greater distances.
Extended (distances of up to 1.5 kpc from the nucleus) high-ionization ([Mg v]5.61 m, [Ne vi]7.65 m, [Ne v]14.32 m, and [Ne v]24.32 m) emission is detected close to the radio jet hotspots. These lines can be produced in the photoionized precursor of the shock waves produced by the jet or can be gas photoionized by the AGN radiation in an extended narrow line region.
At N2, =(2.4–12)105 is comparable to the warm (330 K) H2 gas mass and 6 times higher than the hot (900 K) H2 mass. The ionized gas is also more turbulent ( vs. km s-1). Therefore, the mechanical energy of the ionized gas is 1.3–10 times higher than that of the warmhot molecular gas. From these estimates, we find that 1% of the jet energy remains as mechanical energy in these two ISM phases, which is much lower than the 25–30% of the jet energy that is injected into the ISM according to simulations (Mukherjee et al. 2016). We note that the jet can also transfer mechanical energy to the cold molecular gas traced by CO and launch molecular outflows (e.g., Morganti et al. 2015; Ramos Almeida et al. 2022).
These initial results show the JWST/MIRI MRS capabilities to constrain the AGN–jet feedback on the multiphase ISM at unprecedented sensitivity and unprecedented angular and spectral resolutions in the mid-IR.
Acknowledgements.
We thank the referee for their useful comments and suggestions. We thank P. Gandhi and E. Hicks for the careful reading of the manuscript and useful discussion. The authors acknowledge the ERO team for developing their observing program with a zero-exclusive-access period. MPS acknowledges support from the Comunidad de Madrid through the Atracción de Talento Investigador Grant 2018-T1/TIC-11035 and PID2019-105423GA-I00 (MCIU/AEI/FEDER,UE). JAM, AL, and LC acknowledge support by grant PIB2021-127718NB-100 by the Spanish Ministry of Science and Innovation/State Agency of Research (MCIN/AEI). IGB acknowledges support from STFC through grant ST/S000488/1. AAH acknowledges support from grant PGC2018-094671-B-I00 funded by MCIN/AEI/ 10.13039/501100011033 and by ERDF A way of making Europe. SGB acknowledges support from the research project PID2019-106027GA-C44 of the Spanish Ministerio de Ciencia e Innovación. CRA acknowledges support from grant PID2019-106027GB-C42, funded by MICINN-AEI/10.13039/501100011033, from EUR2020-112266, funded by MICINN-AEI/10.13039/501100011033 and the European Union NextGenerationEU/PRTR, and from the Consejería de Economía, Conocimiento y Empleo del Gobierno de Canarias and the European Regional Development Fund (ERDF) under grant ProID2020010105, ACCISI/FEDER, UE. This work is based on observations made with the NASA/ESA/CSA James Webb Space Telescope. The data were obtained from the Mikulski Archive for Space Telescopes at the Space Telescope Science Institute, which is operated by the Association of Universities for Research in Astronomy, Inc., under NASA contract NAS 5-03127 for JWST; and from the European JWST archive (eJWST) operated by the ESAC Science Data Centre (ESDC) of the European Space Agency. These observations are associated with program #2732, #1049, #1050. This research is based on observations made with the NASA/ESA Hubble Space Telescope obtained from the Space Telescope Science Institute, which is operated by the Association of Universities for Research in Astronomy, Inc., under NASA contract NAS 5–26555. These observations are associated with programs 11502 and 12301.References
- Alatalo et al. (2011) Alatalo, K., Blitz, L., Young, L. M., et al. 2011, ApJ, 735, 88
- Allen et al. (2008) Allen, M. G., Groves, B. A., Dopita, M. A., Sutherland, R. S., & Kewley, L. J. 2008, ApJS, 178, 20
- Alonso-Herrero et al. (2018) Alonso-Herrero, A., Pereira-Santaella, M., García-Burillo, S., et al. 2018, ApJ, 859, 144
- Álvarez-Márquez et al. (2022) Álvarez-Márquez, J., Labiano, A., Guillard, P., et al. 2022, arXiv e-prints, arXiv:2209.01695
- Aoki et al. (1999) Aoki, K., Kosugi, G., Wilson, A. S., & Yoshida, M. 1999, ApJ, 521, 565
- Aoki et al. (1996) Aoki, K., Ohtani, H., Yoshida, M., & Kosugi, G. 1996, AJ, 111, 140
- Argyriou et al. (2020) Argyriou, I., Wells, M., Glasse, A., et al. 2020, A&A, 641, A150
- Beirão et al. (2015) Beirão, P., Armus, L., Lehnert, M. D., et al. 2015, MNRAS, 451, 2640
- Bîrzan et al. (2008) Bîrzan, L., McNamara, B. R., Nulsen, P. E. J., Carilli, C. L., & Wise, M. W. 2008, ApJ, 686, 859
- Boettcher et al. (2012) Boettcher, M., Harris, D. E., & Krawczynski, H. 2012, Relativistic Jets from Active Galactic Nuclei
- Burton et al. (1992) Burton, M. G., Hollenbach, D. J., & Tielens, A. G. G. 1992, ApJ, 399, 563
- Dasyra et al. (2014) Dasyra, K. M., Combes, F., Novak, G. S., et al. 2014, A&A, 565, A46
- Davé et al. (2019) Davé, R., Anglés-Alcázar, D., Narayanan, D., et al. 2019, MNRAS, 486, 2827
- Fernández-Ontiveros et al. (2020) Fernández-Ontiveros, J. A., Dasyra, K. M., Hatziminaoglou, E., et al. 2020, A&A, 633, A127
- Gao & Xu (2000) Gao, Y. & Xu, C. 2000, ApJ, 542, L83
- García-Bernete et al. (2021) García-Bernete, I., Alonso-Herrero, A., García-Burillo, S., et al. 2021, A&A, 645, A21
- García-Bernete et al. (2022) García-Bernete, I., Rigopoulou, D., Alonso-Herrero, A., et al. 2022, MNRAS, 509, 4256
- García-Burillo et al. (2019) García-Burillo, S., Combes, F., Ramos Almeida, C., et al. 2019, A&A, 632, A61
- García-Burillo et al. (2014) García-Burillo, S., Combes, F., Usero, A., et al. 2014, A&A, 567, A125
- Guillard et al. (2012) Guillard, P., Ogle, P. M., Emonts, B. H. C., et al. 2012, ApJ, 747, 95
- Hollenbach & McKee (1989) Hollenbach, D. & McKee, C. F. 1989, ApJ, 342, 306
- Koo et al. (2016) Koo, B.-C., Raymond, J. C., & Kim, H.-J. 2016, Journal of Korean Astronomical Society, 49, 109
- Kramida et al. (2021) Kramida, A., Yu. Ralchenko, Reader, J., & and NIST ASD Team. 2021, NIST Atomic Spectra Database (ver. 5.9), [Online]. Available: https://physics.nist.gov/asd [2022, July 27]. National Institute of Standards and Technology, Gaithersburg, MD.
- Labiano et al. (2021) Labiano, A., Argyriou, I., Álvarez-Márquez, J., et al. 2021, A&A, 656, A57
- Le Bourlot et al. (1999) Le Bourlot, J., Pineau des Forêts, G., & Flower, D. R. 1999, MNRAS, 305, 802
- Luridiana et al. (2015) Luridiana, V., Morisset, C., & Shaw, R. A. 2015, A&A, 573, A42
- Morganti et al. (2015) Morganti, R., Oosterloo, T., Oonk, J. B. R., Frieswijk, W., & Tadhunter, C. 2015, A&A, 580, A1
- Mukherjee et al. (2016) Mukherjee, D., Bicknell, G. V., Sutherland, R., & Wagner, A. 2016, MNRAS, 461, 967
- Ogle et al. (2010) Ogle, P., Boulanger, F., Guillard, P., et al. 2010, ApJ, 724, 1193
- Pereira-Santaella et al. (2010a) Pereira-Santaella, M., Alonso-Herrero, A., Rieke, G. H., et al. 2010a, ApJS, 188, 447
- Pereira-Santaella et al. (2010b) Pereira-Santaella, M., Diamond-Stanic, A. M., Alonso-Herrero, A., & Rieke, G. H. 2010b, ApJ, 725, 2270
- Pontoppidan et al. (2022) Pontoppidan, K., Blome, C., Braun, H., et al. 2022, arXiv e-prints, arXiv:2207.13067
- Ramos Almeida et al. (2022) Ramos Almeida, C., Bischetti, M., García-Burillo, S., et al. 2022, A&A, 658, A155
- Renaud et al. (2010) Renaud, F., Appleton, P. N., & Xu, C. K. 2010, ApJ, 724, 80
- Ricci et al. (2017) Ricci, C., Trakhtenbrot, B., Koss, M. J., et al. 2017, ApJS, 233, 17
- Rieke et al. (2015) Rieke, G. H., Ressler, M. E., Morrison, J. E., et al. 2015, PASP, 127, 665
- Rigby et al. (2022) Rigby, J., Perrin, M., McElwain, M., et al. 2022, arXiv e-prints, arXiv:2207.05632
- Rodríguez-Baras et al. (2014) Rodríguez-Baras, M., Rosales-Ortega, F. F., Díaz, A. I., Sánchez, S. F., & Pasquali, A. 2014, MNRAS, 442, 495
- Smith et al. (2007) Smith, J. D. T., Draine, B. T., Dale, D. A., et al. 2007, ApJ, 656, 770
- Smyth et al. (2019) Smyth, R. T., Ramsbottom, C. A., Keenan, F. P., Ferland, G. J., & Ballance, C. P. 2019, MNRAS, 483, 654
- Storey & Hummer (1995) Storey, P. J. & Hummer, D. G. 1995, MNRAS, 272, 41
- Sulentic et al. (2001) Sulentic, J. W., Rosado, M., Dultzin-Hacyan, D., et al. 2001, AJ, 122, 2993
- Sutherland & Bicknell (2007) Sutherland, R. S. & Bicknell, G. V. 2007, ApJS, 173, 37
- Venturi et al. (2021) Venturi, G., Cresci, G., Marconi, A., et al. 2021, A&A, 648, A17
- Weinberger et al. (2017) Weinberger, R., Springel, V., Hernquist, L., et al. 2017, MNRAS, 465, 3291
- Wells et al. (2015) Wells, M., Pel, J.-W., Glasse, A., et al. 2015, PASP, 127, 646–664
- Williams et al. (2002) Williams, B. A., Yun, M. S., & Verdes-Montenegro, L. 2002, AJ, 123, 2417
- Wright et al. (2015) Wright, G. S., Wright, D., Goodson, G. B., et al. 2015, PASP, 127, 595
- Xanthopoulos et al. (2004) Xanthopoulos, E., Muxlow, T. W. B., Thomasson, P., & Garrington, S. T. 2004, MNRAS, 353, 1117
- Yttergren et al. (2021) Yttergren, M., Misquitta, P., Sánchez-Monge, Á., et al. 2021, A&A, 656, A83
- Zakamska et al. (2016) Zakamska, N. L., Lampayan, K., Petric, A., et al. 2016, MNRAS, 455, 4191
Appendix A Data reduction
A.1 MIRI/MRS data reduction
MIRI/MRS covers the mid-IR spectral range between 4.9 and 28.1 m. This spectral range is split into four channels (channel 1 from 4.9 to 7.65 m; channel 2 from 7.51 to 11.71 m; channel 3 from 11.55 to 18.02 m; and channel 4 from 17.71 to 28.1 m). Each channel is in turn divided into three sub-bands (short, medium, and long), which each cover a third of the channel spectral range. A single exposure simultaneously observes a single sub-band for the four channels. The FoV and pixel size are smaller for the shorter wavelength channels (from a 3237 FoV and 02 pixel in channel 1 to a 6676 FoV and 03 pixel in channel 4) to better sample the diffraction-limited JWST PSF (see Rieke et al. 2015; Wells et al. 2015; Wright et al. 2015).
We downloaded the uncalibrated NGC 7319 data from the JWST archive. The MIRI/MRS observations were processed using the JWST calibration pipeline (release 1.6.3) with context 0939 of the Calibration References Data System (CRDS). We followed the standard pipeline procedure to generate the fully calibrated detector products (level 2b) for the on-source and background observations (see Álvarez-Márquez et al. 2022 for a more comprehensive explanation of the MRS calibration data process). Before generating the three-dimensional MRS spectral cubes, we applied a residual fringe correction in the detector plane222https://jwst-pipeline.readthedocs.io/en/latest/jwst/residual_fringe/
index.html.. This step corrects the low frequency fringe residuals remaining after the standard pipeline fringe flat correction (Argyriou et al. 2020, Gasman et al. in prep., Kavanagh et al. in prep.).
Then, we generated 12 three-dimensional spectral cubes (the three sub-bands – short, medium, and long bands – for the four MRS channels) with the default spatial and spectral samplings. We estimated the background emission by calculating the median value for each wavelength channel in the background data cubes. This median value for each spectral channel was subtracted from the on-source data cubes.
For the nuclear spectra of the AGN, an additional residual fringe correction was implemented to correct for the high frequency fringes generated in the dichroics, which are noticeable in the spectra of bright point sources in channels 3 and 4. With these final corrections, the final fringe residuals are reduced to levels lower than 6%, with a median level of 2-4% (Kavanagh et al. in prep.).
From the emission line fits, we estimate that the current MRS wavelength calibration has, in general, offsets smaller than 100 km s-1, consistent with the JWST commissioning report (Rigby et al. 2022). The exceptions are the medium sub-band of channel 3 (13.29–15.52 m), where a constant shift of 0.04 m (900 km s-1) is present, and the medium sub-band of channel 2 (8.67–10.15 m), where the wavelength shift is variable. In addition, the wavelength solution of the long sub-band of channel 3 around 17.3 m (observed wavelength of the H2 S(1) transition in NGC 7319) is affected by artifacts that alter the line profile by creating spurious double-peaked profiles at some positions of the data cube but they do not alter the integrated line flux. These issues have been identified and do not affect the analysis presented in this work.
The unresolved line FWHM (/resolving power) increases from 80 km s-1 to 130 km s-1 with increasing wavelength for the channels analyzed here (1, 2, and 3; Labiano et al. 2021, Jones et al. in prep.). Therefore, all the emission lines in NGC 7319, which have FWHM/2.35==130–370 km s-1 (Table 2), are spectrally resolved.
We estimated the point-source correction for a 1″ diameter aperture using the MRS observations of HD 163466 (Program ID #1050) for channels 1, 2, and 3, and SMP-LMC-058 (Program ID #1049) for channel 4.
A.2 Ancillary JWST and HST imaging
JWST/NIRCam and MIRI wide-band filter images are also available as part of the ERO data release. We obtained the calibrated level 3 images (pipeline release 1.5.3 and context 0919 of the CRDS) from the JWST archive. We used the NIRCam F090W (=0.90 m; =0.19 m)333https://jwst-docs.stsci.edu/jwst-near-infrared-camera/nircam-instrumentation/nircam-filters, and the MIRI F1000W (=10.0 m; =2.0 m)444https://jwst-docs.stsci.edu/jwst-mid-infrared-instrument/miri-instrumentation/miri-filters-and-dispersers images, which we used to determine the coordinates of the AGN mid-IR emission (Appendix A.3).
Hubble Space Telescope Wide Field Camera 3 (WFC3) images were also retrieved from the Hubble Legacy Archive: the F336W (=0.335 m; =0.051 m)555https://hst-docs.stsci.edu/wfc3ihb/chapter-6-uvis-imaging-with-wfc3/6-5-uvis-spectral-elements, which covers the near-UV/blue emission of the galaxy; and the F665N (=0.666 m; =0.013 m), which includes the H emission and the weakest line, 6548Å, of the [N ii] doublet at the redshift of NGC 7319. We subtracted the underlying continuum by linearly interpolating the F606W (=0.59 m; =0.22 m) and F814W (=0.80 m; =0.16 m) images at the mean wavelength of the F665N filter, taking into account that the F606W image includes the F665N emission. The [N ii]6548Å/H ratio is 0.3 in the central 10″, based on optical integral field spectroscopy (Rodríguez-Baras et al. 2014), so the continuum-subtracted F665N morphology is likely dominated by the H emission.
A.3 Astrometric registration
To allow for morphology comparisons between the MRS line maps and the JWST and HST ancillary images (Appendix A.2), we require relative astrometric differences smaller than 0.06″(channel 1 data cube half pixel). To achieve this, we registered all the images and line maps to a common frame. We used as reference the NIRCam F090W image. The background quasar J223603.7335824, which is located 8″south of the nucleus and is well detected in all the images, was used to align them. The mid-IR AGN coordinates were derived from the F1000W MIRI image. These coordinates were then assigned to the location of the mid-IR AGN continuum peak derived for each of the MRS line maps.
Appendix B MIRI/MRS emission lines
| Transition | IP a𝑎aa𝑎aIonization potential of the transition defined as the energy needed to reach the ionization stage producing that transition (Kramida et al. 2021). | b𝑏bb𝑏bCritical density at K for collisions with e- calculated using PyNeb v1.1.15 (Luridiana et al. 2015). | AGN | N2 | S2 | |||||||
|---|---|---|---|---|---|---|---|---|---|---|---|---|
| Flux | Flux | Flux | ||||||||||
| m | eV | cm-3 | 10-16 erg cm-2 s-1 | km s-1 | 10-16 erg cm-2 s-1 | km s-1 | 10-16 erg cm-2 s-1 | km s-1 | ||||
| MIRI/MRS Channel 1 | ||||||||||||
| [Fe II] | 4.889 | 7.9 | 4.39 | 1.45 | 0.87 | |||||||
| H2 0–0 S(8) | 5.053 | 4.2 1.1 | 5.5 1.2 | |||||||||
| [Fe II] | 5.340 | 7.9 | 3.09 | 27.5 1.4 | 253 47 | 51.27 0.44 | 336 6 | |||||
| [Fe VIII] | 5.447 | 125 | 6.41 | 14.13 0.63 | 0.69 | |||||||
| [Mg VII] | 5.503 | 187 | 6.53 | 19.5 1.5 | 0.70 | |||||||
| H2 0–0 S(7) | 5.511 | 19.1 2.3 | 19.02 0.40 | 134 16 | ||||||||
| [Mg V] | 5.610 | 109 | 6.60 | 34.5 1.3 | 168 49 | 3.43 0.33 | ||||||
| H2 0–0 S(6) | 6.109 | 6.11 0.65 | 6.58 0.49 | |||||||||
| [Ni II] | 6.636 | 7.6 | 5.92 | 0.68 | 2.74 0.23 | 241 69 | ||||||
| [Fe II] | 6.721 | 7.9 | 3.09 | 1.70 | 1.79 0.23 | 222 67 | ||||||
| H2 0–0 S(5) | 6.909 | 34.8 1.0 | 196 37 | 33.05 0.28 | 144 17 | |||||||
| [Ar II] | 6.985 | 15.8 | 5.62 | 87.1 1.8 | 176 24 | 48.97 0.27 | 328 3 | |||||
| [Na III] | 7.318 | 47.3 | 6.80 | 8.6 1.1 | 321 71 | 2.73 0.18 | 367 38 | |||||
| MIRI/MRS Channel 2 | ||||||||||||
| H I 6-5 | 7.460 | 7.2 1.2 | 2.89 0.34 | 307 75 | ||||||||
| [Ne VI] | 7.652 | 126 | 5.80 | 208.4 1.6 | 127 15 | 12.48 0.23 | 193 22 | |||||
| [Fe VII] | 7.814 | 99.0 | 6.10 | 7.0 1.6 | 0.39 | |||||||
| [Ar V] | 7.902 | 59.6 | 5.20 | 11.62 0.85 | 1.03 0.23 | |||||||
| H2 0–0 S(4) | 8.026 | 15.7 1.0 | 195 58 | 14.44 0.21 | 178 26 | |||||||
| [Ar III] | 8.991 | 27.6 | 5.28 | 62.5 1.1 | 128 16 | 19.02 0.29 | 264 12 | |||||
| [Mg VII] | 9.009 | 187 | 5.87 | 2.76 | ||||||||
| [Fe VII] | 9.527 | 99.0 | 5.74 | 9.73 0.78 | 2.27 0.17 | 298 77 | ||||||
| H2 0–0 S(3) | 9.665 | 39.25 0.96 | 200 38 | 33.05 0.29 | 170 13 | |||||||
| [S IV] | 10.51 | 34.9 | 4.75 | 220.0 1.9 | 138 16 | 49.94 0.41 | 260 6 | |||||
| MIRI/MRS Channel 3 | ||||||||||||
| H2 0–0 S(2) | 12.28 | 22.06 0.92 | 299 27 | 10.51 0.13 | 141 16 | 1.30 0.18 | ||||||
| H I 7-6 | 12.37 | 1.51 | 1.01 0.10 | 327 70 | 0.20 | |||||||
| [Ne II] | 12.81 | 21.6 | 5.80 | 222.1 3.3 | 171 23 | 112.8 1.0 | 311 6 | 8.36 0.14 | 239 25 | |||
| [Ar V] | 13.10 | 59.6 | 4.47 | 17.1 1.5 | 1.84 0.21 | 0.23 | ||||||
| [Mg V] | 13.52 | 109 | 5.70 | 2.75 | 0.22 | 0.13 | ||||||
| [Ne V] | 14.32 | 97.2 | 4.51 | 213.4 1.4 | 126 9 | 24.70 0.17 | 5.03 0.06 | 149 9 | ||||
| [Cl II] | 14.37 | 13.0 | 4.59 | 3.66 | 1.64 0.12 | 0.16 | ||||||
| [Ne III] | 15.56 | 41.0 | 5.32 | 462.5 3.2 | 154 12 | 131.3 1.1 | 280 7 | 27.68 0.33 | 191 29 | |||
| H2 0–0 S(1) | 17.03 | 20.2 2.4 | 13.35 0.66 | 3.52 0.21 | ||||||||
| MIRI/MRS Channel 4 | ||||||||||||
| [Fe II] | 17.94 | 7.9 | 4.39 | 12.1 2.1 | 311 97 | 8.35 0.21 | 366 15 | 0.33 | ||||
| [S III] | 18.71 | 23.3 | 4.07 | 218.5 1.8 | 141 18 | 60.43 0.63 | 242 10 | 12.17 0.25 | 202 34 | |||
| [Ne V] | 24.32 | 97.2 | 3.77 | 312.3 10.4 | 178 47 | 23.81 0.34 | 194 29 | 5.27 0.41 | ||||
| [O IV] | 25.89 | 54.9 | 4.00 | 1167.2 4.9 | 127.1 1.1 | 48.45 0.92 | 191 8 | |||||
| [Fe II] | 25.99 | 7.9 | 3.95 | 42.4 4.3 | 11.93 0.67 | 1.90 | ||||||
a The H2 S(1) 17.03 m transition is affected by a wavelength calibration artifact that alters the line profile of the AGN and N2 spectra but not the observed line flux (see Appendix A.1).
Appendix C Ionized and warm molecular gas velocity field
Appendix D Mid-IR [Fe ii] density diagnostics