The discovery of the 528.6 Hz accreting millisecond X-ray pulsar MAXI J1816–195
Abstract
We present the discovery of Hz pulsations in the new X-ray transient MAXI J1816–195. Using NICER, we observed the first recorded transient outburst from the neutron star low-mass X-ray binary MAXI J1816–195 over a period of 28 days. From a timing analysis of the Hz pulsations, we find that the binary system is well described as a circular orbit with an orbital period of 4.8 hours and a projected semi-major axis of light-seconds for the pulsar, which constrains the mass of the donor star to . Additionally, we observed 15 thermonuclear X-ray bursts showing a gradual evolution in morphology over time, and a recurrence time as short as 1.4 hours. We did not detect evidence for photospheric radius expansion, placing an upper limit on the source distance of kpc.
1 Introduction
Accreting millisecond X-ray pulsars (AMXPs) are rapidly rotating neutron stars that accrete matter from a binary companion (see Patruno & Watts, 2021; Di Salvo & Sanna, 2022, for reviews). The characteristic that sets these systems apart from the wider population of low-mass X-ray binary systems is that they exhibit a coherent pulsation which directly tracks the millisecond stellar rotation period of the neutron star. Such pulsations are a useful diagnostic for the accreting neutron star. For instance, the precise waveform of the pulsations encodes information about the shape of the surface emission region and the neutron star compactness, and thus its equation of state (Poutanen & Gierliński, 2003); while tracking of the pulse arrival times allows for a high precision measurement of the neutron star spin and binary ephemeris, and may in principle be used to investigate the torques acting on these millisecond pulsars (Bildsten 1998; Psaltis & Chakrabarty 1999; see Burderi et al. (2006); Hartman et al. (2008); Patruno & Watts (2021); Di Salvo & Sanna (2022) for recent discussions of different torque mechanisms that may play a role).
An enduring challenge to the study of AMXPs is that they are relatively rare. Since the discovery of pulsations from SAX J in 1998 (Wijnands & van der Klis, 1998), the population of AMXPs has grown at an average rate of under one per year. All the known AMXPs are X-ray transients, and the accretion-powered pulsations are only visible while the source is undergoing an X-ray outburst. These outbursts typically last only a few days to a few weeks, and are interspersed by several years to decades of inactivity (Lasota, 2001; Hameury, 2020). As such, the search for new accreting millisecond pulsars remains an important task.
In this letter we present the discovery of pulsations from MAXI J1816195 (henceforth MAXI J1816). This system was first discovered as a new X-ray transient with the MAXI Gas Slit Camera on 2022 June 7 (Negoro et al., 2022), and an initial source localization was provided by Swift shortly thereafter (Kennea et al., 2022a). Subsequent follow-up observations with the Neutron Star Interior Composition Explorer (NICER) on 2022 June 8 revealed the presence of pulsations (Bult et al., 2022a), identifying MAXI J1816 as an accreting millisecond pulsar.
Further monitoring with NICER revealed the 4.8 hr binary orbit of MAXI J1816 (Bult et al., 2022b). Additional Swift observations yielded an improved X-ray localization (Kennea et al., 2022b), after which likely counterparts to the X-ray source were identified in infrared (Kennea et al., 2022b), optical (de Martino et al., 2022), and radio (Beauchamp et al., 2022; Bright et al., 2022).
In the following we present the detailed analysis underpinning the NICER discovery of pulsations from MAXI J1816, and the subsequent characterization of its orbit. We describe the NICER monitoring campaign and provide a pulsar timing analysis. Further, we present an analysis of fifteen thermonuclear X-ray bursts observed from this system, and interpret the various implications from both the bursts and pulsations on the nature of MAXI J1816. An analysis of the (non-burst) X-ray spectroscopy will be presented elsewhere.
2 Observations
We have monitored the 2022 outburst of MAXI J1816 extensively with NICER. Our observations began on 2022 June 7 and continued through 2022 July 5, at which time the source intensity had decreased to the background level. These data are available under the NICER ObsIDs starting with 520282 and 553301.
The source coordinates used for instrument pointing evolved slightly over the course of the monitoring campaign. Our first two observations were collected by pointing at the NICER raster scan coordinates reported by Bult et al. (2022a). The subsequent monitoring program used the initial Swift localization of Kennea et al. (2022a) until 2022 June 30, when we switched to the corrected coordinates of Kennea et al. (2022b). These coordinates are all apart, which is much smaller than the offset angle at which the response of NICER is significantly affected111 https://heasarc.gsfc.nasa.gov/docs/nicer/analysis_threads/cal-recommend/ .
The data were processed using nicerdas version as distributed with heasoft version . To account for the small variations in the pointing coordinates, we filter the data such that the angular offset relative to the pointing coordinates is 222The default behavior of the NICER pipeline is to calculate the pointing offset relative to the source coordinates.. Otherwise, we used standard filtering criteria; we included only epochs which had an elevation angle , a bright Earth limb angle , and were outside the South Atlantic Anomaly (SAA).
After applying these filtering criteria, we were left with 92 ks clean exposure. We corrected the clean data to the solar system barycenter using the DE-430 planetary ephemeris (Folkner et al., 2014) and source coordinates of Kennea et al. (2022b).
Inspecting a time resolution light curve of both clean and unfiltered data, we readily identify 15 thermonuclear (type I) X-ray bursts. Ten of these were observed in full in the clean data, while another three were observed during SAA passages. The remaining two bursts were truncated by the boundaries of the observations.
3 Results
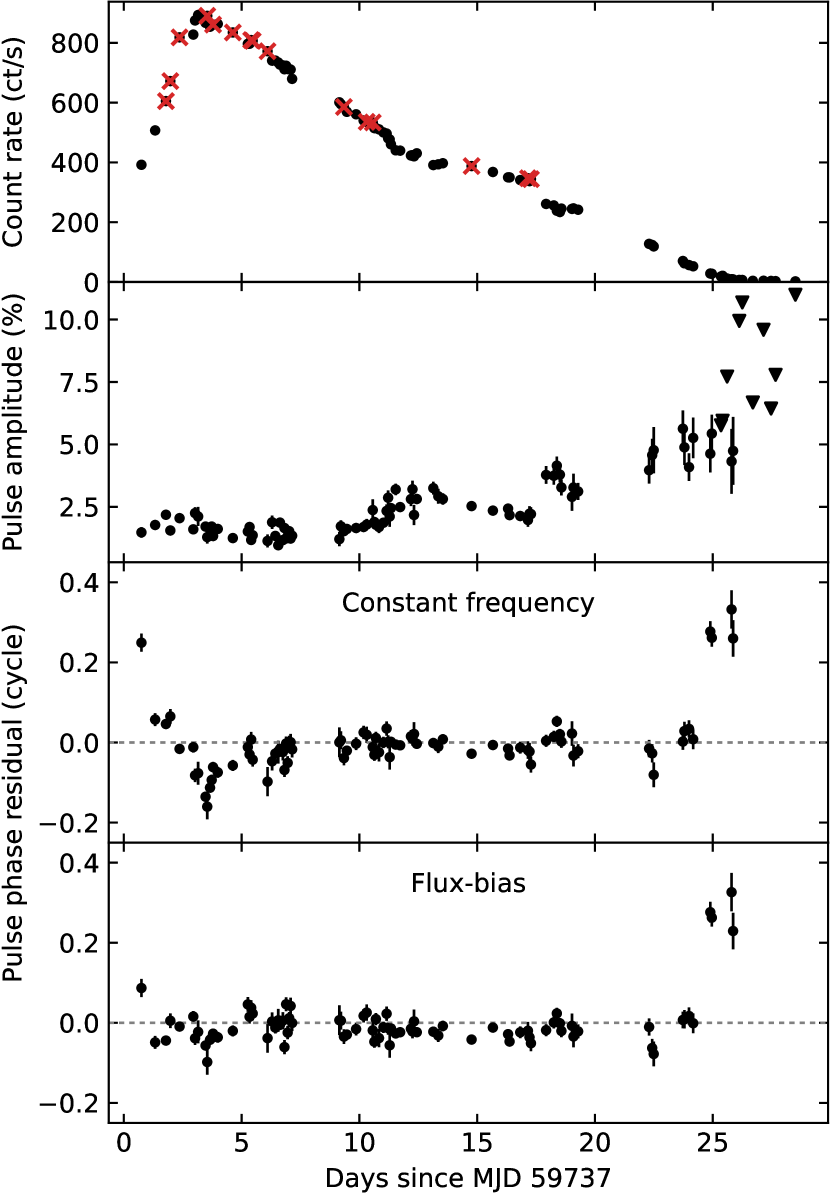
We began our analysis by considering the evolution of the outburst. We divided the data into segments of continuous pointing, finding 93 such pointings across the 28 days of monitoring with an exposure per pointing between . For each pointing we calculated the average count-rate in the band, which we show in Figure 1.
3.1 Coherent timing
We initially searched for the presence of pulsations by dividing the first observation into segments and taking the Fourier transform of each segment. Converting these transforms to an averaged power spectrum revealed a high significance () pulse signal at .
To investigate the pulse signal in greater detail, we determined the pulse frequency that optimized the score (Buccheri et al., 1983) for each pointing separately. The resulting pulse frequencies were found to show a clear periodic oscillation in time, revealing the orbit of the binary system. We fitted these frequency measurements using a sinusoid to extract an initial estimate of the orbital period, , the neutron star’s projected semi-major axis, , and the time of its passage through the ascending node, .
Based on the initial timing solution, we corrected the photon arrival times for the Doppler delays of the binary motion and then folded each pointing to a pulse profile. We fitted these profiles using a constant plus two harmonically related sinusoids, one fixed at the pulse frequency and the other at twice that frequency. Either harmonic was deemed significant if its measured amplitude was greater than three times the uncertainty, . We measured a significant amplitude for the fundamental pulsation in 83 out of 92 pointings, with the non-detections all confined to the final days of the outburst where the count-rate dropped below the background level. The second harmonic was only required in two pointings near the peak of the outburst. We proceeded by selecting the measured phases of the fundamental and converted them to pulse arrival times. These arrival times were then modeled with tempo2 (Hobbs et al., 2006), using a constant pulse frequency and a circular orbital model. We repeated this process of folding the data and fitting the pulse arrival times until the timing solution converged.
The parameters of the obtained timing solution are listed in Table 1, while the resulting pulse amplitudes and phase residuals are shown in Figure 1 (second and third panel). From the figure it is clear that the timing solution describes the decay of the outburst well, but leaves systematic residuals before d and after d.
Including a frequency derivative in the model did not meaningfully improve the quality of the fit. Instead, we found that we needed to include terms up to the fifth frequency derivative before the structural phase residuals were reduced. However, such a high-degree polynomial frequency model is plainly unphysical.
In an alternative approach, we attempted to fit the data using the flux-bias model of Bult et al. (2020). We expressed the phase model as
| (1) |
where is an arbitrary phase offset, the constant pulsar spin frequency, and the phase correction associated with the binary orbit. The final term on the right hand side adds a flux dependent phase bias with scale factor , and power law index . We adopted the count-rate as a proportional substitute for flux and set the power law index to to model the effect of a phase drift imposed by the moving magnetospheric boundary (Bult et al., 2020). This approach again only marginally improved the fit. Leaving the power law index free to vary gives the model sufficient flexibility to account for phase residuals during the outburst rise, but leaves a discrete cycle jump in phase late in the outburst. We list the parameters of this model in Table 1 and show the phase residuals in Figure 1 (fourth panel).
Finally, we investigated the energy dependence of the pulse waveform. We divided the energy range into 50 bins, such that each bin contains a roughly equal number of photons. For each energy bin we folded the entire dataset to a pulse profile using the flux-bias timing model and measured the amplitude and phase of the fundamental pulsation. We found that the pulse phase remained constant across all energy bins within measurement uncertainties, while the fractional amplitude increases linearly with energy from at to at .
=-0.30in Parameter Value Uncertainty Epoch (MJD) 59750 (d) 0.20141878 5 (lt-s) 0.262949 1.4 (MJD) 59738.8756284 2.7 Eccentricity Constant frequency model (Hz) 528.611105819 1.0 / dof 2167 / 78 Flux-bias model (Hz) 528.611105950 1.4 (cycles/rateΓ) 4.7 5 1.2 0.2 / dof 213 / 72
3.2 X-ray bursts
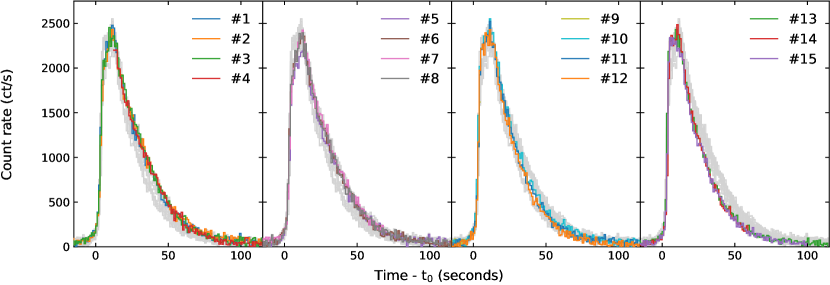
We observed 15 type I X-ray bursts from MAXI J1816, all with very similar profiles. To characterize these profiles we manually determined the burst onset, , measured the rise time as the time from onset to the peak of the time resolution light curve, and measured the exponential decay timescale between (see Table 2). The light curves of bursts through are almost identical, with a rise time of about and an exponential decay timescale of about s. As the outburst progressed the X-ray burst profiles showed a modest shift in shape toward faster rise times and shorter decay times. This effect is illustrated in Figure 2.
We investigated the energetics of the X-ray bursts through a time-resolved spectroscopic analysis. First we extracted a preburst spectrum from (except for burst , where we used the final of the pointing). We then extracted time-resolved spectra from the X-ray bursts by dynamically dividing the burst epochs into multiples of , such that each temporal bin contained at least events.
We modeled the X-ray burst spectra in the energy range using xspec version 12.12 (Arnaud, 1996). Subtracting the preburst emission as background, we described each burst spectrum as an absorbed blackbody (tbabs * bbodyrad). This model provided statistically acceptable values throughout each X-ray burst. The average absorption column density is , while the typical peak blackbody temperature and normalization are and at 10 kpc, respectively. None of the observed X-ray bursts showed evidence for photospheric radius expansion or spectral lines. In Table 2 we list the bolometric blackbody fluence and peak flux measured in each burst.
While a simple blackbody model is sufficient for individual bursts, we note that the best-fit values show a systematic increase around the peak intensity of each X-ray burst. This suggests that the persistent emission may be modestly affected by the burst flux. Indeed, if we fit the spectra at the peak of each X-ray burst jointly with the blackbody temperature and normalization tied across all bursts, then we find that an absorbed blackbody spectrum no longer provides a sufficient description of the data. As an alternative model, we adopt the so-called method (Worpel et al., 2013). We generated a background spectrum for each preburst spectrum using the NICER 3C50 background model (Remillard et al., 2022) and modeled each of the preburst spectra using an absorbed disk blackbody plus a thermally Comptonized continuum (nthcomp, Zdziarski et al. 1996; Życki et al. 1999). Finally, the X-ray burst spectra were modeled using an absorbed blackbody plus the preburst model, where the preburst component was multiplied with a variable factor, . This approach improved the dof from 985/863 to 945/862 (factor 10 improvement in the p-value) with at peak burst intensity.
=-1.00in ID ObsID MJD Note Fluence Peak flux Rise (TDB) ( erg/cm2) ( erg/s/cm2) (s) (s) (s) 1 5533010101 59738.793937 2 5533010101 59738.976061 SAA 3 5533010102 59739.366594 4 5533010103 59740.537525 Tail - - 5 5533010103 59740.790575 6 5533010104 59741.633451 7 5533010105 59742.413764 SAA 8 5533010105 59742.470702 9 5533010106 59743.103625 Rise - - 10 5533010801 59746.344881 SAA 11 5533010901 59747.308052 12 5533010901 59747.567004 13 5533011301 59751.757114 14 5533011601 59754.160772 15 5533011601 59754.288382
3.2.1 Burst recurrence time
Dividing the total unfiltered exposure (111 ks) by the number of detected X-ray bursts, we estimate the average burst recurrence time at . This average is close to the actual spacing observed between X-ray bursts: we find bursts and are separated by , while bursts and are separated by .
MAXI J1816 was also observed with NuSTAR on 2022 June 23 (MJD 59753, Chauhan et al., 2022). This NuSTAR observation contains four X-ray bursts, the first two of which were not observed with NICER and the latter two being and in our sample. This train of four X-ray bursts observed with NuSTAR is consistent with a regular recurrence time of , while a shorter recurrence time for these bursts () is ruled out by the joint NICER and NuSTAR coverage. Hence, these results suggest that MAXI J1816 is a regular burster with a recurrence time that lengthens over the course of the outburst.
The factor is defined as the ratio of the persistent fluence over the burst fluence (Galloway et al., 2020), and can be estimated as
| (2) |
where is the bolometric flux of the persistent emission, the time between successive X-ray bursts and the fluence of the burst. We estimate the by adding a cflux component to the persistent spectra and measuring the flux between , while we obtain the burst fluence from the time-resolved spectroscopy. For the three X-ray bursts with a reliable measurement of the recurrence time (, and ) we find values of 46, 58, and 61 (respectively).
3.2.2 Burst oscillations
To search the X-ray bursts for the presence of coherent burst oscillations, we employed a sliding window search method. For each X-ray burst, we constructed a light curve at time resolution and applied a window to this light curve of duration . We then moved the window across the light curve in steps of . At each window position we calculated the power density spectrum and searched for single bin powers between that exceeded the detection threshold calculated from the counting noise distribution (correcting for the number of trials; the number of windows times the number of powers per window). We applied this search strategy using all events in the energy range. No burst oscillation candidates were found.
4 Discussion
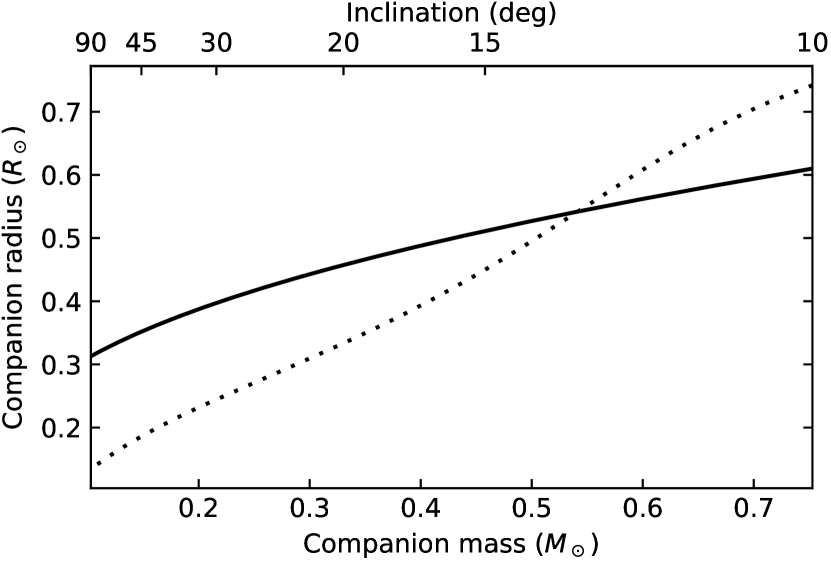
We have presented the discovery of pulsations from MAXI J1816. Through a timing analysis of the pulsations, we measured the binary ephemeris reported in Table 1. From this ephemeris we find that the pulsar mass function is , implying a minimum companion mass of for a canonical neutron star.
If we assume that the companion star fills its Roche Lobe, we can use the Roche lobe radius (Eggleton, 1983) to calculate both the mass and radius of the companion star as a function of the binary inclination. This empirical mass-radius relation intersects with the theoretical mass-radius relation for a zero-age main-sequence star (Tout et al., 1996) at a companion mass of (Figure 3). If the companion star is evolved or ablated by the irradiation of the compact object, however, it will tend to a larger radius for the same stellar mass, which means that we can treat this intersection as an upper limit on the companion mass. Indirectly, this mass limit then implies a lower limit on the binary inclination of .
We found that the pulse phase shows a complex evolution with time. The greater part of the observed outburst, between d, could be modeled using a constant pulse frequency model. Outside this time range the pulse phase shows systematic residuals relative to the model. Similar structural patterns in the phase residuals have been observed in a number of other AMXPs (Burderi et al., 2007; Hartman et al., 2008; Patruno et al., 2009; Bult et al., 2020; Sanna et al., 2020). The common explanation for this behavior is that either the accretion torque is measurably changing the stellar spin frequency over the course of the outburst, or that the hotspot position on the stellar surface is not fixed, but shifts in response to the changing accretion geometry. Of course these effects are not exclusive, and could both be contributing factors.
For MAXI J1816 we were able to account for the phase residuals observed during the outburst rise by employing a flux-bias model for the pulsar phase. Interestingly, this model prefers a power law index of , which is a shallower dependence than the expected from a phase drift imposed through a cumulative accretion torque (Sanna et al., 2020). Yet, this index is not consistent with the hotspot position changes predicted from numerical simulations of accreting pulsars either (Kulkarni & Romanova, 2013). Hence, if the hotspot is moving, its phase bias is not driven by the changing radius of the magnetosphere, but instead nearly proportional to intensity and thus the mass accretion rate.
Even with the flux-bias model, we could not account for a discrete cycle jump in the pulse phase observed in the final day of the outburst. Similar late-time phase jumps have been observed from SAX J1808.4–3658 (Burderi et al., 2006; Hartman et al., 2008), and have been attributed to a viewing geometry driven by the receding accretion disk (Ibragimov & Poutanen, 2009). Given that the phase jump in MAXI J1816 occurs right before the source drops below the detection level, it is plausible that a similar mechanism may be at play here.
4.1 Constraints from the X-ray bursts
We found that all observed X-ray bursts showed a very similar evolution, both in light curve and in their spectroscopy. The burst durations and values point to ignition in a hydrogen rich environment (Lewin et al., 1993; Galloway & Keek, 2021), indicating that the accreted material and thus the donor star must be hydrogen rich. The peak fluxes are consistent within errors, with an average of . Depending on the hydrogen abundance in the burst fuel, the expected Eddington luminosity is (Kuulkers et al., 2003), which yields an upper limit on the distance of . The lower end of this range is associated with hydrogen rich bursts, and is therefore preferred.
For three of the observed X-ray bursts we obtained a reliable measurement for , finding that this factor increases from for burst to about for bursts and . Such evolution usually indicates a shift in the average hydrogen abundance of the burst fuel (Galloway et al., 2004), which would be consistent with the smaller fluence and decay timescale seen in later bursts. Specifically, if we assume that all accreted matter burns during an X-ray burst, then follows from theory as (Galloway et al., 2020)
| (3) |
where is the gravitational binding energy, the nuclear energy released by accreted matter (Goodwin et al., 2019) (with the average hydrogen abundance in the burst fuel), the gravitational redshift, and the ratio of the burst and disk anisotropy (Fujimoto, 1988). If the CNO cycle is stably burning hydrogen between the X-ray bursts then shorter recurrence times give a higher and thus a higher energy release per accreted nucleon (Galloway & Keek, 2021). For solar abundances the observed increase in recurrence time would then increase by about 10%, well short of what is needed to explain the observations. This suggests that some additional physical process is gradually changing the ignition condition either as a function of time or mass accretion rate. Whether that missing piece relates to an evolving accretion geometry, an inertia in the burst train (Woosley et al., 2004; Johnston et al., 2018), a temperature evolution in the neutron star crust (Chenevez et al., 2011), or perhaps some mixing effect related to the ignition latitude (Cavecchi et al., 2020) remains an open question.
References
- Arnaud (1996) Arnaud, K. A. 1996, in Astronomical Society of the Pacific Conference Series, Vol. 101, Astronomical Data Analysis Software and Systems V, ed. G. H. Jacoby & J. Barnes, 17
- Beauchamp et al. (2022) Beauchamp, I., et al. 2022, The Astronomer’s Telegram, 15481, 1
- Bildsten (1998) Bildsten, L. 1998, ApJ, 501, L89, doi: 10.1086/311440
- Bright et al. (2022) Bright, J., et al. 2022, The Astronomer’s Telegram, 15484, 1
- Buccheri et al. (1983) Buccheri, R., Bennett, K., Bignami, G. F., et al. 1983, A&A, 128, 245
- Bult et al. (2020) Bult, P., Chakrabarty, D., Arzoumanian, Z., et al. 2020, ApJ, 898, 38, doi: 10.3847/1538-4357/ab9827
- Bult et al. (2022a) Bult, P. M., Ng, M., Altamirano, W. I. D., et al. 2022a, The Astronomer’s Telegram, 15425, 1
- Bult et al. (2022b) Bult, P. M., Sanna, A., Ng, M., et al. 2022b, The Astronomer’s Telegram, 15431, 1
- Burderi et al. (2006) Burderi, L., Di Salvo, T., Menna, M. T., Riggio, A., & Papitto, A. 2006, ApJ, 653, L133, doi: 10.1086/510666
- Burderi et al. (2007) Burderi, L., Di Salvo, T., Lavagetto, G., et al. 2007, ApJ, 657, 961, doi: 10.1086/510659
- Cavecchi et al. (2020) Cavecchi, Y., Galloway, D. K., Goodwin, A. J., Johnston, Z., & Heger, A. 2020, MNRAS, 499, 2148, doi: 10.1093/mnras/staa2858
- Chauhan et al. (2022) Chauhan, J., et al. 2022, The Astronomer’s Telegram, 15470, 1
- Chenevez et al. (2011) Chenevez, J., Altamirano, D., Galloway, D. K., et al. 2011, MNRAS, 410, 179, doi: 10.1111/j.1365-2966.2010.17433.x
- de Martino et al. (2022) de Martino, D., et al. 2022, The Astronomer’s Telegram, 15479, 1
- Di Salvo & Sanna (2022) Di Salvo, T., & Sanna, A. 2022, in Astrophysics and Space Science Library, Vol. 465, Astrophysics and Space Science Library, ed. S. Bhattacharyya, A. Papitto, & D. Bhattacharya, 87–124, doi: 10.1007/978-3-030-85198-9_4
- Eggleton (1983) Eggleton, P. P. 1983, ApJ, 268, 368, doi: 10.1086/160960
- Folkner et al. (2014) Folkner, W. M., Williams, J. G., Boggs, D. H., Park, R. S., & Kuchynka, P. 2014, Interplanetary Network Progress Report, 42-196, 1
- Fujimoto (1988) Fujimoto, M. Y. 1988, ApJ, 324, 995, doi: 10.1086/165955
- Galloway et al. (2004) Galloway, D. K., Cumming, A., Kuulkers, E., et al. 2004, ApJ, 601, 466, doi: 10.1086/380445
- Galloway & Keek (2021) Galloway, D. K., & Keek, L. 2021, Astrophysics and Space Science Library, 461, 209, doi: 10.1007/978-3-662-62110-3_5
- Galloway et al. (2020) Galloway, D. K., in’t Zand, J., Chenevez, J., et al. 2020, ApJS, 249, 32, doi: 10.3847/1538-4365/ab9f2e
- Goodwin et al. (2019) Goodwin, A. J., Heger, A., & Galloway, D. K. 2019, ApJ, 870, 64, doi: 10.3847/1538-4357/aaeed2
- Hameury (2020) Hameury, J. M. 2020, Advances in Space Research, 66, 1004, doi: 10.1016/j.asr.2019.10.022
- Hartman et al. (2008) Hartman, J. M., Patruno, A., Chakrabarty, D., et al. 2008, ApJ, 675, 1468, doi: 10.1086/527461
- Hobbs et al. (2006) Hobbs, G. B., Edwards, R. T., & Manchester, R. N. 2006, MNRAS, 369, 655, doi: 10.1111/j.1365-2966.2006.10302.x
- Ibragimov & Poutanen (2009) Ibragimov, A., & Poutanen, J. 2009, MNRAS, 400, 492, doi: 10.1111/j.1365-2966.2009.15477.x
- Johnston et al. (2018) Johnston, Z., Heger, A., & Galloway, D. K. 2018, MNRAS, 477, 2112, doi: 10.1093/mnras/sty757
- Kennea et al. (2022a) Kennea, J. A., Evans, P. A., & Negoro, H. 2022a, The Astronomer’s Telegram, 15421, 1
- Kennea et al. (2022b) —. 2022b, The Astronomer’s Telegram, 15467, 1
- Kulkarni & Romanova (2013) Kulkarni, A. K., & Romanova, M. M. 2013, MNRAS, 433, 3048, doi: 10.1093/mnras/stt945
- Kuulkers et al. (2003) Kuulkers, E., den Hartog, P. R., in’t Zand, J. J. M., et al. 2003, A&A, 399, 663, doi: 10.1051/0004-6361:20021781
- Lasota (2001) Lasota, J.-P. 2001, New Astronomy Reviews, 45, 449
- Lewin et al. (1993) Lewin, W. H. G., van Paradijs, J., & Taam, R. E. 1993, Space Sci. Rev., 62, 223, doi: 10.1007/BF00196124
- Negoro et al. (2022) Negoro, H., Serino, M., Iwakiri, W., et al. 2022, The Astronomer’s Telegram, 15418, 1
- Patruno & Watts (2021) Patruno, A., & Watts, A. L. 2021, in Astrophysics and Space Science Library, Vol. 461, Astrophysics and Space Science Library, ed. T. M. Belloni, M. Méndez, & C. Zhang, 143–208, doi: 10.1007/978-3-662-62110-3_4
- Patruno et al. (2009) Patruno, A., Wijnands, R., & van der Klis, M. 2009, ApJ, 698, L60, doi: 10.1088/0004-637X/698/1/L60
- Poutanen & Gierliński (2003) Poutanen, J., & Gierliński, M. 2003, MNRAS, 343, 1301, doi: 10.1046/j.1365-8711.2003.06773.x
- Psaltis & Chakrabarty (1999) Psaltis, D., & Chakrabarty, D. 1999, ApJ, 521, 332, doi: 10.1086/307525
- Remillard et al. (2022) Remillard, R. A., Loewenstein, M., Steiner, J. F., et al. 2022, AJ, 163, 130, doi: 10.3847/1538-3881/ac4ae6
- Sanna et al. (2020) Sanna, A., Burderi, L., Gendreau, K. C., et al. 2020, MNRAS, 495, 1641, doi: 10.1093/mnras/staa1253
- Tout et al. (1996) Tout, C. A., Pols, O. R., Eggleton, P. P., & Han, Z. 1996, MNRAS, 281, 257, doi: 10.1093/mnras/281.1.257
- Wijnands & van der Klis (1998) Wijnands, R., & van der Klis, M. 1998, ApJ, 507, L63, doi: 10.1086/311676
- Woosley et al. (2004) Woosley, S. E., Heger, A., Cumming, A., et al. 2004, ApJS, 151, 75, doi: 10.1086/381533
- Worpel et al. (2013) Worpel, H., Galloway, D. K., & Price, D. J. 2013, ApJ, 772, 94, doi: 10.1088/0004-637X/772/2/94
- Zdziarski et al. (1996) Zdziarski, A. A., Johnson, W. N., & Magdziarz, P. 1996, MNRAS, 283, 193
- Życki et al. (1999) Życki, P. T., Done, C., & Smith, D. A. 1999, MNRAS, 309, 561, doi: 10.1046/j.1365-8711.1999.02885.x