Clustering Optimisation Method for Highly Connected Biological Data
Abstract
Currently, data-driven discovery in biological sciences resides in finding segmentation strategies in multivariate data that produce sensible descriptions of the data. Clustering is but one of several approaches and sometimes falls short because of difficulties in assessing reasonable cutoffs, the number of clusters that need to be formed or that an approach fails to preserve topological properties of the original system in its clustered form. In this work, we show how a simple metric for connectivity clustering evaluation leads to an optimised segmentation of biological data.
The novelty of the work resides in the creation of a simple optimisation method for clustering crowded data. The resulting clustering approach only relies on metrics derived from the inherent properties of the clustering. The new method facilitates knowledge for optimised clustering, which is easy to implement.
We discuss how the clustering optimisation strategy corresponds to the viable information content yielded by the final segmentation. We further elaborate on how the clustering results, in the optimal solution, corresponds to prior knowledge of three different data sets.
keywords:
Clustering , Connectivity , Unimodal Optimisation , Dimensionality Reduction , Statistical Learning , Hierarchical Agglomerative Clustering1 Introduction
One key feature of biological data is the excessive amount of viable information. Real-world systems describing a simple cellular or biochemical process are often large, containing many active reagents in a crowded environment [10, 2, 9, 26]. Depending on the nature of the interactions belonging to the constituents of such a system various dimensionality reduction techniques can be employed to coarse grain the system and reduce the complexity of the studied problem [19, 17]. Determining an optimal number of clusters for more in-depth analysis or visualisation is an open problem with many different solutions [16, 12, 21, 20]. Here, we present a simplified optimisation approach and algorithms to achieve this task.
We employ clustering with a naming scheme where clustering segmentation produced via ’connection clustering’, see methods, is referred to as Connectivity Clustering Algorithms (CCA) and ’linkage’ based clustering, commonly employed in Agglomerative Hierarchical Clustering (AHC) [28], is referred to as Link Clustering Algorithms (LCA) [23]. CCA constitutes a point evaluation of the system distance matrix for a single distance cutoff ( and ) while LCA evaluates the linkage matrix describing the entire hierarchy. Here describes all the pairwise distances between the parts of the entire system. CCA will let you determine if distance matrix indices are connected at some distance or not. The connection-based methods establish the number of clusters in the binary Neighbour matrix without constructing an intermediate linkage matrix.
The Neighbour matrix is defined here as the pairwise distance between the parts and of the system () with an applied cutoff () and is related to the adjacency matrix from graph theory by adding an identity matrix to the adjacency matrix (). The three boolean matrices that describe a system at some distance cutoff () are: the Identity matrix (), the Adjacency matrix () and the Community matrix (). We note that summing the three matrices will return for any pair. CCA determines the number of clusters by traversing and evaluates if there is any true overlap for a specific distance cutoff. Publically available CCA methods include the connectivity Algorithm 1 in the methods section as well as the Density-Based Algorithm for Discovering Clusters (DBSCAN) [5, 19] without point rejections.
Linkage algorithms determine the number of clusters for all unique distances by forming the linkage matrix reducing and ignoring some connections to already linked constituents of the system in accord with a chosen heuristic. A Linkage algorithm is not an unambiguous treatment of a system [6] where all the true connections in it are important, such as in a molecular water bulk system, when you want all your quantum-mechanical water molecules to be treated at the same level of theory based on their connectivity at a specific distance. If you are doing statistics on a complete hierarchy then this distinction is not important. You can construct hierarchies from both algorithm types but a connection algorithm, without point rejection criteria, will always produce a unique and well-determined structure while the link algorithms will be unique but structurally dependent on how ties are resolved and which heuristic is employed for construction. The connection hierarchy is exact and unique, but slow to construct, while the link hierarchies are heuristic dependent, but fast to construct. The Linkage algorithms are more efficient at creating a hierarchy based on a distance matrix representation of the data but can be thought of as throwing away information at every linking step. The full link algorithm determines the new cluster distance to the rest of the unclustered points in a self-consistent fashion by employing two different heuristics. Minimal distances for assigning a cluster link are determined by finding the minimum non-diagonal element in the distance matrix and the new link group distance to all remaining points are determined using the second heuristic. Using simple linkage, or value distance assignment, ensures that the same heuristic is employed both when finding links as well as when assigning the link group to system distances. We will see that it will also produce an equivalent clustering as compared to the one deduced by a connection algorithm for a specific distance . Except for some of the cases when there are distance ties in the link evaluation. This is a computational quirk that does not affect ’connection’ based hierarchy construction.
For a specific we have cluster segments ( and ) with parts in each for a system comprised of parts. Furthermore, for a given minuscule , the clustering segmentation is exactly all the parts of the system (, ). In the same fashion for a huge the entire system resides in a single cluster (, ). It is clear that the number of clusters describing the system is a monotonically decreasing function of while the average size of the clusters is a monotonically increasing function of . We define the two functions as
| (1) |
for the decreasing function and
| (2) |
for the increasing function.
To deduce an informative clustering cutoff we form the function defined as
| (3) |
We note that both functions (, ) contain complementary information and that obtains the maximal value inside the interval. Since the function is unimodal we can conduct a Golden Ratio Search (GRS) [11] to find the optimal . Changing the type of function into any quantile value function, a or function should not change the unimodality of the geometric function. If we chose to employ a () value function then the optimum should be pushed to a larger value while the valued () should in general yield a smaller solution as compared to the mean. For highly structured data, with an extremely peaked distribution of pairwise distances, these assumptions are not true. One such example is an ideal graphene mesh. The ideal graphene bond distances are the same for every connection in the hexagonal mesh. The heuristic function will be a Heaviside function jumping from to at a single distance while the will have the opposite behaviour. This is symmetric for the entire system and will thereby yield a function response without structure and not exhibit any modality. For systems with a small persisting cluster of only a single constituent until the very last step will result in a unimodal , but the mode will be a global minimum.
To calculate a compositional specificity metric of a cluster to non-binary multiclass labelled targets belonging to analytes in with label counts , we employ a metric defined by :
| (4) |
Another such metric is the specificity [13], but we refrain from using it since it is not well defined for clustering solutions where there exist clusters with only one part. Here corresponds to the maximum value of the label counts in the vector .
It is clear that a linkage method is more efficient for constructing complete agglomerative hierarchies while a single ‘connectivity‘ the calculation might be more efficient if you only want the clusters at a predetermined distance. Searching for an optimal distance cutoff for the cluster representation will also be heuristic dependent. However using this approach, with and functions as CCA heuristics for the metric, finding an optimal becomes a unimodal optimisation problem.
2 Method
For any data set we first construct the distance matrix using a distance measure and data axes, such as a euclidian distance or a spearman correlation distance [24] between all parts of interest in the data set. For molecular water, this is usually the euclidian distance between the atomic positions. For a microarray dataset, it can be a correlation () distance () between the transcripts sample positions. In this work, we have chosen to employ euclidian pairwise distance metrics for all the studied data sets.
Given that there exists a segmentation of the system decomposed of clusters so that the entire system is encoded into cluster parts in accord with Algorithm 1: CCA 333 The CCA, Connectivity algorithm have been implemented by the author in the publically available Python package ’impetuous-gfa’ then Algorithm 2: GRS444 One such search function has been implemented by the author in the publically available Python ’impetuous-gfa’ package in the ’optimisation’ module. ensures that we always find the optimum for a unimodal function. We use the heuristics of the CCA given by Equations 1 and 2 which are transformed into a unimodal function by Eq. 3.
We consistently employ an algorithm annotation scheme where subscripts denote index positions in the tensor of interest and where or denotes the number of elements in along its first axis.
We have chosen three data sets. The first is a small molecular water system in the liquid state [1] containing H2O and a single Hydronium ion. The system is a single time frame of a CPMD [3] water simulation555http://www.theochem.ruhr-uni-bochum.de/ legacy.akohlmey/files/32spce-h3op-1ns.xyz. The second set contain microarray transcript readings of adipocytes with accession information: Expression profiling in adipocytes of obese humans (GSE2508), that employed the platform, describing obese and lean men and women [15]. The third data is the first Modified National Institute of Standards and Technology (MNIST) digit images [14]666http://yann.lecun.com/exdb/mnist/.
For all three data sets the full AHC solutions, employing single linkages, were also computed for comparison. The water coordinates were used as is while the two larger data sets were processed by transforming to standardised values, by removing the mean and dividing with the standard deviation across samples or pixels. The microarray and digits were further transformed using Uniform Manifold Approximation and Projection (UMAP) [17] prior to clustering.
The microarray transcripts were also analysed using a two-way ANalysis Of VAriance (ANOVA) [22, 8] modulation for the body type class and biological sex. The significance for body type p-values was employed while sex was considered as a blocking variable. The generated p-values were adjusted using q-value rank correction [25] and used as input to calculate cluster significances. Cluster significances were determined by using a Fisher exact test [7] where all analytes with q-values were considered significant. The data consists of significant analytes , analytes in a cluster , insignificant analytes and analytes not in the cluster . The contingency table () was populated by the amount of significant analytes in the cluster (), significant not in the cluster (), insignificant in the cluster () and all non significant analytes not in the cluster (). The top cluster transcripts were further analysed using the STRING Database 222https://string-db.org/ (string-db) [26] for context.
We did not train a model to infer digits depending on the standardised image data but only describe the cluster content of the optimal solution. The MNIST data clusters were subjected to compositional analysis and benchmarked with the metric (Equation 4).
3 Results
We confirmed that CCA were numerically equivalent to LCA employing single linkage construction. The DBSCAN method without point rejections produced identical clustering solutions with equivalent clustering labels for all distances checked as compared to suggested with (Algorithm 1) and LCA (with single linkage) for the water system.
| Water | 1.782 | 17 | 1.836 | 11 | 1.132 | 33 |
| Pima | 0.0630 | 1313 | 0.0961 | 110 | 0.1688 | 3 |
| MNIST | 0.04713 | 3388 | 0.09573 | 188 | 0.45622 | 6 |
3.1 The Water coordinates
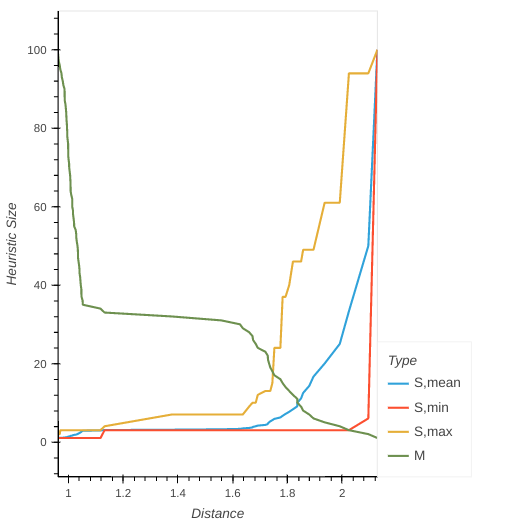
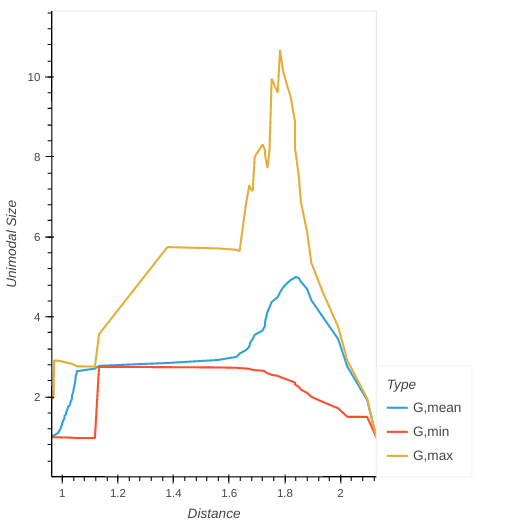
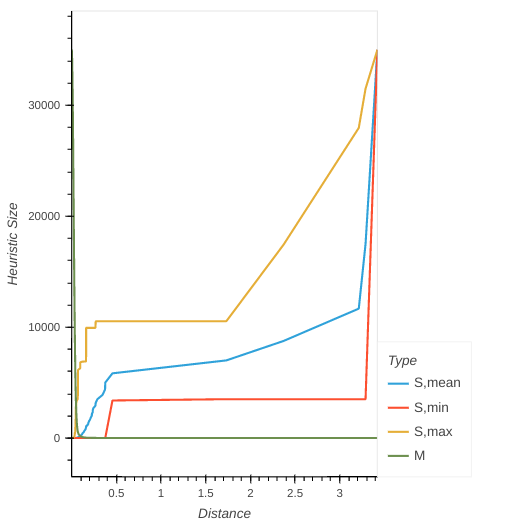
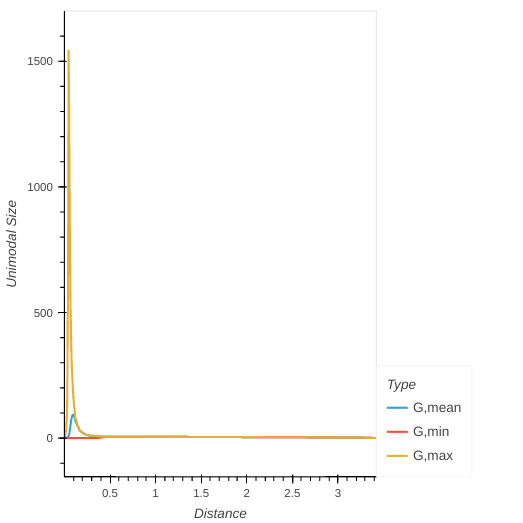
In Figure 1(a) we note that the heuristic increases early and persists through much of the interval. This causes the function in Figure 1(b) to obtain an early max shifted closer to the smallest distances than the mean. Liquid molecular water is structured and forms hydrogen bonds with its four tetrahedral neighbouring water molecules at distances smaller than [Å]. The atomic hydrogen is bound to the oxygen at distances smaller than [Å] and we expect hydrogen reactions between different water molecules to occur in the range [Å]. We observe that our results, in Table 1, for the optimal clustering solutions are all in this range. It is also clear from the heuristic in, Figure 1(a), that going to larger distances would cause the entire system to become connected in a single cluster.
Using the metric our unimodal function retains a single water molecule cluster as the heuristic reference through most of the search range and is the reason for the early jump in the . The heuristic is also flat in a large range starting from the mean O-H position until the first atom species position of the first coordinating water molecule. This causes the to obtain its extremum early and clustering at this distance causes the system to decompose into complete water molecules and a single Hydronium molecule.
Both the and the solutions obtain similar and form cluster sizes of and segments respectively. One corresponds to the Hydronium centred cluster with 3 and 6 coordinating water molecules respectively as well as several smaller clusters with fewer water molecules. This is the expected outcome since the polarising Hydronium ion will cause a locally denser liquid medium in its first coordination shell [27].
3.2 The Pima data
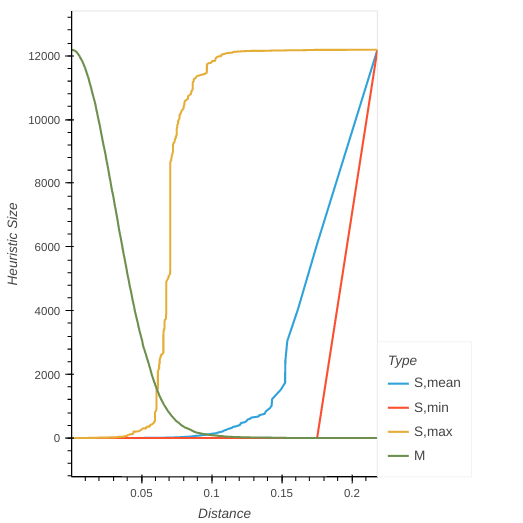
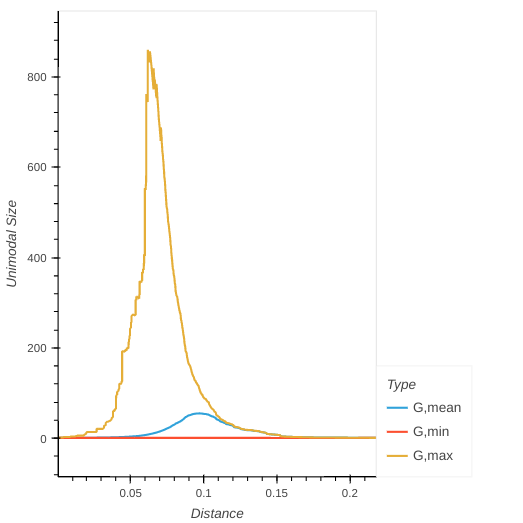
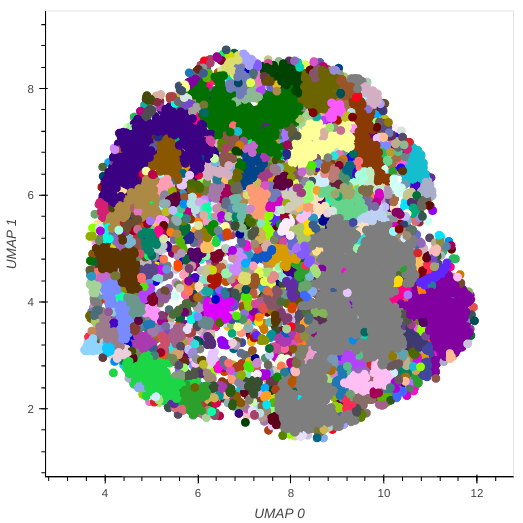
The optimisation protocol was evaluated for and generating successively fewer , see Figure 2(b). The optimisation generated a single cluster with transcripts and two smaller clusters with a single transcript in each. This rendered the decomposition uninformative. The optimisation result was caused by the outlier transcripts causing the persistent single component clusters to form. The fast decay of the total number of clusters causes the to obtain a late minimum extremum. The other two solutions, and both obtain early optima with a larger number of clusters. The solution contains a single huge cluster and several smaller single or few transcript clusters. The solution contains several larger clusters and many trailing few component clusters. The optimal clustering results are visible in Figure 4.
Since the microarray data has annotated groups, for all the samples, we assessed how well the cluster formation corresponded to traditional ANOVA results. While the clustering metrics by themselves clearly show that the useful solutions correspond to the and solution. The evaluation of enrichment for significant transcripts explaining the lean-obesity variation showed that the had the largest amount of significant clusters. The dependent solution results in significant (q-value ) cluster with a huge amount of transcripts while the solution correspond to significant clusters with sizes in the range . The cluster with the highest significance contains transcripts. The corresponding protein coding activity can be assessed via string-db and relate to: extracellular response to stimulus and organic substances, rheumatoid arthritis [2] as well as abnormal MAPK/ERK pathway signalling [10], which can lead to uncontrolled growth [4]. Changes to cytokine signalling, inflammation and immune system response [9] were also enriched for the cluster. These results are in line with common knowledge of the expressions of obesity [18] and prior knowledge for this data set [15].
3.3 The MNIST digits
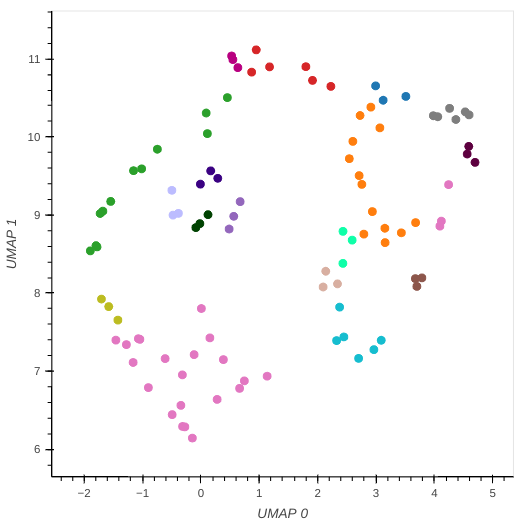
The UMAP transformation of the standardised MNIST images obtains a clear structure, see Figure 4(c), belonging to the solution in Figure 3(b).
The dependent solution forms a large number of clusters with high specificity to specific targets, as calculated with Equation 4. The top most specific clusters, exhibiting specificity above , all contain around to images each but are also redundant in that several digits reappear in several clusters and that the digit is missing. It appears at in a cluster with 237 images. The downside of this solution is a large number of clusters with which corresponds to of the entire data set.
Both of the solutions corresponding to the choices and are more similar as compared to the dependent solution. The dependent solution forms clusters, see Table 1. Of which has a specificity of over corresponding to the digits . The remaining clusters have specificities of and and are comprised of the digits and respectively. The low specificity of the two larger mixed clusters means that almost of the data segmentation can be assumed to be unreliable.
For the solution the number of clusters is large but there are only clusters with specificity above of which have sizes above images each. The largest cluster has obtained the lowest specificity of and is dominated by the digits . The remaining clusters contain the digits with specificities above . The data set clustering with is more exhaustive in that less than of the data has specificity lower than .
4 Conclusion and Result summary

In this work, we evaluated different metrics for unimodal optimisation for determining cluster segments. All the studied metrics resulted in connectivity-based clustering results that corresponded to different distance cuts through a AHC using single linkage. The optimisation strategy determined the global extremum in all the tested cases. The optimisation method suggests a distance cutoff using only the metrics from the distance matrix and the connectivity clustering results.
The choice for the function value has got a large influence on the optimal solution. For the water system using resulted in segments corresponding to the molecules in the system while the larger and resulted in chemical environments consisting of several complete molecules.
The remaining data sets both had labels corresponding to either feature targets or sample descriptor labels for the MNIST and Pima data sets respectively. This facilitated further evaluation of the usefulness of the clustering solutions. The MNIST data obtained the most informative clustering solution using the heuristic. The Pima data set is the densest and obtained significant and informative clusters by employing the heuristic.
5 Discussion
For denser data, the heuristic function probably needs to correspond to larger quantile value functions to yield a useful decomposition. For microarray and Ribonucleic Acid (RNA) sequencing data the or a high quantile value function is the suggested heuristic for finding a useful optimal cut. This method will not work well with highly structured data, where the system is entirely connected at one distance, but functions as expected when the data is connected via an ensemble of distances. Then finding a useful cluster representation for visualizing the data becomes a simple optimisation task.
References
- Allen and Tildesley [1994] M. P. Allen and D. J. Tildesley. Computer simulation of liquids. Clarendon press, Oxford, 1994. ISBN 978-0-19-855645-9.
- Ashburner et al. [2000] M. Ashburner, C. A. Ball, J. A. Blake, D. Botstein, H. Butler, J. M. Cherry, A. P. Davis, K. Dolinski, S. S. Dwight, J. T. Eppig, M. A. Harris, D. P. Hill, L. Issel-Tarver, A. Kasarskis, S. Lewis, J. C. Matese, J. E. Richardson, M. Ringwald, G. M. Rubin, and G. Sherlock. Gene Ontology: tool for the unification of biology. Nature Genetics, 25(1):25–29, May 2000. ISSN 1061-4036, 1546-1718. doi: 10.1038/75556.
- Car and Parrinello [1985] R. Car and M. Parrinello. Unified Approach for Molecular Dynamics and Density-Functional Theory. Physical Review Letters, 55(22):2471–2474, Nov. 1985. ISSN 0031-9007. doi: 10.1103/PhysRevLett.55.2471.
- Downward [2003] J. Downward. Targeting RAS signalling pathways in cancer therapy. Nature Reviews Cancer, 3(1):11–22, Jan. 2003. ISSN 1474-175X, 1474-1768. doi: 10.1038/nrc969.
- Ester et al. [1996] M. Ester, H.-P. Kriegel, J. Sander, and X. Xu. A density-based algorithm for discovering clusters in large spatial databases with noise. In Proceedings of the Second International Conference on Knowledge Discovery and Data Mining, KDD’96, page 226–231. AAAI Press, 1996.
- Fernández and Gómez [2008] A. Fernández and S. Gómez. Solving Non-Uniqueness in Agglomerative Hierarchical Clustering Using Multidendrograms. Journal of Classification, 25(1):43–65, June 2008. ISSN 0176-4268, 1432-1343. doi: 10.1007/s00357-008-9004-x.
- Fisher [1922] R. A. Fisher. On the Interpretation of from Contingency Tables, and the Calculation of P. Journal of the Royal Statistical Society, 85(1):87, Jan. 1922. ISSN 09528385. doi: 10.2307/2340521.
- Gelman [2005] A. Gelman. Analysis of variance—why it is more important than ever. The Annals of Statistics, 33(1), Feb. 2005. ISSN 0090-5364. doi: 10.1214/009053604000001048.
- Gillespie et al. [2022] M. Gillespie, B. Jassal, R. Stephan, M. Milacic, K. Rothfels, A. Senff-Ribeiro, J. Griss, C. Sevilla, L. Matthews, C. Gong, C. Deng, T. Varusai, E. Ragueneau, Y. Haider, B. May, V. Shamovsky, J. Weiser, T. Brunson, N. Sanati, L. Beckman, X. Shao, A. Fabregat, K. Sidiropoulos, J. Murillo, G. Viteri, J. Cook, S. Shorser, G. Bader, E. Demir, C. Sander, R. Haw, G. Wu, L. Stein, H. Hermjakob, and P. D’Eustachio. The reactome pathway knowledgebase 2022. Nucleic Acids Research, 50(D1):D687–D692, Jan. 2022. ISSN 0305-1048, 1362-4962. doi: 10.1093/nar/gkab1028.
- Kanehisa et al. [2021] M. Kanehisa, M. Furumichi, Y. Sato, M. Ishiguro-Watanabe, and M. Tanabe. KEGG: integrating viruses and cellular organisms. Nucleic Acids Research, 49(D1):D545–D551, Jan. 2021. ISSN 0305-1048, 1362-4962. doi: 10.1093/nar/gkaa970.
- Kiefer [1953] J. Kiefer. Sequential minimax search for a maximum. Proceedings of the American Mathematical Society, 4(3):502–506, 1953. ISSN 0002-9939, 1088-6826. doi: 10.1090/S0002-9939-1953-0055639-3.
- Kiselev et al. [2017] V. Y. Kiselev, K. Kirschner, M. T. Schaub, T. Andrews, A. Yiu, T. Chandra, K. N. Natarajan, W. Reik, M. Barahona, A. R. Green, and M. Hemberg. SC3: consensus clustering of single-cell RNA-seq data. Nature Methods, 14(5):483–486, May 2017. ISSN 1548-7091, 1548-7105. doi: 10.1038/nmeth.4236.
- Kryuchkova-Mostacci and Robinson-Rechavi [2016] N. Kryuchkova-Mostacci and M. Robinson-Rechavi. A benchmark of gene expression tissue-specificity metrics. Briefings in Bioinformatics, page bbw008, Feb. 2016. ISSN 1467-5463, 1477-4054. doi: 10.1093/bib/bbw008.
- LeCun et al. [1989] Y. LeCun, B. Boser, J. S. Denker, D. Henderson, R. E. Howard, W. Hubbard, and L. D. Jackel. Backpropagation Applied to Handwritten Zip Code Recognition. Neural Computation, 1(4):541–551, Dec. 1989. ISSN 0899-7667, 1530-888X. doi: 10.1162/neco.1989.1.4.541.
- Lee et al. [2005] Y. H. Lee, S. Nair, E. Rousseau, D. B. Allison, G. P. Page, P. A. Tataranni, C. Bogardus, and P. A. Permana. Microarray profiling of isolated abdominal subcutaneous adipocytes from obese vs non-obese Pima Indians: increased expression of inflammation-related genes. Diabetologia, 48(9):1776–1783, Sept. 2005. ISSN 0012-186X. doi: 10.1007/s00125-005-1867-3.
- Liu et al. [2021] S. Liu, A. Thennavan, J. P. Garay, J. S. Marron, and C. M. Perou. MultiK: an automated tool to determine optimal cluster numbers in single-cell RNA sequencing data. Genome Biology, 22(1):232, Dec. 2021. ISSN 1474-760X. doi: 10.1186/s13059-021-02445-5.
- McInnes et al. [2018] L. McInnes, J. Healy, and J. Melville. UMAP: Uniform Manifold Approximation and Projection for Dimension Reduction. 2018. doi: 10.48550/ARXIV.1802.03426. Publisher: arXiv Version Number: 3.
- Monteiro and Azevedo [2010] R. Monteiro and I. Azevedo. Chronic Inflammation in Obesity and the Metabolic Syndrome. Mediators of Inflammation, 2010:1–10, 2010. ISSN 0962-9351, 1466-1861. doi: 10.1155/2010/289645.
- Pedregosa et al. [2011] F. Pedregosa, G. Varoquaux, A. Gramfort, V. Michel, B. Thirion, O. Grisel, M. Blondel, P. Prettenhofer, R. Weiss, V. Dubourg, J. Vanderplas, A. Passos, D. Cournapeau, M. Brucher, M. Perrot, and E. Duchesnay. Scikit-learn: Machine Learning in Python. Journal of Machine Learning Research, pages 2825–2830, 2011.
- Ronen et al. [2022] M. Ronen, S. E. Finder, and O. Freifeld. DeepDPM: Deep Clustering With an Unknown Number of Clusters. Technical Report arXiv:2203.14309, arXiv, Mar. 2022. arXiv:2203.14309 [cs, stat] type: article.
- Satija et al. [2015] R. Satija, J. A. Farrell, D. Gennert, A. F. Schier, and A. Regev. Spatial reconstruction of single-cell gene expression data. Nature Biotechnology, 33(5):495–502, May 2015. ISSN 1087-0156, 1546-1696. doi: 10.1038/nbt.3192.
- Seabold and Perktold [2010] S. Seabold and J. Perktold. statsmodels: Econometric and statistical modeling with python. In 9th Python in Science Conference, 2010.
- Sibson [1973] R. Sibson. SLINK: An optimally efficient algorithm for the single-link cluster method. The Computer Journal, 16(1):30–34, Jan. 1973. ISSN 0010-4620, 1460-2067. doi: 10.1093/comjnl/16.1.30.
- Solo [2019] V. Solo. Pearson Distance is not a Distance. Technical Report arXiv:1908.06029, arXiv, Aug. 2019. arXiv:1908.06029 [stat] type: article.
- Storey and Tibshirani [2003] J. D. Storey and R. Tibshirani. Statistical significance for genomewide studies. Proceedings of the National Academy of Sciences, 100(16):9440–9445, Aug. 2003. ISSN 0027-8424, 1091-6490. doi: 10.1073/pnas.1530509100.
- Szklarczyk et al. [2021] D. Szklarczyk, A. L. Gable, K. C. Nastou, D. Lyon, R. Kirsch, S. Pyysalo, N. T. Doncheva, M. Legeay, T. Fang, P. Bork, L. J. Jensen, and C. von Mering. The STRING database in 2021: customizable protein–protein networks, and functional characterization of user-uploaded gene/measurement sets. Nucleic Acids Research, 49(D1):D605–D612, Jan. 2021. ISSN 0305-1048, 1362-4962. doi: 10.1093/nar/gkaa1074.
- Tjörnhammar and Edholm [2010] R. Tjörnhammar and O. Edholm. Molecular dynamics simulations of Zn2+ coordination in protein binding sites. The Journal of Chemical Physics, 132(20):205101, May 2010. ISSN 0021-9606, 1089-7690. doi: 10.1063/1.3428381.
- Ward [1963] J. H. Ward. Hierarchical Grouping to Optimize an Objective Function. Journal of the American Statistical Association, 58(301):236–244, Mar. 1963. ISSN 0162-1459, 1537-274X. doi: 10.1080/01621459.1963.10500845.