Synthetic Aperture Radar Image Change Detection via Layer Attention-Based Noise-Tolerant Network
Abstract
Recently, change detection methods for synthetic aperture radar (SAR) images based on convolutional neural networks (CNN) have gained increasing research attention. However, existing CNN-based methods neglect the interactions among multilayer convolutions, and errors involved in the preclassification restrict the network optimization. To this end, we proposed a layer attention-based noise-tolerant network, termed LANTNet. In particular, we design a layer attention module that adaptively weights the feature of different convolution layers. In addition, we design a noise-tolerant loss function that effectively suppresses the impact of noisy labels. Therefore, the model is insensitive to noisy labels in the preclassification results. The experimental results on three SAR datasets show that the proposed LANTNet performs better compared to several state-of-the-art methods. The source codes are available at https://github.com/summitgao/LANTNet.
Index Terms:
Change detection; Layer attention; Synthetic aperture radar; Noise-tolerant loss.I Introduction
Remote sensing image change detection aims to identify regions that changed in the same area using multitemporal images. In fact, it facilitates various applications, such as disaster assessment, deforestation monitoring, and object detection [1] [2] [3]. The synthetic aperture radar (SAR) is an ideal source for change detection, since the SAR sensor is independent of sunlight illumination and weather conditions. Therefore, SAR change detection has received extensive research attention recently.
Many supervised and unsupervised methods have been devoted to detect changes in multitemporal SAR images. In fact, it commonly costs a lot of effort to collect high-quality labeled samples that reflect the changed information, and learning the changed information in an unsupervised manner is more efficient. Therefore, in this letter, we focus on unsupervised SAR change detection.
Traditionally, the task of SAR image change detection are solved by clustering methods, such as -means [4], fuzzy -means (FCM) [5] and hierarchical clustering [6]. Recently, leveraging the representation power of convolutional neural networks (CNNs) and the attention mechanism to capture changed information has become a common solution for change detection. Gao et al. [7] designed an adaptive fusion convolution module to encode the input, allowing the network to focus on the more informative channels. Zhang et al [8] proposed a sparse feature clustering network for SAR image change detection. Geng et al. [9] presented a saliency-guided network to suppress the influence of speckle noise and improve the SAR change detection performance. In [10], transfer learning is employed for the parameter initialization for change detection deep networks. Furthermore, wavelet-CNN [11], discrete cosine transform [12], and ensemble learning [13] are also used to enhance the representation power of deep networks.
Indeed, the CNN-based models have shown impressive performance in change detection task. However, they still show limitations in the following aspects: 1) Feature interaction among convolution layers. Research in human vision system finds that visual representations in the cortex are activated in parallel fashion [14]. Existing self-attention-enhanced CNNs commonly incorporate an attention block after a convolution layer, which overlooks the interactions among multi-layer convolutions. In light of this, it is essential to explore the information flow among the convolutional layers. 2) Errors involved in the pseudo-labels. Existing unsupervised change detection methods generally use clustering to generate pseudo-labels with high confidence for training. However, the errors involved in the pseudo-labels restrict network optimization [15]. Therefore, it is vital to build a noise-tolerant model for unsupervised change detection task.
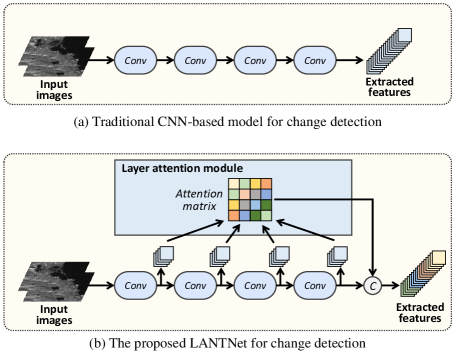
To address the aforementioned issues, we propose a Layer Attention-based Noise-Tolerant Network, dubbed as LANTNet, which interconnects convolutional layers and is less sensitive to noisy labels. Specifically, we design a layer attention module for change detection, which adaptively weights features from different layers, as illustrated in Fig. 1. In addition, we design a noise-tolerant loss function that can effectively suppress the impact of noisy labels. It combines the Cross Entropy (CE) loss and the Mean Absolute Error (MAE). Hence, the network is less sensitive to noisy labels and has a fast convergence rate. We conducted extensive experiments on three SAR datasets, and the results demonstrate that the proposed LANTNet yields better performance as compared to state-of-the-art methods.
In summary, the contributions of this letter are threefold:
-
•
We propose a layer attention module, which exploits the correlations of multi-layer convolutions. Features from different convolution layers cooperate with each other, effectively improving the representation power of the network.
-
•
We introduce a noise-tolerant loss function to alleviate the influence of noisy labels in pseudo-labeled samples. It makes the model less sensitive to noisy labels and has fast convergence rate.
-
•
Experimental results confirm the effectiveness of the proposed LANTNet. Furthermore, we have made our data and codes publicly available to benefit other research of the remote sensing community.
II Methodology
Given the multitemporal SAR images and acquired in the same geographical zone, the goal of change detection is to generate a change map where each spatial location is assigned to one type of change. In this work, we consider the generation of change map as a binary classification task, which means that the label is either 1 (changed) or 0 (not changed).
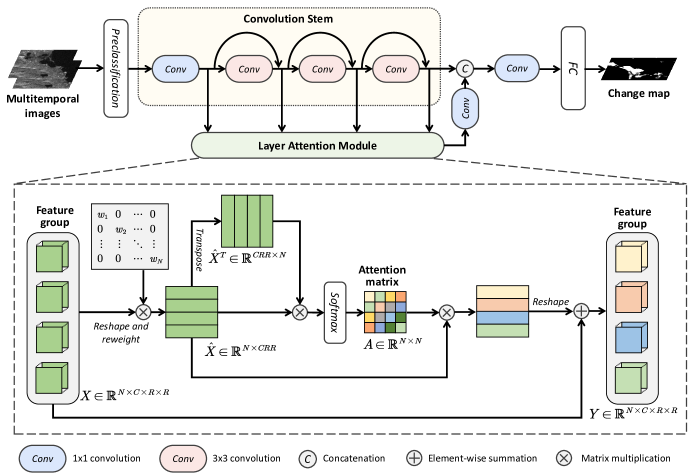
As shown in Fig. 2, the proposed LANTNet comprises three components: preclassification module, convolutional stem and layer attention module. First, multitemporal coregistered SAR images and are fed into the preclassification module to obtain samples that are highly likely to be changed or unchanged. New image patches will be generated and then fed into the convolutional stem to compute feature groups . The feature groups are then updated to attention features by the layer attention module. Finally, and the features of the convolutional stem are combined for classification to calculate the final change map.
II-A Preclassification and Convolutional Stem
In the preclassification module, the logarithmic ratio operator and the hierarchical Fuzzy C-Means Algorithm are employed, and details of the module can be found in [6]. After preclassification, the image patches ( pixels) with pseudo-labels are extracted from , , and the difference image, respectively. They are concatenated to form new image patches ( pixels) as training samples.
The convolutional stem consists of four convolution layers. 11 convolution is first used to extract the shallow feature . Then, three 33 convolution layers are employed to extract intermediate features as
| (1) |
For the shallow feature , we set the channel numbers to 16, and for intermediate features , , and , we set the channel numbers to 32. Then, convolution is employed to increase the channel dimensions of to 32. After that, , , , and are combined to form a feature group, and fed into the layer attention module.
II-B Layer Attention Module
The attention mechanism helps the network focus on the most important part and neglect irrelevant information. However, the correlations among multi-layer convolutions are rarely taken into account. To this end, we design a layer attention module to weight the features , , , and from multiple layers by learning the correlation matrix. Therefore, layer attention effectively fuses the spatial information of low-level layers and the semantic information from high-level layers. The informative layers are emphasized, and the redundant ones are suppressed. Fig. 2 shows the details of the proposed layer attention module. The input of the module is the feature group from the convolution stem. In our implementation, is set to 4. Then we reshape to a feature matrix with the dimension of . Subsequently, we apply matrix multiplication between the new feature matrix and a diagonal matrix to weight the features from different layers. Note that is initialized to identity matrix and only the diagonal elements of are updated in each epoch. The weight matrix adaptively assign weights to the input feature groups. After that, a weighted feature matrix can be obtained.
Next, we calculate an attention matrix as the correlation matrix as follows:
| (2) |
where the element in the attention matrix denotes the correlation index between the -th and -th layer features, and denotes the matrix multiplication. Matrix multiplication is performed between the weighted feature matrix and its transpose matrix . Softmax operation is applied to generate the attention matrix .
Finally, we multiply the weighted feature matrix by the attention matrix , and reshape the output to the dimension of . The input are combined to form the final output as:
| (3) |
where denotes the reshape operation.
To compute the final change map, is reshaped to the dimension of , and then fed into a convolution layer for channel reduction, as illustrated in Fig. 2. After that, the combined features are handled by a fully connected (FC) layer. The softmax function is used to calculate the possibility of changed or unchanged. After training, the final change map can be obtained by classifying all pixels from the multitemporal SAR images.
II-C Noise-tolerant loss function
Like most existing unsupervised methods, we employ clustering to generate pseudo-labels with high probability for network training. However, errors are commonly involved in these pesudo-labels, and restrict the network optimization [15]. Therefore, it is critical to build a noise-tolerant model.
Toward this end, we design a noise-tolerant loss which combines the Cross Entropy (CE) loss and the Mean Absolute Error (MAE). Suppose the dataset for change detection is represensted as , where is the input image patch, is the label associated with , and is the total number of samples. The MAE loss is defined as:
| (4) |
where represents the network and is a one-hot vector with if , otherwise .
The CE loss is computed as:
| (5) |
Ghosh et al. [16] empirically demonstrated that MAE is robust to noisy labels, but it often costs more time to converge. To the contrary, CE tends to overfit noisy labels, but it performs better than MAE when training with clean data. To leverage the good convergence performance of CE, and exploit the noise robustness of provided by MAE, we design a robust loss function which combines the CE and MAE. Formally, the robust loss function is defined as:
| (6) |
where and are two decoupled hyperparameters. In our implementation, we set to 0.1 and to 0.9 for a trade-off between convergence efficiency and the noise robustness.
III Experiments and Analysis
III-A Datasets and Evaluation Metrics
To evaluate the proposed LANTNet, we conducted extensive experiments on three real SAR datasets captured by different sensors. The first dataset is Chao Lake dataset with the size of pixels. It was captured by the Sentinel-1 sensor in May and July 2020 in China, respectively. The second dataset is the Ottawa dataset with the size of pixels, which was acquired by the Radarsat sensor in May and August 1997, respectively. The Ottawa dataset shows the changed areas afflicted by floods. The third dataset is the Sulzberger dataset which was captured by the Envisat satellite of the European Space Agency on March 11 and 16, 2011. Both images show a breakup of the ice shelf caused by a tsunami.
Five commonly-used evaluation metrics, i.e., false positive (FP), false negative (FN), overall error (OE), percentage of correct classification (PCC) and Kappa coefficient (KC) are used to evaluate the change detection performance.
III-B Analysis of the Patch Size
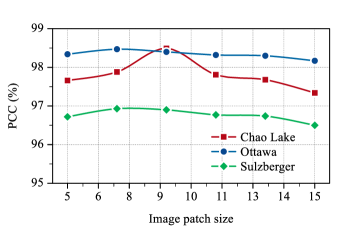
The image patch size is a critical parameter. To explore the relationship between the patch size and PCC, we set from 5 to 15, and the experimental results are shown in Fig. 3. It can be seen that all curves tend to increase first and then decrease. When is small, the contextual information around each pixel is insufficient. However, if becomes too large, irrelevant neighborhood information would be taken into account. Therefore, we set for the Chao Lake dataset, and for the Ottawa and Sulzberger datasets.
| Method | PCC on different datasets () | ||
| Chao Lake | Ottawa | Sulzberger | |
| Basic CNN | 97.49 | 98.22 | 96.36 |
| w/o layer attention | 97.82 | 98.32 | 96.64 |
| w/o noise-tolerant loss | 97.98 | 98.42 | 96.69 |
| Proposed LANTNet | 98.49 | 98.47 | 96.93 |
III-C Ablation Study
To verify the effectiveness of the proposed layer attention module and the noise-tolerant loss, we conduct ablation experiments on three datasets. Three variants are designed for comparison. First, we design a basic CNN with the same structure as LANTNet, which removes the layer attention module and uses cross entropy as loss function instead of the noise-tolerant loss. Then we run our model without layer attention module (w/o layer attention) and without the noise-tolerant loss(w/o noise-tolerant loss). The results are shown in Table I. It can be observed that both the layer attention module and the noise-tolerant loss are effective for change detection performance improvement.
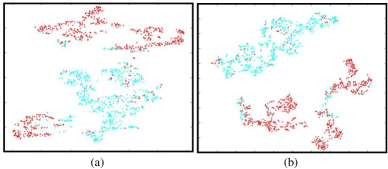
Furthermore, to gain deeper insights toward the layer attention, we visualized the features before and after the layer attention module with the tool of t-SNE. As shown in Fig. 4, the distance between features clusters derived by the layer attention is larger, which reflects the feature representations by our model are indeed more discriminative.
| Method | Results on the Chao Lake dataset | ||||
| FP | FN | OE | PCC | KC | |
| PCAKM [4] | 8521 | 2248 | 10769 | 92.70 | 65.58 |
| NR-ELM [17] | 595 | 3836 | 4431 | 97.00 | 81.27 |
| GaborPCANet [6] | 2946 | 1771 | 4717 | 96.80 | 82.66 |
| CWNN [11] | 959 | 2397 | 3356 | 97.72 | 86.63 |
| DDNet [12] | 2097 | 1068 | 3165 | 97.85 | 88.31 |
| Proposed LANTNet | 1358 | 867 | 2225 | 98.49 | 91.65 |
| Method | Results on the Ottawa dataset | ||||
| FP | FN | OE | PCC | KC | |
| PCAKM [4] | 729 | 2458 | 3187 | 96.86 | 87.67 |
| NR-ELM [17] | 517 | 1310 | 1827 | 98.20 | 93.10 |
| GaborPCANet [6] | 755 | 1080 | 1835 | 98.19 | 93.15 |
| CWNN [11] | 1291 | 434 | 1725 | 98.30 | 93.75 |
| DDNet [12] | 504 | 1191 | 1695 | 98.33 | 93.62 |
| Proposed LANTNet | 638 | 911 | 1549 | 98.47 | 94.23 |
| Method | Results on the Sulzberger dataset | ||||
| FP | FN | OE | PCC | KC | |
| PCAKM [4] | 3308 | 701 | 4009 | 93.88 | 84.49 |
| NR-ELM [17] | 2386 | 646 | 3032 | 95.37 | 88.07 |
| GaborPCANet [6] | 2485 | 494 | 2979 | 95.45 | 88.34 |
| CWNN [11] | 1598 | 1132 | 2730 | 95.83 | 88.98 |
| DDNet [12] | 1710 | 526 | 2236 | 96.59 | 91.10 |
| Proposed LANTNet | 1229 | 784 | 2013 | 96.93 | 91.87 |
III-D Experimental Results and Comparison
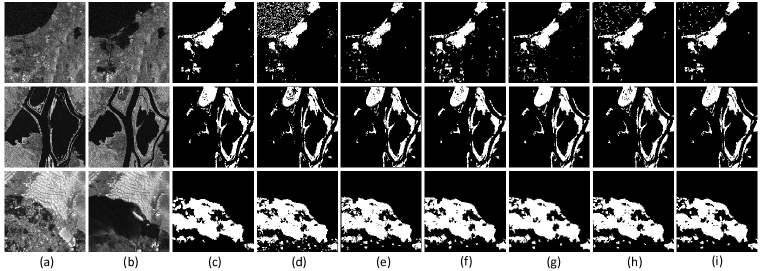
To verify the effectiveness of the proposed LANTNet, five closely related change detection methods are used for comparison, including PCAKM [4], NR-ELM [17], GaborPCANet [6], CWNN [11], and DDNet [12]. Note that the methods mentioned above are implemented with the default parameters provided in their work. All visual results are illustrated in Fig. 5, and the corresponding quantitative results are shown in Table II.
On the Chao Lake dataset (the first row of Fig. 5), PCAKM has the highest FP value among all methods and the FP value affects the overall performance of PCAKM. At the same time, GaborPCANet and DDNet also suffer from high FP values, while NR-ELM and CWNN suffer from high FN values. CWNN and DDNet are two CNN-based methods and have strong feature representation power, as shown in Table II. However, the pseudo-labels utilized by CWNN and DDNet are not accurate enough, and their models may overfit the noisy labels. The KC value of the proposed LANTNet is impoved by 26.07, 10.38, 8.99, 5.02 and 3.34 over PCAKM, NR-ELM, GaborPCANet, CWNN and DDNet, respectively. It is evident that the proposed method achieves the best performance on the Chao Lake dataset.
On the Ottawa dataset (the second row of Fig. 5), PCAKM, NR-ELM, GaborPCANet, and DDNet suffer from high FN values and many change pixels are not correctly classified. CWNN suffers from a high FP value and generates many noisy spots in the change map. The proposed LANTNet achieves the best PCC value, and it demonstrates that layer attention effectively improves the feature representation. The comparisons demonstrate the good performance of the proposed LANTNet on the Ottawa dataset.
On the Sulzberger dataset (the third row of Fig. 5), all the methods suffer from high FP values, and the proposed LANTNet achieves the lowest FP value. It can be seen from Fig. 5 that the proposed LANTNet is effective in suppressing the label noise and reduces the FP values. The KC value of the proposed LANTNet is impoved by 7.38, 3.8, 3.53, 2.89 and 0.77 over PCAKM, NR-ELM, GaborPCANet, CWNN and DDNet, respectively. The comparison shows that the LANTNet is powerful in noise suppression on the Sulzberger dataset.
IV Conclusions
In this letter, we propose a layer attention-based noise-tolerent neural network (LANTNet) for SAR change detection. Compared with existing CNN-based methods, our LANTNet improves in two aspects. First, we design a layer attention module that adaptively weights the feature of different convolution layers. In addition, since the pseudo-labels obtained by preclassification are not accurate enough, we design a noise-tolerant loss to help the network avoid overfitting to the noisy labels. Experimental results on three multi-temporal SAR datasets demonstrate that the proposed LANTNet is superior to several state-of-the-art change detection methods.
References
- [1] Z. Lv, X. Yang, X. Zhang, and J. A. Benediktsson, “Object-based sorted-histogram similarity measurement for detecting land cover change with VHR remote sensing images,” IEEE Geoscience and Remote Sensing Letters, vol. 19, pp. 1–5, 2022.
- [2] J. Wang, F. Gao, J. Dong, S. Zhang, and Q. Du, “Change detection from synthetic aperture radar images via graph-based knowledge supplement network,” IEEE Journal of Selected Topics in Applied Earth Observations and Remote Sensing, vol. 15, pp. 1823–1836, 2022.
- [3] J. Ai, R. Tian, Q. Luo, J. Jin, and B. Tang, “Multi-scale rotation-invariant Haar-like feature integrated CNN-based ship detection algorithm of multiple-target environment in SAR imagery,” IEEE Transactions on Geoscience and Remote Sensing, vol. 57, no. 12, pp. 10 070–10 087, 2019.
- [4] T. Celik, “Unsupervised change detection in satellite images using principal component analysis and -means clustering,” IEEE Geoscience and Remote Sensing Letters, vol. 6, no. 4, pp. 772–776, 2009.
- [5] M. Gong, L. Su, M. Jia, and W. Chen, “Fuzzy clustering with a modified MRF energy function for change detection in synthetic aperture radar images,” IEEE Transactions on Fuzzy Systems, vol. 22, no. 1, pp. 98–109, 2014.
- [6] F. Gao, J. Dong, B. Li, and Q. Xu, “Automatic change detection in synthetic aperture radar images based on PCANet,” IEEE Geoscience and Remote Sensing Letters, vol. 13, no. 12, pp. 1792–1796, 2016.
- [7] Y. Gao, F. Gao, J. Dong, and H.-C. Li, “SAR image change detection based on multiscale capsule network,” IEEE Geoscience and Remote Sensing Letters, vol. 18, no. 3, pp. 484–488, 2021.
- [8] W. Zhang, L. Jiao, F. Liu, S. Yang, W. Song, and J. Liu, “Sparse feature clustering network for unsupervised SAR image change detection,” IEEE Transactions on Geoscience and Remote Sensing, vol. 60, pp. 1–13, 2022.
- [9] J. Geng, X. Ma, X. Zhou, and H. Wang, “Saliency-guided deep neural networks for SAR image change detection,” IEEE Transactions on Geoscience and Remote Sensing, vol. 57, no. 10, pp. 7365–7377, 2019.
- [10] Y. Gao, F. Gao, J. Dong, and S. Wang, “Transferred deep learning for sea ice change detection from synthetic aperture radar images,” IEEE Geoscience and Remote Sensing Letters, vol. 16, no. 10, pp. 1655–1659, 2019.
- [11] F. Gao, X. Wang, Y. Gao, J. Dong, and S. Wang, “Sea ice change detection in SAR images based on convolutional-wavelet neural networks,” IEEE Geoscience and Remote Sensing Letters, vol. 16, no. 8, pp. 1240–1244, 2019.
- [12] X. Qu, F. Gao, J. Dong, Q. Du, and H.-C. Li, “Change detection in synthetic aperture radar images using a dual-domain network,” IEEE Geoscience and Remote Sensing Letters, vol. 19, pp. 1–5, 2022.
- [13] J. Wang, Y. Wang, B. Chen, and H. Liu, “LCS-EnsemNet: A semisupervised deep neural network for SAR image change detection with dual feature extraction and label-consistent self-ensemble,” IEEE Journal of Selected Topics in Applied Earth Observations and Remote Sensing, vol. 14, pp. 11 903–11 925, 2021.
- [14] L. Chelazzi, J. Duncan, E. Miller, and R. Desinone, “Responses of neurons in inferior temporal cortex during memory-guided visual search,” Journal of Neurophysiology, vol. 80, no. 6, pp. 2918–2940, 1998.
- [15] Z. Zhang and M. Sabuncu, “Generalized cross entropy loss for training deep neural networks with noisy labels,” in 32nd Conference on Neural Information Processing Systems, 2018, pp. 1–14.
- [16] A. Ghosh, H. Kumar, and P. Sastry, “Robust loss functions under label noise for deep neural networks,” in Proceedings of the AAAI Conference on Artificial Intelligence, 2017, pp. 1919–1925.
- [17] F. Gao, J. Dong, B. Li, Q. Xu, and C. Xie, “Change detection from synthetic aperture radar images based on neighborhood-based ratio and extreme learning machine,” Journal of Applied Remote Sensing, vol. 10, no. 4, pp. 1–14, 2016.