Y. Seino ,
Measurement of two-photon decay width of in at Belle
Abstract
We report the measurement of the two-photon decay width of in two-photon processes at the Belle experiment. We analyze the process , using a data sample of 971 fb-1 collected with the Belle detector at the KEKB collider. In this analysis, the product of the two-photon decay width of and the branching fraction is determined to be eV, which corresponds to = 653 13(stat.) 31(syst.) 17(B.R.) eV, where the third uncertainty is from and .
Keywords:
Two-photon collisions, Charmonium, , Two-photon decay width1 Introduction
The two-photon decay widths () of mesonic states
provide important information
for testing models based on quantum chromodynamics (QCD),
which describes quark-antiquark systems.
In particular, it is important to measure the two-photon decay widths of a
-wave charmonium,
whose description is at the intersection between perturbative and non-perturbative QCD.
Predictions of the two-photon decay width of ()
have a wide range of values between 280 eV and 930 eV
in various theoretical calculations nonrelative_2 ; relativistic_corrections_1 ; relativistic_quark_model_2 ; potential ; relativistic_quark_model_1 ; rigorous_QCD_2 ; rigorous_QCD_1 ; nonrelativistic_QCD_factorization_framework ; two-body_Dirac_equations_of_constraint_dynamics ; effective_Lagrangian ; light_front .
Therefore, precise measurements will help to improve our understanding of quarkonium states.
Several experiments CLEOc ; bes3 ; previous_research ; CLEO3 have reported the measurement of .
In general, two approaches have been used to determine
,
either measuring the two-photon decay
or two-photon collisions .
In the former approach, CLEO-c and BES III
data give eV CLEOc
and eV bes3 , respectively,111We recalculate the values in CLEO-c and BES III using and MeV from PDG pdg2020 .
using the production and decay processes , .
The uncertainties are statistical, systematic and from and the total width of (), respectively.
Hereafter, the first and second uncertainties are statistical and systematic.
In the latter approach, Belle and CLEO III
data give eV previous_research
and eV CLEO3 ,
respectively,222We recalculate the values in Belle and CLEO III using = (19.0 0.5)% and
= (11.93 0.05)% from PDG pdg2020 . using in two-photon processes
at colliders.
The third uncertainty is from and .
At present, the precision of the experimental value of
using two-photon production is much lower than the value measured in two-photon decay.
In this study, we report an updated measurement of
in the analysis of ,
using a data sample of 971 fb-1 at Belle.
The previous measurement by Belle previous_research was performed using a data sample of 32.6 fb-1. The increased precision of this measurement will be crucial to
check the consistency between the two approaches of measuring
and to test the applicability of the existing theoretical models nonrelative_2 ; relativistic_corrections_1 ; relativistic_quark_model_2 ; potential ; relativistic_quark_model_1 ; rigorous_QCD_2 ; rigorous_QCD_1 ; nonrelativistic_QCD_factorization_framework ; two-body_Dirac_equations_of_constraint_dynamics ; effective_Lagrangian ; light_front .
The measurement principle of
in this analysis is as follows.
The production cross section of a resonance via two-photon processes at colliders is given by
| (1) |
where is the energy of in the center-of-mass (c.m.) frame of the two photons emitted from the beam, is the production cross section of for two-photon collisions at the energy and is the luminosity function epa , which is defined as the probability density of two-photon emission from the beam, with the energy . If the total width of the resonance is sufficiently small compared with its mass, Eq. 1 can be expressed as epa
| (2) |
where , and are the spin quantum numbers, the two-photon decay width and the mass of , respectively. From the observed number of events, the two-photon decay width of the resonance can be determined from Eq. 2 as:
| (3) |
where , , and are the observed number of events in the two-photon process, the integrated luminosity at collisions, the detection efficiency and the branching ratio, respectively.
2 The Belle detector and data sample
We use a data sample, collected with the Belle detector belledetector1 ; belledetector2
at the KEKB asymmetric-energy collider KEKB1 ; KEKB2 ,
corresponding to a total integrated luminosity of 971 fb-1
collected at or near the , , , and resonances.
The Belle detector is a large-solid-angle magnetic
spectrometer that consists of a silicon vertex detector (SVD),
a 50-layer central drift chamber (CDC), an array of
aerogel threshold Cherenkov counters (ACC),
a barrel-like arrangement of time-of-flight
scintillation counters (TOF), and an electromagnetic calorimeter
comprised of CsI(Tl) crystals (ECL) located inside
a super-conducting solenoid coil that provides a 1.5 T
magnetic field. An iron flux-return located outside of
the coil is instrumented to detect mesons and to identify
muons (KLM).
Events are selected with an OR of
the two-track trigger and the “HiE” trigger,
providing a 98.3% trigger efficiency.
The condition for the two-track trigger is CDC hits from two charged tracks
with either associated ECL clusters with an energy sum GeV,
or associated KLM hits.
The condition for the HiE trigger
is an energy sum GeV over all ECL clusters.
We use the TREPS generator treps for Monte Carlo (MC) simulation
of the two-photon process.
For the signal, we generate the processes
, , .
The effect of radiative decays to is simulated using PHOTOS photos .
The generated events are processed by the full detector simulation based on GEANT3 geant3 .
TREPS is also used to calculate the luminosity function based on the equivalent photon approximation epa .
When we estimate the overall signal detection efficiency for the determination of
,
the signal MC is generated under the following condition.
We prepare the signal MC at the c.m. energy corresponding to the resonance.
This c.m. energy comprises the majority of the used data sample and differences of the beam energy within the data sample are estimated to have an effect of less than 0.1% on the cross-section and the detection efficiency
of the signal processes.
Similarly, we use a mass of 3.556 GeV/ for and
we neglect the finite width, since its effect on the cross-section and the detection efficiency
is also estimated to be small, about 0.4%, and these effects are added to the systematics.
For the angular distribution of the decay in the signal MC of ,
we assume , and a pure state,
where , and are defined as the fractional multipole amplitudes of M2 and E3 transitions
and the helicity of the with respect to the axis, respectively. (See Appendix A for details.)
3 Event Selection
We select an or pair with
a signal photon to reconstruct .
To determine ,
we select quasi-real two photon collisions,
requiring that both recoiling beam particles are undetected (“zero-tag mode”).
This event selection is similar to the previous Belle analysis previous_research .
For the or selection,
we require that only two oppositely charged tracks are present in the event.
These tracks have to fulfill the following conditions in the laboratory frame:
, where is
the polar angle; GeV/, where is
the transverse momentum; 3 cm and 1 cm,
where and are the impact parameters relative to the beam interaction
point (IP) along the axis
defined as the direction opposite that of the beam
and the transverse plane, respectively;
1 cm, where is the difference between
the ’s of the two tracks;
, where is the opening angle of the two tracks,
to reject the cosmic-ray backgrounds.
Events are identified as ()
if both tracks have 0.8 ( 0.4),
where and are the energy deposit on ECL
and the measured momentum, respectively.
Events rejected by this criterion are mainly charged hadron backgrounds.
In the case the tracks are identified as an pair,
their momentum is corrected for the effect of bremsstrahlung as explained in the following.
If there are one or more photons which have a total energy between
0.02 GeV and 0.2 GeV within a cone with an angle of 3∘ around
the direction of electron momentum, the energy of these photons is
added to that of the electron track.
This procedure also reduces the width of the radiative tail.
For the signal photon from decay,
we require just one cluster in the ECL with an
energy 0.2 GeV under the
condition that the cluster is isolated from the nearest charged track by an
angle greater than 18.2∘.
To reconstruct the produced in
the two-photon process in the zero-tag mode,
the following conditions are required.
The scalar sum of the momenta of the two tracks
must be less than 6.0 GeV/ and
the total energy deposited in the ECL must be less than 6.0 GeV.
These requirements reject annihilation processes.
To reject the initial-state-radiation (ISR) process,
only events with 5.0 GeV2/ are selected,
where is the square of the recoil mass, which is defined as
.
We define , and
as the sum of beam energies, the sum of the energy of two tracks and
the absolute value of the sum of the momentum vector of two tracks in the c.m. frame of the beam, respectively.
The signal produced in quasi-real two-photon collisions
are selected with a -balance requirement.
This requirement is that the absolute value of the total transverse momentum vector
in the c.m. frame of the beam,
which is defined as , must be less than 0.15 GeV/,
where , and are the
transverse momentum vectors of
, and
the signal photon, respectively.
Furthermore, we require that
be larger than 0.1 GeV/
to reject pair produced in two-photon process with a fake photon.
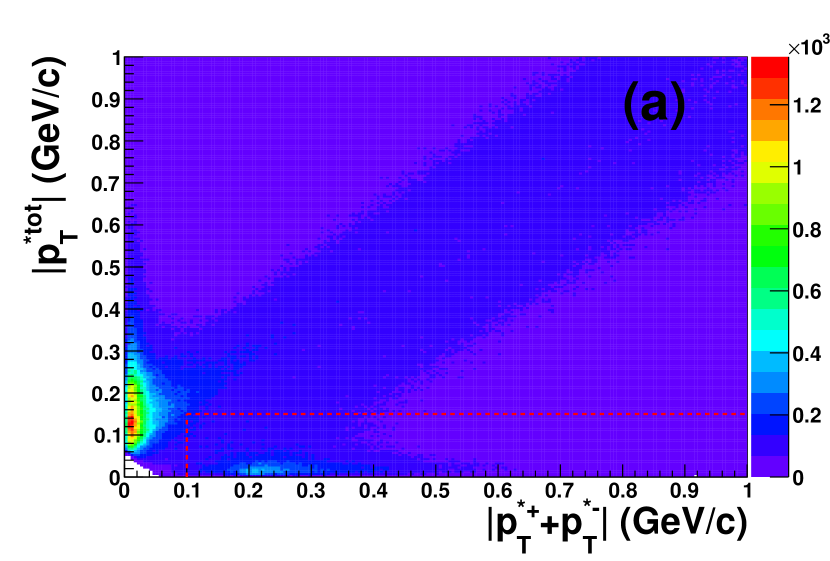
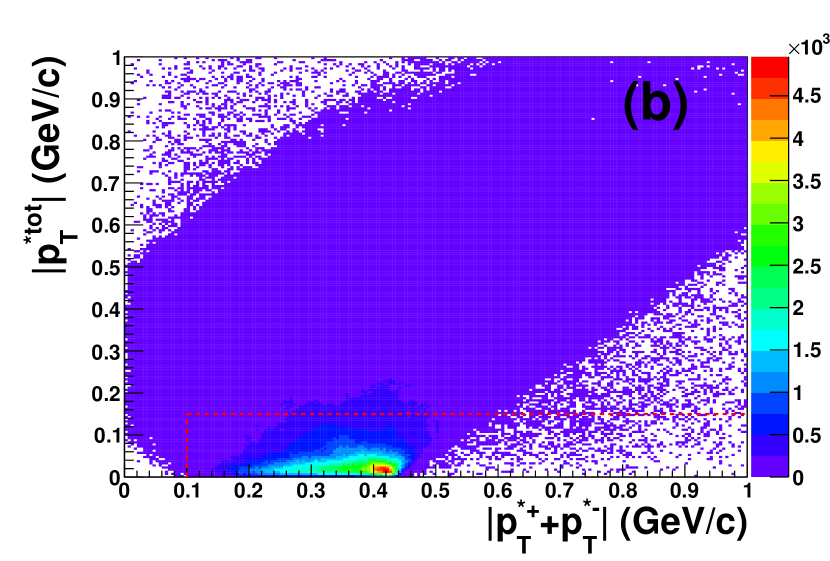
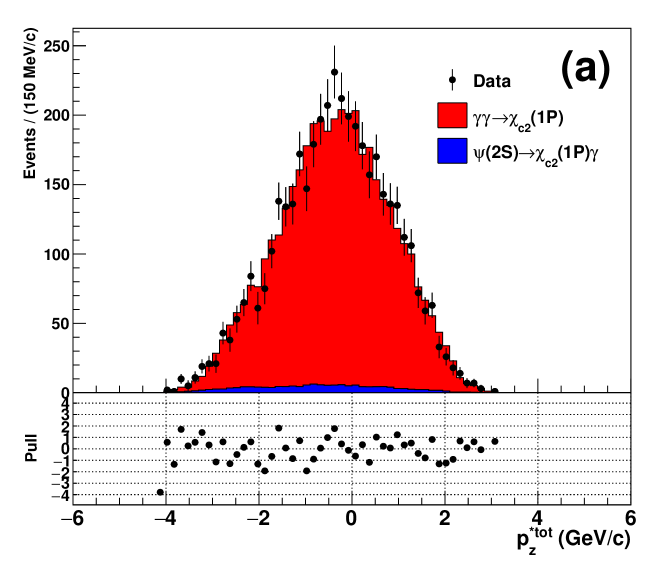
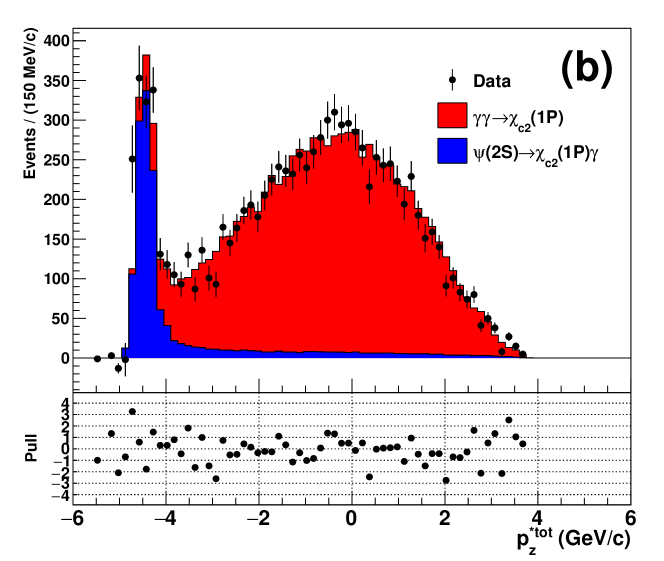
After the event selection except
for the selection using and ,
the scatter plots of versus for the data sample
and the signal MC are shown in Fig. 1 (a) and (b), respectively.
There are two clusters of events at
GeV/ and GeV/
in Fig. 1 (a).
The former corresponds to the pair production in two-photon process
with a fake photon.
The latter corresponds to the exclusive final state in two-photon process,
which is the dominant background component in this analysis;
in Fig. 1 (a), the signal events are not clear due to
the large background at this stage of the analysis.
A clear cluster at GeV/
can be seen in the signal MC events in Fig. 1 (b).
The region corresponding to the selections is drawn by the dotted red lines in Fig. 1 (a) and (b).
4 signal extraction
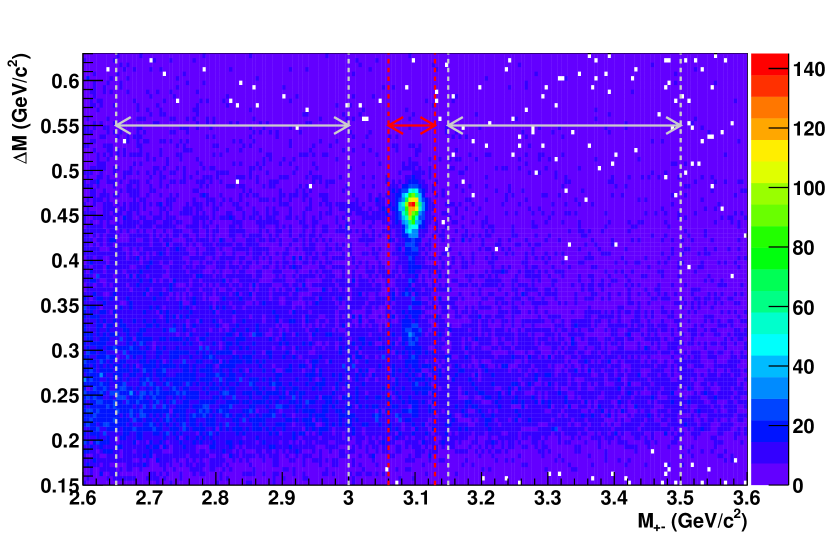
Figure 2 shows the scatter plot of the invariant mass difference, , versus the invariant mass of the two tracks () for the data sample after the event selection, where is the invariant mass of the selected two tracks and the signal photon candidate. As expected, a well separated cluster, corresponding to the signal of is evident in Fig. 2. To define the sideband events and the signal candidates, we set the sideband regions (2.65 GeV/ 3.00 GeV/ and 3.15 GeV/ 3.50 GeV/) and the signal region (3.06 GeV/ 3.13 GeV/), respectively. To take the radiative tail of the signal into account, the sideband regions are defined to be asymmetric with respect to the signal region.
Non- background is expected to be the dominant background component in this analysis,
because spin-1 meson production is suppressed in quasi-real two-photon collisions.
We use the sideband events for the data sample to study
the background component.
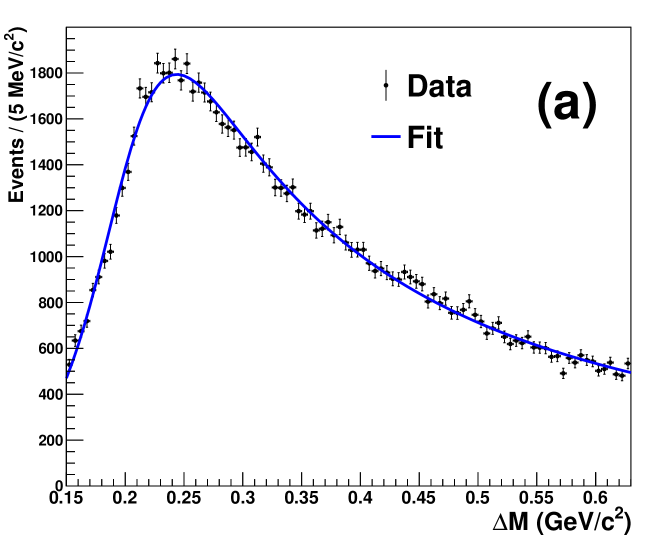
Figure 3 (a) shows
the mass difference distribution in sideband events for the data sample fitted by
the following empirical function from the previous Belle study previous_research
using a binned maximum-likelihood fit:
, where , , and are shape parameters,
and is the normalization parameter.
From this fit
we obtain the expected shape of the background component in the distribution.
Furthermore,
the number of background events expected in the signal region
is found to be 9966 32 events by scaling the number of events in the sideband.
In the previous Belle measurement previous_research ,
the number of signal events was estimated by subtracting the number of background events
from the total in a narrow signal region.
However, this method suffered from a low detection efficiency and a large systematic uncertainty.
In this analysis, we use a fit method to improve these points.
To extract the signal from the distribution in signal candidates,
we perform a binned extended maximum-likelihood fit
with probability density functions (PDFs) corresponding to and
signal and background components.
The signal of is expected to be non-negligible.
On the other hand, the influence of is negligibly small
because is a spin-1 meson suppressed in quasi-real two photon collision.
The ratio of the production and decay process for
to
is estimated to be only in this analysis nonrelativistic_QCD_factorization_framework ; teramoto .
A double-sided Crystal Ball function333
otherwise.
is a normalization parameter.
and are parameters of the left-hand side tail,
and are parameters of the right-hand side tail, and
and are the peak position and width of the gaussian term.
is empirically suitable for the and signal shape chi_b .
The tail parameters (, , , ) of the signal PDF
are fixed to the values obtained from the MC study
of the signal, where the total width was taken into account.
The parameters and in the signal PDF are floated.
The tail parameters and of the signal PDF are fixed to
those of the signal PDF
since there is only a small contribution from the
and the width of the signal shape
is expected to be close to that of the signal shape obtained from the MC study.
Furthermore, the mean of the signal PDF
is constrained to that of the signal PDF
with the mass difference between
and taken from the PDG pdg2020 .
The background PDF is taken to be the same function as described in the study of
sideband events with the shape parameters (, , , )
fixed to the values from the fit result shown in Fig. 3 (a).
From a fitter test using toy MC simulations based on
the shape of signal MCs and the background shape
estimated from the study of sideband events,
we confirm that the fit method is stable and has no bias.
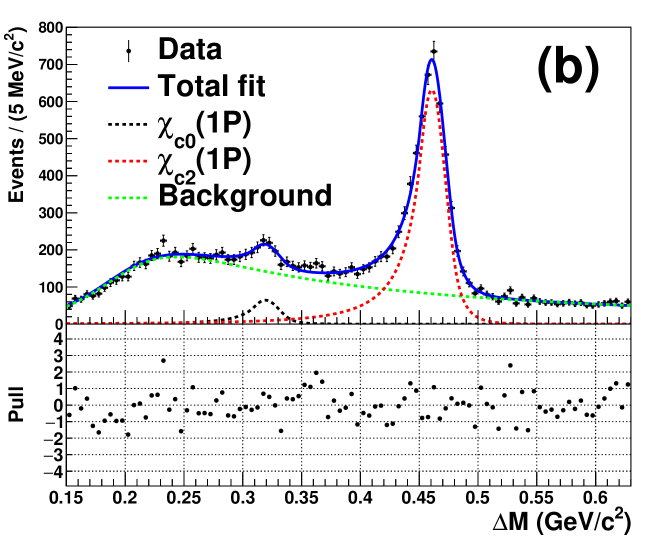
Figure 3 (b) shows
the mass difference distribution in signal candidates for the data sample fitted by
this method.
The fitted signal and background yields are 5131.2 97.4
and 10079 140 events, respectively.
The number of background events estimated from this fit is
consistent with that estimated from the study of the sideband events.
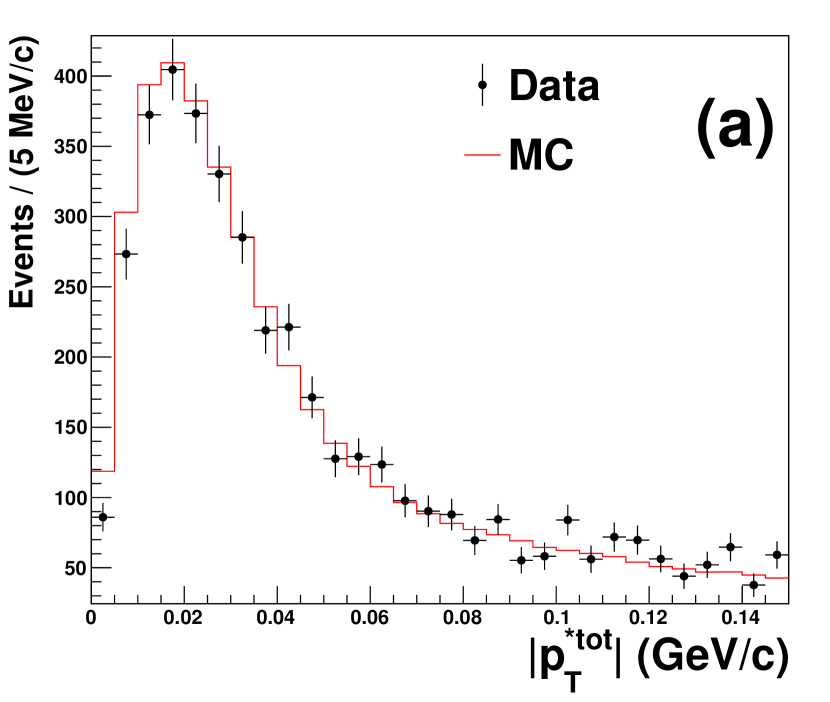
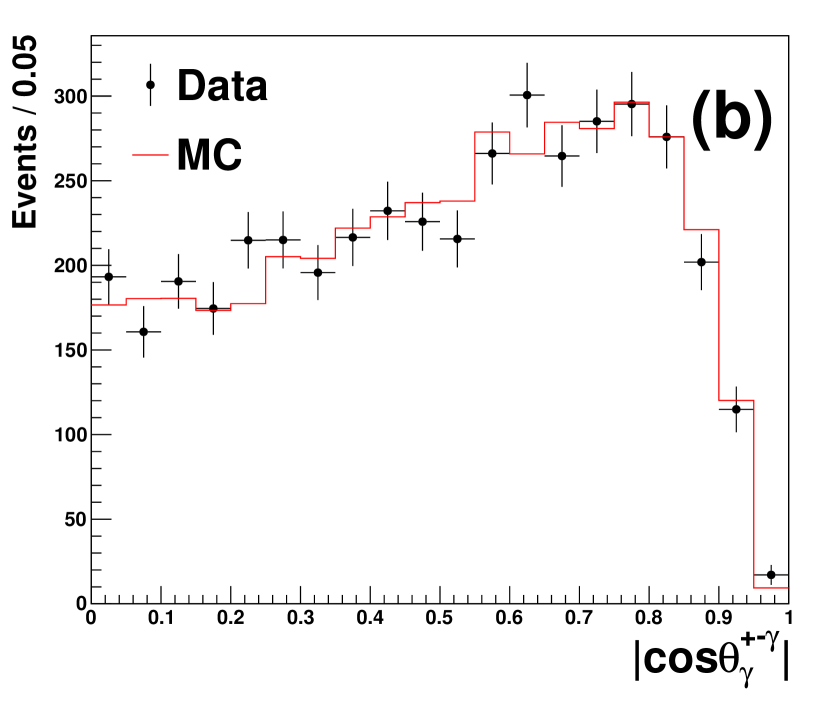
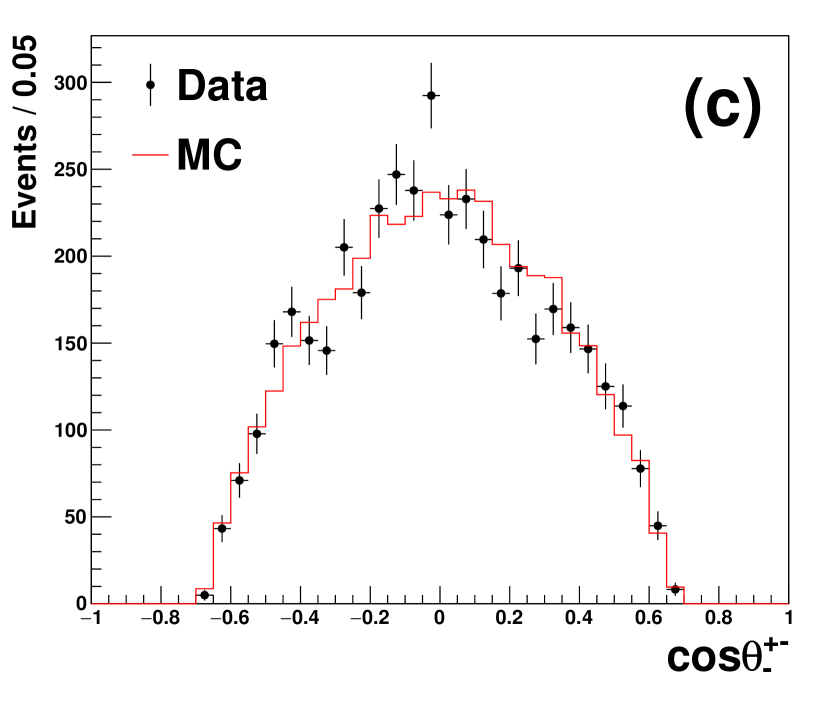
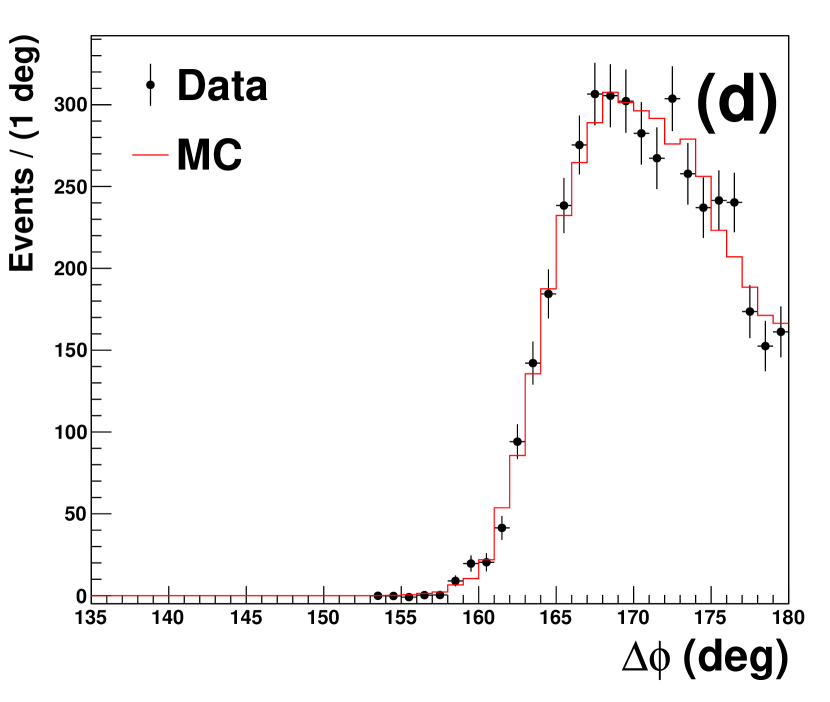
Figure 4 shows the comparison of the signal MC
with background-subtracted data for events with from 0.42 GeV/ to 0.49 GeV/
for , , and , respectively; sidebands are used to estimate the background.
The definition of variables in Fig 4 is as follows.
is defined as
the polar angle of the signal photon in the c.m. frame;
is defined as the polar angle of the negatively charged lepton in the c.m. frame; is defined as the difference in
the azimuthal angle between the momentum vectors of the two leptons
in the laboratory frame.
The signal MC is normalized to the observed number of events
in the data sample in Fig. 4.
There is a clear peak due to the two-photon process
at small values in Fig. 4 (a).
Good agreement is seen between the data and the signal MC
for the distribution.
Furthermore, the signal MC shows good agreement with the data sample
for the ,
and distributions. The simulation of angular distributions for the final state particles
can be performed well.
The overall signal detection efficiency in this analysis is estimated to be 7.36%
using the signal MC.
|
|
|
|
5 Treatment of peaking background from ISR production
A peaking background is anticipated from the process chain , , .
Events where the ISR photon and the photon from decay
are undetected have the same final state as the signal.
Therefore, we need to estimate the expected number of peaking background events.
The ISR production cross section has been precisely measured in Belle psi_cross .
To estimate the peaking background detection efficiency,
we prepare the peaking background MC
by using the PHOKHARA generator phokhara .
The requirements for angles of charged tracks and square of recoil mass
mostly remove the ISR events.
However, some double-ISR events where an ISR photon is emitted from each
beam, remain as their topology is similar to two-photon collision events.
The peaking background detection efficiency at the
is evaluated to be 0.55% in this analysis.
The expected number of peaking background events and its uncertainty are estimated using
the ISR production cross section from the Belle study, the product of the relevant
branching fractions and the peaking background detection efficiency.
Taking the data sample with the different beam energies into account,
the total expected number of peaking background events
is estimated to be 170.9 9.5 events:
the proportion of peaking background events in the signal yield
is only 3.3%.
The influence of the peaking background is not visible in any of the signal candidate distributions.
We finally evaluate the observed number of signal events in two-photon processes by subtracting the total expected number of peaking background events
from the signal yield.
To check the accuracy of the total expected number of peaking background events,
we compare the peaking background MC and the data sample for
the distribution with the “loose” event selection,
where is the sum of the component of momentum for the final state particles () in the c.m. frame of the beams.
In the loose event selection, only the requirement for the angles of the charged tracks () does not apply.
This requirement effectively rejects the peaking background
and makes the characteristic peak due to the ISR process invisible on the distribution.
Figure 5 shows the distribution in signal candidates
for the MC, which consists of the signal MC and
the peaking background MC, and the background-subtracted data sample, where we have
applied a sideband subtraction similar to the original signal analysis,
changing the sideband region to 2.965 GeV/ 3.000 GeV/ and 3.150 GeV/ 3.185 GeV/,
for the region between 0.42 GeV/ and 0.49 GeV/
after the standard (Fig. 5 (a)) and the loose event selection (Fig. 5 (b)).
Unlike the original signal analysis, the distribution of the mass difference in the wide
sideband region is different from that in narrow sideband region for the peaking background process.
Therefore, we use the narrow sideband region.
The requirement for the angles of the charged tracks
removes 90.0% of the ISR background
between Fig. 5 (a) and (b).
There is a clear peak due to the peaking background
at about GeV/ on the distribution in Fig. 5 (b),
and good agreement between the MC and the data sample in this
region, validating the estimate of the peaking background in .
6 Systematic uncertainties
Table 1 shows the summary of systematic uncertainties for the measurement of the two-photon decay width of . We apply efficiency correction for lepton identification for the two tracks in the signal MC. The lepton identification correction and its uncertainty are estimated from a study of events. The signal MC assumes pure helicity-2 production; the associated systematic uncertainty is estimated by varying the relevant parameter by its measured uncertainty, which changes the angular distribution (see Appendix A), and noting the resulting change in the signal detection efficiency. The uncertainty from the track finding efficiency is evaluated to be 0.3% per track using , events. The uncertainty on the detection efficiency due to the definition of the signal region is estimated by evaluating the difference in the detector resolution on the distribution between data and MC simulation. The systematic uncertainty for the photon detection efficiency is estimated with radiative Bhabha events. Since we require just one candidate for the signal photon from decay in the event selection, signal events are rejected when we detect extra photons. The uncertainty in the associated inefficiency is estimated using the difference in the probability of detected extra photons between data and MC simulation using the process with a -balance requirement for . The trigger efficiency estimated from the signal MC is 98.3%. We estimate the associated uncertainty by comparing the ratios of the different sub-triggers between signal MC and experimental data. We use the signal MC with only 10.58 GeV corresponding to as c.m. beam energy. The effect of the different beam energies is evaluated based on the product of overall signal detection efficiency and luminosity function, taking their luminosity-weighted average in the ratio to the value. The uncertainty due to neglecting the total width in the signal MC for the overall signal detection efficiency is estimated using dedicated signal MC that takes the total width into account. The validity and uncertainty of the fit method for signal extraction are estimated from a fitter test using toy MCs based on the shape of the signal MCs and the experimental background component from the sideband events. The estimated uncertainty includes the fit bias of signal yield and the uncertainty of the PDFs estimated by fitter tests where the fixed shape parameters are varied. The uncertainty on the luminosity function calculated by TREPS includes the effect of uncertainties in the form factor, the radiative correction in the two-photon reaction, and the difference in the approximation model for two-photon processes estimated from the comparison between TREPS and a full-diagram calculation aafh in the process. The systematic uncertainty on the integrated luminosity is estimated to be 1.4%. In addition to these sources, we estimate the uncertainty on the photon energy resolution which is applied to the signal photon in the signal MC. The photon energy resolution correction and its uncertainty are estimated from a study of events. The effect on the overall signal detection efficiency is evaluated to be negligibly small. The total systematic uncertainty is found to be 4.7%, adding the various contributions in quadrature.
| Source | Systematic uncertainty |
|---|---|
| Lepton ID efficiency correction | 0.8% |
| Angular distribution | 1.2% |
| Tracking efficiency | 0.6% |
| detection efficiency | 2.4% |
| Photon detection efficiency | 2.0% |
| Inefficiency due to extra photons | 1.0% |
| Trigger efficiency | 0.9% |
| Different beam energies | 0.1% |
| Neglecting total width | 0.4% |
| Fit method | 0.6% |
| Luminosity function | 2.3% |
| Integrated luminosity | 1.4% |
| Total | 4.7% |
7 Determination of two-photon decay width of
Subtracting the total expected number of peaking background events from the signal yield, the observed number of signal events in two-photon processes is estimated to be 4960.3 97.9 events. From Eq. 3, the two-photon decay width of is determined by
| (4) |
We substitute =3.556 GeV/, =971 fb-1, =7.36% and GeV-1, respectively. From Eq. 4, the measured value is
| (5) |
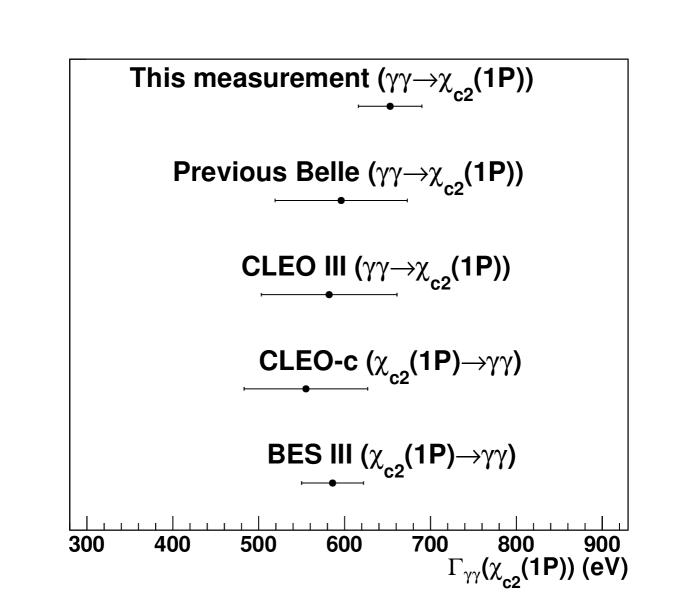
This result corresponds to
| (6) |
where the third uncertainty is from = (19.0 0.5)% and = (11.93 0.05)% pdg2020 . Table 2 and Fig. 6 show the summary and comparison of experimental results for , respectively. This measurement is the most precise measurement of in two-photon processes and consistent with the previous Belle result previous_research and the other experimental results CLEOc ; bes3 ; CLEO3 . Precision of the present measurement is almost the same as that of the most precise measurement from the decay of BES III bes3 .
[h] Experiment [Ref.] Measured value (eV) This measurement eV Previous Belle previous_research eV CLEO III CLEO3 eV CLEO-c CLEOc BES III bes3
8 Conclusion
We measure the two-photon decay width of in the analysis of , using the 971 fb-1 data sample at Belle. The measured value is . This result corresponds to = 653 13(stat.) 31(syst.) 17(B.R.) eV, where the third uncertainty is from and . The result in this paper is the most precise measurement of in two-photon processes and has a compatible precision with that from the decay of BES III bes3 . This measurement supersedes the previous Belle result previous_research .
Appendix A Angular distribution
In the decay process ,
E1, M2 and E3 transitions are allowed.
Furthermore, the helicity of with respect to the axis
can have or 2 in the production process.
Taking these conditions in , , into account,
the normalized angular distribution of the final state, which is written as
, is given by Eq. A.
In this equation, is the polar angle of the photon from decay with respect to the axis in the
c.m. frame; and are the
polar and azimuthal angles of
, respectively, in the - plane of the and
c.m. frame, where the -axis is along the direction of the and
the -axis is in the scattering plane;
shows the helicity amplitudes of with respect to the axis, where is the absolute value of helicity; , and are the fractional multipole amplitudes of E1, M2 and E3 transitions, respectively.
The relationship between and is also shown;
and are normalized;
the sign of is conventionally defined to be positive; and
is the ratio of to the whole ( or ).
In the signal MC,
we assume and pdg2020
for the .
For the state of helicity of with
respect to the axis,
we assume a pure state, based on the measurement
by BES III experiment444We take the linear sum of the statistical and systematic uncertainties, conservatively, for our uncertainty evaluation. bes3 .
| (7) |
Acknowledgements
This work, based on data collected using the Belle detector, which was operated until June 2010, was supported by the Ministry of Education, Culture, Sports, Science, and Technology (MEXT) of Japan, the Japan Society for the Promotion of Science (JSPS), and the Tau-Lepton Physics Research Center of Nagoya University; the Australian Research Council including grants DP180102629, DP170102389, DP170102204, DE220100462, DP150103061, FT130100303; Austrian Federal Ministry of Education, Science and Research (FWF) and FWF Austrian Science Fund No. P 31361-N36; the National Natural Science Foundation of China under Contracts No. 11675166, No. 11705209; No. 11975076; No. 12135005; No. 12175041; No. 12161141008; Key Research Program of Frontier Sciences, Chinese Academy of Sciences (CAS), Grant No. QYZDJ-SSW-SLH011; Project ZR2022JQ02 supported by Shandong Provincial Natural Science Foundation; the Ministry of Education, Youth and Sports of the Czech Republic under Contract No. LTT17020; the Czech Science Foundation Grant No. 22-18469S; Horizon 2020 ERC Advanced Grant No. 884719 and ERC Starting Grant No. 947006 “InterLeptons” (European Union); the Carl Zeiss Foundation, the Deutsche Forschungsgemeinschaft, the Excellence Cluster Universe, and the VolkswagenStiftung; the Department of Atomic Energy (Project Identification No. RTI 4002) and the Department of Science and Technology of India; the Istituto Nazionale di Fisica Nucleare of Italy; National Research Foundation (NRF) of Korea Grant Nos. 2016R1D1A1B02012900, 2018R1A2B3003643, 2018R1A6A1A06024970, RS202200197659, 2019R1I1A3A01058933, 2021R1A6A1A03043957, 2021R1F1A1060423, 2021R1F1A1064008, 2022R1A2C1003993; Radiation Science Research Institute, Foreign Large-size Research Facility Application Supporting project, the Global Science Experimental Data Hub Center of the Korea Institute of Science and Technology Information and KREONET/GLORIAD; the Polish Ministry of Science and Higher Education and the National Science Center; the Ministry of Science and Higher Education of the Russian Federation, Agreement 14.W03.31.0026, and the HSE University Basic Research Program, Moscow; University of Tabuk research grants S-1440-0321, S-0256-1438, and S-0280-1439 (Saudi Arabia); the Slovenian Research Agency Grant Nos. J1-9124 and P1-0135; Ikerbasque, Basque Foundation for Science, Spain; the Swiss National Science Foundation; the Ministry of Education and the Ministry of Science and Technology of Taiwan; and the United States Department of Energy and the National Science Foundation. These acknowledgements are not to be interpreted as an endorsement of any statement made by any of our institutes, funding agencies, governments, or their representatives. We thank the KEKB group for the excellent operation of the accelerator; the KEK cryogenics group for the efficient operation of the solenoid; and the KEK computer group and the Pacific Northwest National Laboratory (PNNL) Environmental Molecular Sciences Laboratory (EMSL) computing group for strong computing support; and the National Institute of Informatics, and Science Information NETwork 6 (SINET6) for valuable network support.
References
- (1) R. Barbier, R. Gatto, and R. Kögerler, Phys. Lett. B 60, 183 (1976)
- (2) C.R.Münz, Nucl. Phys. A 609, 364 (1996).
- (3) S. Godfrey and N. Isgur, Phys. Rev. D 32, 189 (1985).
- (4) S. N. Gupta, J. M. Johnson, and W. W. Repko, Phys. Rev. D 54, 2075 (1996).
- (5) D. Ebert, R. N. Faustov, and V. O. Galkin, Mod. Phys. Lett. A 18, 601 (2003).
- (6) G. T. Bodwin, E. Braaten, and G. P. Lepage, Phys. Rev. D 46, R1914 (1992).
- (7) H. W. Huang and K. T. Chao, Phys. Rev. D 54, 6850 (1996); 56, 1821(E) (1997).
- (8) G. A. Schuler, F. A. Berends, and R. van Gulik, Nucl. Phys. B 523, 423 (1998).
- (9) H. W. Crater, C. Y. Wong and P. Van Alstine, Phys. Rev. D 74, 054028 (2006).
- (10) J. P. Lansberg and T. N. Pham, Phys. Rev. D 79, 094016 (2009).
- (11) C. W. Hwang and R. S. Guo, Phys. Rev. D 82, 034021 (2010).
- (12) K. M. Ecklund et al. (CLEO Collaboration), Phys. Rev. D 78, 091501(R) (2008).
- (13) M. Ablikim et al. (BES III Collaboration), Phys. Rev. D 96, 092007 (2017).
- (14) K. Abe et al. (Belle Collaboration), Phys. Lett. B 540, 33 (2002).
- (15) S. Dobbs et al. (CLEO Collaboration), Phys. Rev. D 73, 071101(R) (2006).
- (16) P.A. Zyla et al. (Particle Data Group), Prog. Theor. Exp. Phys. 2020, 083C01 (2020).
- (17) C. Berger and W. Wagner, Phys. Rept. 146, 1 (1987).
- (18) A. Abashian et al. (Belle Collaboration), Nucl. Instr. and Methods Phys. Res. Sect. A 479, 117 (2002).
- (19) J. Brodzicka et al., Prog. Theor. Exp. Phys. 2012, 04D001 (2012).
- (20) S. Kurokawa and E. Kikutani, Nucl. Instr. and Methods Phys. Res. Sect. A 499, 1 (2003), and other papers included in this volume.
- (21) T. Abe et al., Prog. Theor. Exp. Phys. 2013, 03A001 (2013) and following articles up to 03A011.
- (22) S.Uehara, KEK Report 96-11, arXiv:1310.0157[hep-ph] (1996).
- (23) E. Barberio, Z. Wa̧s, Comput. Phys. Commun. 79 (1994) 291.
- (24) R. Brun et al., GEANT3.21, CERN Report No. DD/EE/84-1 (1987).
- (25) Y. Teramoto et al. (Belle Collaboration), Phys. Rev. Lett. 126, 122001 (2021).
- (26) V. Bhardwaj et al. (Belle Collaboration), Phys. Rev. D 93, 052016 (2016).
- (27) Z. Q. Liu et al. (Belle Collaboration), Phys. Rev. Lett. 110, 252002 (2013).
- (28) G. Rodrigo et al., Eur. Phy. J. C 24 (2002) 71-82.
- (29) F.A. Berends, P.H. Daverveldt and R. Kleiss, Comput. Phys. Commun. 40, 285 (1986).