Relation between crystal structure and optical properties
in the correlated blue pigment YIn1-xMnxO3
Abstract
A material’s properties and functionalities are determined by its chemical constituents and the atomic arrangement in which they crystallize. For the recently discovered pigment YIn1-xMnxO3, for instance, it had been surmised that its bright blue color owes to an unusual, trigonal bipyramidal, oxygen coordination of the manganese impurities. Here, we demonstrate that, indeed, a direct correspondence between details of the local Mn environment and the pigment’s blue color holds: Combining realistic many-body calculations (dynamical mean-field theory to treat the quasi-atomic Mn-multiplets at low doping ) with an effective medium description (Kubelka-Munk model to describe scattering in a milled pigment sample), we find that only a Mn-coordination polyhedra consisting of two distorted oxygen pyramids results in a diffuse reflectance commensurate with the experimental blue color. We motivate that the distortion of the bipyramid helps circumventing atomic selection rules, allowing for dipolar - transitions and creating the desired two-peak absorption profile.
I Introduction
While some famous blue pigments—among them Ultramarin Blue (Lapis Lazuli), Han Blue and Egyptian Blue—have been known since antiquity, most synthetic blue pigment materials were discovered with the advent of modern chemistry. Some of them, such as cobalt blue CoAl2O4, Prussian blue Fe4(Fe[CN]6)3 and azurite Cu3(CO3)2(OH)2 Eastaugh et al. (2008), however, suffer from environmental or durability issues, such that the search for new earth-abundant and environmentally-benign alternatives has remained an active field of research. Thus, it was good news when a new, stable inorganic blue pigment material, YIn1-xMnxO3, was synthesized at Oregon State University in 2009.Smith et al. (2009) Discovered by serendipity, this novel blue pigment turned out to be ideal for many potential applications from ceramic glazes Ocaña et al. (2011); Gomes et al. (2018); Gomes (2018) and industrial coatings to plastics and artists’ paint.she (2017) It is being industrially produced under the name YInMn blue since 2017.she (2017); Subramanian et al. (2012)
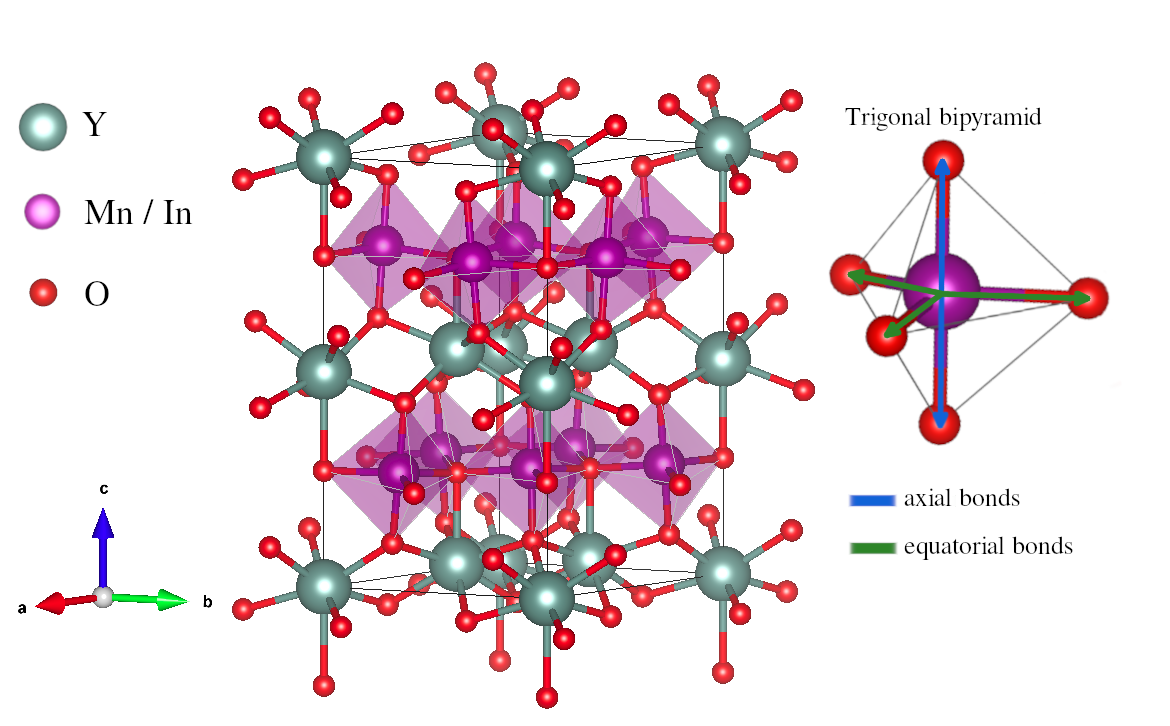
YInO3 and YMnO3 are commonly known in the perovskite structure Shannon (1967), but they can also be prepared in the hexagonal P63cm structure Pistorius and Kruger (1976) shown in Fig. 1: It consists of layers of corner-sharing, slightly tilted O5 (, Mn) trigonal bipyramids (TBP), separated by layers of Y3+ ions. The researchers at Oregon State University were interested in potential multiferroic properties of hexagonal YO3, when they noticed that replacing some In by Mn was inducing a brilliant blue color over a wide range of the paramagnetic YIn1-xMnxO3 (with ) solid-solution. Smith et al. (2009) This finding was all the more surprising since pure YInO3 and YMnO3 are white and black, respectively. From further experimental investigations of the materials’ crystal and electronic structure, it was concluded that the blue color of YIn1-xMnxO3 must be a consequence of the unusual TBP coordination of the Mn3+ ions, which determines the crystal-field splitting of the Mn 3 shell. Smith et al. (2009) A special role was attributed to the axial Mn-O bond distances, which are considerably shorter than the axial In-O bonds in YInO3Smith et al. (2009); El Amrani et al. (2012). Indeed, further investigations Li et al. (2016a); Mukherjee et al. (2018) underlined the importance of the local crystalline environment around the Mn3+ ions for the color of the pigment. In Ref. Mukherjee et al., 2018, X-ray absorption near edge structure (XANES) and extended X-ray absorption fine structure (EXAFS) spectroscopy investigations revealed the presence of two different TBP environments in YIn1-xMnxO3: one with symmetric and another one with asymmetric axial Mn-O bonds in the MnO5 bipyramids. The distorted TBP, with asymmetric axial Mn-O bonds, was found to be dominant in the regime of low Mn concentrations and claimed to be responsible for the blue coloration. The experimental findings in Refs. Smith et al., 2009; Mukherjee et al., 2018 were supported by structural relaxations within density functional theory (LSDA+) simulations. However, no explicit calculation of the electronic structure and the optical response of YIn1-xMnxO3, which could provide a direct link between structural information and the optical transitions responsible for the blue color, has been presented yet.
Indeed, systems like YIn1-xMnxO3 represent a challenge for modern electronic structure theory: First, a description of the Mn dopant and the correlation effects hosted by its open 3 shell requires many-body methods beyond standard density functional theory (DFT-LDA). Second, the need for accurate optical gaps also calls for an advanced treatment of ligand states beyond simple DFT functionals. Therefore, only few theoretical studies regarding the color of correlated pigment materials are available to dateTomczak et al. (2013); Galler et al. (2021); Acharya et al. (2022). Blue pigments are particularly difficult to simulate, since they require a two-peak structure in the optical absorption which ensures that only blue light is reflected, while all other colors are absorbed. Red or yellow pigments, instead, are conceptually easier since they only require the absorption edge (hence the optical gap) to be at the right position.
In this work, we employ the recently developed mBJ@DFT+DMFT approachGaller et al. (2021); Boust et al. (2022); Galler and Pourovskii (2022) to compute the electronic structure and optical conductivity of YIn1-xMnxO3. We focus on a Mn concentration of , for which a brilliant blue color is observed in experiment. The methodology combines an improved description of non-local exchange-driven band-gaps via the semilocal modified Becke-Johnson (mBJ)Tran and Blaha (2009); Koller et al. (2011) potential with an advanced treatment of the strongly correlated Mn 3 states within dynamical mean-field theory (DMFT)Metzner and Vollhardt (1989); Georges and Kotliar (1992). This approach has already been successfully employed to compute the electronic structure and optical absorption edge in the rare-earth fluorosulfide pigments SF (with rare-earth).Galler et al. (2021) We demonstrate that the same computational approach can be applied to YIn1-xMnxO3, where it gives valuable insight into the mechanisms that are responsible for the blue coloration of the pigment. We further model the diffuse reflectance of the milled pigment using the effective medium description by Kubelka and MunkKubelka and Munk (1931); Kubelka (1948), and compare our results to available experimental data.
II Computational approach
We start from the experimental P63cm crystal structure of YInO3. We double the unit cell in -direction and replace one of the 12 In atoms with Mn, which yields a Mn concentration of in the supercell. For numerical feasibility, we perform all calculations with this supercell, thus neglecting effects of disorder. The and lattice parameters, which show a clear linear dependence with Mn concentration , are extracted from experimental measurements of Ref. Mukherjee et al., 2018. For , this yields and . We relax all internal coordinates within DFT, employing a full-potential linear-augmented plane-wave basis set, as implemented in the WIEN2k Blaha et al. (2018, 2020) program package. In the structural relaxations, a multisecant approach Blaha et al. (2020) with a -grid of 100 -points in the reducible Brillouin zone was used and atomic positions were relaxed until forces were less than 1 mRy/bohr. We performed relaxations, both, within LDA and LSDA. We found the LSDA+-relaxed structure to be virtually unaffected by changes of within a window of . Also the type of the imposed (artificial) magnetic order (ferro- or antiferromagnetic) had no influence on the result. The LDA-relaxed structure, instead, displayed a slightly different local crystalline environment around the Mn3+ ions, which compared better to experimentMukherjee et al. (2018) (see Results and the Appendices). We therefore focus on the LDA-relaxed structure, but compare the optical conductivity of both relaxations to highlight the influence of the local crystal structure onto the color.
To compute the electronic structure and optical conductivity of paramagnetic YIn1-xMnxO3 (with ), we employ the recently developed mBJ@DFT+DMFT approach, for details of the method see Ref. Boust et al., 2022. It basically consists of three steps:
(1) We start by performing a charge-self-consistent DFT+DMFT calculation Blaha et al. (2018); Aichhorn et al. (2009, 2011, 2016), in which we treat local correlations in the Mn 3 shell with the quasi-atomic Hubbard-I Hubbard (1963) DMFT solver. To this end, we construct projective Wannier functions Aichhorn et al. (2009, 2016) representing the correlated Mn 3 states from all Kohn-Sham eigenstates enclosed by the energy window eV around the Fermi level. In the spirit of previous DMFT calculations for other transition-metal oxides Pourovskii et al. (2021); Banerjee and Aichhorn (2020), we mimic a -only (downfolded) setting by limiting the hybridization function to an energy window of eV, accounting for 92% of the Mn spectral weight from the large energy window. We use the electronic structure code WIEN2k Blaha et al. (2018) for DFT and the TRIQS Parcollet et al. (2015) and TRIQS/DFTTools Aichhorn et al. (2016) packages for DMFT.
(2) After converging the charge-self-consistent DFT+DMFT calculations, we run an additional DFT cycle employing the Tran-Blaha modified Becke-Johnson (mBJ) potential Tran and Blaha (2009); Koller et al. (2011), as implemented in WIEN2k Blaha et al. (2018). Such a perturbative use of the mBJ potential was shown to yield reliable values for semiconducting band gaps Jiang (2013). For the problem at hand, we demonstrate (see Appendix A) that a perturbative use of the mBJ potential yields a value of 3.71 eV for the band gap in pure YInO3, which is in good agreement with the experimental value of around 3.8 eV, estimated from the diffuse reflectance measured in Ref. Smith et al., 2009.
(3) After the perturbative mBJ step, we finally recalculate the electronic structure of YIn1-xMnxO3 by performing a DMFT cycle using the Hubbard-I approximation for the mBJ-corrected Kohn-Sham bands.
Our calculations do not break spin-symmetry (paramagnetic) and the Mn 3 quantum impurity problem contains all five Mn 3 orbitals. The fully rotationally-invariant local Coulomb interaction on the Mn 3 shell was parametrized by and . Previous studiesSmith et al. (2009) suggested the Mn-multiplet structure to be a crucial ingredient for the material’s color. The Hubbard parameter was therefore deliberately chosen to be of a magnitude comparable to visible light. Ideally, the interactions should be computed from first principles in the future. We further employed the fully-localized-limit double-counting correction in the atomic limit Pourovskii et al. (2007), i.e. with the Mn3+ atomic occupancy . All calculations were carried out at a temperature of 290 K.
As a result of the mBJ@DFT+DMFT calculations, we obtain the many-body spectral function encoding the excitation energies of an electron addition/removal into the many-body ground state. is a crucial ingredient for determining the absorption properties of a crystalline bulk material. By using linear response theory, and neglecting vertex corrections, the real part of the frequency-dependent optical conductivity readsDresselhaus (2001); Tomczak and Biermann (2009)
| (1) |
where is the unit-cell volume, the frequency of the incident light and Fermi functions which ensure that transitions take place only between occupied and empty states. As usual, we limit the calculation to direct optical transitions, without any momentum transfer.Dresselhaus (2001) are matrix elements of the momentum operator in the Cartesian directions or ,Ambrosch-Draxl and Sofo (2006) and are the -resolved spectral-function matrices in orbital space. The complex conductivity can be constructed from using a Kramers-Kronig transform.
To study the influence of individual orbitals and matrix elements in the optical response, we compare to the partial joint density of states
| (2) | |||||
where is the local spectral function traced over the orbital character .
When computing optical properties, we use a refined mesh of 1000 -points in the reducible Brillouin zone, a frequency spacing of 1 meV and an additional broadening of excitations .
Since pigments are used in powdered form or lacquers, i.e. as small particles within a transparent glaze, in principle a complicated multiple-scattering problem needs to be solved to obtain the diffuse reflectance . A simple and commonly used shortcut is the effective medium description by Kubelka and Munk (KM) Kubelka and Munk (1931); Kubelka (1948), which models the propagation of light through a homogeneous layer with a pigment concentration , that absorbs light with an amplitude and backscatters it with rate . Here, is the macroscopic absorption coefficient of the pigment’s crystalline bulk, linked to the complex conductivity via with the speed of light. The parameter —an inverse scattering length—contains information on the imperfect microscopic structure of the sample and is often treated as phenomenological and static ().Tomczak et al. (2013) In the KM model, the diffuse reflectance of a semi-infinite pigment layer is given by
| (3) |
Supplementing the simulated diffuse reflectance with the spectral distribution of a light source—we use the CIE standard illuminant D65S005/E-1998 (1999) corresponding to daylight on Earth—and the empirical sensitivities for the color perception of the human eyeWright (1929), we compute the coordinates in the sRGB color space Anderson et al. (1996), predicting the color of YIn1-xMnxO3.
III Results
III.1 Crystal structure
Our structural relaxations confirm the previously observed trend Li et al. (2016a); Mukherjee et al. (2018); Smith et al. (2009); El Amrani et al. (2012) of decreasing axial -O bond distances in the trigonal bipyramids (TBPs) of YO3, when In3+ ions are replaced with the smaller Mn3+. The equatorial bond lengths are less affected by the Mn substitution. Table 1 further shows an axial distortion of the TBPs for small Mn concentrations, , expanding one of the axial Mn-O bonds by . These asymmetric bond lengths have indeed been observed in XANES and EXAFS experimentsMukherjee et al. (2018) and were claimed to be important for the blue coloration of YIn1-xMnxO3 as they change the local crystalline environment of the Mn3+ ions. In our calculations, clearly asymmetric axial bond distances are observed only in the LDA-relaxed structure, see Table 1. The effect is much less pronounced for relaxations with LSDA+U (see Table 2 in Appendix B). For the electronic structure and optical calculations, we therefore proceed with the LDA-relaxed structure. For comparison, we also perform computations of the optical conductivity with symmetric axial Mn-O bond distances (LSDA+U relaxed structure). This way, we can analyse how the optical response and color of the pigment are affected by different local crystalline environments around the Mn3+ ions, which have been arguedMukherjee et al. (2018) to be present in the disordered solid-solution.
| [Å] | YInO3 | YIn1-xMnxO3 | ||
|---|---|---|---|---|
| bond | Exp. | LDA | Exp. | LDA |
| axial 1 | 2.089 | 2.088 | 1.879 | 1.891 |
| axial 2 | 2.093 | 2.111 | 2.087 | 2.045 |
| equatorial 1 | 2.097 | 2.130 | 1.976 | 1.862 |
| equatorial 2 | 2.127 | 2.122 | 1.976 | 1.862 |
| equatorial 3 | 2.127 | 2.122 | 2.087 | 1.885 |
III.2 Electronic structure and optical response
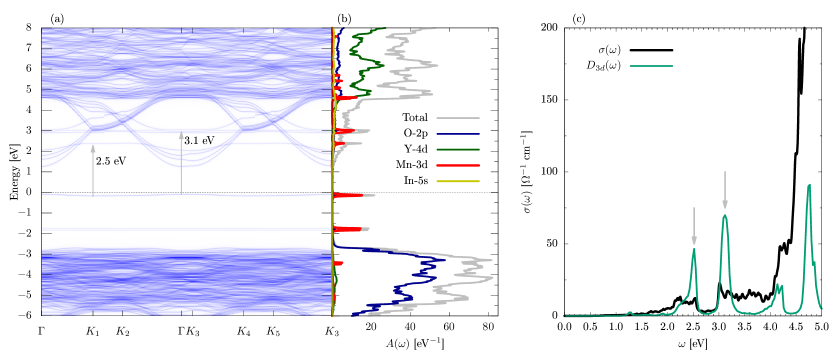
We begin with the electronic structure of crystalline bulk YIn1-xMnxO3 (with ). Figure 2a shows the -resolved spectral function , as obtained from mBJ@DFT+DMFT. The chosen -path through the Brillouin zone is specified in Figure 8 and the -integrated spectral function is depicted in Figure 2b. The valence band below -2.8 eV (energies measured from Fermi level), is mainly formed by the filled O 2 states. The conduction band starts at around 1.2 eV with some dispersive bands of mainly In 5 character, before Y 4 bands appear above 4.5 eV. The simulated O-2 – In-5 band gap in YIn0.92Mn0.08O3 thus amounts to 4 eV, which is close to the predicted and experimental value for pure YInO3 (see Appendix A). At a concentration of , the Mn atoms are fairly isolated. Accordingly, their 3 states form sharp peaks in the local spectral function, corresponding to only weakly-dispersive quasi-atomic multiplets. The most prominent part of the lower Hubbard bands, i.e. the occupied Mn 3 states directly below the Fermi energy and at -1.8 eV, are located within the O-2 – In-5 band gap. The multiplet peaks of the Mn- upper Hubbard band lie within the dispersive conduction bands, with sizable features visible in a window of 2-6 eV.
The Mn 3 states play a crucial role in the optical response of YIn0.92Mn0.08O3, as can be seen in Figure 2c, which depicts the simulated optical conductivity averaged over polarizations (see Section II) as well as the partial joint density of states (JDOS; see Equation 2) of the Mn 3 states . One can clearly see that exhibits two dominant peaks in the energy range from 1.2-4 eV. Such a two-peak structure is crucial for any blue coloration since it allows for absorption on the low- as well as high-energy side of the optical spectrum, while reflecting the blue components (2.5-2.8 eV). The shallow onset of the first absorption peak at around 1.2 eV stems from optical transitions from the highest occupied Mn 3 states (red peak in just below the Fermi energy) to the bottom of the dispersive conduction band. The principle weight of the absorption peak at around 2-2.5 eV, instead, can be traced to transitions. Indeed, a comparison with the partial JDOS suggests optical transitions from the highest occupied to the lowest unoccupied Mn 3 states to be active. In an atom, such optical transitions would be forbidden by the dipole selection rule , with . In a solid, the crystal field, hybridization with ligands, as well as non-local transitions can relax the optical selection rules so that processes become possible. The onset of the second prominent absorption peak at 3 eV is in fact also dominated by optical transitions. In this case, the relevant transitions happen between the occupied Mn 3 states just below the Fermi level and the unoccupied Mn 3 states around 3 eV. This second, broad peak in then continues till around 4 eV with transitions from Mn 3 into the conduction band. At around 4 eV, optical transitions from the O 2 valence band to the conduction band set in, leading to a rapid increase of the optical conductivity.
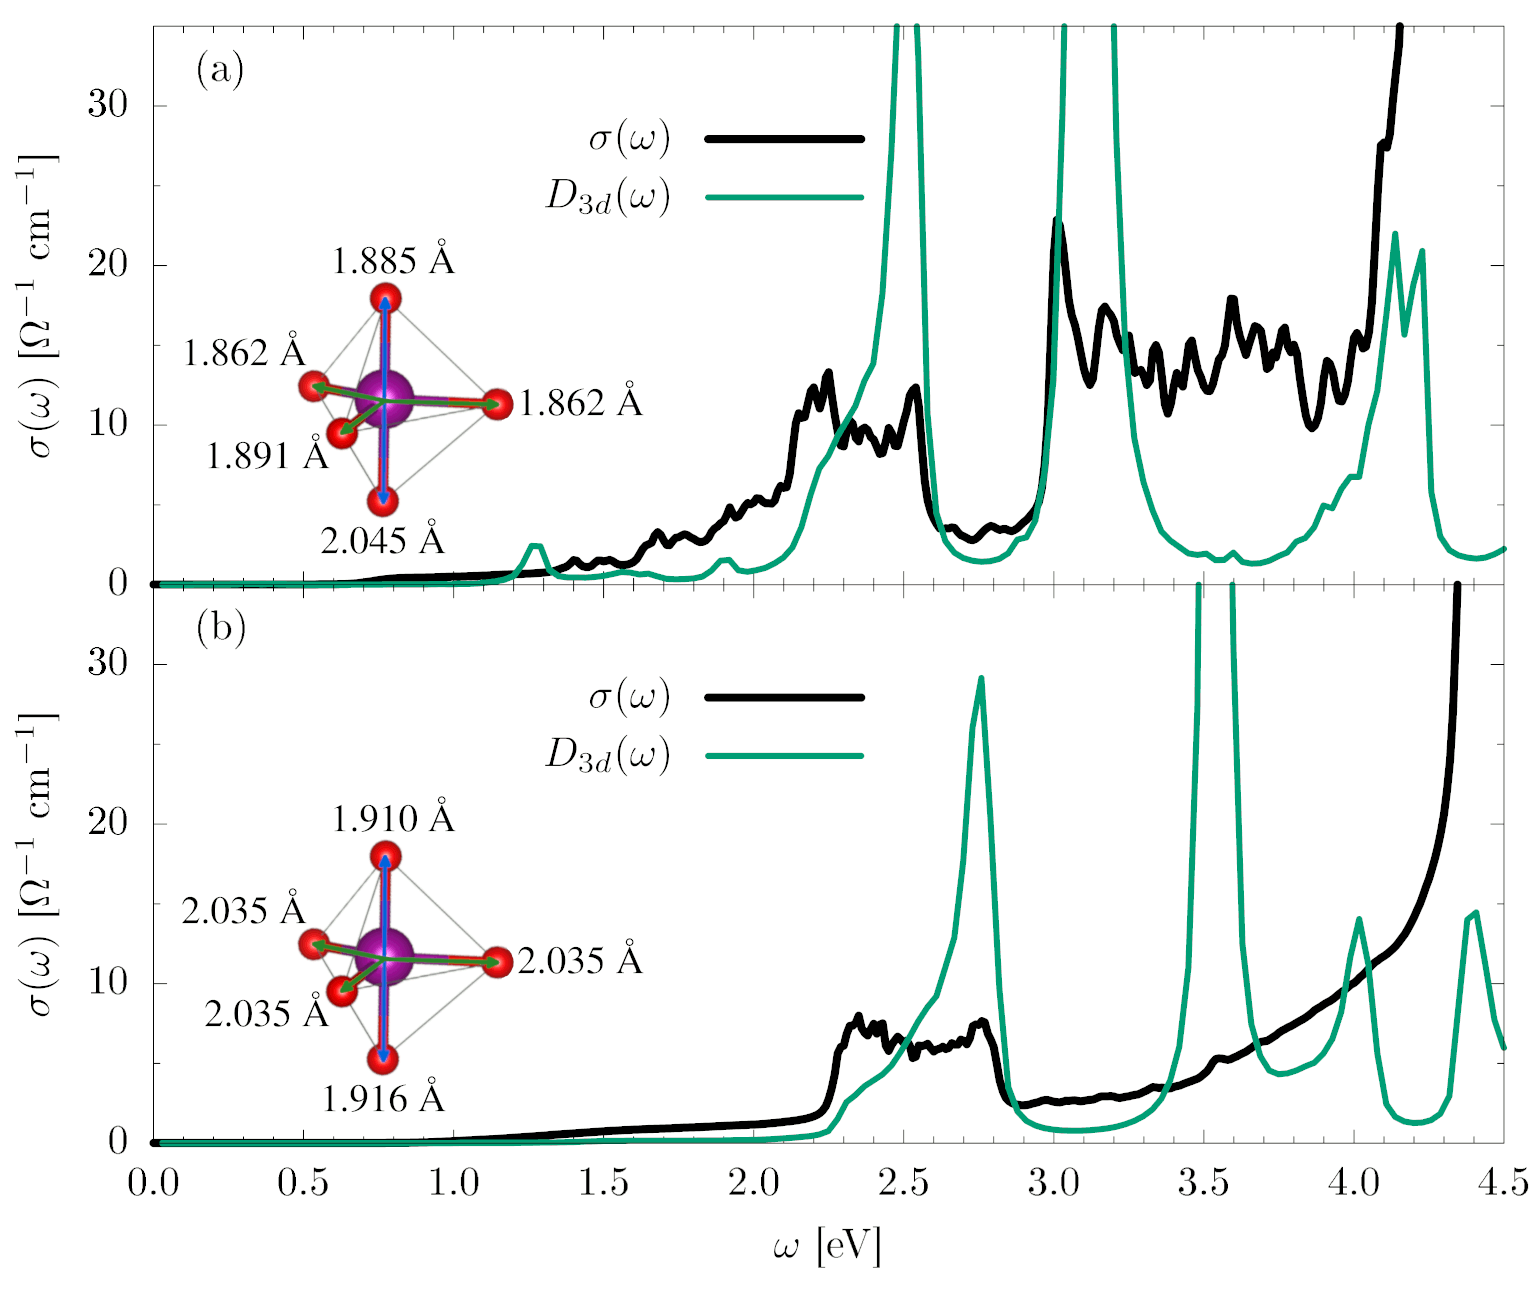
In order to identify the effect of the axially distorted TBP on the optical response of YIn0.92Mn0.08O3, we perform calculations with symmetric axial Mn-O bonds for comparison, using the crystal structure relaxed within LSDA+. The latter did not show any asymmetry in the axial bonds (see Appendix A, Table 2). Figure 3 represents a direct comparison between the optical conductivity of YIn0.92Mn0.08O3 calculated with (a) asymmetric axial Mn-O bonds as in Figure 2 and (b) assuming symmetric axial Mn-O bond lengths in the TBP. While Figure 3a shows the characteristic two-peak structure of already discussed in Figure 2c, Figure 3b looks strikingly different. The partial Mn 3 JDOS, , still displays two peaks centred at 2.7 and 3.5 eV, respectively. Compared to Figure 3a, these peaks are located at slightly different energies due to the change in the local crystalline environment of the Mn3+ ions. More importantly, the main difference between in Figure 3a and b is the absence of the second peak at 3.5 eV for symmetric TBP. Since the principle difference between the JDOS and the optical conductivity stems from the transition-matrix elements (see Section II), we assign the suppression of the peak at 3.5 eV to the latter. Intuitively, one can indeed suspect the axial distortion—introduced by the asymmetric TBP—to further relax the optical dipole selection rules. This conjecture is supported by inspecting the momentum-resolved spectra (compare Figure 2a with Figure 7 of Appendix C): In the case of the undistorted TBP—with symmetric axial Mn-O bonds—the Mn-states are visibly less dispersive and hence closer to the atomic limit, for which the dipole selection rule applies. The correspondence between dispersion and transition-matrix elements is explicit in the Peierls approximation, in which inter-unitcell transitions are weighted with , where is the non-interacting Hamiltonian.Tomczak and Biermann (2009)
In the experimental investigations of Ref. Mukherjee et al., 2018 it had already been suspected that the axial distortion of the TBP is important for the blue coloration of YIn1-xMnxO3. Our optical simulations fortify this understanding: We identify the structure-driven change in transition-matrix elements as the essential requirement: Only asymmetric axial Mn-O bonds yield the two-peak structure in the visible-range optical absorption necessary for the blue color.
III.3 Diffuse reflectance and color of the pigment
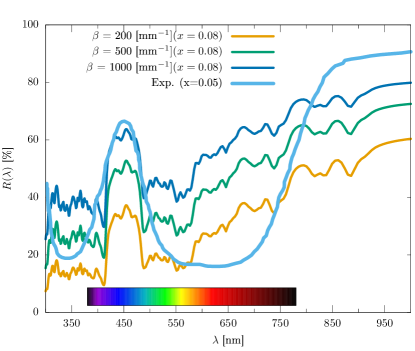
We continue by computing the diffuse reflectance as a function of wavelength , using Equation 3 and the optical conductivity from mBJ@DFT+DMFT. In Figure 4 we compare the theoretical diffuse reflectance of YIn0.92Mn0.08O3, for several values of the scattering parameter , to the experiment of Ref. Li et al., 2016b. We notice that the theoretical curves all display a pronounced reflectance peak in the blue region, which nicely matches with experiment. This reflectance peak arises from the discussed two-peak structure in the optical conductivity and is responsible for the blue color. With increasing also increases, as more incoming light is back-scattered, while the overall shape of does not change significantly. On the low-energy side of the visible spectrum, the agreement between theory and experiment is less convincing. Our simulations show a non-negligible refectance especially in the red region, which can be traced back to the weak onset of optical transitions in the 1.2-2.2 eV energy range.
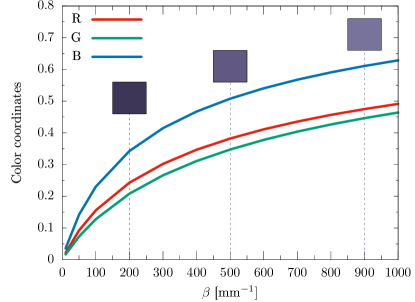
Finally, we compute the apparent color of the pigment, assuming a sample of concentration . Figure 5 shows the resulting color coordinates as a function of with and being black and white, respectively. Since the reflectance depends on , also the color coordinates do. Our results show that the blue component dominates over the entire -range, as expected. Sizable admixtures from the and components result in an overall steal-blue color in the simulation, while experimental probes exhibit a deeper blue coloration.
IV Conclusions
We have presented the first attempt to compute the optical response and color of the blue pigment YIn1-xMnxO3 from first principles. We employed the recently developed mBJ@DFT+DMFT approach and confirmed—after its application to the rare-earth fluorosulfide pigmentsGaller et al. (2021)—that this approach represents a useful computational tool for addressing the electronic structure of correlated pigment materials. In YIn1-xMnxO3, and pure YInO3, the semilocal mBJ exchange potential successfully corrects the band gap between O 2 and In 5 states, which is significantly underestimated in LDA. The DMFT, instead, is able to treat the strong on-site Coulomb interaction in the Mn 3 shell.
We found that the optical response of YIn0.92Mn0.08O3 close to the blue part of the spectrum is strongly influenced by the quasi-atomic Mn states: Optical - transitions yield a well-defined two-peak structure in the absorption, necessary for the blue coloration. The splitting of the Mn 3 states is driven by multiplet effects and the local crystalline environment around the Mn3+ ions. An important finding of our work is that asymmetric axial distortions of the trigonal bipyramid surrounding the manganese impurities are a prerequisite for the blue color: They weaken the atomic dipole selection rule, so that a pronounced two-peak structure can appear in the absorption. Our work thus establishes a direct link between the asymmetry of the Mn3+ coordination polyhedron and the blue coloration of YIn0.92Mn0.08O3. The weak absorption in the red-yellow region, due to optical transitions from Mn 3 to the dispersive bottom of the In 5 dominated conduction band, makes the pigment appear steal-blue in our calculations. Future investigations need to address the effect of Mn-disorder, as well as trends for varying Mn-concentration.
Acknowledgements.
This work is based on the results of the Master thesis Ransmayr (2022) of V. R. at TU Wien. We thank Leonid V. Pourovskii, James Boust and Silke Biermann for helpful discussions. We further acknowledge financial support by Schrödinger Fellowship J-4267 of the Austrian Science Fund (FWF). Calculations were performed on the Vienna Scientific Cluster VSC4.Appendix A Electronic structure of YInO3
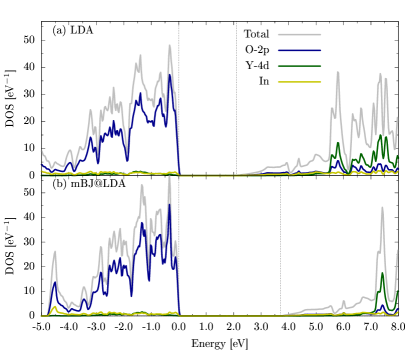
In Figure 6 we show the density of states (DOS) of pure YInO3 computed within (a) LDA and (b) mBJ@LDA. The latter refers to the perturbative useJiang (2013) of the mBJ potentialTran and Blaha (2009) on top of a converged LDA calculation. In LDA, the band gap between the O 2 dominated valence band and the bottom of the conduction band of mainly In 5 character is only 2.1 eV wide and thus significantly underestimated compared to its experimental value of approximately 3.8 eV (which can be inferred from the diffuse reflectance of YInO3 measured in Ref. Smith et al., 2009). The mBJ potential, which effectively mimics non-local exchange, corrects the band gap to 3.71 eV, which is in good agreement with experiment. Since such a perturbative use of the mBJ potential gives good results for pure YInO3, we conclude that it is also well suited for YIn1-xMnxO3, with small Mn concentrations .
Appendix B Summary of computed bond lengths
In Table 2 we summarise the results of our structural relaxations performed within LDA and LSDA+. Reported are computed axial and equatorial -O bond lengths for pure YInO3 (), YIn1-xMnxO3 () and YMnO3 (). For comparison, we also reproduce experimental values for extracted from Ref. Mukherjee et al., 2018. For small Mn concentrations , experiment and LDA relaxations show a clear axial asymmetry, in that one of the axial Mn-O bonds in the TBPs expands by . Equatorial bond lengths slightly differ from experiment. Remarkably, the LSDA+ relaxation for does not show any axial distortion of the TBPs. This difference might originate from the artificial magnetic order assumed in LSDA+. However, we cannot exclude that our simulations converged to a local energy minimum often encountered in LSDA+ calculations.
| x=0 | x= 5% | x= 8.3% | x = 1 | |||||
|---|---|---|---|---|---|---|---|---|
| bond | [Å] Exp. | [Å] LDA | [Å] Exp. | [Å] LDA | [Å] LSDA+ | [Å] Exp. | [Å] LDA | [Å] LSDA+ |
| axial 1 | 2.089 | 2.088 | 1.879 | 1.891 | 1.910 | 1.848 | 1.856 | 1.867 |
| axial 2 | 2.093 | 2.111 | 2.087 | 2.045 | 1.916 | 1.882 | 1.875 | 1.869 |
| equatorial 1 | 2.097 | 2.130 | 1.976 | 1.862 | 2.035 | 1.966 | 2.163 | 2.066 |
| equatorial 2 | 2.127 | 2.122 | 1.976 | 1.862 | 2.035 | 2.118 | 2.002 | 2.058 |
| equatorial 3 | 2.127 | 2.122 | 2.087 | 1.885 | 2.035 | 2.118 | 2.002 | 2.058 |
Appendix C Spectral function with symmetric axial Mn-O bonds
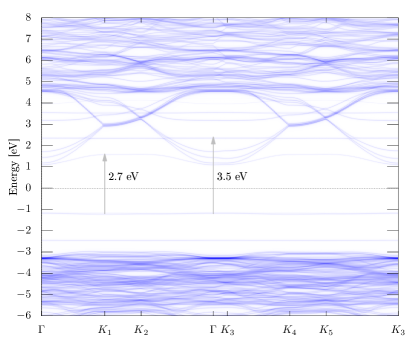
Figure 7 shows the k-resolved mBJ@DFT+DMFT spectral function of YIn0.92Mn0.08O3 assuming symmetric axial Mn-O bonds in the TBPs (structure relaxed within LSDA+, bond lengths as specified in Table 2). The Mn 3 bands are flatter and more atomic-like compared to Figure 2, completely suppressing the transitions in the optical conductivity at 3.5 eV, see Fig. 3(b).
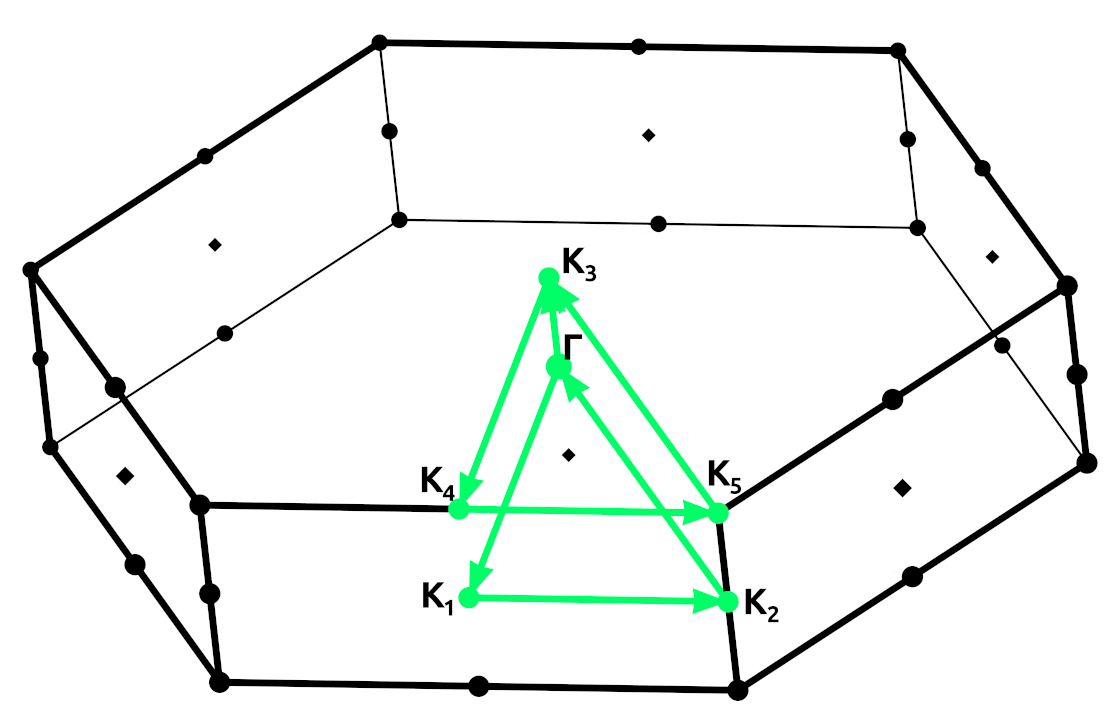
The k-path through the hexagonal Brillouin zone (BZ) of YIn0.92Mn0.08O3, employed in Figure 7 and Figure 2a, is shown in Figure 8.
References
- Eastaugh et al. (2008) N. Eastaugh, V. Walsh, T. Chaplin, and R. Siddall, Pigment Compendium: A Dictionary and Optical Microscopy of Historical Pigments (Routledge, 2008).
- Smith et al. (2009) A. E. Smith, H. Mizoguchi, K. Delaney, N. A. Spaldin, A. W. Sleight, and M. A. Subramanian, Journal of the American Chemical Society 131, 17084 (2009), https://doi.org/10.1021/ja9080666 .
- Ocaña et al. (2011) M. Ocaña, J. Espinós, and J. Carda, Dyes and Pigments 91, 501 (2011).
- Gomes et al. (2018) Y. Gomes, J. Li, K. Silva, A. Santiago, M. Bomio, C. Paskocimas, M. Subramanian, and F. Motta, Ceramics International 44, 11932 (2018).
- Gomes (2018) Y. F. Gomes, Síntese e caracterização do pigmento azul YInMnO pelo método de polimerização de complexos (MPC) (PhD thesis, Universidade Federal do Rio Grande do Norte, Brazil, 2018).
- she (2017) “YInMn blue, 200 years in the making,” https://www.shepherdcolor.com/yinmn-blue/ (2017), Accessed: 2022-06-30.
- Subramanian et al. (2012) M. A. Subramanian, A. W. Sleight, and A. E. Smith, “Materials with trigonal bipyramidal coordination and methods of making the same,” (2012), US Patent 8282728 B2.
- Momma and Izumi (2011) K. Momma and F. Izumi, Journal of Applied Crystallography 44, 1272 (2011).
- Shannon (1967) R. D. Shannon, Inorganic Chemistry 6, 1474 (1967).
- Pistorius and Kruger (1976) C. Pistorius and G. Kruger, Journal of Inorganic and Nuclear Chemistry 38, 1471 (1976).
- El Amrani et al. (2012) M. El Amrani, V. Ta Phuoc, M. Ammar, M. Zaghrioui, and F. Gervais, Solid State Sciences 14, 1315 (2012).
- Li et al. (2016a) J. Li, A. W. Sleight, and M. A. Subramanian, Chemistry of Materials 28, 6050 (2016a), https://doi.org/10.1021/acs.chemmater.6b02827 .
- Mukherjee et al. (2018) S. Mukherjee, H. Ganegoda, A. Kumar, S. Pal, C. U. Segre, and D. D. Sarma, Inorganic Chemistry 57, 9012 (2018).
- Tomczak et al. (2013) J. M. Tomczak, L. V. Pourovskii, L. Vaugier, A. Georges, and S. Biermann, Proceedings of the National Academy of Sciences 110, 904 (2013).
- Galler et al. (2021) A. Galler, J. Boust, A. Demourgues, S. Biermann, and L. V. Pourovskii, Phys. Rev. B 103, L241105 (2021).
- Acharya et al. (2022) S. Acharya, C. Weber, D. Pashov, M. van Schilfgaarde, A. I. Lichtenstein, and M. I. Katsnelson, “A theory for colors of strongly correlated electronic systems,” (2022), arxiv.2204.11081.
- Boust et al. (2022) J. Boust, A. Galler, S. Biermann, and L. V. Pourovskii, Phys. Rev. B 105, 085133 (2022).
- Galler and Pourovskii (2022) A. Galler and L. V. Pourovskii, New Journal of Physics 24, 043039 (2022).
- Tran and Blaha (2009) F. Tran and P. Blaha, Phys. Rev. Lett. 102, 226401 (2009).
- Koller et al. (2011) D. Koller, F. Tran, and P. Blaha, Phys. Rev. B 83, 195134 (2011).
- Metzner and Vollhardt (1989) W. Metzner and D. Vollhardt, Phys. Rev. Lett. 62, 324 (1989).
- Georges and Kotliar (1992) A. Georges and G. Kotliar, Phys. Rev. B 45, 6479 (1992).
- Kubelka and Munk (1931) P. Kubelka and F. Munk, Z. Tech. Phys. 12, 593 (1931).
- Kubelka (1948) P. Kubelka, J. Opt. Soc. Am. 38, 448 (1948).
- Blaha et al. (2018) P. Blaha, K. Schwarz, G. Madsen, D. Kvasnicka, J. Luitz, R. Laskowski, F. Tran, and L. D. Marks, WIEN2k, An augmented Plane Wave + Local Orbitals Program for Calculating Crystal Properties (Karlheinz Schwarz, Techn. Universität Wien, Austria,ISBN 3-9501031-1-2, 2018).
- Blaha et al. (2020) P. Blaha, K. Schwarz, F. Tran, R. Laskowski, G. K. H. Madsen, and L. D. Marks, The Journal of Chemical Physics 152, 074101 (2020), https://doi.org/10.1063/1.5143061 .
- Aichhorn et al. (2009) M. Aichhorn, L. Pourovskii, V. Vildosola, M. Ferrero, O. Parcollet, T. Miyake, A. Georges, and S. Biermann, Phys. Rev. B 80, 085101 (2009).
- Aichhorn et al. (2011) M. Aichhorn, L. Pourovskii, and A. Georges, Phys. Rev. B 84, 054529 (2011).
- Aichhorn et al. (2016) M. Aichhorn, L. Pourovskii, P. Seth, V. Vildosola, M. Zingl, O. E. Peil, X. Deng, J. Mravlje, G. J. Kraberger, C. Martins, M. Ferrero, and O. Parcollet, Computer Physics Communications 204, 200 (2016).
- Hubbard (1963) J. Hubbard, Proc. Roy. Soc. (London) A 276, 238 (1963).
- Pourovskii et al. (2021) L. V. Pourovskii, D. F. Mosca, and C. Franchini, Phys. Rev. Lett. 127, 237201 (2021).
- Banerjee and Aichhorn (2020) H. Banerjee and M. Aichhorn, Phys. Rev. B 101, 241112 (2020).
- Parcollet et al. (2015) O. Parcollet, M. Ferrero, T. Ayral, H. Hafermann, I. Krivenko, L. Messio, and P. Seth, Computer Physics Communications 196, 398 (2015).
- Jiang (2013) H. Jiang, The Journal of Chemical Physics 138, 134115 (2013).
- Pourovskii et al. (2007) L. V. Pourovskii, B. Amadon, S. Biermann, and A. Georges, Phys. Rev. B 76, 235101 (2007).
- Dresselhaus (2001) M. Dresselhaus, Optical Properties of Solids (MIT Lecture Notes, 2001).
- Tomczak and Biermann (2009) J. M. Tomczak and S. Biermann, Phys. Rev. B 80, 085117 (2009).
- Ambrosch-Draxl and Sofo (2006) C. Ambrosch-Draxl and J. O. Sofo, Computer Physics Communications 175, 1 (2006).
- S005/E-1998 (1999) J. S. I. C. S005/E-1998, CIE standard illuminants for colorimetry (ISO/CIE, 1999).
- Wright (1929) W. D. Wright, Transactions of the Optical Society 30, 141 (1929).
- Anderson et al. (1996) M. Anderson, R. Motta, S. Chandrasekar, and M. Stokes, in Proc. IS&T 4th Color and Imaging Conf. (Society for Imaging Science and Technology, 1996) pp. 238–245.
- Li et al. (2016b) J. Li, S. Lorger, J. K. Stalick, A. W. Sleight, and M. A. Subramanian, Inorganic Chemistry 55, 9798 (2016b), https://doi.org/10.1021/acs.inorgchem.6b01639 .
- Ransmayr (2022) V. Ransmayr, A DFT+DMFT study of the electronic structure and optical properties of the blue pigment material YIn1-xMnxO3, Master’s thesis, TU Wien, Vienna (2022).
- Kokalj (1999) A. Kokalj, Journal of Molecular Graphics and Modelling 17, 176 (1999), code available from http://www.xcrysden.org/.