[1]This work was supported by Health-Holland (TKI Life Sciences and Health)through the Q-Maestro project under Grant EMCLSH19006 and Philips Healthcare (Best, The Netherlands).
[type=editor, orcid=0000-0002-5013-1370] \cormark[1] \fnmark[1] url]https://ruishengsu.github.io/
[] []
1]organization=Biomedical Imaging Group Rotterdam, Department of Radiology & Nuclear Medicine, Erasmus MC, University Medical Center Rotterdam, The Netherlands., 2]organization=Department of Radiology & Nuclear Medicine, UMass Chan Medical School, Worcester, USA. 3]organization=Department of Radiology & Nuclear Medicine, Maastricht UMC, Cardiovascular Research Institute Maastricht, The Netherlands. 4]organization=Imaging Physics, Applied Sciences, Delft University of Technology, The Netherlands. 5]organization=Philips Healthcare, Best, The Netherlands.
[cor1]Corresponding author
CAVE: Cerebral Artery-Vein Segmentation in Digital Subtraction Angiography
Abstract
Cerebral X-ray digital subtraction angiography (DSA) is a widely used imaging technique in patients with neurovascular disease, allowing for vessel and flow visualization with high spatio-temporal resolution. Automatic artery-vein segmentation in DSA plays a fundamental role in vascular analysis with quantitative biomarker extraction, facilitating a wide range of clinical applications. The widely adopted U-Net applied on static DSA frames often struggles with disentangling vessels from subtraction artifacts. Further, it falls short in effectively separating arteries and veins as it disregards the temporal perspectives inherent in DSA. To address these limitations, we propose to simultaneously leverage spatial vasculature and temporal cerebral flow characteristics to segment arteries and veins in DSA. The proposed network, coined CAVE, encodes a 2D+time DSA series using spatial modules, aggregates all the features using temporal modules, and decodes it into 2D segmentation maps. On a large multi-center clinical dataset, CAVE achieves a vessel segmentation Dice of 0.84 ( 0.04) and an artery-vein segmentation Dice of 0.79 (0.06). CAVE surpasses traditional Frangi-based K-means clustering (P0.001) and U-Net (P0.001) by a significant margin, demonstrating the advantages of harvesting spatio-temporal features. This study represents the first investigation into automatic artery-vein segmentation in DSA using deep learning. The code is publicly available at https://github.com/RuishengSu/CAVE_DSA.
keywords:
Deep Learning \sepRNN \sepTemporal Transformer \sepSpatio-Temporal \sepStroke \sepBrain Vessels \sepVessel Segmentation \sepBiomarkers1 Introduction
1.1 Clinical background
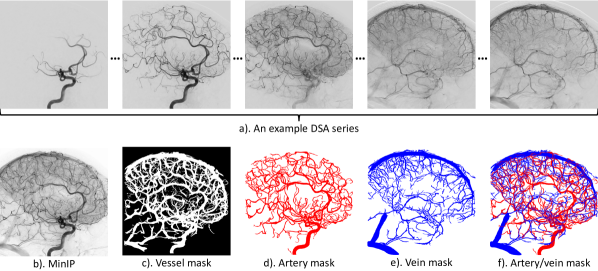
Cerebrovascular diseases are a major contributor to global mortality and long-term disability (Roth et al., 2020). These diseases encompass a range of conditions, including ischemic stroke due to vessel occlusion, stenosis, and aneurysms. In order to diagnose and treat such conditions, dynamic imaging of cerebral blood vessels is conducted using X-ray digital subtraction angiography (DSA). DSA provides a means of visualizing blood flow dynamics and changes in vasculature appearance over time (Figure 1), thereby offering valuable information for diagnosis, procedural navigation, therapeutic decision-making, and evaluation of treatment outcomes.
DSA images are conventionally examined visually by neuroradiologists and interventionalists, which could be laborious, subjective, qualitative, and vulnerable to error. Automatic segmentation of arteries and veins promises to assist in this assessment by highlighting and quantifying vascular changes, providing a foundation for a range of downstream clinical applications, including quantitative evaluation of endovascular thrombectomy, automatic emboli detection, and image guidance for real-time endovascular navigation. For example, automatic artery-vein segmentation can be valuable for providing a venous roadmap for navigation during transvenous procedures, such as dural venous sinus stenting or transvenous embolization of dural arteriovenous fistula or arteriovenous malformations. The segmented arteries and veins provide a wealth of quantitative data that can be used to extract and analyze various blood flow-related biomarkers for peri-operative decision-making and post-operative prognosis.
DSA is a dynamic imaging technique that provides a visual representation of blood flow over time through a series of consecutive frames (Figure 1). Although existing semantic segmentation networks could be utilized for end-to-end artery-vein segmentation, most methods only consider static frames. When addressing artery-vein segmentation in DSA series, which are 2D+time image sequences, the temporal dimension is relevant. We hypothesize that effectively incorporating spatio-temporal flow dynamics is key for achieving accurate artery-vein segmentation in DSA. The aim of this work, therefore is to harness the high-resolution contrast flow dynamics of DSA for improved artery-vein segmentation through spatio-temporal learning techniques.
1.2 Related work
Vessel segmentation is an extensively studied field in medical imaging for over two decades, with recent advancements propelled by deep learning. While recent works on vessel segmentation (Moccia et al., 2018) primarily focus on retinal (Chen et al., 2021a; Fraz et al., 2012) and lung imaging (Sluimer et al., 2006; Tan et al., 2021; Van Rikxoort and Van Ginneken, 2013), in brain vascular imaging, various methods have been proposed to segment cerebral vessels on different image modalities such as MRA (Phellan and Forkert, 2017; Phellan et al., 2017; Robben et al., 2016), CT angiography (CTA) (Fu et al., 2020; Su et al., 2020), and DSA (Liu et al., 2018; Su et al., 2021; Vepa et al., 2022; Zhang et al., 2020) using U-Net (Ronneberger et al., 2015). However, existing methods mainly rely on spatial vasculature features learned from static 2D DSA frames without considering the complete series. It has been shown that U-Net can generate false positives on subtraction artifacts that appear similar to blood vessels (Zhang et al., 2020).
Artery-vein segmentation has been explored on fundus images (Hemelings et al., 2019) and non-contrast lung CT images (Qin et al., 2021) using U-Net. However, research on cerebral artery-vein segmentation is limited to 4D CTA (Meijs et al., 2020), 3D MRA images (Hilbert et al., 2020) using 3D U-Net models, and 3D-DSA (Raz et al., 2021). These methods rely on either spatial features (Hilbert et al., 2020) or manually crafted temporal parameters (Meijs et al., 2020) for separating arteries and veins. In a previous study (Van Asperen et al., 2022), we investigated automatic classification of arteries and veins using K-means clustering where vessel enhancement and binarization are performed beforehand using the Frangi filter. The quality of vessel segmentation through Frangi filter depends on the choice of the binarization threshold, a parameter that exhibits high variability across different DSA images. Nevertheless, to the best of our knowledge, no fully automatic and robust artery-vein segmentation algorithm has been developed for DSA images yet.
1.3 Contributions
This work presents CAVE, the first automatic method for artery-vein segmentation in DSA using deep learning, establishing a new benchmark. CAVE takes a 2D+time video sequence with variable length as input and produces 2D artery-vein segmentations as output. We leverage U-Net for spatial vasculature representation and temporal modules to learn temporal cerebral contrast flow characteristics simultaneously. On a multi-center clinical dataset, we demonstrate the utility of deep learning in cerebral artery-vein segmentation. CAVE may facilitate fast, accurate, and objective interpretation of cerebral vasculature in DSA, thus assisting endovascular interventions in clinical practice.
The remainder of this paper is organized as follows: Section 2 describes the proposed artery-vein segmentation method and Section 3 details the experimental dataset and annotation process. The extensive experiments and results are presented in Section 4, and further discussed in Section 5. Finally, Section 6 summarizes the conclusions of this study.
2 Methods
A cerebral digital subtraction angiography (DSA) series consists of a sequence of X-ray images captured post-contrast media injection, subtracted from the initial frame (pre-contrast image). This sequence presents the arrival of contrast media and the cerebral blood flow dynamics over time. The primary objective of this work is to develop an automated method for segmenting arteries and veins from a given DSA series, obtaining 2D artery-vein label masks as shown in Figure 1.
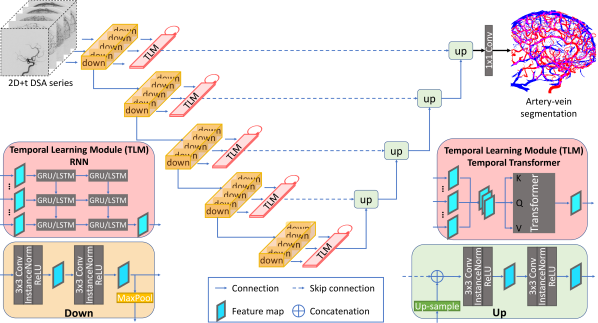
Rather than relying on pixel-wise time-intensity curves (TICs) or vasculature appearance separately, we propose to simultaneously leverage spatial and temporal features to segment arteries and veins in an end-to-end way. The proposed network architecture (Figure 2) takes DSA series of varying lengths as input. In the encoding path, each frame undergoes the same set of convolutional operations with shared weights, and the resulting features are temporally encoded to capture the spatio-temporal flow dynamics across all frames. These aggregated features are concatenated in the decoder path to generate high-resolution segmentation maps, resulting in a two-channel binary image that represents the segmented arteries and veins. The model is fully convolutional, thus allowing for input of varying sizes and temporal resolutions.
2.1 Spatial learning
The proposed CAVE (Figure 2) employs a UNet-like architecture for spatial encoding and decoding of DSA frames, which comprises five down layers (yellow boxes) and five up layers (green boxes). Each layer utilizes double-convolution blocks with instance normalization and ReLU activation. Max pooling and bilinear upsampling are utilized for the contracting and expanding path respectively. The number of feature channels starts from 64 and doubles after each max pooling and halves after each bilinear upsampling operation. In Figure 2, it is only for illustration purposes that the down blocks appear to be replicated. In practice, all frames of the DSA series share the same down block for feature extraction, thereby avoiding an exponential increase in training parameters.
2.2 Temporal learning
We extend our approach beyond spatial representation learning by incorporating temporal learning techniques to improve the accuracy of artery-vein segmentation in DSA. Specifically, we explore three state-of-the-art techniques: convolutional GRU (ConvGRU) (Ballas et al., 2015), convolutional LSTM (ConvLSTM) (Shi et al., 2015), and temporal transformer (TT) based on Vaswani et al. (2017). These techniques allow for the processing of input series of varying lengths and encoding them into fixed-sized representations, thereby enabling temporal aggregation of information. We apply this feature extraction and temporal aggregation process in all five layers, which operate on multi-scale image features.
Recurrent neural networks (RNN), such as GRU and LSTM, have been widely used in learning sequential information flow using a gate mechanism. In this work, we tailor ConvGRU and ConvLSTM to distinguish vessels from subtraction artifacts. The high-level architecture is shown in Figure 2. The module takes the spatial features of size generated from the U-Net encoders of each frame as input, and produces aggregated feature maps of size that align in dimensions with the corresponding decoder branch. , , , , represents the batch size, frame length, channel size, image height, and image width respectively. In this work, the ConvGRU and ConvLSTM modules each consist of two convolutional RNN layers with a kernel size of and with hidden dimensions equal to input dimensions. Such an end-to-end trained module is designed to learn complex spatio-temporal features. It is worth noting that this module allows a variable number of input frames.
Besides RNN, Transformer (Vaswani et al., 2017) has been shown effective in numerous deep learning tasks including image segmentation. We developed a temporal transformer module, as sketched in Figure 2, to learn aggregate temporal features through temporal attention. In principle, temporal attention learns to allocate weights to relevant frames to distinguish arteries, veins, and subtraction artifacts. The module takes as input the UNet-encoded feature maps of all frames, and aggregates temporal features along the time dimension with a kernel of . The resulting feature map maintains the same size as a single-frame feature map, which is then concatenated with the decoding branch to construct the high-resolution segmentation map. In this work, the temporal transformer module consists of one multi-head attention layer with a kernel size of and with hidden dimensions equal to input dimensions.
2.3 Loss function
We define the loss function for vessel segmentation () as a combination of a cross-entropy loss and a Dice loss (Kervadec and de Bruijne, 2023). For artery-vein segmentation, we similarly define the loss function as
| (1) | ||||
The subscript "" and "" denote artery and vein respectively. and denote the predicted class probability and the reference binary label. More specifically, the cross-entropy loss , defined as
| (2) |
measures the difference between the reference labels and predicted class probabilities. The Dice loss and are defined as
| (3) |
where denotes the subset of the image space where is positive.
3 Data
The study uses data from the MR CLEAN Registry (Jansen et al., 2018). It is an observational cohort study that included patients with acute ischemic stroke from sixteen centers in the Netherlands between March 2014 and December 2018. From this multi-center clinical registry, we manually segmented arteries and veins on 97 DSA series from different patients with either anterior-posterior (AP) or lateral views. The DSA series were acquired using various imaging systems (e.g., Philips, GE, and Siemens). The size of the individual frames of the acquired DSA series is pixels. The series have different lengths, ranging from 10 to 50 frames, and varying temporal resolutions ranging from 0.5 to 4 frames per second.
The artery-vein annotations were created using an in-house developed tool in MeVisLab (Heckel et al., 2009) by four trained clinical students. To reduce inter-observer variability, the annotations were further refined by another trained student. An experienced radiologist was available for consultation during annotation. As visualized in Figure 1, the annotation results in two segmentation images, with arterial annotation in red and venous annotation in blue. Overlapping pixels have both labels as the two annotations are independent. These annotations serve as the reference standard in this work.
4 Experiments and Results
4.1 Implementation details
The proposed methods were implemented in PyTorch (Paszke et al., 2019), all trained on an NVIDIA RTX A40 GPU. As pre-processing, we resized all frames to pixels, linearly resampled the temporal resolution to 1 fps, and normalized the intensity values to . The corresponding mask images were also resized to the same resolution. In addition, data augmentation techniques, i.e., horizontal flipping, translation range, scaling range, and rotation range, were randomly applied during training with a probability of 0.5 for each.
We randomly split the dataset into training, validation, and testing set with a ratio of 50%-20%-30% on the patient level. The models were trained using RMSprop optimization (Hinton et al., 2012) and a ReduceLROnPlateau (Paszke et al., 2019) scheduler with a patience of 10 epochs, a decay factor of 0.5, and an initial learning rate of . An early stopping strategy was applied with a patience of 50 epochs and a maximum of 1000 epochs.
4.2 Baselines
To benchmark the performance of CAVE and comprehensively assess the added value of simultaneous spatio-temporal learning in distinguishing vessels from subtraction artifacts, we implemented three representative solutions and evaluated the CAVE against those.
Frangi+K-means. We implemented a conventional two-step artery-vein classification method (Van Asperen et al., 2022) that combines the Frangi filter and K-means clustering. First, the Frangi filter is applied on the static minimum intensity map (MinIP) of an input DSA, followed by fixed thresholding to obtain a binary vessel mask. Subsequently, all the vessel pixels are classified into either arteries or veins using k-means clustering based on the time-intensity curve (TIC) of each pixel.
U-Net semantic segmentation. Apart from classical machine learning, a standard U-Net could be directly utilized for identifying arteries and veins. We implemented a deep learning baseline using U-Net (Ronneberger et al., 2015; Zhang et al., 2020). The architecture is similar to the architecture in Figure 2 with the contracting path replaced by stand-alone down blocks. With this approach, U-Net uses the MinIP image as input, instead of taking all frames from a DSA series. Consequently, U-Net purely relies on spatial vasculature features to differentiate between arteries and veins without considering the temporal contrast flow features.
U-Net+K-means. To utilize both spatial and temporal features for artery-vein segmentation, we further developed a two-stage baseline approach that cascades U-Net and K-means clustering that sequentially leverages spatial and temporal information. The U-Net encodes a MinIP image and produces a binary vessel segmentation. The vessel pixels are subsequently clustered into arteries and veins via K-means clustering on the time-intensity curves.
4.3 Evaluation metrics
We assess these methods on a hold-out test set composed of 26 DSA sequences from various patients from two perspectives: vessel segmentation and artery-vein segmentation (Table 1). We report the Dice coefficients, accuracy, sensitivity, and specificity for vessel segmentation. For artery-vein segmentation, we additionally evaluate the artery Dice (), vein Dice (), and multi-class Dice (). We define and vein Dice as
| (4) |
and
| (5) |
where the subscript and denote artery and vein respectively. TP, FP, and FN are true positive, false positive, and false negative respectively. We define the multi-class Dice () as
| (6) |
Besides, we compute statistical significance using the paired Wilcoxon test on the Dice coefficients.
| Method | Vessel segmentation | Artery-vein segmentation | ||||||||
| Acc | Sens | Spec | Dice | Acc | Sens | Spec | A-Dice | V-Dice | M-Dice | |
| Frangi + K-means | 0.830 | 0.685 | 0.887 | 0.695 | 0.816 | 0.625 | 0.891 | 0.647 | 0.539 | 0.597 |
| 0.048 | 0.127 | 0.088 | 0.094 | 0.050 | 0.114 | 0.083 | 0.077 | 0.115 | 0.084 | |
| U-Net | 0.890 | 0.790 | 0.933 | 0.804 | 0.865 | 0.684 | 0.941 | 0.700 | 0.631 | 0.670 |
| 0.032 | 0.071 | 0.029 | 0.050 | 0.041 | 0.078 | 0.028 | 0.082 | 0.070 | 0.060 | |
| U-Net + K-means | 0.890 | 0.790 | 0.933 | 0.804 | 0.873 | 0.725 | 0.934 | 0.730 | 0.648 | 0.692 |
| 0.032 | 0.071 | 0.029 | 0.050 | 0.035 | 0.071 | 0.028 | 0.060 | 0.067 | 0.050 | |
| CAVE (Temporal Transformer) | 0.907 | 0.831 | 0.939 | 0.837 | 0.899 | 0.785 | 0.947 | 0.819 | 0.739 | 0.781 |
| 0.029 | 0.064 | 0.025 | 0.041 | 0.032 | 0.071 | 0.024 | 0.054 | 0.071 | 0.048 | |
| CAVE (ConvLSTM) | 0.910 | 0.825 | 0.944 | 0.833 | 0.902 | 0.799 | 0.946 | 0.821 | 0.752 | 0.789 |
| 0.025 | 0.060 | 0.025 | 0.048 | 0.031 | 0.075 | 0.022 | 0.062 | 0.058 | 0.052 | |
| CAVE (ConvGRU) | 0.909 | 0.837 | 0.940 | 0.840 | 0.904 | 0.793 | 0.950 | 0.824 | 0.762 | 0.794 |
| 0.027 | 0.062 | 0.022 | 0.039 | 0.035 | 0.078 | 0.024 | 0.077 | 0.054 | 0.057 | |
4.4 Quantitative analysis
In Table 1, we present the results of CAVE and other representative solutions on the test set in terms of vessel segmentation and artery-vein segmentation. Regarding vessel segmentation, both U-Net and CAVE significantly outperform the Frangi+K-means approach in terms of Dice coefficient with a margin of 10% (P0.001). Notably, CAVE substantially surpasses U-Net by 3.6% (P=0.023) and the Frangi+K-means approach by 14% (P0.001), demonstrating the effectiveness of incorporating simultaneous spatio-temporal vascular and flow representation for separating vessels from subtraction artifacts or other static instruments.
With respect to artery-vein segmentation, the advantage of spatio-temporal learning is even more prominent as shown in Table 1. While Frangi+K-means, by relying solely on pixel-wise temporal characteristics, achieves a multi-class Dice coefficient of 0.597 (0.084), spatial feature-based deep learning (U-Net) obtains a higher Dice coefficient of 0.670 (0.060). The U-Net+K-means approach, which leverages spatial and temporal features in two sequential stages, achieves a Dice coefficient of 0.692 (0.050). In contrast, by integrating both vasculature appearance and flow dynamics, CAVE yields a significantly higher multi-class Dice coefficient of 0.794 (0.057) compared to U-Net (P0.001) and Frangi+K-means (P0.001). Overall, CAVE demonstrates significant improvements in artery-vein segmentation by incorporating the temporal contrast flow aspects of DSA in end-to-end learning. We observe no statistically significant differences among ConvGRU, ConvLSTM, and the temporal transformer.
4.5 Qualitative analysis
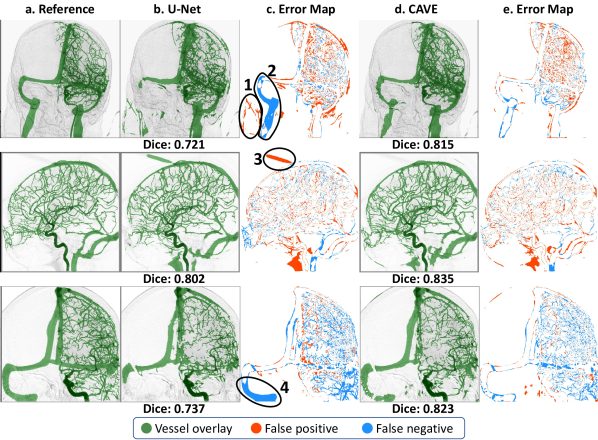
To provide a comprehensive comparison between the proposed CAVE and U-Net, we present representative visualizations and qualitative evaluations. CAVE is particularly effective in distinguishing cerebral vessels from the subtraction artifacts, instruments, and subtraction artifacts, thanks to its ability in learning temporal contrast flow dynamics. In Figure 3, we provide visual comparisons of vessel segmentation results using U-Net and CAVE. The error maps, shown in columns c and e, use orange to indicate false positives and light blue to indicate false negatives. We identify two scenarios. First, in regions #1 and #3, where U-Net mistakenly recognizes subtraction artifacts and static instruments as vessels (column c), CAVE correctly avoids such misclassifications (column e). Furthermore, CAVE successfully identifies venous vessels, as shown in regions #2 and #4, even when they are surrounded by subtraction artifacts based on their temporal characteristics, whereas U-Net fails to detect them in the presence of noise in the background.
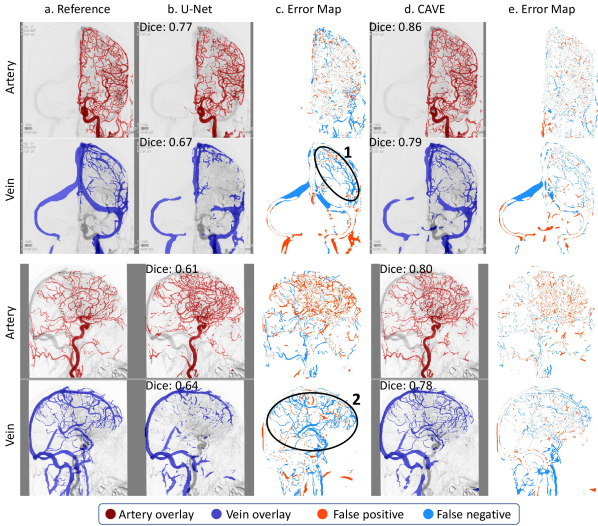
Figure 4 presents two examples illustrating the performance of U-Net and CAVE in artery-vein segmentation. Compared to manual annotations (column a), CAVE (column e) shows fewer errors than U-Net (column c). While U-Net performs well in recognizing large vessels such as proximal arteries and the superior sagittal sinus (SSS), it struggles to correctly classify distal arteries and veins, as highlighted in regions #1 and #2. In contrast, CAVE achieves accurate classification in both small and large vessels, demonstrating its effectiveness in capturing spatial and temporal features.
5 Discussion
In this work, we proposed a fully automated deep learning-based method for artery-vein segmentation in cerebral DSA images. Through quantitative and qualitative comparisons, we have demonstrated the added value of simultaneous spatio-temporal learning against spatial learning, temporal learning, and sequential two-stage spatial and temporal learning.
This application-tailored solution innovatively leverages the distinctive temporal contrast flow characteristics in DSA to precisely identify cerebral arteries and veins while alleviating misclassifications of subtraction artifacts and other surgical instruments. The primary focus of the analyses revolves around evaluating the inherent benefits of harnessing temporal information. For quantitative assessments, we employ the foundational U-Net as our benchmark. With the rapidly evolving landscape of deep network architectures, the U-Net may not be positioned among the most recent models in the current literature. More recent state-of-the-art networks, such as nnUNet (Isensee et al., 2021), UNet++ (Zhou et al., 2018) or TransUNet (Chen et al., 2021b) may offer superior performance than UNet purely based on spatial features from MinIP images. Nevertheless, adapting the baseline spatial learning module and capitalizing on the abundant temporal flow dynamics are orthogonal and mutually reinforcing efforts to improve performance.
CAVE is designed to take complete DSA series with variable lengths and output an overall 2D artery-vein segmentation map for an input DSA series. The explored TLM modules are flexible in terms of input dimensions. These modules are capable of handling DSA series with variable lengths, while alternative methods such as 3D U-Net, direct feature concatenating, or temporal convolutional network (TCN) (Lea et al., 2016) typically cannot. It necessities temporal sliding or temporal padding/cropping to utilize models that require fixed frame length. Such models would also require temporarily varying annotations to train.
We note that the segmentation Dice scores of veins are on average lower than those of arteries across all methods. This observation can be attributed to several factors: 1) venous vessels typically exhibit relatively lighter intensities and more ambiguous boundaries, making them challenging to be accurately predicted; 2) the quality of vein annotations may also be comparatively lower due to increased annotation difficulties; 3) there tends to be a scarcity of venous phase frames, especially in cases of incomplete DSA series when image acquisition is prematurely stopped by the operator.
Building upon this work, future research may investigate the influence of patient motion on those spatio-temporal techniques for artery-vein segmentation. From the clinical perspective, there is significant value in conducting thorough validations to assess the clinical generalizability of CAVE.
6 Conclusion
We have presented CAVE, a deep learning-based cerebral vessel and artery-vein segmentation method in digital subtraction angiography. It integrates both spatial vascular appearance and temporal contrast flow dynamics in a unified end-to-end framework, producing high-quality multi-class segmentations from cerebral DSA series with variable lengths. Experimental results on a multi-center clinical dataset demonstrate that CAVE significantly outperforms existing methods. Qualitative analyses further underpin the advantages of CAVE in distinguishing vessels from subtraction artifacts. CAVE has the potential to facilitate vessel-based quantitative analyses for clinical diagnosis, prognosis, and treatment planning in endovascular interventions.
Acknowledgments
We want to thank the MR CLEAN Registry investigators for their contributions. The MR CLEAN Registry was funded and carried out by the Erasmus University Medical Centre, Amsterdam University Medical Centers, location AMC, and Maastricht University Medical Centre. The study was additionally funded by the Applied Scientific Institute for Neuromodulation (Toegepast Wetenschappelijk Instituut voor Neuromodulatie).
Declaration of Generative AI
During the preparation of this work, the author(s) used ChatGPT in order to improve readability. After using this tool/service, the author(s) reviewed and edited the content as needed and take(s) full responsibility for the content of the publication.
References
- Ballas et al. (2015) Ballas, N., Yao, L., Pal, C., Courville, A., 2015. Delving deeper into convolutional networks for learning video representations. arXiv preprint arXiv:1511.06432 .
- Chen et al. (2021a) Chen, C., Chuah, J.H., Raza, A., Wang, Y., 2021a. Retinal vessel segmentation using deep learning: A review. IEEE Access .
- Chen et al. (2021b) Chen, J., Lu, Y., Yu, Q., Luo, X., Adeli, E., Wang, Y., Lu, L., Yuille, A.L., Zhou, Y., 2021b. Transunet: Transformers make strong encoders for medical image segmentation. arXiv preprint arXiv:2102.04306 .
- Fraz et al. (2012) Fraz, M.M., Remagnino, P., Hoppe, A., Uyyanonvara, B., Rudnicka, A.R., Owen, C.G., Barman, S.A., 2012. Blood vessel segmentation methodologies in retinal images–a survey. Computer methods and programs in biomedicine 108, 407–433.
- Fu et al. (2020) Fu, F., Wei, J., Zhang, M., Yu, F., Xiao, Y., Rong, D., Shan, Y., Li, Y., Zhao, C., Liao, F., et al., 2020. Rapid vessel segmentation and reconstruction of head and neck angiograms using 3d convolutional neural network. Nature communications 11, 1–12.
- Heckel et al. (2009) Heckel, F., Schwier, M., Peitgen, H.O., 2009. Object-oriented application development with mevislab and python. Informatik 2009–Im Focus das Leben .
- Hemelings et al. (2019) Hemelings, R., Elen, B., Stalmans, I., Van Keer, K., De Boever, P., Blaschko, M.B., 2019. Artery–vein segmentation in fundus images using a fully convolutional network. Computerized Medical Imaging and Graphics 76, 101636.
- Hilbert et al. (2020) Hilbert, A., Madai, V.I., Akay, E.M., Aydin, O.U., Behland, J., Sobesky, J., Galinovic, I., Khalil, A.A., Taha, A.A., Wuerfel, J., et al., 2020. Brave-net: fully automated arterial brain vessel segmentation in patients with cerebrovascular disease. Frontiers in artificial intelligence , 78.
- Hinton et al. (2012) Hinton, G., Srivastava, N., Swersky, K., 2012. Neural networks for machine learning—lecture 6e—rmsprop: Divide the gradient by a running average of its recent magnitude. URL: https://www. cs. toronto. edu/tijmen/csc321/slides/lectureslideslec6.pdf .
- Isensee et al. (2021) Isensee, F., Jaeger, P.F., Kohl, S.A., Petersen, J., Maier-Hein, K.H., 2021. nnu-net: a self-configuring method for deep learning-based biomedical image segmentation. Nature methods 18, 203–211.
- Jansen et al. (2018) Jansen, I.G., Mulder, M.J., Goldhoorn, R.J.B., 2018. Endovascular treatment for acute ischaemic stroke in routine clinical practice: prospective, observational cohort study (mr clean registry). bmj 360.
- Kervadec and de Bruijne (2023) Kervadec, H., de Bruijne, M., 2023. On the dice loss variants and sub-patching, in: Medical Imaging with Deep Learning, short paper track.
- Lea et al. (2016) Lea, C., Vidal, R., Reiter, A., Hager, G.D., 2016. Temporal convolutional networks: A unified approach to action segmentation, in: Computer Vision–ECCV 2016 Workshops: Amsterdam, The Netherlands, October 8-10 and 15-16, 2016, Proceedings, Part III 14, Springer. pp. 47–54.
- Liu et al. (2018) Liu, B., Jiang, Q., Liu, W., Wang, M., Zhang, S., Zhang, X., Zhang, B., Yue, Z., 2018. A vessel segmentation method for serialized cerebralvascular dsa images based on spatial feature point set of rotating coordinate system. Computer Methods and Programs in Biomedicine 161, 55–72.
- Meijs et al. (2020) Meijs, M., Pegge, S.A., Vos, M.H., Patel, A., van de Leemput, S.C., Koschmieder, K., Prokop, M., Meijer, F.J., Manniesing, R., 2020. Cerebral artery and vein segmentation in four-dimensional ct angiography using convolutional neural networks. Radiology: Artificial Intelligence 2, e190178.
- Moccia et al. (2018) Moccia, S., De Momi, E., El Hadji, S., Mattos, L.S., 2018. Blood vessel segmentation algorithms—review of methods, datasets and evaluation metrics. Computer methods and programs in biomedicine 158, 71–91.
- Paszke et al. (2019) Paszke, A., Gross, S., Massa, F., Lerer, A., Bradbury, J., Chanan, G., Killeen, T., Lin, Z., Gimelshein, N., Antiga, L., et al., 2019. Pytorch: An imperative style, high-performance deep learning library, in: Advances in neural information processing systems, pp. 8026–8037.
- Phellan and Forkert (2017) Phellan, R., Forkert, N.D., 2017. Comparison of vessel enhancement algorithms applied to time-of-flight mra images for cerebrovascular segmentation. Medical physics 44, 5901–5915.
- Phellan et al. (2017) Phellan, R., Lindner, T., Helle, M., Falcao, A.X., Forkert, N.D., 2017. Automatic temporal segmentation of vessels of the brain using 4d asl mra images. IEEE transactions on biomedical engineering 65, 1486–1494.
- Qin et al. (2021) Qin, Y., Zheng, H., Gu, Y., Huang, X., Yang, J., Wang, L., Yao, F., Zhu, Y.M., Yang, G.Z., 2021. Learning tubule-sensitive cnns for pulmonary airway and artery-vein segmentation in ct. IEEE Transactions on Medical Imaging 40, 1603–1617.
- Raz et al. (2021) Raz, E., Shapiro, M., Mir, O., Nossek, E., Nelson, P., 2021. Arterial and venous 3d fusion av-3d-dsa: a novel approach to cerebrovascular neuroimaging. American Journal of Neuroradiology 42, 1282–1284.
- Robben et al. (2016) Robben, D., Türetken, E., Sunaert, S., Thijs, V., Wilms, G., Fua, P., Maes, F., Suetens, P., 2016. Simultaneous segmentation and anatomical labeling of the cerebral vasculature. Medical image analysis 32, 201–215.
- Ronneberger et al. (2015) Ronneberger, O., Fischer, P., Brox, T., 2015. U-net: Convolutional networks for biomedical image segmentation, in: International Conference on Medical image computing and computer-assisted intervention, Springer. pp. 234–241.
- Roth et al. (2020) Roth, G.A., Mensah, G.A., Johnson, C.O., Addolorato, G., Ammirati, E., Baddour, L.M., Barengo, N.C., Beaton, A.Z., Benjamin, E.J., Benziger, C.P., et al., 2020. Global burden of cardiovascular diseases and risk factors, 1990–2019: update from the gbd 2019 study. Journal of the American College of Cardiology 76, 2982–3021.
- Shi et al. (2015) Shi, X., Chen, Z., Wang, H., Yeung, D.Y., Wong, W.K., Woo, W.C., 2015. Convolutional lstm network: A machine learning approach for precipitation nowcasting. Advances in neural information processing systems 2015, 802–810.
- Sluimer et al. (2006) Sluimer, I., Schilham, A., Prokop, M., van Ginneken, B., 2006. Computer analysis of computed tomography scans of the lung: a survey. IEEE Transactions on Medical Imaging 25, 385–405. doi:10.1109/TMI.2005.862753.
- Su et al. (2020) Su, J., Wolff, L., van Es, A.C.M., Van Zwam, W., Majoie, C., Dippel, D.W., Van Der Lugt, A., Niessen, W.J., Van Walsum, T., 2020. Automatic collateral scoring from 3d cta images. IEEE transactions on medical imaging 39, 2190–2200.
- Su et al. (2021) Su, R., Cornelissen, S.A.P., van der Sluijs, M., van Es, A.C.G.M., van Zwam, W.H., Dippel, D.W.J., Lycklama, G., van Doormaal, P.J., Niessen, W.J., van der Lugt, A., van Walsum, T., 2021. autotici: Automatic brain tissue reperfusion scoring on 2d dsa images of acute ischemic stroke patients. IEEE Transactions on Medical Imaging 40, 2380–2391. doi:10.1109/TMI.2021.3077113.
- Tan et al. (2021) Tan, W., Zhou, L., Li, X., Yang, X., Chen, Y., Yang, J., 2021. Automated vessel segmentation in lung ct and cta images via deep neural networks. Journal of X-ray science and technology , 1–15.
- Van Asperen et al. (2022) Van Asperen, V., Van Den Berg, J., Lycklama, F., Marting, V., Cornelissen, S., Van Zwam, W.H., Hofmeijer, J., Van Der Lugt, A., Van Walsum, T., Van Der Sluijs, M., et al., 2022. Automatic artery/vein classification in 2d-dsa images of stroke patients, in: Medical Imaging 2022: Image-Guided Procedures, Robotic Interventions, and Modeling, SPIE. pp. 366–377.
- Van Rikxoort and Van Ginneken (2013) Van Rikxoort, E.M., Van Ginneken, B., 2013. Automated segmentation of pulmonary structures in thoracic computed tomography scans: a review. Physics in Medicine & Biology 58, R187.
- Vaswani et al. (2017) Vaswani, A., Shazeer, N., Parmar, N., Uszkoreit, J., Jones, L., Gomez, A.N., Kaiser, Ł., Polosukhin, I., 2017. Attention is all you need. Advances in neural information processing systems 30.
- Vepa et al. (2022) Vepa, A., Choi, A., Nakhaei, N., Lee, W., Stier, N., Vu, A., Jenkins, G., Yang, X., Shergill, M., Desphy, M., et al., 2022. Weakly-supervised convolutional neural networks for vessel segmentation in cerebral angiography, in: Proceedings of the IEEE/CVF Winter Conference on Applications of Computer Vision, pp. 585–594.
- Zhang et al. (2020) Zhang, M., Zhang, C., Wu, X., Cao, X., Young, G.S., Chen, H., Xu, X., 2020. A neural network approach to segment brain blood vessels in digital subtraction angiography. Computer methods and programs in biomedicine 185, 105159.
- Zhou et al. (2018) Zhou, Z., Rahman Siddiquee, M.M., Tajbakhsh, N., Liang, J., 2018. Unet++: A nested u-net architecture for medical image segmentation, in: Deep Learning in Medical Image Analysis and Multimodal Learning for Clinical Decision Support: 4th International Workshop, DLMIA 2018, and 8th International Workshop, ML-CDS 2018, Held in Conjunction with MICCAI 2018, Granada, Spain, September 20, 2018, Proceedings 4, Springer. pp. 3–11.