The Great Dimming of Betelgeuse: a Surface Mass Ejection (SME)
and its Consequences
Abstract
The bright supergiant, Betelgeuse (Alpha Orionis, HD 39801), underwent a historic optical dimming during 2020 January 27 February 13. Many imaging and spectroscopic observations across the electromagnetic spectrum were obtained prior to, during, and subsequent to this dimming event. These observations of Betelgeuse reveal that a substantial surface mass ejection (SME) occurred and moved out through the extended atmosphere of the supergiant. A photospheric shock occurred in 2019 January - March, progressed through the extended atmosphere of the star during the following 11 months and led to dust production in the atmosphere. Resulting from the substantial mass outflow, the stellar photosphere was left with lower temperatures and the chromosphere with a lower density. The mass ejected could represent a significant fraction of the total annual mass loss rate from the star suggesting that episodic mass loss events can contribute an amount comparable to that of the stellar wind. Following the SME, Betelgeuse was left with a cooler average photosphere, an unusual short photometric oscillation, reduced velocity excursions, and the disappearance of the 400-day pulsation in the optical and radial velocity for more than two years following the Great Dimming.
August 4, 2022
1 Introduction
Betelgeuse has been observed visually or photometrically for more than a century revealing its semi-regular variability. This red supergiant star is nearby and large in apparent size providing a unique opportunity for intensive and spatially resolved study of its atmosphere and surroundings - in addition to its potential as a supernova. Two principal periods of light variation occur in the star: 400 days believed due to pulsation in the fundamental mode (Joyce et al. 2020) and a longer secondary period of 5.6 years (Kiss et al 2006; Chatys et al. 2019; Stothers 2010), typical of red supergiants but currently of uncertain origin (Joyce et al. 2020). During early December 2019, the visual magnitude of Betelgeuse became fainter than V 1 (Guinan et al. 2019). The stellar magnitude reached a historic minimum V-magnitude of 1.65 between 2020 January 27 February 13, and subsequently recovered (AAVSO 2022). The star’s appearance changed dramatically in late 2019 December and the early months of 2020, becoming substantially darker over the southern hemisphere in optical light (Montargès et al. 2021).
The following sections describe the various observations of Betelgeuse, including new temperature diagnostics and velocity measurements. We conjecture that a surface mass ejection (SME) occurred and present recently observed atmospheric consequences for the star.
2 Betelgeuse: Fundamental Parameters
Decades of observations of Betelgeuse have resulted in hundreds of measurements; a summary of recently derived fundamental parameters is given in Table 1. Current technologies, especially interferometric techniques determine the apparent photospheric diameter as 42 mas which is within the errors of the pioneering measurement by Michelson and Pease (1921) of 474.7 mas. Determination of the stellar distance from parallax measures remains challenging. Because the star is large in apparent size, and the surface contains variable bright convective cells, the measurement of a parallax based on identification of the center without contemporaneous knowledge of the brightness distribution can produce discrepant results (van Leeuewen 2007; Chiavassa et al. 2022). For the estimates following in later sections, we adopt an apparent diameter of 42 mas (Ohnaka et al. 2011), a value of 222 pc for the distance (Harper et al. 2017), and a radius of 1000R☉. The stellar effective temperature can be measured using a variety of diagnostics. We select a ‘nominal’ value of 365050K derived through a fitting of MARCS models to spectrophotometry of the star (Levesque et al. 2005) to represent the average normal effective temperature.
Subsequent sections report many determinations of the effective temperature of Betelgeuse as the Great Dimming occurred. Analysis of the TiO molecule where signatures appear in the optical and the infrared regions has been employed in many ways to infer Teff: high-resolution spectra, moderate resolution spectra, photometric measures. These spectra are generally modeled by assuming a grid of temperatures in the models to obtain the best agreement with observations. A detailed discussion of different procedures is given by Kravchenko et al.. (2021) where these authors conclude that the bands at 6187Å, 7085Å. and 7125Å are to be preferred because they exhibit the most sensitivity to temperature. Another technique involves the ratio of line strengths between two photospheric lines of different excitation potential, V I and Fe I. While this was calibrated for giant stars (Gray & Brown 2001), it can indicate a relative change in temperature of supergiants (Gray 2008), and is discussed in the following sections. Millimeter and centimeter observations are employed as well to determine the electron temperature in the outer atmosphere. The radio continuum in these bands results predominantly from free-free emission. Because it is thermal and optically thick, a flux measurement allows evaluation of the mean electron temperature (Reid & Menten 1997). Measures at 7-mm in 1996 suggested that the flux arises from cooler components in an inhomogeneous extended atmosphere (Lim et al. 1998), and this result is in harmony with measurements in 2019-2020.
Periodic variations in V magnitude and radial velocity are present. A short period of 400 days is well-documented. This period is believed to represent the fundamental pulsation mode of the supergiant (Joyce et al. 2020). The phase of the radial velocity variation lags the phase of the V magnitude variation by 35 days (Granzer et al. 2021). The source of the much longer (2100 days) secondary period is not established. It may represent the characteristic turnover time of giant surface convective cells (Stothers 2010).
| Property | Value | Comment | Reference |
|---|---|---|---|
| Temperature | 365050 K | Spectrophotometry + MARCS Models | 1 |
| Spectral Type | M1-M2Ia-Iab | Photographic spectra | 3 |
| Radial Velocity | 21.910.51 km s-1 | Integrated photospheric spectrum | 2 |
| Diameter | 42.050.05 mas | 2.282.31 m, uniform disk | 13 |
| Diameter | 43.150.50 mas | 1.65m (H-band) limb-darkened disk | 14 |
| Diameter | 1255 mas | 2500Å continuum | 15 |
| Distance | 153 22, 17 pc | Hipparcos revised | 4 |
| Distance | 168.1 27.5, 14.9 pc | Seismic analysis | 5 |
| Distance | 222 48, 34 pc | Hipparcos rev. + radio positions | 6 |
| Radius | 764 116, 62 R☉ | Seismic analysis | 5 |
| Radius | 996215, 153 R☉ | Using Hipparcos rev. distance + radio | 6 |
| Optical Variability | 0.31.2 | Visual magnitude: 19172005 | 10 |
| Periodicity (fundamental) | 38830 days | Using Visual magnitude: 19172005 | 10 |
| Periodicity (fundamental) | 420 days | Using B mag., UV cont., Mg II:19841986 | 11 |
| Periodicity (fundamental) | 38520 days | Using radial velocity: 20082022 | 11 |
| Secondary Period | 2050460 days | Using Visual magnitude: 19172005 | 10 |
| Secondary Period | 2229.86 days | Using radial velocity: 20082022 | 11 |
| Position angle North Pole | 48.03.5 | ALMA measurement | 8 |
| Position angle North Pole | 55 | Ultraviolet measurement | 9 |
References. — (1) Levesque et al. 2005; (2) Famaey et al. 2005; (3) Keenan & McNeil 1989; (4) Van Leeuwen 2007; (5) Joyce et al. 2020; (6) Harper et al. 2017; (7) AAVSO 2022; (8) Kervella et al. 2018; (9) Uitenbroek et al. 1998; (10) Kiss et al. 2006; (11) Granzer et al. 2021; (12) Dupree et al. 1987; (13)Ohnaka et al. 2011; (14) Montargès et al. 2016; (15) Gilliland & Dupree 1996
3 Betelgeuse in 2019-2020: the Origin of the Great Dimming
3.1 The First Phase: 2019 January - November
The sequence of multifrequency observations is detailed in Table 2, including estimates of formation level of the radiation in the atmosphere of Betelgeuse. On 2019 January 1, images of the star in the optical continuum from VLT/SPHERE revealed a roughly symmetric stellar image (Montargès et al. 2021). Tomographic study, using high-resolution HERMES optical spectra of the unresolved star (Kravchenko et al. 2021; Raskin et al. 2011) allows a probe of the dynamics of several levels in the photosphere of the supergiant. And during 2019 January, the photospheric layers exhibited the velocity signatures of a strong shock in the line of sight, and an expansion of the photospheric layers through 2019 March.
The photospheric velocity was measured continuously during this time by the automated STELLA telescopes (Granzer et al. 2021) and demonstrated that the photosphere, began to expand in 2019 January and maintained a constant maximum outflowing value of 8 km s-1 for most of the year until 2019 mid-November, when the outward velocity began to decrease.
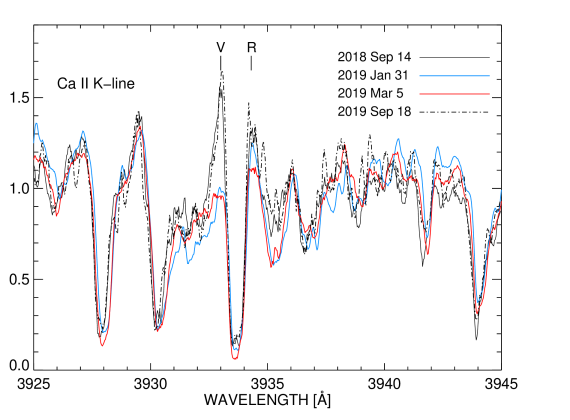
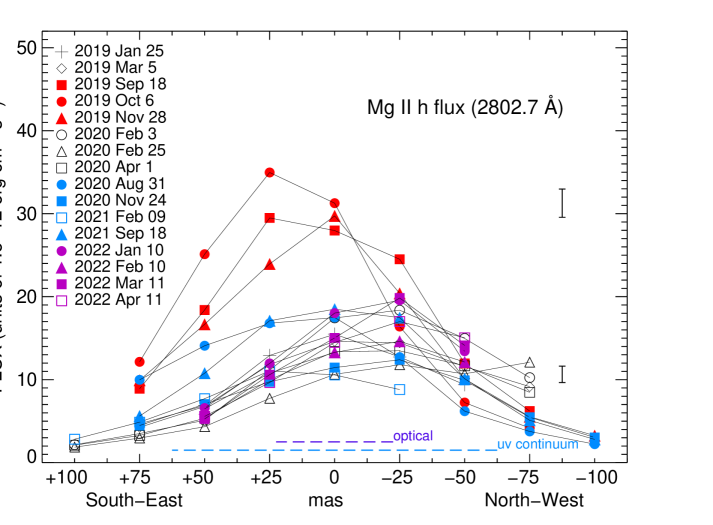
Optical spectra were obtained with the Tillinghast Reflector Echelle Spectrograph (TRES) mounted on the 1.5m-telescope at Fred Lawrence Whipple Observatory on Mt. Hopkins, AZ. The Ca II K-line in the lower chromosphere exhibited asymmetric emission wings signaling outflowing plasma late in 2019 January and early March (Fig. 1). The extended chromosphere appeared undisturbed through early 2019, as spatially resolved UV spectra appeared similar to one other, and a ‘normal’ (unenhanced) distribution of the chromospheric Mg II flux and ultraviolet continuum across the image from 2019 January to 2019 March 5 (Dupree et al. 2020b).
From 2019 April to 2019 August, signatures of atmospheric cooling were detected. An increase in the 6m band indicative of increased H2O formation (Taniguchi et al. 2021, 2022), and both mm and cm VLA images suggest exceptionally low temperatures, 2400K (Matthews & Dupree 2022).
| Date | Spectral Region | Formation | Observation | Reference |
|---|---|---|---|---|
| Rstar | ||||
| 2019 Jan 1 | Optical Image | 1.0 | VLT/SPHERE-ZIMPOL Symmetric appearance | 1 |
| 2019 Jan 1 | Optical Spectra | 1.0 | STELLA: Radial velocity outflow begins | 16 |
| 2019 Jan-Apr | Optical Spectra | 1.0 | Photospheric shock develops | 2 |
| 2019 Jan 25 + Mar 5 | UV SpectraaaSpatially resolved Ultraviolet spectra (7-8 pointings across surface) . | 1.1 - 3 | Unenhanced Mg II UV fluxes | 3 |
| 2019 Jan 31 + Mar 5 | Ca K Spectra | 1 | Outflow - low chromosphere | 15 |
| 2019 Apr 1-15 | 6m Himawari | 1.1 | H2O increase | 14 |
| 2019 Aug 2 | mm-VLA Image | 2.1 | low T (2267K) | 4 |
| 2019 Aug 2 | cm - VLA Image | 2.8 | low T (2583K) | 4 |
| 2019 Sep 18 Nov 28 | UV spectraaaSpatially resolved Ultraviolet spectra (7-8 pointings across surface) . | 1.1-3 | Enhanced chromosphere (Mg II) | 3 |
| Dense outflow/Southern hemisphere | ||||
| 2019 Nov 4 - Dec 8 | Optical Spectra | 1.0 | TiO temperature 3570K | 2 |
| 2019 Dec 7 | TiO, near IR | 1.0 | photometry: low T (3580K) | 11 |
| 2019 Dec 27 | Optical Image | 1.0 | VLT/SPHERE-ZIMPOL: faint southern hemisphere | 1 |
| 2020 Jan 17ff | Optical spectra | 1.0 | V I/Fe I implies T extremely low | 15 |
| 2020 Jan 23 | Submm 450, 850 m | 1 | low T (3450K) | 6 |
| 2020 Jan 28 | Optical Image | 1.0 | VLT/SPHERE-ZIMPOL: faint southern hemisphere | 1 |
| Dust and/or cool spot | ||||
| 2020 Jan 31 | near IR Spectra | 1.0 | Te lower 3476K | 9 |
| 2020 Minimum | TiO: optical | 1.0 | Minimum value 3550 K | 2 |
| 2020 Feb 3-Apr 1 | UV spectrumaaSpatially resolved Ultraviolet spectra (7-8 pointings across surface) . | 1.1-3 | Chromosphere, Mg II unenhanced | 3 |
| 2020 Feb 4 | 10 Himawari | 1.2 | Increased O-rich circumstellar dust | 14 |
| 2020 Feb 8 + 19 | N band/MATISSE | 1.4 | Localized dust and/or cool spot | 12 |
| 2020 Feb 12 | Optical Spectra | 1.0 | Increased turbulence | 10 |
| 2020 Feb 15 | TiO; near-IR filter | 1.0 | T=352025K | 5 |
| 2020 Feb 15 | TiO; optical spectra | 1.0 | T=360025K | 7 |
| 2020 Feb 17 | X-ray | 1-2 | non-detection | 13 |
| 2020 Feb. 23 | 400-740 nm | 1 | aperture polarimetry; polarization from | 8 |
| photosphere and/or obscuration by grains | ||||
| 2020 Feb 20Apr 2020 | UV spectraaaSpatially resolved Ultraviolet spectra (7-8 pointings across surface) . | 1.1-3 | Lower density C II chromosphere/Southern hemisphere | 3 |
| Southern hemisphere | ||||
| 2020 Mar 20 | Optical Image | 1.0 | VLT/SPHERE-ZIMPOL | 8 |
References. — (1) Montargès et al. 2021; (2) Kravchenko et al. 2021; (3) Dupree et al. 2020b; (4) Matthews & Dupree 2022 ; (5) Harper et al. 2020; (6) Dharmawardena et al. 2020; (7) Levesque & Massey 2020; (8) Cotton et al. 2020; (9)Alexeeva et al. 2021; (10) Zacs & Pukitis 2021; (11) Guinan et al. 2019; (12) Cannon et al. 2022; (13) Kashyap et al. 2020; (14) Taniguchi et al. 2021; Taniguchi et al. 2022; (15) this paper; (16) Granzer et al. 2021
The shock in the photosphere moved out through the extended atmosphere of the star in the months following its emergence from the surface in 2019 March-April. Here the term photosphere refers to the surface which corresponds to 1 R⋆. Assuming a velocity of 510 km s-1, the ejected material would reach a distance of 0.1 0.2 Rstar above the photosphere in 6 months (assuming Rstar= 1000Rsun, Ohnaka et al. 2011; Harper et al. 2017). This is comparable to the level where the contribution function for ultraviolet Mg II emission becomes large in semi-empirical models (Lobel & Dupree 2000); moreover Mg II continues to appear further out in the atmosphere - up to 6 times the optical diameter (Uitenbroek et al. 1998; Dupree et al. 2020b). Assuming the shock emerged from the photosphere in 2019 March-April, a transit time of 6 months is in harmony with the quiescent Mg II chromospheric emission observed in 2019 March, followed by the enhanced Mg II emission which was spatially resolved over the southern hemisphere in 2019 mid-September through 2019 November. Chromospheric emission lines of C II demonstrated the increased chromospheric density during 2019 September November, where and when the Mg II emission was enhanced (Dupree et al. 2020b). Such behavior signals a continuous outflow event of higher density material.
3.2 The Historic Anomalous Phase: 2019 December - 2020 March
In early 2019 December, photometry in the near IR suggested slightly lower temperatures (3580K) were present in the photosphere than the average temperature, 3650K (Levesque et al. 2005) or the value of 3660K found near a maximum brightness of V 0.20.3 mag (Guinan et al. 2019). On 2019 December 27, imaging with SPHERE-ZIMPOL in the optical continuum near H- revealed a dark southern hemisphere had appeared on the star, creating a dramatic contrast with the previous image obtained on 2019 January 1 (Montargès et al. 2021).
By 2020 January 23, submillimeter spectra (Dharmawardena et al. 2020 ) indicated a temperature of 3450K in the photosphere, and IR spectra (Alexeeva et al. 2021) obtained 8 days later confirmed a low effective temperature of the star - this value being 3476K .
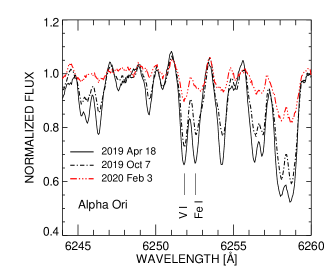
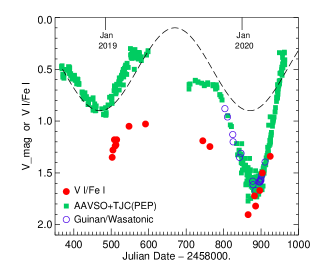
Another way to determine the change in the temperature of the photosphere relies on the ratio of two atomic lines, V I (6251.83) and Fe I (6252.5). These features indicate the photospheric temperature in giant stars (Gray and Brown 2001), and were used to track the temperature in Betelgeuse itself (Gray 2000; Gray 2008; Weber et al. 2009). Because the Boltzmann excitation factors differ, (0.29 eV for V I and 2.40 eV for Fe I), they can serve as a temperature index. The ratio, V I/Fe I becomes larger with decreasing photospheric temperature. The line-depth ratio roughly followed the V-magnitude variations of Betelgeuse for about 12 years beginning in 1995 (Gray 2008). During that time the largest value of the ratio amounted to 1.35 and corresponded to a temperature decrease of more than 100K. TRES spectra (Fig. 2) obtained at the Fred Lawrence Whipple Observatory in 2019-2020 allowed measurement of this line depth ratio, and during the Great Dimming, the variation of this ratio corresponds well to the V-magnitude of the star, and it became very large (Fig. 2), reaching a value of 1.9. This value suggests a larger temperature change than 250K. This value is a lower limit to T since the lines are not weak. Moreover, it appears that an adjacent line contributes to the Fe I feature at lower temperatures., suggesting that the ratio could become even larger.
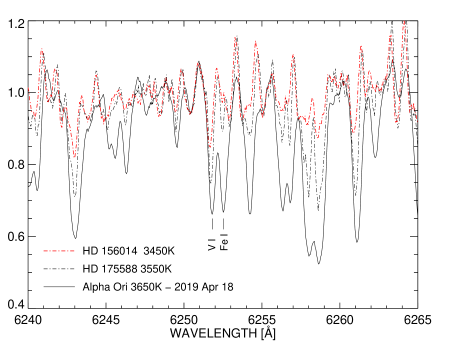
The overall weakening of absorption lines from 2019 April to 2020 February 3 as shown in Fig. 2, accompanied by the implied decrease in photospheric temperature is supported by spectra of other supergiant stars (Fig. 3) where the Teff is known (Levesque et al. 2005). For comparison, TRES echelle spectra obtained of HD 156014 (Teff= 3450K) and HD 175588 (Teff= 3550K) reveal a systematic weakening of the predominantly neutral absorption lines in this spectral region with decreasing Teff.
If a large cool volume in the photosphere resulted from the surface mass ejection, both the size of the cool area and the temperature differential from the rest of the atmosphere would contribute to a decrease in V-magnitude. An estimate can be made of the magnitude decrease at the maximum of the V-band from a temperature of 3650K (Levesque et al. 2005), by assuming both lowered temperatures and various surface area coverage. This shows that a 0.4 magnitude decrease occurs when 75% of the star is covered by a patch 250K cooler than the remaining surface. A 0.5 magnitude decrease requires 90% of the star to be cooler by 250K. Even if the cool spot temperature drops by 400K, 60% of the star must be covered by a cool spot to achieve a 0.5 V-magnitude decrease. And the photospheric temperature measures cited in Table 2, do not approach 3250K. During the Dimming, a value of 3450 K (Alexeeva et al. 2021) is reported - a decrease of 200 K. Direct imaging (Montargès et al. 2021) demonstrates that at most 50% of the star appears dimmer, perhaps only 25% as the dark area appeared in the southwest quadrant, suggesting that dust contributed to the dimming as others have suggested (Montargès et al 2021; Cannon et al. 2022; Levesque & Massey 2020; Cotton et al. 2020; Taniguchi et al. 2022).
Now, from 2020 January 27 to February 13, the V-magnitude reached a historical low level. However, on 2020 February 3 (and until 2020 April 1), the Mg II chromospheric emission and the ultraviolet continuum had returned to levels commensurate with 2019 March which were not enhanced (Dupree et al. 2020b). Optical spectra obtained on 2020 February 12 indicated increased turbulence in the photosphere (Zacs & Pukitis 2021). On 2020 February 15, somewhat different values of Teff were obtained with different diagnostics from the unresolved star. Optical TiO transitions suggested the temperature to be 360025K (Levesque & Massey 2020); near-IR photometry of TiO implied a slightly lower temperature of 352025K (Harper et al. 2020). Another analysis (Kravchenko et al. 2021) suggests that temperature diagnostics from the near-IR are to be preferred. Acceptance of that conclusion suggests that the submm and near-IR measures indicate a lower temperature than usual was present in the stellar photosphere. Additionally, after passage of the dense material, the electron density in the southern hemisphere of the chromosphere when measured in 2020 February, had returned to the lower values found in 2019 January (Dupree et al. 2020b).
Millimeter and centimeter observations with the VLA (Matthews & Dupree 2022) in 2019 August indicated substantially lower temperatures than usual: 2267K and 2583K. It has been known for a long time that the outer atmosphere of Betelgeuse is irregular and inhomogeneous, containing both hot and cold elements. In 1996, the 7mm radiation indicated a mean radius of 43.5 mas (Lim et al. 1998) which lies at 2 Rstar, clearly dispersed within warmer chromospheric plasma. Other models (Harper et al. 2001) suggest formation closer in at 1.2Rstar. This region could lie near the temperature minimum above the photosphere, which semi-empirical models (Lobel & Dupree 2000) suggest is located at 1.1Rstar, and ‘below’ the chromosphere. With this interpretation, the event had passed through the submillimeter region in 2019 August leaving a cooler, less dense atmosphere. If however, we adopt a model with columns of warm and cool material, and the warm regions are partly evacuated by the ejection event as indicated from ultraviolet observations, such an event would most likely also cause an expansion and contribute to a decrease in temperature of the remaining atmospheric material. The passage of a shock wave could lead to different effective temperatures at different atmospheric layers (Matthews & Dupree 2022).
This pattern of variation and atmospheric response suggests that an ejection event originated in the photosphere, traveled out through the extended atmosphere, eventually creating molecules and dust, as cooler regions of the extended atmosphere were reached. A disturbed local atmosphere, cooler, and of lower density remained. This would be expected when material is suddenly removed from the photosphere allowing the remaining plasma to expand and cool.
4 Solar Coronal Mass Ejections
It is helpful to review the phenomena known as coronal mass ejections (CME) that occur in the Sun, typically associated with solar flares. Solar coronal mass ejections result from an impulsive ejection of material, generally from the solar corona into the heliosphere (Tian et al. 2021). These plasma evacuations result in CME-induced coronal ‘dimmings’ - a weakening of coronal emission - which is attributed primarily to a decrease in the coronal density. The density decrease can last for hours following the CME (Veronig et al. 2019). Cases exist where the chromosphere is affected by a dimming as well. For instance the chromospheric He I, 10830 Å line can respond in addition to the material at coronal temperatures (Jiang et al. 2007) . Study of plasma diagnostics following the event reveals additional significant effects. Construction of a differential emission measure using many ions indicates a drop in the coronal temperature of 5-25% occurs along with the decrease in density ranging between 50-75% (Vanninathan et al. 2018). This solar process can inform the events observed on Betelgeuse.
5 A Surface Mass Ejection (SME)
By contrast with the Sun, Betelgeuse possesses lower gravity (by a factor of 104), a substantially larger radius (by a factor of 1000), and lacks the high temperatures found in the solar corona (Dupree et al. 2005; Kashyap et al. 2020). Although weak variable magnetic fields have been measured in the star (Aurière et al. 2010; Mathias et al. 2018), there is no record of flaring as found in the Sun. However, Betelgeuse is known to have a fundamental pulsation period likely driven by the -mechanism (Joyce et al. 2020), large scale bright variable convective cells on its surface (Haubois et al. 2009 ; Kervella et al. 2018; Montargès et al. 2016) which create chromospheric bright regions (Gilliland & Dupree 1996; Dupree & Stefanik 2013), and asymmetric variable large scale chromospheric motions (Lobel & Dupree 2001). Radiative hydrodynamic simulations also suggest the presence of large vigorous convective plumes in the photosphere (Freytag et al. 2002, Chiavassa et al. 2009, Chiavassa et al. 2010, Goldberg et al. 2022).
The sequence of observations discussed above suggests that Betelgeuse experienced a surface mass ejection initiated by the confluence of an extended span of the outwardly moving photosphere, and the presence of shock motions likely due to a vigorous convection cell. These combined to eject photospheric material through the chromosphere and into the extended atmosphere.
6 Betelgeuse 2021-2022: Atmospheric Response
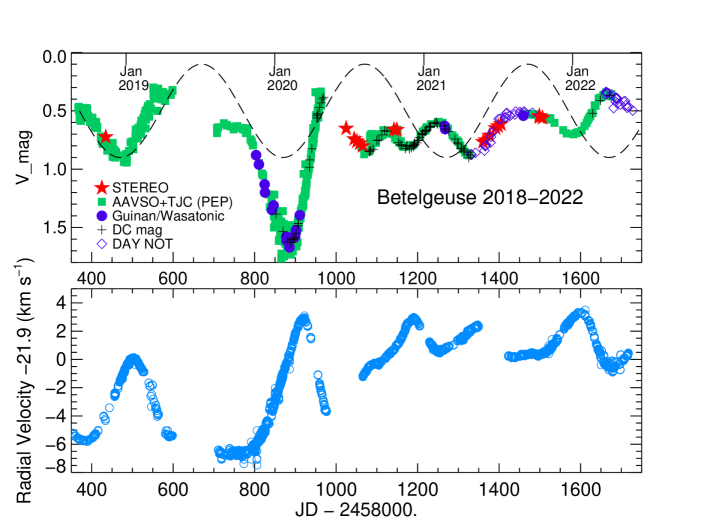
Following the Great Dimming, Betelgeuse continued to be monitored both photometrically and spectroscopically (Figs. 4 and 5). AAVSO members obtain frequent photoelectric photometer measures of the star, including some obtained during the daytime hours with multiple short exposures (Nickel & Calderwood 2021). Additionally, the Solar Terrestrial Relations Observatory spacecraft (STEREO-A) located in the Earth’s orbit but behind the Earth was rolled to repoint to Betelgeuse during the summer and fall of 2020 and 2021. The procedure is described elsewhere (Dupree et al. 2020a). An updated change in the sensitivity of the outer Heliospheric Imager HI-2, was used to extract the V-magnitude in 2021 relative to the measures in 2020 (Tappin et al. 2022). These values agree well with the daylight measurements reported by the AAVSO.
Inspection of the V-magnitude variation subsequent to the Great Dimming (Fig. 4) reveals dramatic changes from the well-documented 400 day pulsation (Kiss et al. 2006). The periodicity has shortened substantially. After the Great Dimming, the next minimum followed in 189 days, but minima in the following two years are separated by about 97 days, 166 days, and 233 days –all values clearly less than the dominant 400 day pulsation period. Detailed study of periodicities in the V-magnitude spanning 88 years (Kiss et al. 2006) identified two dominant periods 38830 days and 2050460 days. Photometric observations over 15 years indicated a fundamental period of 41624 days (Joyce et al. 2020). A short period of 200 days resulted from analysis of a 9.8 year study of magnitude variations (Percy et al. 1996). The surprising variable periodicity observed subsequent to the Great Dimming appears to have resulted from the rearrangement of the photosphere that followed the mass ejection and which was subjected to the presence of the underlying fundamental 400-day pulsation.
Optical spectra continued to be acquired with the STELLA echelle spectrograph (SES) on the robotic 1.2 m STELLA-II telescope located at the Izaña Observatory on Tenerife in the Canary Islands (Strassmeier et al. 2010). These spectra span 390nm to 870nm with a spectral resolution of 55,000 (3-pixel sampling). Standard reduction procedures were carried out with an IRAF-based pipeline (Weber et al. 2008; 2012). Wavelength calibration was made using Th-Ar lamp spectra that are obtained consecutively. After correction for the echelle blaze, radial velocities were derived using 62 of the 82 echelle orders. The very short wavelength regions with weak signals were excluded along with orders containing very strong lines (e.g. Balmer series) and orders with heavy telluric contamination. Cross-correlations were made with a spectral template corresponding to 3500K, log g=0 and standard metallicity. An order-by-order, (for 62 orders) cross correlation utilized the template spectrum calculated with the Turbospectrum synthesis code (Alvarez & Plez 1998) with MARCS models (Gustafsson et al. 2008) and VALD3 line lists (Ryabchikova et al. 2015). The cross-correlation functions are combined and the final velocity derived by fitting a gaussian curve to the peak. The internal RV error is estimated with a Monte Carlo-like approach, using 1000 different subsets of the 62 orders and generally average to 10 m s-1 (Granzer et al. 2021).
The photospheric radial velocity measured by STELLA (Granzer et al. 2021) also changed dramatically following the Great Dimming (Fig. 4). The amplitude is much smaller ( 5 km s-1) starting in 2020 September, as contrasted with 10 km s-1 measured previously, and the outflow is minimal or absent. The long-standing pattern of maximum radial velocity inflow that follows the optical minimum by 35 days for the past decade (Granzer et al. 2021) is not present during 2020 August, but may have returned by 2020 December. Spatially resolved ultraviolet observations with the Hubble Space Telescope continue through 2020-2022 (Fig. 5) and the Mg II flux in 2022 is considerably lower than 2019 SeptemberNovember and appears unenhanced.
7 Discussion
The sequence of events described earlier suggests that Betelgeuse experienced a surface mass ejection. Consequences of the dimming event clearly affected the atmosphere of the star. The optical variation following the dimming is dissimilar from period changes found in giant stars such as Mira variables where period jitter of a few percent is common (Lombard & Koen 1993), or the period may decrease systematically (Zijlstra et al. 2002), or mode-switching may occur (Bedding et al.. 1998).
Betelgeuse undergoes substantial mass loss in a wind, and clumps of dust in its environment suggest that material has been ejected in past events (Kervella et al. 2011; Humphreys & Jones 2022). Depending on assumptions, mass loss estimates causing the Great Dimming range from 3 to 128% of the stellar wind mass loss rate (Montargès et al. 2021). These phenomena offer opportunities for mass loss in both continuous and eruptive fashion. It will be of interest to search the circumstellar region to the South of the star to detect evidence of this mass loss event. At a nominal speed of 10 km s-1, in 4 years from the photospheric ejection in 2019 the material should be 38 to 48 mas distant from the stellar surface assuming pure radial motion on the sky and depending on the distance of Betelgeuse (Joyce et al 2020; Harper et al. 2017). The apparent separation of the ejecta would be larger than the ALMA beam size at 18 mas at 0.88 mm (Kervella et al. 2018).
An analysis (Goldberg 1984) of measurements of magnitude and radial velocity, led to the speculation that major disturbances in the atmosphere of Betelgeuse were likely to follow the minimum (maximum outflow) in the 6 year radial velocity variation. This prediction of a disturbance in 1984 did not take place, and the span of optical variability was only 0.6 magnitudes during that time (Percy et al. 1996). The historic optical minimum in 2020 did follow the minimum in the long-term radial velocity variation (2229.86 days) by approximately 300 days (Granzer et al. 2021). This long period is expected to reach a minimum again in May 2025, and perhaps in early 2026, another event may occur.
References
- AAVSO (2022) AAVSO, 2022, Photometric data, www.aavso.org
- Alexeeva et al. (2021) Alexeeva, S., Zhao, G., Gao, D.-Y. et al. 2021, Nat. Comm. 12, 4719A
- Alvarez & Plez (1998) Alvarez, R. & Plez, B. 1998, A&A , 330, 1109
- Aurière et al. (2010) Aurière, M., Donati, J.F., Konstantinova-Antova, R., et al. 2010, A&A, 516, L2
- Bedding et al. (1998) Bedding, T. R., Zijlstra, A. A., Jones, A. & Foster, G. 1998, MNRAS, 301, 1073
- Cannon et al. (2022) Cannon, E., Montargès, M., de Koter, A. et al. 2022, A&A, submitted.
- Chatys et al. (2019) Chatys, F. W., Bedding, T. R., Murphy, S. J. et al. 2019, MNRAS, 487, 4832
- Chiavassa et al. (2009) Chiavassa, A., Plez, B., Josselin, E., & Freytag, B. 2009, A&A, 506, 1351
- Chiavassa et al. (2010) Chiavassa, A., Haubois, X., Young, J. S., et al. 2010, A&A, 515, A12
- Chiavassa et al. (2022) Chiavassa, A., Kudritski, R., Davies, B., Freytag, B., & deMink, S. E. 2022, A&A, 661, L1
- Cotton et al. (2020) Cotton, D. V, Bailey, J., DeHorta, A. Y. et al. 2020, RNAAS, 4, 39
- Dharmawardena et al. (2020) Dharmawardena, T. E., Mairs, S., Sciciuna, P. et al. 2020, ApJ, 897, L9
- Dolan et al. (2016) Dolan, M. M., Mathew, G. J., Lam, D. D. et al. 2016,ApJ, 819, 7
- Dupree et al. (1987) Dupree, A. K., Baliunas, S. L., Guinan, E. F. et al. 1987, ApJ, 317, L85
- Dupree et al. (2020a) Dupree, A. K., Guinan, E., Thompson, W. T. & STEREO/SECCHI/H1 consortium, 2020a, AATel, 13901
- Dupree et al. (2005) Dupree, A. K., Lobel, A., Young, P. R. et al. 2005, ApJ, 622, 629
- Dupree et al. (2020b) Dupree, A. K., Strassmeier, K. G., Matthews, L. D. et al. 2020b, ApJ, 899, 68
- Dupree & Stefanik (2013) Dupree, A. K. & Stefanik, R. 2013, Betelgeuse Workshop 2010, P. Kervella, T. LeBertre, & G. Perrin, eds., EAS Pub. Ser. 60, 77
- Famaey et al. (2005) Famaey, B., Jorissen, A., Luri, X. et al. 2005, A&A, 430, 165
- Freytag (2002) Freytag, B., Steffen, M., & Dorch, B. 2002, AN, 323, 213
- Gilliland & Dupree (1996) Gilliland, R. L. & Dupree, A. K. 1996, ApJ, 463, L29
- Goldberg (2022) Goldberg, J. A., Jiang, Y-F., & Bildsten L. 2022, ApJ, 929, 156
- Goldberg (1984) Goldberg, L., 1984, Pub. ASP, 96, 366
- Granzer et al. (2021) Granzer, T., Weber, M., Strassmeier, K, G., & Dupree, A. K. 2021, The 20.5 Cambridge Workshop on Cool Stars, Stellar Systems and the Sun, csss.confE, 41G; doi: 10.5281/zenodo.4561732
- Gray (2000) Gray, D. F. 2000, ApJ, 532, 487
- Gray (2008) Gray, D. F., 2008, ApJ, 135, 1450
- Gray & Brown (2001) Gray, D. F. & Brown, K. 2001, PASP, 113, 399
- Guinan et al. (2019) Guinan, E.,F., Wasatonic, R. J., & Calderwood, T. J. 2019, AATel, 13341
- Gustafsson et al. (2008) Gustafsson, B., Edvardsson, B., Eriksson, L. et al. 2008, A&A, 486, 951
- Harper et al. (2017) Harper, G. M., Brown, A., Guinan, E. F., et al. 2017, AJ, 154, 11
- Harper et al. (2001) Harper, G. B., Brown, A., & Li, J. 2001, ApJ, 251, 1073
- Harper et al. (2020) Harper, G. M., Guinan, E. F., Wasatonic, R., Ryde, N. 2020, ApJ, 905, 34
- Haubois et al. (2009) Haubois, X., Perrin, G., Lacour, S. et al. 2009, A&A, 508, 923
- Humphreys & Jones (2022) Humphreys, R. M. & Jones, T. J. 2022, AJ, 163, 103
- Jiang et al. (2007) Jiang, Y., Yang, L., Li, K., & Ren, D. 2007, ApJ. 662, L131
- Joyce et al. (2020) Joyce, M., Leung, S-C., Molnár, L. et al., 2020, ApJ, 902, 63
- Kashyap et al. (2020) Kashyap, V. L, Drake, J. J., & Patnaude, D. 2020, AATel, 13501
- Keenan & McNeil (1989) Keenan, P. C., & McNeil, R. C. 1989, ApJS, 71, 245
- Kervella et al. (2018) Kervella, P., Decin L., Richards, A.M.S. et al. 2018, A&A, 609, A67
- Kervella et al. (2011) Kervella, P., Perrin, G., Chiavassa, A., et al. 2011, A&A, 531, A117
- Kiss et al. (2006) Kiss, L. L., Szabo, Gy. M., & Bedding, T. R. 2006, MNRAS, 372, 1721
- Kravchenko et al. (2021) Kravchenko, L, Jorissen, A. VanEck, S. et al. 2021, A&A, 650, L17
- Levesque et al. (2005) Levesque, E. M., Massey, P., Olsen, K. A. G. et al. 2005, ApJ, 628, 973
- Levesque & Massey (2020) Levesque, E. M., & Massey, P. 2020, ApJ, 891, L37
- Lim et al. (1998) Lim, J., Carilli, C. L., White, S. M., Beasley, A. J., & Marson, R. G. 1998, Nature, 392, 575
- Lobel & Dupree (2000) Lobel, A., & Dupree, A. K. 2000, ApJ, 545, 454
- Lobel & Dupree (2001) Lobel, A. & Dupree, A. K. 2001, ApJ, 558, 815
- Lombard & Koen (1993) Lombard, F., & Koen, C. 1993, MNRAS, 263, 309
- Mathias et al. (2018) Mathias, P., Aurière, M., López Ariste, A., et al. 2018, A&A, 615, A116
- Matthews & Dupree (2022) Matthews, L. D., & Dupree, A. K. 2022, AJ, submitted.
- Michelson & Pease (2021) Michelson, A. A., & Pease, F. G. 2021, ApJ, 53, 249
- Montargès, M. et al. (2021) Montargès, M., Cannon, E., Lagadec, E. et al. 2021, Nature, 594, 365
- Montargés, M. et al. (2016) Montargès, M., Kervella, P., Perrin, G. et al. 2016, A&A, 588, 130
- Nickel & Calderwood (2021) Nickel, O., & Calderwood, T. 2021, JAAVSO, 49, 269
- Ohnaka et al. (2011) Ohnaka, L., Weigelt, G., Millour, F. et al. 2011, A&A, 529, A163
- Percy et al. (1996) Percy, J. R., Desjardins, A., Yu, L., & Landis, H. J. 1996, PASP, 108, 139
- Raskin et al. (2011) Raskin, G., van Winkel, H., Hensberge, H. et al. 2011, A&A. 526, A69
- Reid & Menten (1997) Reid, M. J., & Menten, K. M. 1997, ApJ, 476, 327
- Ryabchikova et al. (2015) Ryabchikova, T., Piskunov., N., Kurucz, R. L. et al. 2015, PhyS, 90, 054005
- Stothers (2020) Stothers, R. B. 2010, ApJ, 725, 1170
- Strassmeier et al. (2010) Strassmeier, K. G., Granzer, T., & Weber, M. 2010, Adv. Astron., 2010, 19
- Taniguchi et al. (2021) Taniguchi, D., Yamazaki, K., & Uno, S. 2021, EAS2021, SS22b, No 1708
- Taniguchi, et al. (2022) Taniguchi, D., Yamazaki, K. & Uno, S., 2022, Nature Astron., 10.1038/s41550-022-01680-5
- Tappin et al. (2022) Tappin, S. J., Eyles, C. J., & Davies, J. A. 2022, Sol. Phys. 297, 37
- Tian et al. (2021) Tian, H., Harra, L., Baker, D., Brooks, D. H., & Xia, L. 2021, Sol. Phys., 296, 47
- Uitenbroek et al. (1998) Uitenbroek, H., Dupree, A. K., & Gilliland, R. L. 1998, AJ, 116, 2501
- VanLeeuwen (2007) Van Leeuwen, F. 2007, A&A, 474, 653
- Vanninathan, K. et al. (2018) Vanninathan, K., Veronig, A. M., Dissauer, K. & Temmer, M. 2018, ApJ, 857, 62
- Veronig, A. M. et al. (2019) Veronig, A. M., Gömöty P., Dissauer, K., Temmer M., & Vanninathan, K. 2019, ApJ, 879, 85
- Weber et al. (2009) Weber, M., Carroll, T., Granzer, T., Steffen, M., & Strassmeier, K. G. 2009, MmSAI, 80, 743W
- Weber et al. (2008) Weber, M., Granzer, T., Strassmeier, K. G., & Woche, M. 2008, Proc. SPIE, 7019, 70190L
- Weber et al. (2012) Weber, M., Granzer, T., & Strassmeier, K. G. 2012, Proc. SPIE, 8451, 84510K
- Zacs & Pukitis (2021) Zacs, L., & Pukitis, K. 2021, RNAAS, 5, 8
- Zijlstra et al. (2002) Zijlstra, A. A., Bedding, T. R. & Mattei, J. A. 2002, MNRAS, 334, 498