Unveiling the contribution of Pop III stars in primeval galaxies at redshift
Abstract
Detection of the first stars has remained elusive so-far but their presence may soon be unveiled by upcoming JWST observations. Previous studies have not investigated the entire possible range of halo masses and redshifts which may help in their detection. Motivated by the prospects of detecting galaxies up to in JWST early data release, we quantify the contribution of Pop III stars to high-redshift galaxies from by employing the semi-analytical model a-sloth, which self-consistently models the formation of Pop III and Pop II stars along with their feedback. Our results suggest that the contribution of Pop III stars is the highest in low-mass halos of . While high-mass halos contain less than 1% Pop III stars, they host galaxies with stellar masses of as early as . Interestingly, the apparent magnitude of Pop III populations gets brighter towards higher redshift due to the higher stellar masses, but Pop III-dominated galaxies are too faint to be directly detected with JWST. Our results predict JWST can detect galaxies up to , which may help in constraining the IMF of Pop III stars and will guide observers to discern the contribution of Pop III stars to high-redshift galaxies.
1 Introduction
Tremendous progress on the observational frontier has enabled astronomers to detect galaxies up to the cosmic dawn during the past two decades. About thousand galaxies have been detected detected at z 6 (Bouwens et al., 2016; Oesch et al., 2016; Harikane et al., 2022; Schaerer et al., 2022; Finkelstein et al., 2022) with candidates up to z 20 being revealed in James Webb space telescope (JWST) early data release (Carnall et al., 2022; Castellano et al., 2022; Naidu et al., 2022; Yan et al., 2022; Adams et al., 2022), which may just be the tip of the iceberg (Dayal & Ferrara, 2018). One of the primary goals of JWST is to unveil primeval galaxies that contain Pop III stars and revolutionize our understanding of the high-redshift universe. In fact, the commissioning of JWST has shown that unprecedented sensitivity of NIRCam can detect objects with a flux of nJy (equivalent to apparent magnitude of ) at SNR for a standard exposure time of 10 ks (Rigby et al., 2022). With longer exposure times and gravitational lensing, JWST may discover even more and fainter galaxies at redshift . Therefore, it is very timely to make predictions about the contribution and presence of Pop III stars. Such work will help in guiding forthcoming JWST observations.
Pop III stars are expected to form in pristine minihalos of a few times at z (Skinner & Wise, 2020; Schauer et al., 2021). They ushered the universe out of cosmic dark ages, initiated the process of re-ionization and shaped the formation of high-redshift galaxies via their feedback. Depending on their mass, they are expected to have short lifetimes, may go off as a supernovae (SNe) and enrich the surrounding ISM with metals (Heger & Woosley, 2002). In the aftermath of Pop III SNe, second generation stars known as Pop II stars form from metal-enriched gas with metallicity as low as (Schneider et al., 2003; Omukai et al., 2005). Recent, numerical simulations including UV radiative feedback from stars suggest Pop III characteristic masses of a few ten of (Clark et al., 2011; Stacy et al., 2016; Sugimura et al., 2020; Latif et al., 2022) substantially lower than previously thought (Bromm et al., 2002; Abel et al., 2002; Yoshida et al., 2008). However, direct observations are required to constrain their mass spectrum, which might be achieved with upcoming observations of high-redshift galaxies with JWST.
In fact, the star formation rate density (SFRD) of Pop III stars dominates at (Hartwig et al., 2022) suggesting their significant role in shaping high-redshift galaxies and the necessity of taking into account the contribution of Pop III stars in modeling their SEDs. Zackrisson et al. (2011, 2017) investigated the spectral evolution of first galaxies finding that Pop III galaxies with stellar masses as low as can be detected at z 10 and discussed various observational strategies. Renaissance simulations have examined the properties of high-redshift galaxies such as their stellar masses, SFRs, UV luminosity functions and escape fractions of ionizing radiation (O’Shea et al., 2015; Xu et al., 2016). Their results suggest that large fractions of Pop III stars may remain elusive to direct detection at z=15 (Barrow et al., 2018). Jaacks et al. (2019) studied the legacy of Pop III star formation and found that the Pop III contribution to SFRDs significantly increases beyond z15 up to 50% while their contribution to ionizing emissivity is about 60 %. Recently, Katz et al. (2022) simulated a halo of at z=10 to investigate the possibility of Pop III detection with JWST and found that key signatures of Pop III stars fade away quickly due to their short lifetimes. These studies could not investigate the entire range of possible halo masses and redshifts due to numerical limitations, but they indicate that Pop III stars might be detectable at high redshift.
Motivated by the prospects of detecting galaxies with JWST up to (Yan et al., 2022), in this letter, we perform a comprehensive study which self-consistently models the formation of both Pop III & Pop II stars along with their chemical, mechanical and radiative feedback for a statistical sample of high-redshift galaxies. We simulate here a wide range of galaxies forming in different halo masses at because of the expected dominance of Pop III stars in this era and report their properties, such as masses and luminosities for Pop III and Pop II stars. These results will help to identify the possible contributions of Pop III stars in the upcoming data of JWST.
2 Methodology
We use the semi-analytical model a-sloth to simulate the formation of the first galaxies (Hartwig et al., 2022; Magg et al., 2022). The model is based on dark matter merger trees, which are generated with the Extended Press-Schechter formalism (EPS, Press & Schechter, 1974; Bond et al., 1991). Given a halo mass and final redshift, the code first generates a dark matter merger tree backwards in time and then simulates the baryonic physics and feedback forward in time. Stars form once a halo is above the critical mass for efficient gas cooling (Schauer et al., 2021), which includes the baryonic streaming velocity and a Lyman-Werner background, following Hartwig et al. (2022). a-sloth includes chemical, radiative, and mechanical feedback from stars and different types of SNe and distinguishes between Pop III and Pop II star formation based on the ISM composition (Chiaki et al., 2017), which results in an effective threshold metalliticty of around .
We sample individual stars based on pre-defined initial mass functions (IMFs) for Pop III and Pop II stars. This allows us to trace the lifetime and feedback of stars and their supernova explosions accurately in time. Moreover, we can precisely determine the surviving stellar mass at any redshift based on their lifetimes. Hence, our model does not rely on analytical star formation histories, or assumes a single stellar population. Instead, we model the formation of individual stars in high-redshift galaxies self-consistently.
The model is calibrated based on six observables, such as the ionization history and the cosmic SFRD, which guarantees reliable predictions up to high redshifts. For Pop II stars, we assume a Kroupa IMF in the mass range 0.1-100 while for Pop III stars we employ a logarithmically flat IMF in the mass range , which best reproduces observations (Hartwig et al., 2022). However, the lower-mass end of the Pop III IMF is poorly constrained and for this research we allow Pop III stars to form down to . This does not change the global properties of the model, but it allows us to show more fine-grained results due to their slightly longer lifetimes.
a-sloth resolves minihalos with at the highest redshifts. While this high mass resolution is excellent to follow the physics accurately, such small galaxies might suffer from stochastic sampling effects because they only contain a handful of stars. Therefore, we resample each galaxy several times with different random seeds and report the median value and the central percentile to quantify the cosmic variance.
3 Results
We have simulated a large number of high-redshift galaxies using a-sloth, which allows to self-consistently model the formation of Pop III and Pop II stars. Moreover, we have explored a variety of halos with masses ranging from from down to . To mimic cosmic stochasticity, each combination of redshift and halo mass is simulated about 100 times. This comprehensive study enables us to estimate the properties of high-redshift galaxies such as stellar masses, star formation rates, metallicities, luminosities and to quantify the relative contribution of Pop III stars.
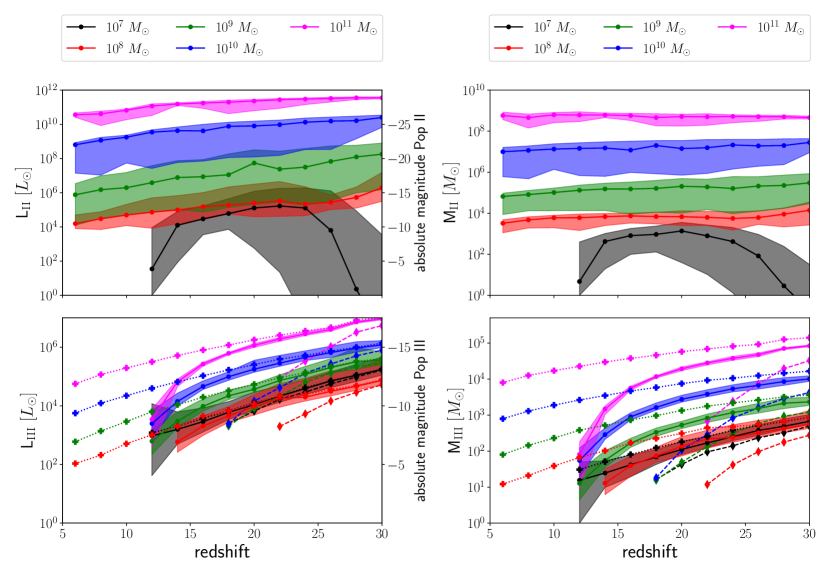
The average Pop III stellar mass varies from for halos of and increases with redshift, see Fig. 1. At , Pop III stars form only in of simulated halos due to metal pollution. The Pop II stellar mass varies from for halos. Overall, the Pop II stellar mass does not significantly change in similar mass halos from as shown in Fig. 1. Statistical variations in Pop III stellar mass from halo to halo are within a factor of a few and prominent in low-mass halos as they are more prone to stellar feedback and effects from random sampling.
We have selected here a fudicial value of for the lower cutoff mass which is the logarithmic mean of the possible range of minimum Pop III stellar masses between (Hartwig et al., 2022) and therefore the most representative value. We also investigated the impact of lower cutoff masses on the survival of Pop III stars. Our findings suggest that for a cutoff mass of , Pop III stars stop contributing already at z=18 but for lower cutoff mass of they can survive down to z 6. Overall, for the lowest cutoff mass, the Pop III stellar mass is a factor of few higher than our fiducial case at all redshifts.
Typical luminosity of Pop III stellar populations varies from while for Pop II it ranges from as depicted in Fig. 1. Both Pop III & Pop II luminosities increase with redshift and are highest at . For high-mass halos, the Pop III luminosity is a few orders of magnitude smaller than Pop II, but for halos with masses , the Pop III luminosity is roughly comparable to Pop II. These results suggest that some massive galaxies with stellar mass of at have luminosities of and are as bright as their counterparts at (Naidu et al., 2022).
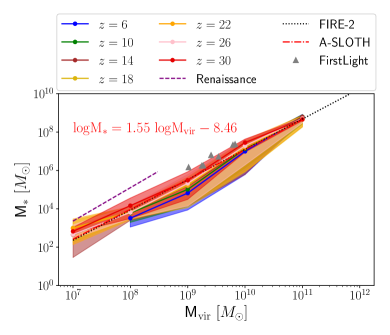
Our estimates for stellar mass vs halo mass for the entire sample of galaxies from are shown in Fig. 2. Total stellar mass varies from for halo masses of and monotonically increases with halo mass. Scatter in the plot is due to the statistical variations in the merger trees and IMF sampling. We find no statistically significant change in the stellar mass to halo mass relation in the redshift range , i.e., the results at all redshifts lie within their uncertainty range. Overall, our results are in good agreement with previous studies (O’Shea et al., 2015; Ceverino et al., 2017; Ma et al., 2018; Jaacks et al., 2019; Pallottini et al., 2022). However, the Renaissance simulation predicts more stars at a given halo mass, which according to Ceverino et al. (2017) is due to the inefficient feedback.
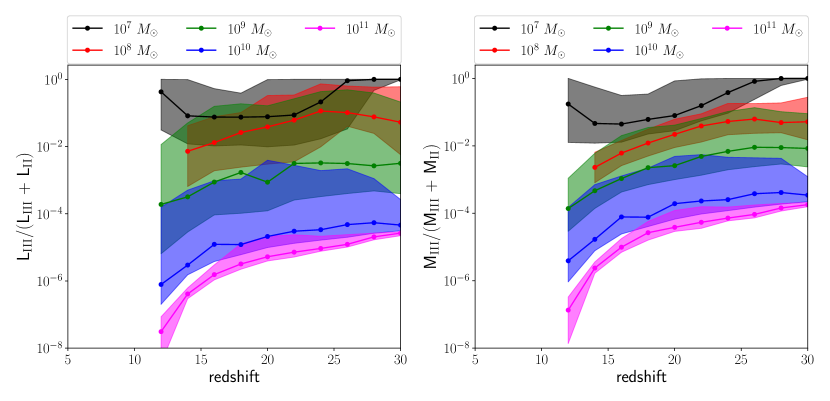
To further elucidate the contribution of Pop III stars to high-redshift galaxies, we show the ratios of Pop III to total stellar mass and Pop III to total luminosity in Fig. 3. It shows that contribution of Pop III stars is close to unity at and highest in low-mass halos at all times from z=30 down to z=10. This contribution drops to below 1% for halos of . Furthermore, statistical variations in the Pop III contribution to high-redshift galaxies are two orders of magnitude. Our findings suggest that low-mass galaxies forming at are the best targets to find Pop III stars. The contribution of Pop III stars in high-mass galaxies is much lower than Pop II stars which may pose a challenge to identify them.
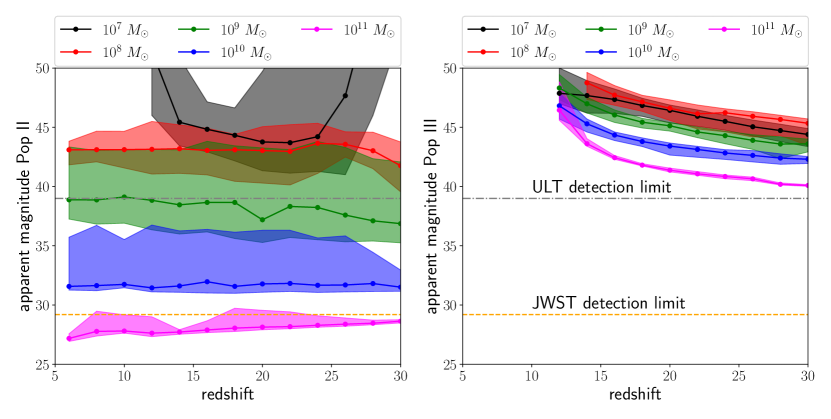
To compare our results with observations, we estimated the bolometric apparent magnitudes of our galaxies and their statistical variations, which are shown in Fig. 4. To calculate the bolometric apparent magnitude, we used where is the Solar flux, and is the flux of our simulated galaxy, which is estimated using the luminosity distance relation for a given redshift. We compute the luminosities of Pop III & Pop II stars separately. For Pop III stars, we use the fitting function given in Eq 3 of Windhorst et al. (2018) while for Pop II stars, we use a standard luminosity-mass relation. We also show the expected apparent magnitude of Pop III and Pop II stars separately that enables us to quantify their contributions and compare them with the detection limit of JWST. The apparent magnitude of Pop III stars varies from 40-50, increases with redshift, and is brightest for a halo at , much fainter than the JWST detection limit of 29.2. The range of apparent magnitude for Pop II stars varies from 27-50, which is much larger than for Pop III stars, but only the most massive galaxy will be visible to JWST. In fact, such a galaxy can be detected as early as z=30.
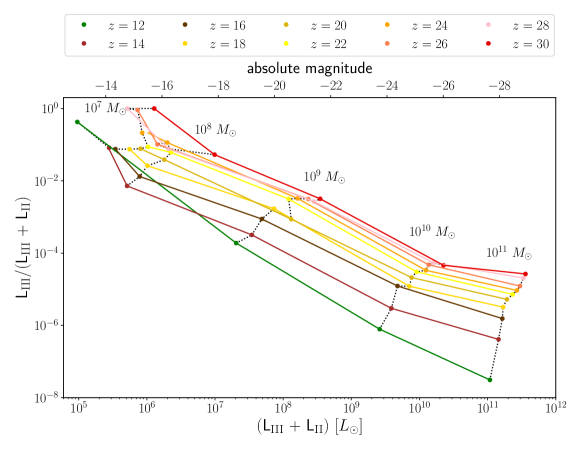
We further show the fraction of Pop III luminosity against the total luminosity/AB magnitude for the entire sample of simulated galaxies in Fig. 5. This figure provides a convenient way to estimate the relative contribution of Pop III stars to the total luminosity of newly detected galaxies at high redshift. It is found that faint galaxies with AB magnitude below -20 are the best candidates for finding Pop III stars across all redshifts but are well below the detection limits of JWST. The brightest galaxies contain less than 1% Pop III stars but their AB magnitudes are within the range of JWST even at z=30. Based on the halo mass function of Warren et al. (2006), the expected number density of such galaxies is per Gpc3 at z=26. Therefore, these galaxies are expected to be rare at earlier times. Nevertheless, we expect such galaxies can be unveiled in upcoming wide survey JWST observations.
4 Discussion and Conclusions
We have simulated a large ensemble of high-redshift galaxies using the semi-analytical model a-sloth, which has been calibrated against six independent observables and simultaneously models both Pop III & Pop II stellar populations along with their feedback. This unique sample of galaxies allowed us to study the statistical variations among the properties of high-redshift galaxies, such as stellar masses, luminosities, star formation rates, fraction and contribution of Pop III stars to their host galaxies. Our results suggest that best candidates to search for Pop III stars are low-mass galaxies from which are challenging to be detected with JWST and the contribution of Pop III stars decreases to less than 1 % in massive galaxies. We further predict that JWST can detect galaxies up to as their AB magnitudes lie within its range. These findings may guide observers in planning their observations and also help to improve spectral modeling of high-redshift galaxies.
We consider the impact of both baryonic streaming motions and LW radiation based on Schauer et al. (2021), which increase the halo threshold mass above . Therefore, Pop III stars cannot form in halos with masses lower than this at . Pop III stars can still form in halos of a few times at . They have typical masses of about but their feedback limits the formation of Pop II stars in the host halos. Interestingly, these halos hosting very young Pop III star may be directly detected with ULT in future.
We also investigated the role of the Pop III IMF on our findings by varying its slope from logarithmically flat to Salpeter and found that it has negligible impact on the number of Pop III survivors and total stellar mass. Furthermore, we found that the low cutoff mass of Pop III IMF influences the number of Pop III survivors as well as their masses. We find that Pop III stars can only survive to if their low cutoff mass is otherwise they die on relatively short timescales and may not survive to such redshifts. Higher cutoff mass () decreases the number of Pop III survivors. These results suggest that finding Pop III survivors at may help in constraining the lower mass end of the Pop III IMF.
Our results are in agreement with previous works, which simulated only a limited number of high-redshift galaxies (see Fig. 2). In addition, Barrow et al. (2018) find similar Pop III stellar masses at a given halo mass in the Renaissance simulation. They also report the fraction of Pop III stellar mass to be in the range for halos of , similar to our results. Recently, Yan et al. (2022) report the discovery of three galaxy candidates with a photometric redshift of with JWST. These galaxies have stellar masses of . Based on our results, we can estimate the dark matter halo mass of such galaxies to be (Fig. 2). This allows us to estimate the contribution of Pop III stars to the bolometric luminosities of such objects to be only (Fig. 3). The contribution of Pop III stars to the luminosity of such objects is hence negligible.
In this work, we employed the stochastic feedback model of a-sloth which is based on the EPS merger trees. Although this stochastic feedback is sufficiently accurate (Hartwig et al., 2022), future studies can improve by using a-sloth’s spatial feedback model based on merger trees extracted from N-body simulations to obtain more realistic results. If we were to perform 3D cosmological simulations, which are prohibitively expensive for such a large sample of galaxies, pockets of metal free gas may exist down to lower redshifts due to inhomogeneous mixing of metals. For example, Liu & Bromm (2020) found from cosmological simulations that such pockets of metal free exist even down to z 4 in massive halos of . Under these conditions, some Pop III stars may form at lower redshifts.
References
- Abel et al. (2002) Abel, T., Bryan, G. L., & Norman, M. L. 2002, Science, 295, 93, doi: 10.1126/science.295.5552.93
- Adams et al. (2022) Adams, N. J., Conselice, C. J., Ferreira, L., et al. 2022, arXiv e-prints, arXiv:2207.11217. https://arxiv.org/abs/2207.11217
- Barrow et al. (2018) Barrow, K. S. S., Wise, J. H., Aykutalp, A., et al. 2018, MNRAS, 474, 2617, doi: 10.1093/mnras/stx2973
- Bond et al. (1991) Bond, J. R., Cole, S., Efstathiou, G., & Kaiser, N. 1991, ApJ, 379, 440, doi: 10.1086/170520
- Bouwens et al. (2016) Bouwens, R. J., Oesch, P. A., Labbé, I., et al. 2016, ApJ, 830, 67, doi: 10.3847/0004-637X/830/2/67
- Bromm et al. (2002) Bromm, V., Coppi, P. S., & Larson, R. B. 2002, ApJ, 564, 23, doi: 10.1086/323947
- Carnall et al. (2022) Carnall, A. C., Begley, R., McLeod, D. J., et al. 2022, arXiv e-prints, arXiv:2207.08778. https://arxiv.org/abs/2207.08778
- Castellano et al. (2022) Castellano, M., Fontana, A., Treu, T., et al. 2022, arXiv e-prints, arXiv:2207.09436. https://arxiv.org/abs/2207.09436
- Ceverino et al. (2017) Ceverino, D., Glover, S. C. O., & Klessen, R. S. 2017, MNRAS, 470, 2791, doi: 10.1093/mnras/stx1386
- Chiaki et al. (2017) Chiaki, G., Tominaga, N., & Nozawa, T. 2017, MNRAS, 472, L115, doi: 10.1093/mnrasl/slx163
- Clark et al. (2011) Clark, P. C., Glover, S. C. O., Smith, R. J., et al. 2011, Science, 331, 1040, doi: 10.1126/science.1198027
- Dayal & Ferrara (2018) Dayal, P., & Ferrara, A. 2018, Phys. Rep., 780, 1, doi: 10.1016/j.physrep.2018.10.002
- Finkelstein et al. (2022) Finkelstein, S. L., Bagley, M., Song, M., et al. 2022, ApJ, 928, 52, doi: 10.3847/1538-4357/ac3aed
- Harikane et al. (2022) Harikane, Y., Inoue, A. K., Mawatari, K., et al. 2022, ApJ, 929, 1, doi: 10.3847/1538-4357/ac53a9
- Harris et al. (2020) Harris, C. R., Millman, K. J., van der Walt, S. J., et al. 2020, Nature, 585, 357, doi: 10.1038/s41586-020-2649-2
- Hartwig et al. (2022) Hartwig, T., Magg, M., Chen, L.-H., et al. 2022, arXiv e-prints, arXiv:2206.00223. https://arxiv.org/abs/2206.00223
- Heger & Woosley (2002) Heger, A., & Woosley, S. E. 2002, ApJ, 567, 532, doi: 10.1086/338487
- Hunter (2007) Hunter, J. D. 2007, Computing in Science & Engineering, 9, 90, doi: 10.1109/MCSE.2007.55
- Jaacks et al. (2019) Jaacks, J., Finkelstein, S. L., & Bromm, V. 2019, MNRAS, 488, 2202, doi: 10.1093/mnras/stz1529
- Katz et al. (2022) Katz, H., Kimm, T., Ellis, R. S., Devriendt, J., & Slyz, A. 2022, arXiv e-prints, arXiv:2207.04751. https://arxiv.org/abs/2207.04751
- Latif et al. (2022) Latif, M. A., Whalen, D., & Khochfar, S. 2022, ApJ, 925, 28, doi: 10.3847/1538-4357/ac3916
- Liu & Bromm (2020) Liu, B., & Bromm, V. 2020, MNRAS, 497, 2839, doi: 10.1093/mnras/staa2143
- Ma et al. (2018) Ma, X., Hopkins, P. F., Garrison-Kimmel, S., et al. 2018, MNRAS, 478, 1694, doi: 10.1093/mnras/sty1024
- Magg et al. (2022) Magg, M., Hartwig, T., Chen, L.-H., & Tarumi, Y. 2022, Journal of Open Source Software, 7, 4417, doi: 10.21105/joss.04417
- Naidu et al. (2022) Naidu, R. P., Oesch, P. A., van Dokkum, P., et al. 2022, arXiv e-prints, arXiv:2207.09434. https://arxiv.org/abs/2207.09434
- Oesch et al. (2016) Oesch, P. A., Brammer, G., van Dokkum, P. G., et al. 2016, ApJ, 819, 129, doi: 10.3847/0004-637X/819/2/129
- Omukai et al. (2005) Omukai, K., Tsuribe, T., Schneider, R., & Ferrara, A. 2005, ApJ, 626, 627, doi: 10.1086/429955
- O’Shea et al. (2015) O’Shea, B. W., Wise, J. H., Xu, H., & Norman, M. L. 2015, ApJ, 807, L12, doi: 10.1088/2041-8205/807/1/L12
- Pallottini et al. (2022) Pallottini, A., Ferrara, A., Gallerani, S., et al. 2022, MNRAS, 513, 5621, doi: 10.1093/mnras/stac1281
- Press & Schechter (1974) Press, W. H., & Schechter, P. 1974, ApJ, 187, 425, doi: 10.1086/152650
- Price-Whelan et al. (2018) Price-Whelan, A. M., Sipőcz, B., Günther, H., et al. 2018, The Astronomical Journal, 156, 123
- Rigby et al. (2022) Rigby, J., et al. 2022, arXiv e-prints, arXiv:2207.05632. https://arxiv.org/abs/2207.05632
- Schaerer et al. (2022) Schaerer, D., Marques-Chaves, R., Oesch, P., et al. 2022, arXiv e-prints, arXiv:2207.10034. https://arxiv.org/abs/2207.10034
- Schauer et al. (2020) Schauer, A. T. P., Drory, N., & Bromm, V. 2020, ApJ, 904, 145, doi: 10.3847/1538-4357/abbc0b
- Schauer et al. (2021) Schauer, A. T. P., Glover, S. C. O., Klessen, R. S., & Clark, P. 2021, MNRAS, 507, 1775, doi: 10.1093/mnras/stab1953
- Schneider et al. (2003) Schneider, R., Ferrara, A., Salvaterra, R., Omukai, K., & Bromm, V. 2003, Nature, 422, 869
- Skinner & Wise (2020) Skinner, D., & Wise, J. H. 2020, MNRAS, 492, 4386, doi: 10.1093/mnras/staa139
- Stacy et al. (2016) Stacy, A., Bromm, V., & Lee, A. T. 2016, MNRAS, 462, 1307, doi: 10.1093/mnras/stw1728
- Sugimura et al. (2020) Sugimura, K., Matsumoto, T., Hosokawa, T., Hirano, S., & Omukai, K. 2020, ApJ, 892, L14, doi: 10.3847/2041-8213/ab7d37
- Van Rossum & Drake (2009) Van Rossum, G., & Drake, F. L. 2009, Python 3 Reference Manual (Scotts Valley, CA: CreateSpace)
- Virtanen et al. (2020) Virtanen, P., Gommers, R., Oliphant, T. E., et al. 2020, Nature Methods, 17, 261, doi: 10.1038/s41592-019-0686-2
- Warren et al. (2006) Warren, M. S., Abazajian, K., Holz, D. E., & Teodoro, L. 2006, ApJ, 646, 881, doi: 10.1086/504962
- Windhorst et al. (2018) Windhorst, R. A., Timmes, F. X., Wyithe, J. S. B., et al. 2018, ApJS, 234, 41, doi: 10.3847/1538-4365/aaa760
- Xu et al. (2016) Xu, H., Wise, J. H., Norman, M. L., Ahn, K., & O’Shea, B. W. 2016, ApJ, 833, 84, doi: 10.3847/1538-4357/833/1/84
- Yan et al. (2022) Yan, H., Ma, Z., Ling, C., et al. 2022, arXiv e-prints, arXiv:2207.11558. https://arxiv.org/abs/2207.11558
- Yoshida et al. (2008) Yoshida, N., Omukai, K., & Hernquist, L. 2008, Science, 321, 669, doi: 10.1126/science.1160259
- Zackrisson et al. (2011) Zackrisson, E., Rydberg, C.-E., Schaerer, D., Östlin, G., & Tuli, M. 2011, ApJ, 740, 13, doi: 10.1088/0004-637X/740/1/13
- Zackrisson et al. (2017) Zackrisson, E., Binggeli, C., Finlator, K., et al. 2017, ApJ, 836, 78, doi: 10.3847/1538-4357/836/1/78