Current address: ]Zurich Instuments AG, Technoparkstrasse 1, 8005 Zurich, Switzerland
Coherence of Rabi oscillations with spin exchange
Abstract
Rabi measurements in atomic vapor cells are of current interest in a range of microwave imaging and sensing experiments, but are increasingly in a parameter space outside of theoretical studies of coherence defined by spin-exchange collisions. Here, we study the coherence of Rabi oscillations in vapor cells by employing continuous non-destructive readout of the hyperfine manifold of 87Rb using Faraday rotation. We develop a full model for spin-exchange (SE) coherence for hyperfine transitions that takes into account a non-static population distribution. In this regime, Rabi oscillations exhibit nontrivial time-domain signals that allow verification of vapor-cell parameters. We find excellent agreement between theory and experiment, which will aid in benchmarking sensitivities of Rabi measurement applications.
Introduction.—For sensors based on hot atomic vapors, spin-exchange (SE) collisions are the dominant limitation of sensitivity vanier1989quantum ; happer1972optical . These collisions originate from the acquired phase shift between singlet and triplet interaction potentials of the electrons of colliding alkali atoms. The exchange interaction conserves the total spin of the colliding atoms, but causes random transitions between the hyperfine ground states that have recently been leveraged in hot atomic vapor cells for generating many-body entanglement kong2020measurement and modeling phase transition dynamics horowicz2021critical . Decoherence effects of SE collisions within a Zeeman manifold have been studied in the context of optically-pumped magnetometers (OPMs), and notably even found to disappear in the spin-exchange-relaxation-free (SERF) regime at low magnetic fields Budker2007optical ; happer1973spin ; savukov2005effects ; happer1973spin . Further, the consequences of spin-exchange collisions on the coherence between two hyperfine ground manifolds have also been well-studied in the context of masers vanier1968relaxation ; vanier1974relaxation and atomic clocks jau2004intense ; vanier1989quantum . In these studies, SE decay rates were modeled based on stationary atomic populations such as a spin-temperature (ST) distribution, which is valid when continuous optical pumping and a weak driving field prevent Rabi oscillations, and SE collisions dominate over other collision and scattering rates. However, this approximation is invalid in the case of a strong driving field, such as a near-resonant microwave field, that causes significant population transfer. As a result, the coherence of Rabi oscillations is expected to deviate from the assumptions of weak driving and exhibit nontrivial detuning and spin-polarization dependence.
This picture needs completion, as in the last few years, Rabi oscillations driven within atomic ensembles have been proposed for sensing and imaging microwave fields for applications in characterizing microwave circuits horsley2015widefield ; horsley2016frequency-tunable ; bohi2012simple , self-calibrated vector magnetometry thiele2018self , and in medical applications such as cancer detection fear2002enhancing ; nikolova2011microwave ; chandra2015opportunities . While microfabricated vapor cells are ideal sensor platforms for these applications due to their compact size and high atomic densities, decoherence is typically dominated by SE collisions when wall collisions are minimized by buffer gas wittke1956redetermination . To unlock new sensitivity regimes for these applications, a complete understanding of the SE coherence is necessary.
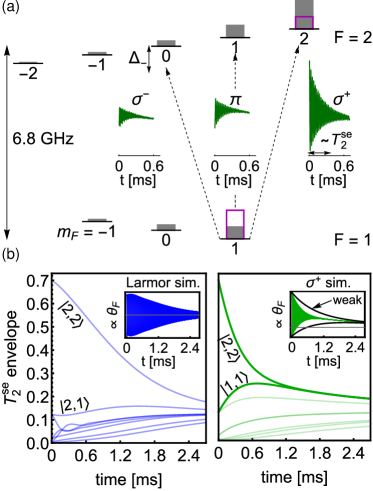
In this Letter, we explore the coherence of Rabi oscillations in a heated vapor cell driven on , and hyperfine transitions of 87Rb [Fig. 1(a)] that do not adhere to the weak-driving approximation. By employing continuous quantum non-demolition measurement readout based on Faraday rotation we are able to study nontrivial time-dependent behavior of the atomic population. Using a full theoretical analysis of SE that accounts for the time-dependent SE dephasing rate caused by population dynamics during Rabi oscillations, we observe excellent agreement between the model and the measured coherence in the continuous Faraday signal.
With this full understanding in hand, we illustrate that the Rabi lineshape is connected to many vapor parameters and show that driving multiple transitions can pinpoint useful information. Specifically, we extract from SE coherence consistent values for the vapor temperature, buffer gas pressure, and the atomic state prepared by optical pumping by using the fact that the Rabi envelope reflects the initial atomic populations, as well as their subsequent SE redistribution predicted from our model. While similar population dynamics occurs with OPMs that sense the free Lamor precession, such SE effects are more apparent and distinguishable with Rabi oscillations that probe discrete states [Fig. 1(b)].
Theoretical model.—We first describe our theoretical model for driving Rabi oscillations in an alkali vapor cell. The relevant atomic dynamics occurs in the two hyperfine ground manifolds . Hence we describe the state of the atomic ensemble by a density matrix in the basis. The time evolution of the atomic ensemble including multiple sources of collisional decoherence is given by budker2013optical
| (1) | ||||
where is known as the nuclear part of the density matrix for which Tr and Tr hold baranga1998polarization . The Hamiltonian
| (2) |
describes the hyperfine structure, Zeeman shift from an applied DC magnetic field oriented along , and the atom-microwave coupling. Here,
| (3) |
describes the magnetic part of the microwave field kopsell2017measuring that drives Rabi rates defined in the spherical basis with transition dipole moments . To eliminate the large energy scale caused by , as well as high-frequency counter-rotating terms in Eq. (2), we assume the rotating wave approximation to reduce the computation time required to solve Eq. (1). Full details on the Hamiltonian and the RWA are discussed in the Supplementary Material suppMat .
| Collision | [Hz] | |
| (Rb-Rb) | 1.9 micalizio2006spin | 6.6 |
| (Rb-Rb) | baranga1998polarization | 6.1 |
| (-Rb) | chupp1989laser | 40 |
| (-Rb) | walter2002magnetic | |
| wall | pouliot2021accurate |
Coherence effects due to SE and S-damping (SD) collisions are modeled by the second and third terms of Eq. (1), respectively. Collision rates are characterized by cross sections , the mean relative velocity of the colliding pair , and the atomic density for alkali (buffer gas) collisions allred2002high-sensitivity . The fourth term models pure dephasing of the microwave transitions due to buffer gas collisions where represents the density matrix with only off-diagonal terms of the coherences between the upper and lower hyperfine manifolds, is the Carver rate, and is the isotope coefficient defined by the nuclear magnetic moment and nuclear magneton jau2005new ; walter2002magnetic . The fifth term of Eq. (1) models diffusion into the cell wall where alkali spins are completely randomized. Here is the diffusion constant attenuated by the buffer gas pressure where atm. We approximate the effect of wall collisions by replacing , where is the diagonalized density matrix with all populations equal and is the fundamental decay mode defined by the vapor cell dimensions , , and franzen1959spin . In practice, higher-order diffusion modes that cause multiple decay rates also need to be considered. For context, Table 1 contains the collision rates, cross-sections, and diffusion constant assuming the vapor cell parameters and the Rb-N2 alkali-buffer gas mixture used in our experiment.
First, we study the dephasing rate of Rabi oscillations with the atomic ensemble initialized in the steady-state solution when SE collisions dominate over other types of collisions and scattering rates. This solution, known as a spin-temperature distribution, is defined by the atomic populations as , where and is the electron spin polarization. This situation is a close approximation for many vapor cell experiments that optically pump with high buffer gas pressure jau2004intense ; baranga1998polarization . We specifically study the and transitions in Fig. 1. For the and Rabi oscillations, we set the initial atomic state away from a ST distribution in our simulation by switching the atomic populations of the transition [Fig. 1(a) magenta boxes]. This increases the atomic population difference in the and transitions and enables larger signals.
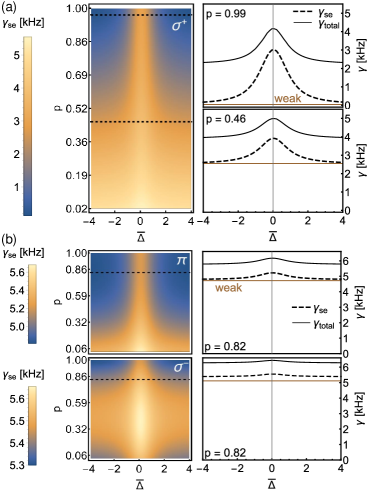
For spin-exchange collisions, the dephasing rate is proportional to the collision rate appearing in Eq. (1) and further depends on the atomic populations due to the different projections of the basis on the electron spin. Hence, using Eq. (1), we investigate as a function of the electron spin-polarization p and the normalized microwave detuning where as the primary variables affecting atomic population dynamics [Fig. 2]. For now we assume vapor parameters C and Torr and consider Rabi oscillations between the hyperfine ground states of 87Rb.
By neglecting the last three terms in Eq. (1), we can compare the dephasing rate due to SE alone (black dashed) to the case with all collisional processes (black solid) as shown in Fig. 2. We also plot the predictions of the weak-driving approximation (brown) to show the large discrepancy between previous studies of SE linewidths with the full-numerical solution shown in this work in the regime of strong coherent driving. Such coherent dynamics and atomic population redistribution from SE collisions leads to an increased dephasing rate near that is symmetric with for the transitions and initial states considered here [Fig. 2]. This effect is heightened for the transition where no hyperfine-changing collisions occur for atoms purely in the initial ‘stretched’ state , when all electron spins are aligned, but are coherently coupled into with projections onto states with oppositely aligned electron spins. If the initial atomic populations are not a ST distribution, then the hyperfine coherence will have multiple decay rates because the atomic populations are time-dependent even in the far-detuned limit. This explains the small descrepancy between the weak-driving approximation and the far-detuned Rabi driving in the case of the and transitions due to the population switch [Fig. 2(b)].
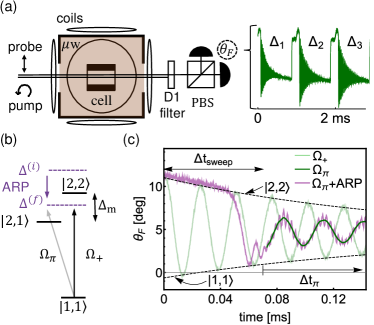
Experimental Methods.—To validate this theoretical description, we experimentally drive Rabi oscillations on the and microwave transitions [Fig. 1(a)] near , where the assumption of weak-driving does not hold, and further, where the theoretical model predicts larger SE dephasing rates than the weak-driving approximation. Our apparatus [Fig. 3(a)] consists of a square-shaped ( cm3) microwave cavity with the degenerate modes ()= and tuned near the 87Rb hyperfine ground state resonance ( GHz), a microfabricated vapor cell ( mm3) filled with 87Rb and 180 Torr buffer gas, and a DC coil system consisting of three pairs of near-orthogonal coils to create a static magnetic field ( T) to lift the degeneracy between adjacent magnetic sublevels by kHz [Fig. 3(b)]. While the use of a cavity is not crucial for this investigation, we plan to exploit the cavity modes and the Rabi spectroscopy presented here for future control of microwave polarization for vector magnetometry thiele2018self . Electrical heat tape heats the microwave cavity, and by design, also the cell to near 108∘C. To avoid stray magnetic fields, we turn off the heat tape 80 ms before each measurement. Due to the polarization structure of the microwave field, we tilt the magnetic field from the pump-beam axis by 25∘ such that a non-zero microwave field component drives all microwave hyperfine transitions with respect to [Fig. 1(a)].
To study the coherent population transfer, we infer the atomic state by measuring the Faraday rotation angle (), of the probe beam GHz detuned from the D2 line (780 nm) to obtain fast continuous measurements while minimizing decoherence from scattered light. While OPMs also typically use Faraday rotation to sense Larmor precession allred2002high-sensitivity ; shah2010high ; li2011optical , all previous measurements of Rabi oscillations in vapor cells, to our knowledge, have used absorptive imaging to sense spin dynamics affolderbach2015imaging ; bohi2012simple ; horsley2015widefield ; liu2018survival . Our readout enables measurements of consecutive Rabi oscillations for various microwave detunings (, ) and transitions in real time [Fig. 3(a)].
In each measurement, we first prepare a spin-polarized atomic ensemble by continuously optically pumping with circularly-polarized light that is near-resonant with the D1 line (795 nm) for 100 s. Immediately after, we adiabatically turn off the pumping light over the next 100 s to align the atomic spins with the static magnetic field and avoid Larmor precession. After preparation of the macroscopic atomic spin in the state, we prepare the ensemble in the state using adiabatic rapid passage (ARP) [Fig. 3(b-c)]. For this we switch on a strong microwave drive at detuning kHz above the resonance and then linearly chirp it to kHz below the resonance within s. Then, we continue to study the dynamics of Rabi oscillations near-resonance by tuning to . In the acquired data, we filter out high-frequency oscillations due to off-resonant coupling to adjacent microwave transitions [Fig. 3(c)]. Note, to study the transition that couples to , we do not perform an ARP.
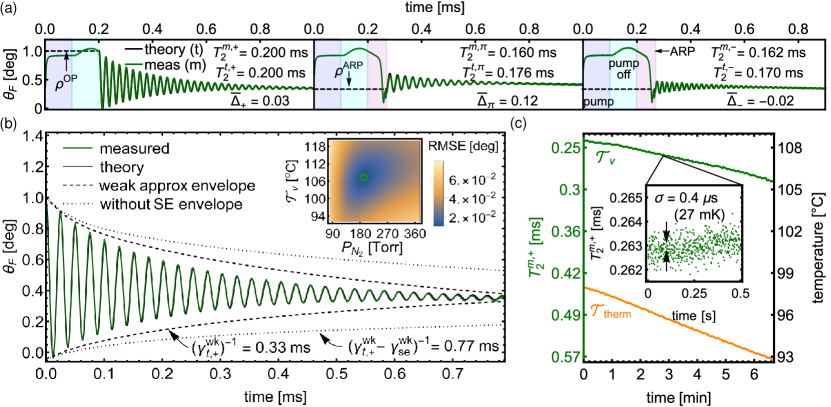
Verification of theoretical model— To assess the accuracy of the theoretical model, we mimic the experimental sequence and parameters when solving Eq. (1) to compare the theoretical and measured dephasing rates and Rabi envelopes for the and transitions as shown in Fig. 4(a-b). During this process we fit free parameters in our model that represent the vapor temperature , buffer gas pressure , and the electron spin polarization p produced by optical pumping, whose extracted values are consistent with independent knowledge of the apparatus. For modeling state preparation, we make the approximation that there are no initial atomic coherences and use the Rabi measurements to fit the atomic populations in each ground state subsequent to optical pumping and produced after ARP. We find unique solutions for the atomic populations while also fixing the electron spin polarization p suppMat .
After spin preparation, we model the full atomic spin dynamics by solving Eq. (1) that provides , where is the difference between the z-component of the hyperfine spin in the and manifolds. We model Faraday rotation by , where is a scaling constant that we fit originating from the light-atom coupling and is a measured initial polarization offset of the probe beam suppMat . To account for higher-order diffusion modes affecting the wall-collision rate and residual light scattering from the probe, we independently measure the non-exponential dependence of macroscopic spin decay and model as an effective time-dependent wall collision rate . We use fitted values for the static magnetic field, kHz for the hyperfine frequency shift from buffer gas collisions, and kHz extracted from Rabi oscillations driven at multiple detunings suppMat .
Our model extracts C, Torr, and p from the measurements by utilizing all three Rabi lineshapes to minimize the root-mean-square error (RMSE) between the simulated and the measured suppMat . The inset of Fig. 4(b) displays the RMSE over variations of the vapor temperature and the buffer gas pressure , where the green circle marks the optimal values.
The dephasing rates and nuanced features of the lineshapes predicted theoretically agree with the measured dephasing times and lineshapes (black/green lines Fig. 4). In contrast, the corresponding weak-driving approximation predicts a total dephasing time for the Rabi oscillation that underestimates [Fig. 4(b)]. Here, is extracted from fitting a single decay rate to a theoretical Rabi oscillation given by an exponentially decaying sine with instantaneous decay rate accounting for all sources of collisional decoherence but using the weak driving approximation for the spin-exchange dephasing rate. In fact, in order for to match the measured Rabi coherence would require to sufficiently increase the SE collision rate. This is far from the thermistor temperature C, which we expect is cooler than the vapor temperature by only a few C due to thermal gradients across the microwave cavity. Furthermore, an electron spin polarization of p is reasonable given the uncoated glass walls of our cell and the misalignment between the pump beam and the static magnetic field, and Torr is in close agreement with buffer gas pressures {170, 180, 330} Torr extracted independently from broadening and frequency shifts in both microwave and optical measurements suppMat .
Intra-cell thermometry demonstration— Finally, we demonstrate the application of Rabi coherence to intra-cell thermometry [Fig. 4(c)], which is generally useful for characterizing the performance of atomic vapor sensing platforms and is particularly useful for stabilizing and optimizing the accuracy of atomic clocks wells2014stabilizing ; hao2020efforts . In contrast, external sensors such as thermistors do not sense the actual vapor temperature. Here we cool the vapor cell by switching off the heat tape attached to the microwave cavity. While the cell cools, we record the Rabi dephasing time by generating a half-second long train of 500 Rabi oscillations triggered every four seconds over a seven minute cooling period of 3.5 C. We map the measured dephasing time to the intra-cell vapor temperature by varying within the calibrated theoretical model and fitting an interpolating polynomial to the simulated dephasing time . The temperature dependence of arises from the atomic density, which decreases as the vapor cell cools. From a single 500 ms train of Rabi oscillations we measure a temperature sensitivity of [Fig. 4(c) inset]. This is a competitive sensitivity with other techniques wells2014stabilizing ; salleras2009predictive , and demonstrates Rabi coherence as a novel platform for intra-cell thermometry.
Conclusions.— Rabi oscillations between hyperfine manifolds in heated vapor cells exhibit nuanced time-dependence due to the SE effects on atomic dynamics, which prevents accurate evaluation and understanding of sensitivities for the increasing applications of Rabi oscillations in metrology applications. This work completes previous investigations of hyperfine coherence by using an exact numerical model and continuous QND sensing in a vapor cell to study significant deviations of SE coherence from the weak driving predictions assumed historically. We find excellent agreement with the coherence predicted by our model and Rabi oscillation measurements. Moreover, we find further agreement with the fact that we can exploit multiple hyperfine transitions to determine vapor-cell parameters and temperature dependence that are consistent with independent characterizations. This extended information that harnesses SE effects may be useful for vapor-cell characterization and intra-cell thermometry in future experiments, and the continuous Rabi measurements presented here will be an important component of working toward a use in absolute vector magnetometry thiele2018self .
This work was supported by DARPA through ARO grant numbers W911NF-19-1-0330 and W911NF-21-1-0127, NSF QLCI Award OMA - 2016244, ONR Grant No. N00014-17-1-2245, and NSF Grant No. PHYS 1734006. We acknowledge helpful conversations with Yuan-Yu Jau, Christoph Affolderbach, Vladislav Gerginov and Michaela Ellmeier, and technical expertise from Thanmay Sunil Menon, Yolanda Duerst, and Felix Vietmeyer.
References
- (1) J. Vanier and C. Audoin, The quantum physics of atomic frequency standards, Vol 1 (Bristol: A. Hilger, 1989).
- (2) W. Happer, Rev. Mod. Phys. 44, 169 (1972).
- (3) J. Kong. R. Jiménez-Mart\́mathrm{i}nez, C. Troullinou, V. G. Lucivero, G. Tóth, and M. W. Mitchell, Nat. Commun. 11, 1 (2020).
- (4) Y. Horowicz, O. Katz, O. Raz, and O. Firstenberg, Proc. Natl. Acad. Sci. U.S.A 118 (2021).
- (5) D. Budker and M. Romalis, Nat. Phys. 3 227 (2007).
- (6) W. Happer and H. Tang, Phys. Rev. Lett. 31, 273 (1973).
- (7) I. Savukov and M. Romalis, Phys. Rev. A 71, 023405 (2005).
- (8) J. Vanier, Phys. Rev. 168, 129 (1968).
- (9) J. Vanier, J.-F. Simard, and J.-S. Boulanger, Phys. Rev. A 9, 1031 (1974).
- (10) Y.-Y. Jau, A. Post, N. Kuzma, A. Braun, M. Romalis, and W. Happer, Phys. Rev. Lett. 92, 110801 (2004).
- (11) A. Horsley, G.-X. Du, and P. Treutlein, New J. Phys. 17, 112002 (2015).
- (12) A. Horsley and P. Treutlein, Appl. Phys. Lett. 108, 211102 (2016).
- (13) P. Böhi and P. Treutlein, Appl. Phys. Lett. 101, 181107 (2012).
- (14) T. Thiele, Y. Lin, M. O. Brown, and C. A. Regal, Phys. Rev. Lett. 121, 153202 (2018).
- (15) E. C. Fear, S. C. Hagness, P. M. Meaney, M. Okoniewski, and M. A. Stuchly, IEEE Microw. Mag. 3, 48 (2002).
- (16) N. K. Nikolova, IEEE Microw. Mag. 12, 78 (2011).
- (17) R. Chandra, H. Zhou, I. Balasingham, and R. M. Narayanan, IEEE transactions on biomedical engineering 62, 1667 (2015).
- (18) J. P. Wittke and R. Dicke, Phys. Rev. 103, 620 (1956).
- (19) D. Budker and D. F. J. Kimball, Optical Magnetometry (Cambridge University Press, Oxford, 2013).
- (20) A. B.-A. Baranga, S. Appelt, M. Romalis, C. Erickson, A. Young, G. Cates, and W. Happer, Phys. Rev. Lett. 80, 2801 (1998).
- (21) J. Köpsell, T. Thiele, J. Deiglmayr, A. Wallraff, and F. Merkt, Phys. Rev. A 95, 053860 (2017).
- (22) See Supplemental Material for more details.
- (23) A. Pouliot, G. Carlse, H. Beica, T. Vacheresse, A. Kumarakrishnan, U. Shim, S. Cahn, A. Turlapov, and T. Sleator, Phys. Rev. A. 103, 023112 (2021).
- (24) W. Franzen, Phys. Rev. 115, 850 (1959).
- (25) S. Micalizio, A. Godone, F. Levi, and J. Vanier, Phys. Rev. A 73, 033414 (2006).
- (26) T. Chupp and M. Wagshul, Phys. Rev. A A, 4447 (1989).
- (27) D. Walter, W. Griffith, and W. Happer, Phys. Rev. A 88, 093004 (2002).
- (28) J. C. Allred, R. N. Lyman, T. W. Kornack, and M. V. Romalis, Phys. Rev. Lett. 89, 130801 (2002).
- (29) Y.-Y. Jau, New studies of optical pumping, spin resonances, and spin exchange in mixtures of inert gases and alkali-metal vapors (Princeton University, 2005).
- (30) V. Shah, G. Vasilakis, and M. Romalis, Phys. Rev. Lett. 104, 013601 (2010).
- (31) S. Li, P. Vachaspati, D. Sheng, N. Dural, and M. V. Romalis, Phys. Rev. A 84, 061403 (2011).
- (32) C. Affordbach, G. X. Du, T. Bandi, A. Horsley, P. Treutlein, and G. Mileti, IEEE Trans. Instrum. Meas. 64, 3629 (2015).
- (33) G. Liu, O. Be’er, Y. Margalit, M. Givon, D. Groswasser, Y. Japha, and R. Folman, Phys. Rev. A 98, 013856 (2018).
- (34) N. P. Wells, T. U. Driskell, and J. C. Camparo, in 2014 European Frequency and Time Forum (EFTF) (IEEE, 2014) pp. 548-553
- (35) Q. Hao, W. Xue, F. Xu, K. Wang, P. Yun, and S. Zhang, Satellite Navigation 1, 1 (2020).
- (36) M. Salleras, E. Eklund, I. Prikhodko, and A. Shkel, in TRANSDUCERS 2009 Int. Solid-State Sens., Actuators and Microsyst. Conf. (IEEE, 2009) pp. 304-307.