Combining human parsing with analytical feature extraction and ranking schemes for high-generalization person reidentification
Abstract
Person reidentification (re-ID) has been receiving increasing attention in recent years due to its importance for both science and society. Machine learning and particularly Deep Learning (DL) has become the main re-id tool that allowed researches to achieve unprecedented accuracy levels on benchmark datasets. However, there is a known problem of poor generalization of DL models. That is, models trained to achieve high accuracy on one dataset perform poorly on other ones and require re-training. To address this issue, we present a model without trainable parameters which shows great potential for high generalization. It combines a fully analytical feature extraction and similarity ranking scheme with DL-based human parsing used to obtain the initial subregion classification. We show that such combination to a high extent eliminates the drawbacks of existing analytical methods. We use interpretable color and texture features which have human-readable similarity measures associated with them. To verify the proposed method we conduct experiments on Market1501 and CUHK03 datasets achieving competitive rank-1 accuracy comparable with that of DL-models. Most importantly we show that our method achieves 63.9% and 93.5% rank-1 cross-domain accuracy when applied to transfer learning tasks. It is significantly higher than previously reported 30-50% transfer accuracy. We discuss the potential ways of adding new features to further improve the model. We also show the advantage of interpretable features for constructing human-generated queries from verbal description to conduct search without a query image.
Keywords: person reidentification, re-id, human parsing, analytical features, similarity ranking, generalization.
1 Introduction
Person re-identification (re-ID) is becoming one of the most significant research topics in computer vision and computational intelligence due to its two-fold importance for both science and society. It focuses on person identification across camera systems addressing the increasing demand for public safety. The problem of person identification commonly goes along with person detection and tracking tasks [1]. The reidentification task is commonly formulated as follows: a person in a query image is to be matched with a person in an image or images obtained from data streams of different cameras or a given camera at various moments in time. A database of images or videos is often used instead of live streams. The main challenge is to assess the similarity between objects while taking into account possible changes in human appearance due to variations in camera viewpoints, lighting conditions, person’s pose, and occlusions. In this paper we focus on the similarity assessment while for database search techniques the reader is referred to literature [2] with special mention of emerging graph-based methods [3], [4].
In practice re-ID person similarity evaluation is done using images obtained from video frames. Recently various video re-ID approaches emerged that effectively used temporal information to improve the assessment accuracy [5], [6]. Nevertheless, visual similarity estimation remains the core of re-ID and methods that perform well on images can be expected to perform even better when combined with temporal data.
Fast development in the area of convolutional neural networks (CNN) and deep learning (DL) that affected numerous areas of computer science also led to the emergence of machine learning and DL-assisted re-ID techniques [7], [8]. Re-ID requires CNNs to assess similarity for image pairs which is not typical for conventional image classification tasks. This inspired researchers to propose novel network architectures such as Siamese networks [9], [10], specialized loss functions e.g. triplet loss [11], [12], specific attention modules [13], re-ID graph neural networks [14], and others. Augmented images were often included in training datasets to simulate illumination-related effects [15], [16]. Many early works focused on using CNNs for either feature extraction or metric learning [17], [18], with end-to-end models gradually becoming dominant in the field.
However, generalization of the results is challenging for DL-assisted re-ID. That is, models trained on specific datasets tend to perform poorly on other data, as can be illustrated by models trained on Market1501 to 98% rank-1 accuracy reaching only 38% accuracy on DukeMTMC and 51% vice versa [19]. The effects of negative transfer learning can be drastic due to significant variations in data contents, e.g., different clothes people wear, different camera types, different filming environments. A combination of such effects is often referred to as “Open-World re-ID problem” addressing which requires further complication of the CNN architecture [18], [20]. Therefore, models become extremely bulky with significant parameter redundancy that reduces speed and increases computational power and storage demands. Thus, generalization implies overparameterization that increases costs and does not guarantee good performance.
To address this issue, we focus on analytical techniques to obtain a compact and fast-performing model to reduce computational costs and improve generalization. This is achieved by constructing compact interpretable object descriptors (feature vectors) combined with a similarity ranking scheme. Analytical models, while falling out of favor recently due to growing interest towards DL models, previously showed promising results on re-ID tasks [21] [22]. This was mainly achieved by constructing an ensemble of features while having a trainable model that finds feature weights in a manner similar to metric learning [21], [23]. This approach is different to CNN techniques that work on images with nearly no preprocessing and generate feature vectors incomprehensible for human operators. On the contrary, analytical feature extraction makes it possible to construct human-readable features that improve interpretability of the results. In this work we focus on color and texture features. When comparing two objects, vector elements will represent the percentage of similarity with respect to a specific feature.
A drawback of old analytical models was that feature vectors were global, i.e., generated for the whole image possibly including background and other objects. Thus, it was impossible to obtain features of specific elements like clothes or hair color. Now such separation into different elements can be achieved using human parsing that allows one to divide an object into class-specific subregions. This makes it possible to generate feature vectors for specific classes and to assess their similarity class by class. The overall similarity is combined of class similarities weighted by class importance. It acts as a score to obtain a similarity ranking for query images with test images and evaluate rank-r matching rate [7], [24], [25]. Furthermore, we propose a model without trainable parameters that is immune to dataset-dependent negative effects which emerge due to data fitting techniques used by CNNs or trainable analytical models.
2 Methodology
2.1 Overview of the method
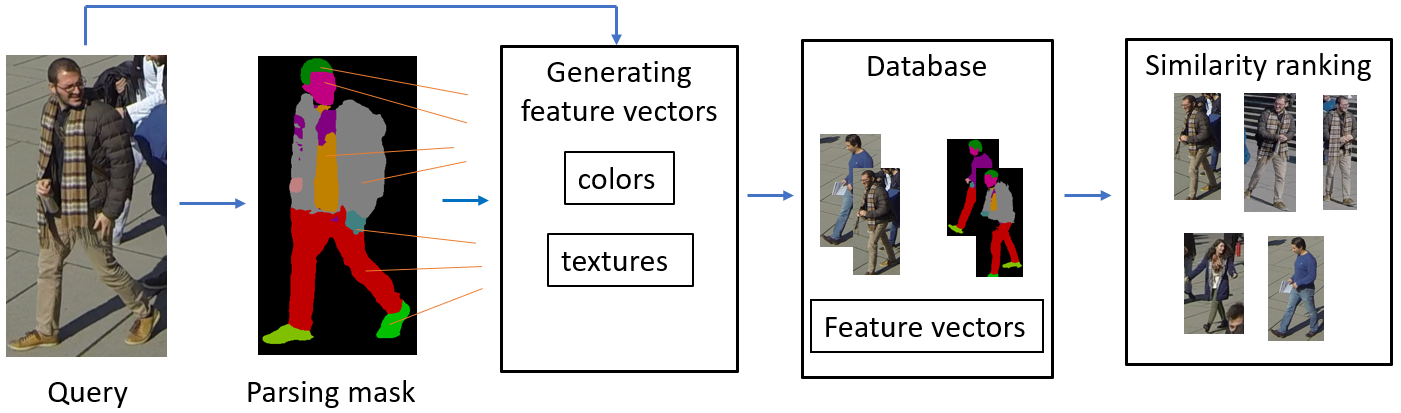
The proposed method consists of four major steps shown in Fig. 1: parsing of the query image, feature extraction for each subregion (class), similarity score calculation between query and test set images to calculate rank-r ranking results. It should be noted that for best performance it is necessary to store parsing masks and feature vectors in the database along with the original images. This allows image parsing and feature extraction operations to be conducted once per image.
2.2 Image parsing
Original image processing techniques utilized in analytical re-ID were applied to full images, primarily due to the lack of reliable segmentation techniques. This resulted in feature vectors of different subregions being mixed complicating the similarity estimation. Implementation of preliminary image parsing, and specifically human parsing, is a promising technique that allows to divide an object into subregions corresponding to specific classes. Whereas clustering-based segmentation was well-known, it was computationally expensive and did not provide sufficient accuracy. Spatiotemporal features based on graph partitioning of the full image were proposed to localize feature vectors to specific regions [22]. More recently a simple approach was proposed that leveraged the fact that body parts in different images ordinarily appeared in the same image sections in re-ID datasets. This allowed one to separate images into three or more subregions and to calculate local feature vectors for horizontal strips [26]–[28]. This way the information about the head, torso and legs could be obtained. Whereas being computationally convenient, this method was not robust in scenarios that included pose change and partial occlusion. Furthermore, the information regarding the difference between elements withing one strip, like hands and torso, was lost. This was addressed by several modifications based on more detailed representation of human body structure [5], [29]. Nevertheless, such naïve segmentation has fundamental disadvantages which human parsing avoids.
The main goal of human parsing is to provide a mask which assigns a specific class to every image pixel. For re-ID purposes these include body parts, hair, clothes, and other wearables. Whereas this task can also be performed by more sophisticated general purpose image segmentation tools, they are unnecessarily complex due to redundant classes such as furniture, animals, or vehicles which are irrelevant for person segmentation [30]. Human parsing is usually performed by neural networks trained on human parsing datasets, e.g. LIP or Pascal [31], [32]. Several researches have shown that incorporating human parsing into re-ID framework significantly improves the prediction accuracy [25], [33]. However, existing solutions still utilize additional neural networks for feature extraction, metric learning, feature importance estimation (attention), and decision making resulting in complex architectures.
In this paper we propose to combine recent advances in human parsing with analytical feature extraction. Human parsing naturally handles aspects that are challenging for analytical methods by providing the initial segmentation of an object into subregions. Since every subregion is assigned its class, this allows to compare feature vectors of the same class without dealing with the noise originating from neighboring subregions. Shape of the subregions mimics the real shape of the elements in the image which pairs well with methods that do not require to apply filters to subregions for feature extraction.
In this work we use out-of-the-box human parser SCHP [34] trained on LIP dataset to obtain a parsing mask and generate color and texture feature vectors for every class. It should be stressed that the parser is used “as is” and no additional training has been performed. For a pair of images feature vectors are compared only for classes present in both images. It should be noted that whereas mean intersection over union (mIOU) accuracy of SCHP is 59%, it performed very well in our experiments providing sufficiently accurate parsing masks. This is partially because the accuracy requirements we pose on parsing for re-ID are different from the ones in pure human parsing tasks. There is a common problem that semantically similar classes, e.g. coats and upper clothes, are easily mixed up. Whereas knowing whether a person is wearing a coat, or a shirt, is indeed valuable and additional logic can be built using this knowledge, it currently cannot be relied upon, and we do not require the parsers to make such distinctions correctly. To address this, we merge several semantically similar classes. Specifically, using LIP class notation, we merge upper clothes, dress, coat, and jumpsuit into “upper clothes” (class 5); and pants and skirt into “pants” (class 9). We also disregard the “background” class. Thus, we work with fifteen unique classes out of twenty original LIP ones.
2.3 Color similarity
2.3.1 Choice of color space and histogram modification
Whereas RGB color scheme, or color space, is widely used in image encoding, it is not particularly suitable for image processing for identification purposes. Therefore, other color spaces are used instead which commonly include HSV, CMYK, YCbCr, and others [21], [35]. HSV color space and specifically H channel information was found to be the most descriptive by several researchers working on color similarity for re-ID [15], [35]. However, highest accuracy results were commonly obtained using an ensemble of features, which could include a variety of different channels from different color spaces [21].
There is also a problem that these color spaces are perceptually non-uniform with non-metric distances. On the contrary, CIE-Lab (Lab) color space is a uniform color space where Euclidian distance can be used as a metric for color difference calculation [36]. Whereas less popular in comparison to other color spaces, it previously was successfully applied to image similarity estimation [37]. In this paper we use Lab color space to leverage the combination of perceptual uniformity with metric distance measurement to create a two-fold color similarity estimate by comparing histograms of Lab channels. It is also essential that the effects of illumination changes which complicate color comparison are localized in the lightness (L) channel. We propose two approaches to illumination change handling based on L channel histogram analysis. They were developed while working with Wildtrack dataset [38].
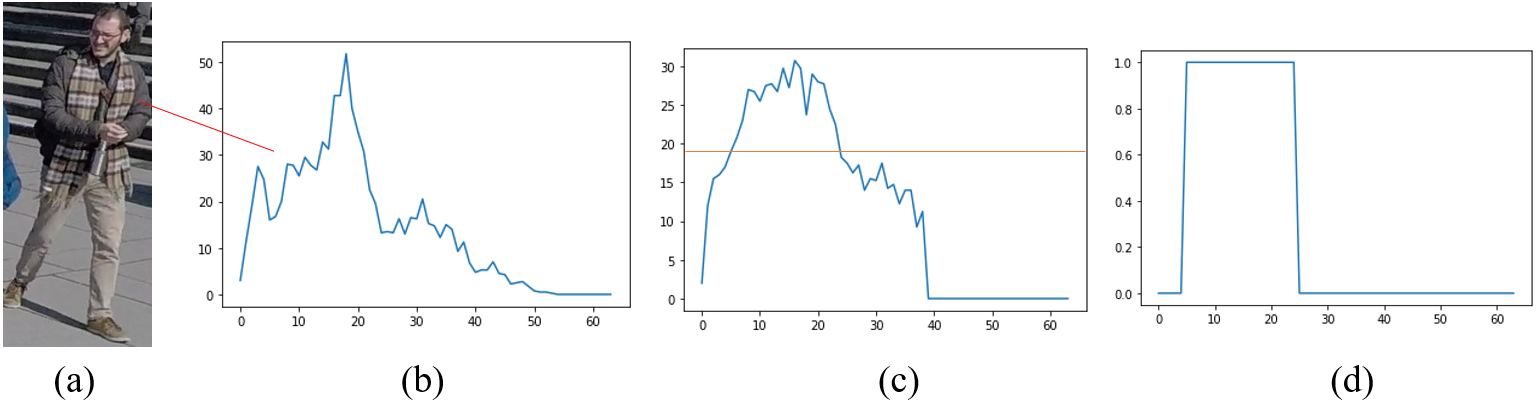
Firstly, L channel histograms (Fig. 2 (b)) extracted for every subregion class of an input image (Fig. 2 (a)) are “stretched”. To do that the number of bins in the original histogram is first reduced from 256 to 64 by averaging the pixel values of neighboring bins. Then Algorithm 1 is used to obtain a histogram shown in Fig. 2 (c).
This allows to normalize lightness levels among images taken at different lighting conditions. Algorithm 1 is different from conventional histogram stretching in that a) it does not force the new histogram to occupy the whole range and b) the range of “stretching” depends on the extent that the number of pixels in certain bins exceeds the average pixel number. In other words, the range of stretching is proportional to the excess of pixels in some bins.
Before stretching a check for over-highlights is also performed. It was noticed that for images where the number of pixels in the last bin exceeds 1% of all pixels prior to the proposed modification, L channel histograms become unreliable for color comparison due to loss of information. Over-highlighted classes are not included into similarity estimation.
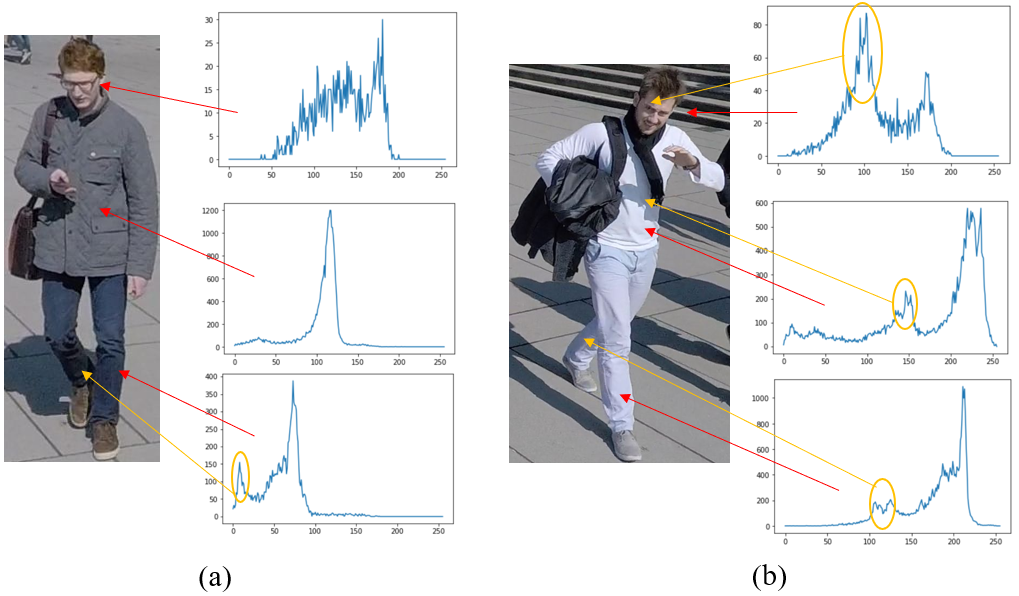
Secondly, shadows can lead to significant distortion of color similarity estimation. Local shadows appearing due to local occlusions further complicate the situation since such effects cannot be handled by the first approach. It was noticed that in many cases local shadows form a distinct peak on L channel histogram which precedes the peak related to the most prominent real color, as shown in Fig. 3. This suggests that removing the first peak might significantly improve the analysis accuracy. However, regions related to shadows are harder to locate for low-resolution or poorly lit images. Naively removing a part of the histogram results in worse accuracy in such cases. The search for a comprehensive approach to handling local shadows is still being conducted.
2.3.2 Representative color intensities and histogram thresholding
Possible changes in view angle present another challenge for color comparison methods. They can lead to same distinct areas appearing to have different sizes, making Lab channels’ histograms for same classes of the same object shift dramatically. This makes bin-to-bin histogram comparison methods less accurate which has inspired the development of other comparison metrics [37], [39]. However, they still might give misleading results due to drifts in pixel intensities caused by illumination and point of view changes. To address this issue, we propose a simple thresholding scheme with a purpose of finding the most representative pixel intensities.
Firstly, the number of bins in color channel histograms is reduced from 256 to 64 as for L channel histograms in Section 2.3.1. This reduces the influence of drifting effects. Secondly, for every bin j of the original histogram ho of channel i (where i = L,a,b), where L channel histogram is “stretched”, we assign “1” in its binarized version hb when the number of pixels in that bin exceeds the threshold kbi, and assign “0” otherwise as shown in Fig. 2 (d) so that
| (1) |
| (2) |
where kinc is an empirical coefficient that increases threshold value over simple average. In our experiments kinc = 1.5 was found to provide the best results. This approach also allows us to design a comparison scheme for a pair of histograms. Given two binarized histograms hbi1 and hbi2 of the same class in two images we find their sum hti which can consist only of zeroes, ones, and twos and define color channel similarity measures as:
| (3) |
| (4) |
where s1 and s2 are the numbers of times “1” or “2” appeared in ht, respectively. The intuition behind this is to find intensities prominent in both histograms as well as their fraction relative to the total number of non-zero bins so that Si lies in [0,1] range. This operation is very similar to histogram intersection [39]. However, it does not require hbi1 and hbi2 to have the same number of non-zero bins and it is commutation-invariant. The former is very important since the number of non-zero intensities after thresholding can vary significantly for different images.
2.3.3 Distance in Lab color space as similarity measure
It was previously mentioned that distances in Lab color space obey Euclidian distance equation. This allows to judge how similar two colors are depending on how close their corresponding Lab vectors lie. Since we deal with histograms rather than actual colors, we first propose to calculate average intensity for histograms in every channel, and to treat such triplet as coordinates of a point in Lab space. In this case numbers of pixels hoij in bins j of the original histogram ho act as weights so average intensity in color channel i is calculated as
| (5) |
For image segments of uniform color a triplet (IL, Ia, Ib) is expected to lie close to the main color perceived by human eye. In case of multiple subregions with different colors it may not correspond to any real color present in the image. However, this is sufficient for distance calculation purposes, so for two segments of the same class
| (6) |
We then propose a normalized similarity measure Sd with values in [0,1] range which is related to d as
| (7) |
where kd is an empirical distance coefficient and in this work kd = 35.
2.4 Texture similarity
Analytical texture descriptors are often separated into two broad categories: skeletal shape abstraction and local texture descriptors. The former deals primarily with the overall geometrical structure and object’s shape [40]. The latter extracts subregion-specific information about the object’s texture using filters or operations on pixels and their neighborhoods [41].
In this work we focus on the local texture description because image parsing allows us to obtain initial classification of subregions. In our case skeletal descriptors provide insufficient information since two objects that are already classified as “upper clothes” or “pants” by default have very similar structure. In prior work filter packs that included Gabor filters were found to perform well on re-ID tasks [21]. Whereas such filters provided desirable translation and affine-invariant texture descriptors, the necessity to fine-tune filter parameters led to a significant number of filters required to analyze a sufficiently vast variety of different textures. To avoid this, we have chosen Local Binary Pattern (LBP) method due to its ability to generate texture descriptors.
LBP is a local texture descriptor that was found to be extremely useful in texture and face classification. It assigns every pixel of a grayscale image a binary number with bits representing whether pixel neighbor’s intensity is greater than that of a central pixel. In the simplest case of only checking the closest neighbors (radius r=1) we obtain an 8-bit binary number and convert it to decimal. All decimal numbers of the image are combined into a 256-bin histogram. It is important to note that every bin corresponds to a unique texture type, which can be significantly different for neighboring bins.
Over the years various modifications to the original LBP were proposed, including multiscale extension [42], spatial enhancement [43], and texture uniformity classification [44]. These methods often include concatenation of several local histograms to encode additional spatial information. However, such modifications are not suitable for re-ID purposes since they are not translation and rotation invariant. This is acceptable for face recognition tasks where distinct facial features are always localized in the same regions of an image, but not for re-ID images, where point of view and object orientation can change dramatically. The separation of textures into uniform and non-uniform classes that was found useful in many face recognition tasks also did not perform well here. The reason lies in the significant reduction in the number of non-zero bins and loss of some descriptive information. Whereas for face recognition tasks uniform patterns were found most informative, this appears not to be the case for re-ID tasks.
Therefore, we use the original LBP method with one slight modification. It was shown that LBP can be made rotation and affine transformation invariant by performing a circular bit-wise right shift on the binary numbers [45]. Whereas this also reduces the number of possible non-zero bins, these invariances are essential for re-ID. This modification was found to improve the performance in our experiments.
In this work we calculate two LBP histograms for every class of interest in the image. They correspond to LBP descriptions of subregion’s contour and its inner area. It was found that separating them positively affects the similarity estimation because contour similarity varies in a wider range and its variations are not trivial with respect to changes in the inner area’s similarity. As a similarity measure for contour or inner area (channel m = co, in) histograms of two images we use histogram intersection. In order to obtain a commutation invariant similarity measure for a pair of histograms, the histograms are first normalized with respect to the total number of points in all bins in that histogram yielding modified histograms htm1 and htm2, so that values in bins show percentages of all textures corresponding to those bins, so that
| (8) |
with values in [0,1] range. In our experiments similarity estimates obtained using texture and color descriptors did not provide overlapping results implying that there is no trivial relationship between features. This is essential because texture descriptors can address cases challenging for color similarity estimation and vice versa.
| Feature | L | a | b | d | tin | tco |
|---|---|---|---|---|---|---|
| Weight | 0.13 | 0.13 | 0.13 | 0.31 | 0.15 | 0.15 |
| Parsing class | Hair, socks, face, | Hat, gloves, sun- | Scarf | Pants | Upper clothes |
|---|---|---|---|---|---|
| legs, arms | glasses, shoes | ||||
| Weight | 1 | 2 | 3 | 6 | 8 |
2.5 Similarity score calculation for similarity ranking
Previous sub-sections discuss six feature channels (Sf) with similarity measures SL, Sa, Sb, Sd, Sco, and Sin. In general, for a class c with multiple feature channels class similarity is calculated as
| (9) |
| (10) |
where wf is weight of a feature channel f. Table 1 shows wf values used in this study. It is worth pointing out that their sum equals one which ensures that Sc is in [0,1] range. For a query-test pair with n shared classes the total similarity score is calculated as
| (11) |
| (12) |
where wc are class weights shown in Table 2.
It should be noted that unlike channel-wise similarity estimates, similarity score Ssim does not naturally fall in [0,1] range. In general, Ssim depends on the number of shared classes n, which varies from one to the number of classes in query image. The highest score would be obtained by a pair of images with all possible classes having perfect similarity among all features, which for the weights in Table 2 amounts to 34. In practice it is extremely rare to have objects with all fifteen different classes present in both images and similarity scores are much lower. Whereas a percentage similarity measure can be obtained using (12), it is less meaningful as similarity score since an image pair with fewer classes with low wc but high Sc will have higher Ssimn than another pair with many important classes but slightly lower Sc. Thus, we propose to use Ssim rather than Ssimn as scores for ranking.
To calculate rank-r matching rate for a query image its scores Ssim with all test images are calculated and sorted in descending order with r highest score test images returned for match checking
| (13) |
Most popular rank-r metrics are rank-1, rank-5, and rank-10. To evaluate method performance on a dataset with multiple queries the rank-r accuracy is averaged for all queries. The main disadvantage of rank-r metric is that it requires a single match in r which is usually the simplest among possible tests. Thus, it does not contain information about other possible matches and does not reflect the ability of the method to capture complicated matches. To address this problem, mean average precision (mAP) metric is often used along with rank-r when there is more than one correct match in the test set [7], [25]. It is calculated as
| (14) |
| (15) |
where nq is number of queries in query set, nTPi is number of true matches for ith query in test set.
3 Experiments
3.1 Details of the datasets
To verify our methods we conduct experiments on two datasets: Market1501 [28] and CUHK03 [46]. For the latter we specifically use a version with a clear query-test separation [47]. We conduct experiments on both labeled (L) and detected (D) versions of CUHK03. Table 3 provides an overview of the datasets.
Whereas Table 3 shows that Market1501 is significantly larger than CUHK03, the latter provides a considerably bigger challenge due to poor lighting conditions which make different persons look similar. CUHK03 is considered to be one of the most challenging re-ID dataset by some researchers [48]. This explains lower performance of our and other methods on CUHK03 compared to Market1501.
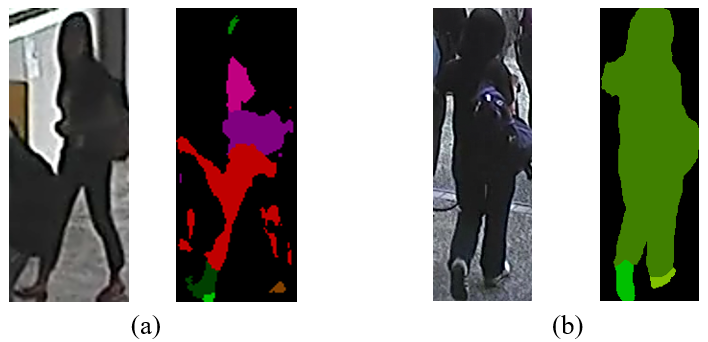
We also inspected SCHP-generated parsing masks of all queries and marked samples where parser made considerable mistakes. Figure 4 illustrates typical parsing errors where a parsing mask is obviously incorrect, or a significant number of subregions are mislabeled. For some experiments summarized in Tables 4 and 5 we excluded query images with parsing errors while labeling the remaining queries as clear queries (cq). We provide the results for both full and clear queries to show the effect of parsing errors on the overall accuracy, and to better investigate the accuracy of the proposed feature extraction and similarity ranking approaches. It should be noted that parsing errors have not been removed from test subsets.
| Dataset | Identities | Images | Test | Queries | Clear | Cameras |
| queries | ||||||
| Market1501 | 1501 | 32668 | 19732 | 3368 | 3062 | 6 |
| CUHK03 (L) | 1360 | 13164 | 5328 | 1400 | 1310 | 2 |
| CUHK03 (D) | 1360 | 12697 | 5332 | 1400 | 1294 | 2 |
3.2 Market1501 experiments
| Model | Backbone | Human | Learning | Rank-1 | Rank-10 | mAP |
| parsing | type | |||||
| SML [49] ‘19 | ResNet-50 | No | US* | 67.7 | - | 40 |
| SIV [50] ‘17 | ResNet-50 | No | S | 79.51 | - | 59.87 |
| MSCAN [51] ‘17 | Custom | No | S | 80.31 | - | 57.53 |
| CAP [52] ‘21 | ResNet-50 | No | US | 91.4 | 97.7 | 79.2 |
| SSP [53] ‘18 | ResNet-50 | Yes | S | 92.5 | - | 80 |
| SPReID [25] ‘18 | Inception | Yes | S | 94.63 | 98.4 | 90.96 |
| Pyramid [54] ‘19 | ResNet | No | S | 95.7 | 99 | 88.2 |
| APNet-C [19] ‘21 | ResNet-50 | No | S | 96.2 | - | 90.5 |
| CTL-S [55] ‘21 | ResNet-50 | No | S | 98 | 99.5 | 98.3 |
| Ours | ResNet-101 (parser) | Yes | A | 91 | 96 | 25.2 |
| Ours (cq) | ResNet-101 (parser) | Yes | A | 93.5 | 98.0 | 25.3 |
*S – supervised, US – unsupervised, A – analytical, no learning
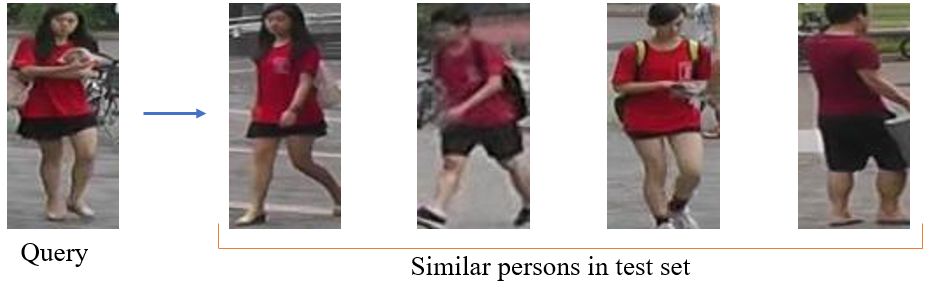
Table 4 shows a comparison of accuracy between our method and other models on Market1501 dataset. It shows that we achieve results comparable with unsupervised learning models and DL parsing models in rank-1 and rank-10 categories. However, mAP accuracy is significantly lower in comparison with other approaches. Fig. 5 shows an example of a typical challenge wherein two different people who are dressed similar have almost the same similarity scores, so their images are mixed obstructing the correct person retrieval. This behavior is understandable since we only use color and texture as features with clothes providing the greatest contribution. It should be noted that we still outperform modern unsupervised models on rank-1/rank-10 metrics.
3.3 CUHK03 experiments
Table 5 shows trends similar to Table 4. However, the rank-1 accuracy achieved on CUHK03 is lower than that of current cutting-edge models by a bigger margin compared to Market1501 experiments. This can be explained by poor lighting resulting in color becoming a less reliable criterion. The effects shown in Fig. 5 are also common for CUHK03 dataset. However, we still outperform several older DL models. It should be stressed that the results in Table 5 are obtained using exactly the same model as the results in Table 4, and the importance of this fact is discussed further in Section 4.4.
| Model | Backbone | Human | Learning | Rank-1 | mAP | Rank-10 | mAP |
| parsing | type | (L) | (L) | (D) | (D) | ||
| HA-CNN [56] ‘18 | Inception | No | WS* | 44.4 | 41 | 41.7 | 38.6 |
| DaRe [57] ‘18 | DenseNet-201 | No | S | 56.4 | 52.2 | 54.3 | 50.1 |
| DaRe [57] ‘18 | DenseNet-201 | No | S + RR | 73.8 | 74.7 | 70.6 | 71.6 |
| SSP [53] ‘18 | ResNet-50 | Yes | S | 65.6 | 63.1 | 66.8 | 60.5 |
| OSNet [58] ‘19 | OSNet | No | S | - | - | 72.3 | 67.8 |
| Top-SB-Net [48] ‘20 | ResNet-50 | Yes | S | 79.4 | 75.4 | 77.3 | 73.2 |
| Top-SB-Net [48] ‘20 | ResNet-50 | Yes | S + RR | 88.5 | 86.7 | 86.9 | 85.7 |
| MPN [59] ’21 | ResNet-50 | No | S | 85 | 81.1 | 83.4 | 79.1 |
| Deep Miner [60] ‘21 | RedNet-50 | No | S | 86.6 | 84.7 | 83.5 | 81.4 |
| LightMBN [61] ‘21 | OSNet | No | S | 87.2 | 85.1 | 84.9 | 82.4 |
| Ours | Resnet-101 (parser) | Yes | A | 61.1 | 20.9 | 59.7 | 20.2 |
| Ours (cq) | Resnet-101 (parser) | Yes | A | 63.9 | 22.1 | 62.2 | 21.4 |
*S – supervised, WS, - Weakly Supervised, RR – re-ranking, A – analytical, no learning
4 Discussions
4.1 Performance and space requirements
In this paper we propose a system which feature extraction and image comparison modules are fully analytical without trainable parameters. Such system has little hardware requirements and does not require GPU. Feature vectors are also compact requiring little storage space. Due to simplicity of the operations (7)-(12) the analysis takes milliseconds even on an average-grade machine and supports multi-threading on a multi-core CPU. The most time-consuming operation is feature extraction since it requires one “walk” over the input matrix (query image). However, it is only done once for every image as feature vectors are stored for future comparison. The results shown in Section 3 are comparable with some cutting-edge DL models indicating viability of the proposed approach. Section 4.4 also discusses much higher generalization potential when the results in Tables 4 and 5 are analyzed together.
One might doubt the above claim since our approach still requires a parser. In this paper we use SCHP with ResNet101 backbone (43 million parameters) which is larger than backbones of most models in Tables 4 and 5. However, using such a large parser is not a necessary requirement. A more compact network could be used instead with little loss of accuracy as discussed in [34]. It was shown that MobileNet-based SCHP parser (4.2 million parameters) performs only 5% worse that ResNet101-based one. At the same time MobileNet backbone is about ten times more compact. Furthermore, it has been discussed in Section 2.2 that the requirements on parsing accuracy for the proposed re-ID approach are less strict compared to pure human parsing tasks. This implies that for our purposes even more compact backbones can be used, e.g. OSNet (2.2 million parameters) [58]. Future work will elaborate on parser size minimization and investigate the possibility of realizing the proposed re-ID system as an edge computing application.
4.2 Adding new features
A major contribution of this paper is feature extraction and similarity score calculation scheme which is based on class similarity considerations. In this paper we propose two types of features, i.e., color and texture features discussed in Section 2. Whereas this is sufficient to achieve high rank-1 accuracy on studied datasets, low mAP accuracy indicates that further improvements are desired. This can be achieved by adding new features on feature vector generation step in Fig. 1 to address the problem illustrated by Fig. 5.
There are two rules that a new feature should comply with: a) its associated similarity measure Sf should be in [0,1] range and b) its weight wf should be added in Table 1 and all weights should be adjusted to comply with (10). Class similarity scores are still calculated using (9). Hence, new features can be added with minimal interference with the rest of the model. Future work will consider pattern and shape features to improve the accuracy.
4.3 Human-readable vectors and human-generated queries
In Section 2 we have discussed that all similarity measures are in [0,1] range and they can be interpreted by a human operator as a percentage similarity according to a specific feature. Whereas this interpretability is useful for analysis purposes, it can also be used to construct feature vectors while not having an actual image. The possibility to conduct search for an object without query images was investigated in early days of re-ID [35], and it can be further improved using our proposed approach which includes human parsing.
Constructing feature vectors can be done as follows. Let’s assume that colors of clothes of a person are known. RGB values of colors can be converted into Lab to instantly obtain triplets (IL, Ia, Ib) discussed in Section 2.3. Using same triplets binarized histograms can be generated by assigning several “ones” in a region surrounding the main color’s intensity. LBP texture features are less intuitive, so a look-up table of vectors of typical textures can be used instead.
Now let’s consider a situation in which query is a vague verbal description. Comparing such query with a database would be impossible for methods that rely on convolutional operations, i.e., all DL models, since the image is missing. Generating vectors corresponding to a given verbal query is also impossible since feature vectors generated by DL models have no clear interpretation. This would require to generate an artificial image which is a very complex task and would require making assumptions of numerous unknown parameters [62].
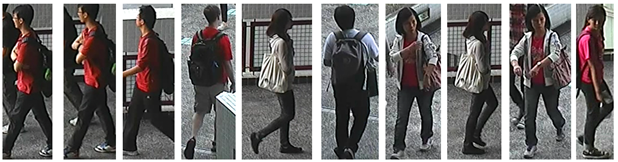
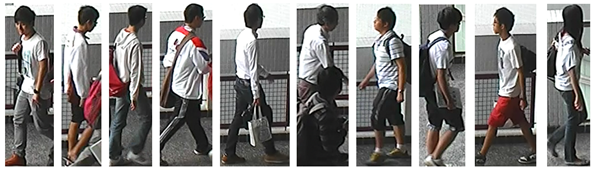
On the contrary, it is possible to search for matches for such query using our proposed method. Figure 6 illustrates an example of a search for a dark hair person wearing a red shirt, black pants, and black shoes. For this search color descriptions are converted into vectors and texture features are generated using values typical for clothes in CUHK03 dataset. Figure 7 illustrates another search results for a person wearing a white shirt. Hence, an operator needs to describe only relevant classes without the need to specify other class properties, e.g., shoes’ color if it is unknown.
4.4 Generalization and potential application to Open-World scenario
Tables 4 and 5 illustrate that the highest accuracy is achieved by models trained using supervised learning especially if re-ranking is applied (see Table 5), which encourages models to give higher scores to true matches, thus increasing mAP. This observation makes it tempting to make parameters in Tables 1 and 2 trainable to possibly improve the accuracy in our experiments. However, this would make generalization worse due to the bias the model would develop towards training datasets. Such effects are well-known in machine learning.
On the contrary, the absence of trainable parameters makes our approach dataset-agnostic. Our results on Market1501 in Table 4 are obtained using the same model as in case of CUHK03 results in Table 5. Therefore, this can be considered analogous to transfer learning experiments in context of neural networks. Therefore, our 62.9% Market-CUHK rank-1 “transfer” accuracy is significant when compared to 50.1% DukeMTMC-Market transfer in [19], as shown in Table 6. We also achieve mAP which is comparable or even higher than the transfer learning mAP of APNet-C. It should also be noted that DukeMTMC dataset is less challenging than CUHK03 [59], [60], [63]. Therefore, the proposed method is very promising from the perspective of the development of highly generalizable models. This also suggests that when accuracy improvements are achieved on one dataset it is likely to improve the accuracy on other datasets, too. Such behavior, whereas desirable, is not guaranteed for DL models. In contrast with the current trends towards end-to-end DL models, this paper indicates significant potential in combining machine learning (human parsing) with human intelligence (analytical features) to obtain more flexible systems that are more robust in Open-World scenarios while being easier for human interpretation and understanding.
| Experiment | Market | Duke | CUHK | Market-X | X-Market | |||||
| Metric | R1 | mAP | R1 | mAP | R1 | mAP | R1 | mAP | R1 | mAP |
| APNet-C [19] | 96.2 | 90.5 | 90.4 | 81.5 | 87.4 | 85.3 | 37.7 | 22.8 | 50.9 | 23.7 |
| Ours (cq) | 93.5 | 25.3 | - | - | 63.9 | 22.1 | 63.9 | 22.1 | 93.5 | 25.3 |
-
•
*X is DukeMTMC for APNet-C, and CUHK03 in our experiments
5 Conclusions
This paper proposes a re-ID system that combines analytical feature extraction and similarity ranking scheme with human parsing. It shows that parsing class masks provide sufficient information to overcome known limitations of analytical re-ID methods. Two types of features, namely Lab color and LBP texture features, are utilized and several original pre-processing techniques are proposed. These features are combined with class similarity evaluation scheme used to obtain a similarity ranking comparable with conventional rank-r evaluation metric. The obtained results show rank-1 accuracy comparable with supervised DL models and exceed that of unsupervised ones on Market1501 and CUHK03 datasets. The reasons for reduced mAP accuracy are discussed and potential solution in adding new feature channels is proposed. It is shown that by having no trainable parameters the proposed model has significant generalization potential as illustrated by 93.5% and 63.9% rank-1 “transfer” accuracies which significantly exceed that of conventional DL models. Future work will explore additional features to improve accuracy along with parser size minimization to realize the proposed system as an edge computing application.
Acknowledgement
The author would like to thank his Kryptonite colleagues Dr Anton Raskovalov and Dr Igor Netay for fruitful discussions and Vasilii Dolmatov for his assistance in problem formulation, choice of methodology, and supervision.
References
[1] L. Zheng, Y. Yang, and A. G. Hauptmann, “Person Re-identification: Past, Present and Future,” vol. 14, no. 8, pp. 1–20, 2016, [Online]. Available: http://arxiv.org/abs/1610.02984.
[2] R. Iguernaissi, D. Merad, K. Aziz, and P. Drap, “People tracking in multi-camera systems: a review,” Multimed. Tools Appl., vol. 78, no. 8, pp. 10773–10793, 2019, doi: 10.1007/s11042-018-6638-5.
[3] E. Kodirov, T. Xiang, Z. Fu, and S. Gong, “Person Re-identification by Unsupervised Graph Learning,” in Proc. ECCV, 2016, pp. 178–195.
[4] D. Chen, D. Xu, H. Li, N. Sebe, and X. Wang, “Group Consistent Similarity Learning via Deep CRF for Person Re-Identification,” in Proc. IEEE/CVF Conference on Computer Vision and Pattern Recognition, 2018, pp. 8649–8658, doi: 10.1109/CVPR.2018.00902.
[5] Y. Wu, O. E. F. Bourahla, X. Li, F. Wu, Q. Tian, and X. Zhou, “Adaptive Graph Representation Learning for Video Person Re-Identification,” IEEE Trans. Image Process., vol. 29, pp. 8821–8830, 2020, doi: 10.1109/TIP.2020.3001693.
[6] M. Ye, L. Zheng, J. Li, and P. C. Yuen, “Dynamic Label Graph Matching for Unsupervised Video Re-Identification,” in Proc. ICCV, 2017, doi: 10.1109/ICCV.2017.550.
[7] M. Ye, J. Shen, G. Lin, T. Xiang, L. Shao, and S. C. H. Hoi, “Deep Learning for Person Re-identification: A Survey and Outlook,” IEEE Trans. Pattern Anal. Mach. Intell., vol. 44, no. 6, 2021, doi: 10.1109/TPAMI.2021.3054775.
[8] B. Lavi, M. F. Serj, and I. Ullah, “Survey on Deep Learning Techniques for Person Re-Identification Task,” 2018, [Online]. Available: https://arxiv.org/abs/1807.05284.
[9] D. Chicco, “Siamese Neural Networks: An Overview,” Methods Mol. Biol., vol. 2190, pp. 73–94, 2021, doi: 10.1007/978-1-0716-0826-5_3.
[10] L. Wu, C. Shen, and A. Van Den Hengel, “PersonNet : Person Re-identification with Deep Convolutional Neural Networks,” pp. 1–7, 2016, [Online]. Available: https://arxiv.org/abs/1601.07255.
[11] H. Luo, Y. Gu, X. Liao, S. Lai, and W. Jiang, “Bag of Tricks and A Strong Baseline for Deep Person Re-identification,” in Proc. CVPRW, 2019, pp. 4320–4329, doi: 10.1109/CVPRW.2019.00190.
[12] Z. Zhu et al., “Viewpoint-aware loss with angular regularization for person re-identification,” in Proc. 34th AAAI Conf. Artif. Intell., pp. 13114–13121, 2020, doi: 10.1609/aaai.v34i07.7014.
[13] A. Schumann and R. Stiefelhagen, “Person Re-Identification by Deep Learning Attribute-Complementary Information,” in Proc. CVPR, 2017, pp. 20–28, doi: 10.1109/CVPRW.2017.186.
[14] P. Re-identification, Y. Shen, H. Li, S. Yi, D. Chen, and X. Wang, “Person Re-identification with Deep Similarity-Guided Graph Neural Network,” in Proc. ECCV, 2018, pp. 1–20.
[15] X. Lan, X. Zhu, and S. Gong, “Universal Person Re-Identification,” 2019, [Online]. Available: http://arxiv.org/abs/1907.09511.
[16] Z. Zeng, Z. Wang, Z. Wang, Y. Zheng, Y. Y. Chuang, and S. Satoh, “Illumination-Adaptive Person Re-Identification,” IEEE Trans. Multimed., vol. 22, no. 12, pp. 3064–3074, 2020, doi: 10.1109/TMM.2020.2969782.
[17] F. Xiong, M. Gou, O. Camps, and M. Sznaier, “Person re-identification using kernel-based metric learning methods,” Lect. Notes Comput. Sci., vol. 8695, no. 7, pp. 1–16, 2014, doi: 10.1007/978-3-319-10584-0_1.
[18] W. Zheng, S. Gong, and T. Xiang, “Towards Open-World Person Re-Identification by One-Shot Group-based Verification,” IEEE Trans. Pattern Anal. Mach. Intell., vol. 38, no. 3, pp. 591–606, 2016, doi: 10.1109/TPAMI.2015.2453984.
[19] G. Chen, T. Gu, J. Lu, J. A. Bao, and J. Zhou, “Person Re-Identification via Attention Pyramid,” IEEE Trans. Image Process., vol. 30, pp. 7663–7676, 2021, doi: 10.1109/TIP.2021.3107211.
[20] F. M. Khan and F. Bremond, “Person Re-identification for Real-world Surveillance Systems,” 2016, [Online]. Available: http://arxiv.org/abs/1607.05975.
[21] D. Gray and H. Tao, “Viewpoint Invariant Pedestrian Recognition with an Ensemble of Localized Features,” in Proc. ECCV, pp. 262–275, 2008.
[22] T. B. Sebastian, P. H. Tu, J. Rittscher, and R. Hartley, “Person Reidentification Using Spatiotemporal Appearance,” in Proc. CVPR, 2006, pp. 1528–1535, doi: 10.1109/CVPR.2006.223.
[23] L. Nanni, M. Munaro, S. Ghidoni, E. Menegatti, and S. Brahnam, “Ensemble of different approaches for a reliable person re-identification system,” Appl. Comput. Informatics, vol. 12, no. 2, pp. 142–153, 2016, doi: https://doi.org/10.1016/j.aci.2015.02.002.
[24] W. S. Zheng, S. Gong, and T. Xiang, “Person re-identification by probabilistic relative distance comparison,” Proc. CVPR, pp. 649–656, 2011, doi: 10.1109/CVPR.2011.5995598.
[25] M. M. Kalayeh, E. Basaran, M. E. Kamasak, and M. Shah, “Human Semantic Parsing for Person Re-identification,” in Proc. CVPR, 2018, pp. 1062–1071.
[26] H. Park and B. Ham, “Relation Network for Person Re-identification,” in Proc. 34th AAAI Conference on Artificial Intelligence, pp. 11839–11847, 2020.
[27] R. Quan, X. Dong, Y. Wu, L. Zhu, and Y. Yang, “Auto-ReID: Searching for a Part-Aware ConvNet for Person Re-Identification,” in Proc. ICCV, pp. 3750–3759, 2019.
[28] L. Zheng, L. Shen, L. Tian, S. Wang, J. Wang, and Q. Tian, “Scalable Person Re-identification : A Benchmark,” Proc. ICCV, pp. 1116–1124, 2015.
[29] Y. Fu et al., “Horizontal pyramid matching for person re-identification,” in Proc. 33rd AAAI Conf. Artif. Intell., pp. 8295–8302, 2019, doi: 10.1609/aaai.v33i01.33018295.
[30] K. He, G. Gkioxari, P. Dollár, and R. Girshick, “Mask R-CNN,” IEEE Trans. Pattern Anal. Mach. Intell., vol. 42, no. 2, pp. 386–397, 2020, doi: 10.1109/TPAMI.2018.2844175.
[31] K. Gong, X. Liang, D. Zhang, X. Shen, and L. Lin, “Look into Person: Self-supervised Structure-sensitive Learning and a new benchmark for human parsing,” in Proc. CVPR, pp. 6757–6765, 2017, doi: 10.1109/CVPR.2017.715.
[32] J. Zhao, J. Li, Y. Cheng, T. Sim, S. Yan, and J. Feng, “Understanding humans in crowded scenes: Deep nested adversarial learning and a new benchmark for multi-human parsing,” in Proc. ACM Multimed. Conf., pp. 792–800, 2018, doi: 10.1145/3240508.3240509.
[33] C. Su, J. Li, S. Zhang, J. Xing, W. Gao, and Q. Tian, “Pose-Driven Deep Convolutional Model for Person Re-identification,” in Proc. ICCV, pp. 3980–3989, 2017, doi: 10.1109/ICCV.2017.427.
[34] P. Li, Y. Xu, Y. Wei, and Y. Yang, “Self-Correction for Human Parsing,” IEEE Trans. Pattern Anal. Mach. Intell., vol. 44, no. 6, pp. 3260–3271, 2020, doi: 10.1109/TPAMI.2020.3048039.
[35] U. Park, A. K. Jain, I. Kitahara, K. Kogure, and N. Hagita, “ViSE: Visual search engine using multiple networked cameras,” in Proc. ICPR, pp. 1204–1207, 2006, doi: 10.1109/ICPR.2006.1176.
[36] G. Wyszecki and W. S. Stiles, Color Science: Concepts and Methods, Quantitative Data and Formulae, 2nd Editio. Wiley, 2000.
[37] Y. Rubner, C. Tomasi, and L. J. Guibas, “The Earth Mover’s Distance as a Metric for Image Retrieval,” in Proc. IJCV, pp. 1–20, 2000.
[38] T. Chavdarova et al., “WILDTRACK: A Multi-camera HD Dataset for Dense Unscripted Pedestrian Detection,” in Proc. CVPR, pp. 5030–5039, 2018, doi: 10.1109/CVPR.2018.00528.
[39] S. H. Cha and S. N. Srihari, “On measuring the distance between histograms,” Pattern Recognit., vol. 35, no. 6, pp. 1355–1370, 2002, doi: 10.1016/S0031-3203(01)00118-2.
[40] M. F. Demirci, A. Shokoufandeh, and S. J. Dickinson, “Skeletal shape abstraction from examples,” IEEE Trans. Pattern Anal. Mach. Intell., vol. 31, no. 5, pp. 944–952, 2009, doi: 10.1109/TPAMI.2008.267.
[41] X. Shu and X. J. Wu, “A novel contour descriptor for 2D shape matching and its application to image retrieval,” Image Vis. Comput., vol. 29, no. 4, pp. 286–294, 2011, doi: 10.1016/j.imavis.2010.11.001.
[42] S. Thewsuwan and K. Horio, “Texture-Based Features for Clothing Classification via Graph-Based Representation,” J. signal process., vol. 22, no. 6, pp. 299–305, 2018.
[43] W. Zhou, A. Ahrary, and S. I. Kamata, “Fase description with local patterns: An application to face recognition,” IEEE Trans. Pattern Anal. Mach. Intell., vol. 28, no. 12, pp. 2037–2041, 2006, doi: 10.1109/TPAMI.2006.244.
[44] O. Barkan, J. Weill, L. Wolf, and H. Aronowitz, “Fast high dimensional vector multiplication face recognition,” in Proc. ICCV, pp. 1960–1967, 2013, doi: 10.1109/ICCV.2013.246.
[45] B. H. Shekar and B. Pilar, “Shape representation and classification through pattern spectrum and local binary pattern - A decision level fusion approach,” in Proc. ICSIP, pp. 218–224, 2014, doi: 10.1109/ICSIP.2014.41.
[46] T. X. and X. W. W. Li, R. Zhao, “DeepReID: Deep Filter Pairing Neural Network for Person Re-identification,” in Proc. CVPR, pp. 152–159, 2014, doi: 10.1109/CVPR.2014.27.
[47] Z. Zhong, L. Zheng, D. Cao, and S. Li, “Re-ranking person re-identification with k-reciprocal encoding,” in Proc. CVPR, pp. 3652–3661, 2017, doi: 10.1109/CVPR.2017.389.
[48] R. Quispe and H. Pedrini, “Top-dB-net: Top dropblock for activation enhancement in person re-identification,” in Proc. ICPR, pp. 2980–2987, 2020, doi: 10.1109/ICPR48806.2021.9412017.
[49] H. X. Yu, W. S. Zheng, A. Wu, X. Guo, S. Gong, and J. H. Lai, “Unsupervised person re-identification by soft multilabel learning,” in Proc. CVPR, pp. 2143–2152, 2019, doi: 10.1109/CVPR.2019.00225.
[50] Z. Zheng, L. Zheng, and Y. Yang, “A discriminatively learned CNN embedding for person reidentification,” ACM Trans. Multimed. Comput. Commun. Appl., vol. 14, no. 1, pp. 1–10, 2017, doi: 10.1145/3159171.
[51] D. Li, X. Chen, Z. Zhang, and K. Huang, “Learning deep context-aware features over body and latent parts for person re-identification,” in Proc. CVPR, pp. 7398–7407, 2017, doi: 10.1109/CVPR.2017.782.
[52] M. Wang, B. Lai, J. Huang, X. Gong, and X.-S. Hua, “Camera-aware Proxies for Unsupervised Person Re-Identification,” 2021, [Online]. Available: http://arxiv.org/abs/2012.10674.
[53] R. Quispe and H. Pedrini, “Improved person re-identification based on saliency and semantic parsing with deep neural network models,” Image Vis. Comput., vol. 92, 2019, doi: 10.1016/j.imavis.2019.07.009.
[54] F. Zheng et al., “Pyramidal person re-identification via multi-loss dynamic training,” in Proc. CVPR, pp. 8506–8514, 2019, doi: 10.1109/CVPR.2019.00871.
[55] M. Wieczorek, B. Rychalska, and J. Dabrowski, “On the Unreasonable Effectiveness of Centroids in Image Retrieval,” in Proc. ICONIP, pp. 212–223, 2021, doi: 10.1007/978-3-030-92273-3_18.
[56] W. Li, X. Zhu, and S. Gong, “Harmonious Attention Network for Person Re-identification,” in Proc. CVPR, pp. 2285–2294, 2018, doi: 10.1109/CVPR.2018.00243.
[57] Y. Wang et al., “Resource Aware Person Re-identification Across Multiple Resolutions,” in Proc. CVPR, pp. 8042–8051, 2018, doi: 10.1109/CVPR.2018.00839.
[58] K. Zhou, Y. Yang, A. Cavallaro, and T. Xiang, “Omni-scale feature learning for person re-identification,” in Proc. ICCV, pp. 3701–3711, 2019, doi: 10.1109/ICCV.2019.00380.
[59] C. Ding, K. Wang, P. Wang, and D. Tao, “Multi-Task Learning with Coarse Priors for Robust Part-Aware Person Re-Identification,” IEEE Trans. Pattern Anal. Mach. Intell., vol. 44, no. 3, pp. 1474–1488, 2022, doi: 10.1109/TPAMI.2020.3024900.
[60] A. Benzine, M. E. A. Seddik, and J. Desmarais, “Deep Miner: A Deep and Multi-branch Network which Mines Rich and Diverse Features for Person Re-identification,” 2021, [Online]. Available: http://arxiv.org/abs/2102.09321.
[61] F. Herzog, X. Ji, T. Teepe, S. Hörmann, J. Gilg, and G. Rigoll, “Lightweight Multi-Branch Network for Person Re-Identification,” in Proc. ICIP, pp. 1129–1133, 2021, doi: 10.1109/ICIP42928.2021.9506733.
[62] Y. Jiang, S. Yang, H. Qiu, W. Wu, C. C. Loy, and Z. Liu, “Text2Human: Text-Driven Controllable Human Image Generation,” ACM Trans. Graph., vol. 41, no. 4, 2022, doi: 10.1145/3528223.3530104.
[63] Y. Wang, L. Li, J. Yang, and J. Dang, “Person re-identification based on attention mechanism and adaptive weighting,” Dyna, vol. 96, no. 2, pp. 186–193, 2021, doi: 10.6036/9981.