Humans disagree with the IoU for measuring object detector localization error
Abstract
The localization quality of automatic object detectors is typically evaluated by the Intersection over Union (IoU) score. In this work, we show that humans have a different view on localization quality. To evaluate this, we conduct a survey with more than 70 participants. Results show that for localization errors with the exact same IoU score, humans might not consider that these errors are equal, and express a preference. Our work is the first to evaluate IoU with humans and makes it clear that relying on IoU scores alone to evaluate localization errors might not be sufficient.
Index Terms— object detection, IoU, human preference
1 Introduction
 |
The main difference between image classification and object detection is that an object detector also has to predict the object’s location, typically indicated by a bounding box around the object. Object location can be used as a first step for a downstream task, e.g., instance segmentation [1], or human pose estimation [2]. Alternatively, in this paper, we focus on the setting where an object detection is presented to humans as an end result, where examples include visual inspection [3], or focusing attention in medical images [4]. We do not evaluate the object detector itself [5]. Instead, we evaluate if the predicted object location by object detectors aligns with what humans consider a detected object.
Evaluating object detectors. Object detectors are commonly evaluated [5, 6, 7, 8, 9] with mean average precision (mAP): the mean of the per-class average precision scores. Average precision is the area under the precision-recall curve, created by ranking all detections by confidence and then checking if they are correct according to the ground truth. The detection is correct if (1) the assigned class label is correct and (2) the detection location has sufficient overlap with the ground truth. The Intersection over Union (IoU) score is used to determine the overlap. The location of a detection is correct if the IoU score is higher than a threshold, typically 0.5 or higher [10, 6]. In this paper, to the best of our knowledge, we are the first to investigate how well the IoU measure aligns with human localization quality judgments.
Human annotation for object detection. Extensive crowdsourcing studies are performed to draw bounding boxes around objects in images [11, 12] or the precise shape of the object [13, 14]. Experiments in which crowd workers validate object detections showed that annotators tend to be lenient when validating bounding boxes, i.e., bounding boxes with IoU 0.5 are still accepted [15]. Furthermore, analyses performed in [16] suggest that to efficiently and accurately localize all objects in an image, several crowdsourcing tasks are needed, such as verifying box correctness, verifying object presence, or naming the object. In this paper, we extend the work in [17, 18, 16] with four user studies investigating which bounding boxes humans accept and prefer.
Contributions. We make the following contributions: (1) We design four user studies to explore what kind of detections humans prefer and accept as good detections.111Data and analysis is available at https://github.com/ombretta/humans_vs_IoU. (2) We investigate the relationship between a too small bounding box and a too large bounding box, where they both have the same IoU score. (3) We analyze the impact of object symmetry and bounding box position in human preference and acceptance of detectors’ output. (4) We experiment with various object sizes (small, medium, large) and recommend future studies.
Our results show that humans disagree with IoU for measuring localization errors.
2 Experimental Approach
We perform four controlled experiments to evaluate the relation between IoU and human localization quality judgments and study which object detections are accepted or preferred by humans. We do not train or test any object detection models since they are highly influenced by many design choices, e.g., model parameters, dataset. Thus, our boxes are generated according to the ground truth. We relate our findings to machine-evaluated detections. For machine-evaluated detections, we use the common IoU, measuring the localization performance of the predicted box with the ground truth box , as .
We address two important features of object localization: (i) Box Size and (ii) Box Position, which are affected by the IoU score, in four online user studies (two studies per feature).222Ethical approval was not required - we do not collect personal identifiers. We also experiment with various object sizes (small - S, medium - M, large - L)333We adopt the definition of object size provided with the MS COCO dataset (https://cocodataset.org/#detection-eval). and IoU values (0.3, 0.5, 0.7, 0.9) to study differences and similarities between humans and detection algorithms.
Procedure and participants. All studies follow the same procedure. Participants are given an example to introduce the task. The task consists of a masked image to indicate which object is investigated, the question that directly specifies the object name, and the possible answers. The images are chosen from the MS COCO dataset [19]. We ran the studies using Qualtrics444https://www.qualtrics.com/. The user studies have been distributed among research group members and authors’ peers.
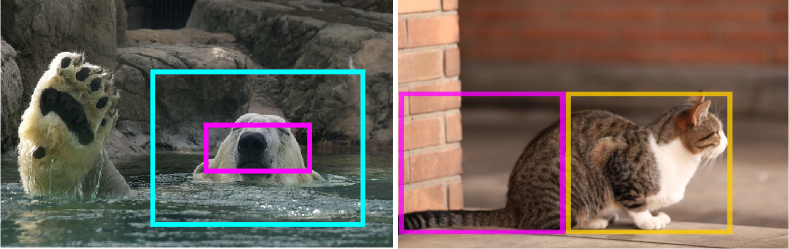
Box Size. As illustrated in Fig. 2, we use two different box sizes, small and large, with the same IoU score. The box aspect ratio and position is taken from the ground truth box. In the Size Preference study, we investigate the box size, and ask participants which box size they prefer for a detection. They can choose one option among: large box, small box or “the size of the box does not matter”. In the Size Acceptance study, we show either a small or a large box and ask participants if they accept or reject it as an object detection. For both studies we evaluate IoU values (0.3, 0.5, 0.7, 0.9) and include all object sizes (S, M, L). In the Size Preference study, we annotate 72 images, with six images per each combination between object size and IoU value. In the Size Acceptance study, we annotate 96 images (eight per combination).
 |
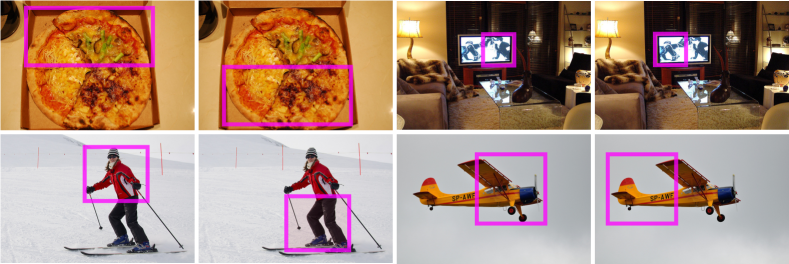 |
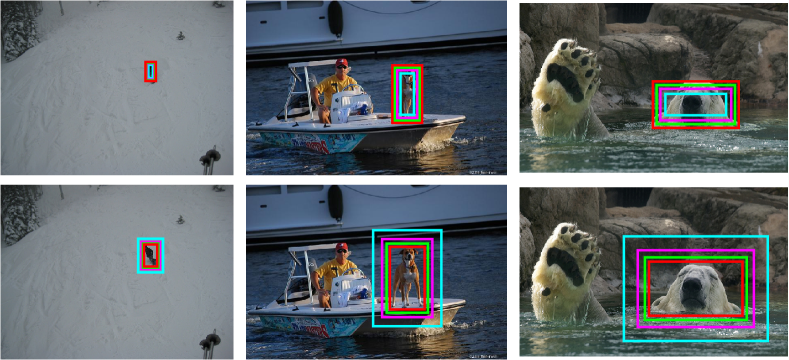
Box Position. As illustrated in Figure 3, we applied two positional shifts to the ground truth box, for symmetrical and asymmetrical objects, using a fixed IoU value of 0.5. Unlike the size experiment, the predicted box size is fixed and only the position of the box changes to evaluate the effect of the position. Depending on the orientation of the object, the predicted box is shifted horizontally (back, front) or vertically (top, bottom). Since symmetrical objects do not have front and back sides, we consider front as the right side and back as the left side of the object. Similarly to the size surveys, in the Position Preference study, we ask participants if they prefer a particular part or side of the object for detection. The Position Acceptance study investigates if users would accept the bounding box as a correct detection. In both position surveys, we use 20 images, which are equally distributed across object types (symmetrical, asymmetrical) and box positions (front/top, back/bottom), with 5 images per category.
3 Results
 |
| (a) Size Preference Study |
 |
| (b) Size Acceptance Study |
Analytical method. To study the human preference and acceptance of bounding box sizes and positions, we apply several statistical tests. We apply the Chi-square test [20] to find out if there are any associations between variables such as object size and preferred box size or IoU value and preferred box size. To understand whether differences in preference proportions (e.g., small boxes, large boxes, no preference), or acceptance proportions (e.g., front box, back box) are statistically significant, we apply the Z-test [21] and the Cochran’s Q test [22]. While the Z-test can only be applied to compare two proportions, the Cochran’s Q test can be applied on any number of proportions. In case of statistically significant differences, we apply a posthoc Dunn test with Bonferroni correction [23] to see which proportions are different. Since for each study we perform multiple comparisons and statistical tests, we use a lower significance threshold than 0.05 (by applying a Bonferroni correction), i.e., = .
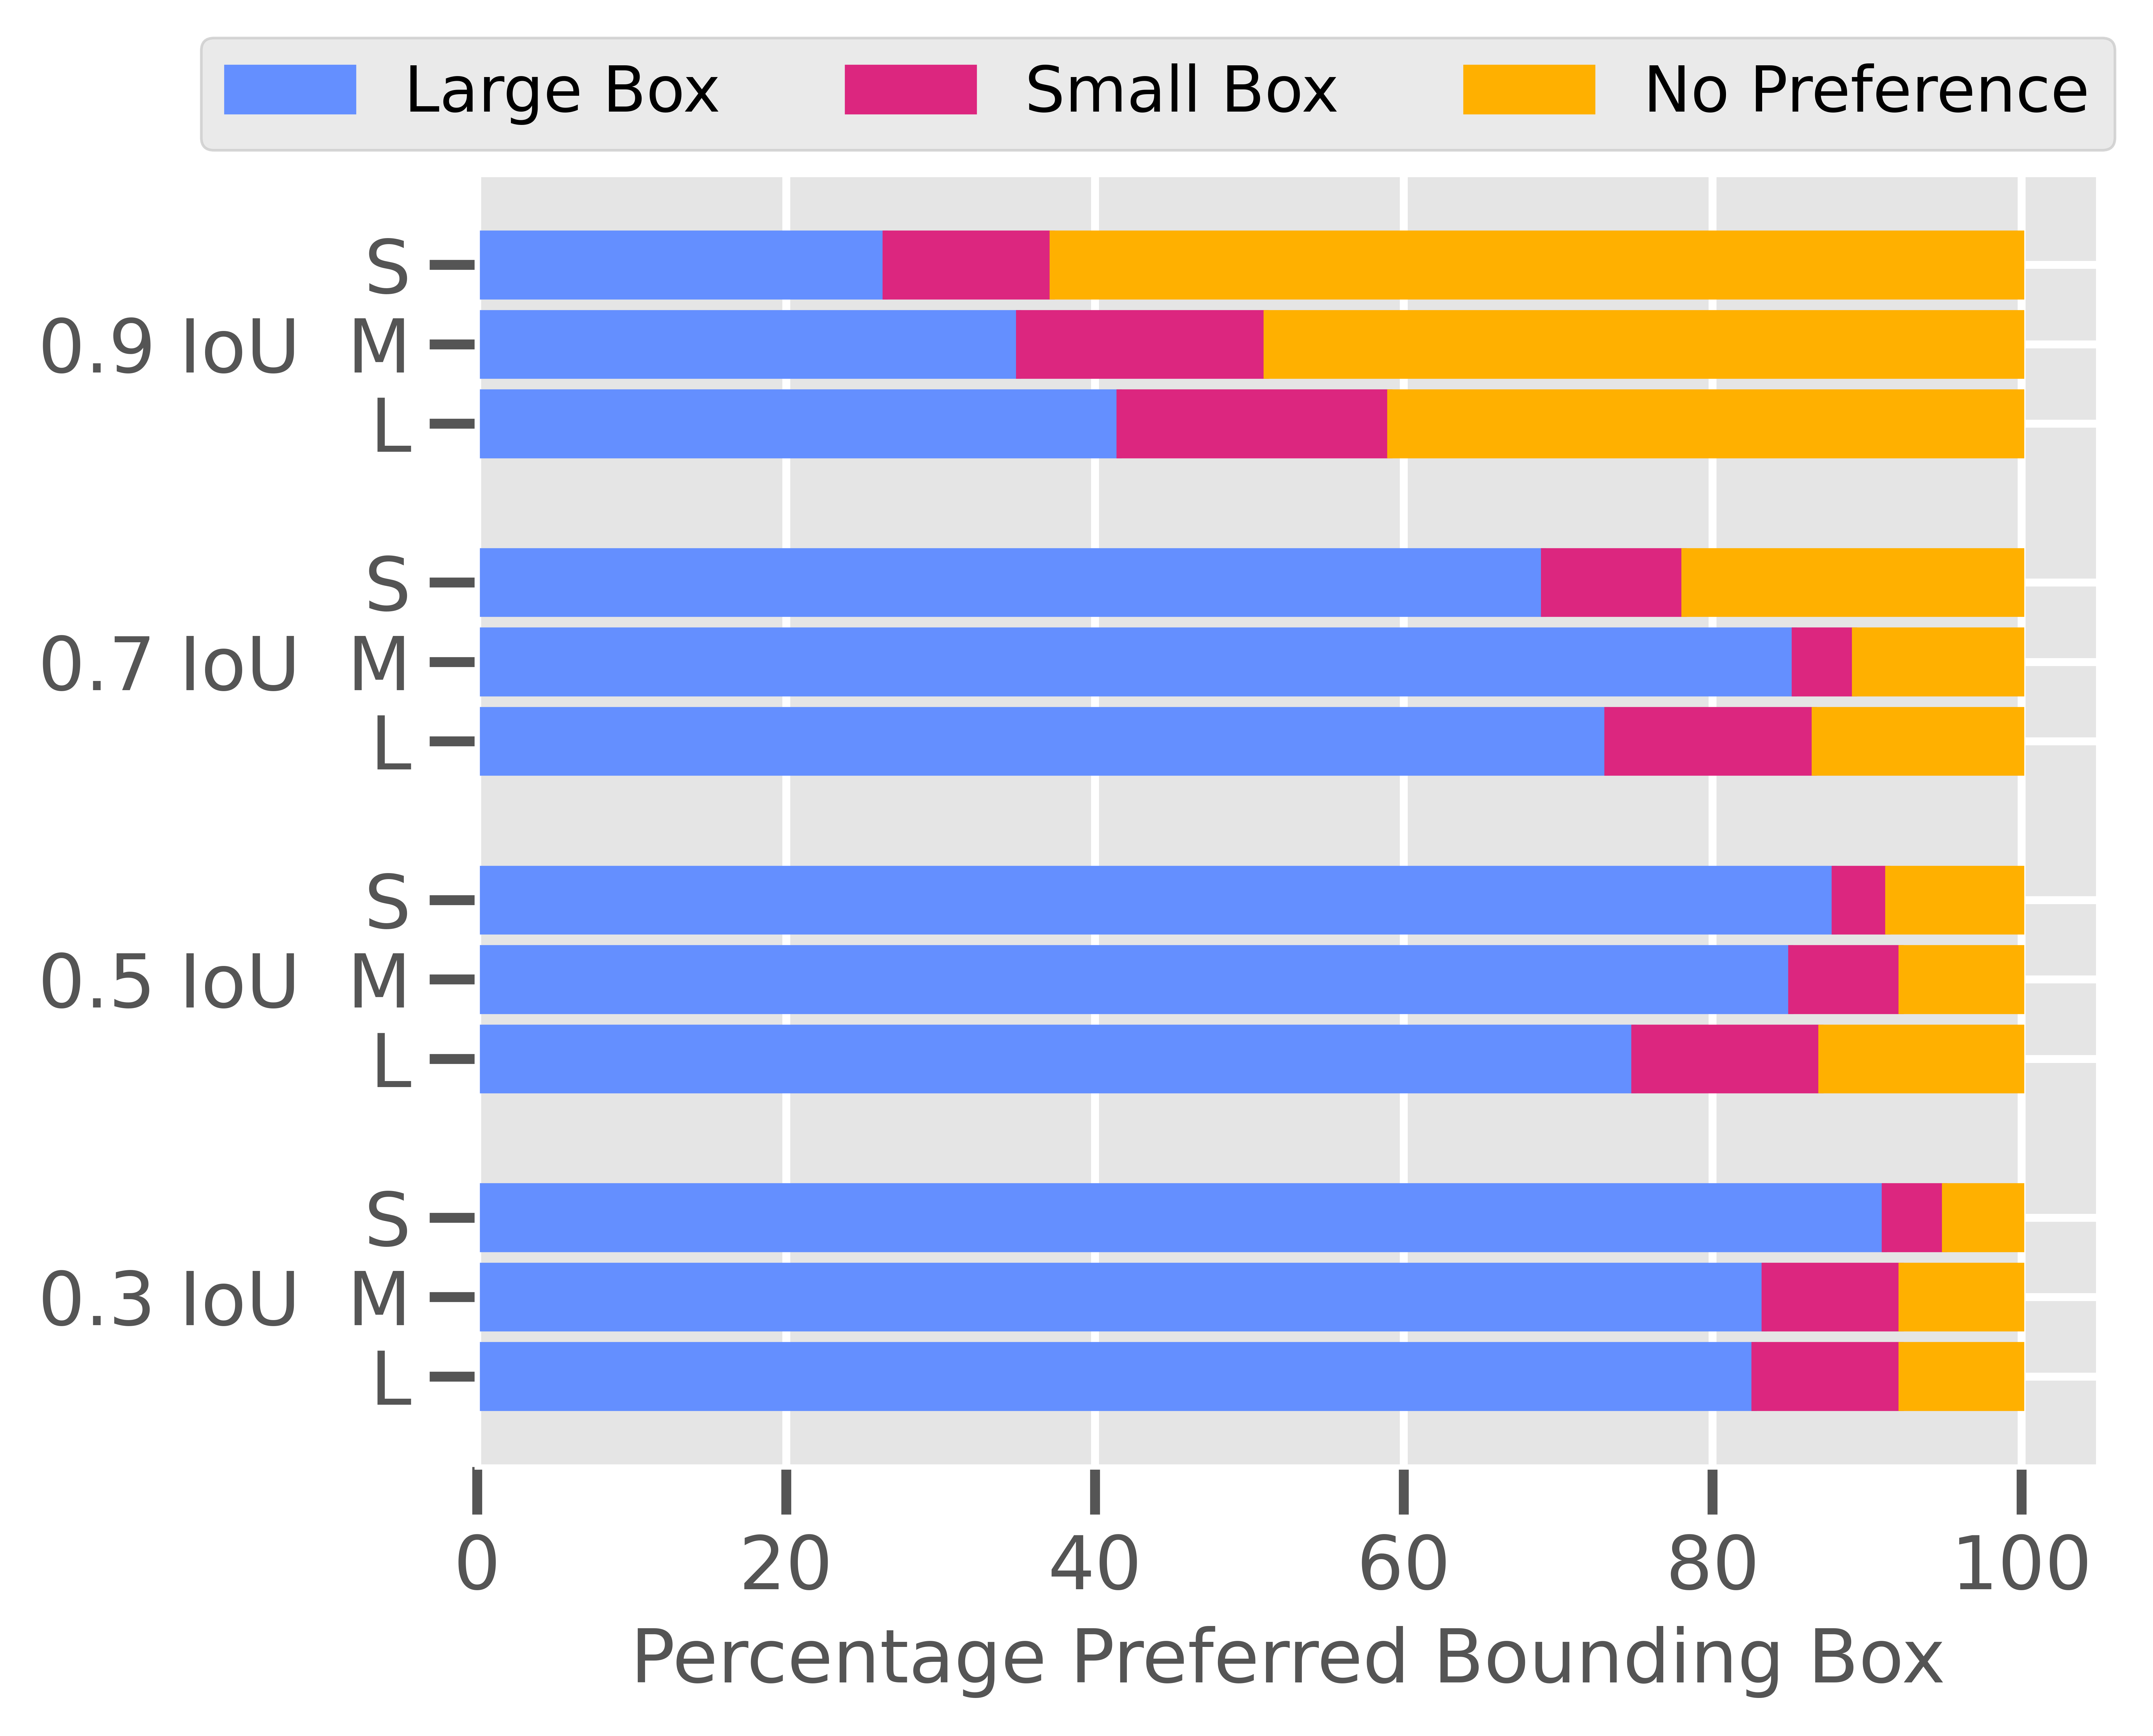
Size Preference. Figure 4(a) shows, per IoU and object size, the percentage of preferred bounding box sizes. For 0.9 IoU value, people have no size preference — for each object size, the option no preference is either the most chosen, or similarly chosen as large boxes. For IoU values of 0.9, posthoc Dunn tests with Bonferroni correction show that no preference is statistically preferred for small and medium objects, but not for large objects. The prevalence of no preference is sensible: for , the difference in appearance between small and large boxes is subtle to the human eye.
For all other evaluated IoU values, 0.7, 0.5, 0.3, and for all three evaluated object sizes, the Cochran’s Q test shows that there are statistically significant differences in the preference of boxes. Posthoc Dunn tests with Bonferroni correction indicate that large boxes are statistically significantly more preferred by humans. Small bounding boxes are always the least preferred while large bounding boxes are always the most preferred, irrespective of object size. We observe a gradual preference increase of small bounding boxes as the IoU value increases, and a comparatively higher increase in having no preference (see Figure 5(a)). Using a Chi-square test, we found an association between the IoU value and the preferred bounding box size ((2)=1227.84, ). We also notice a gradual decrease in the preference of small bounding boxes with the decrease of the object size. These results are shown in Figure 5(b). Using a Chi-square test, we found a statistically significant association between the object size and the size of the preferred bounding box ((2)=62.05, ).
 |
| (a) IoU Value vs. Bounding Box Size |
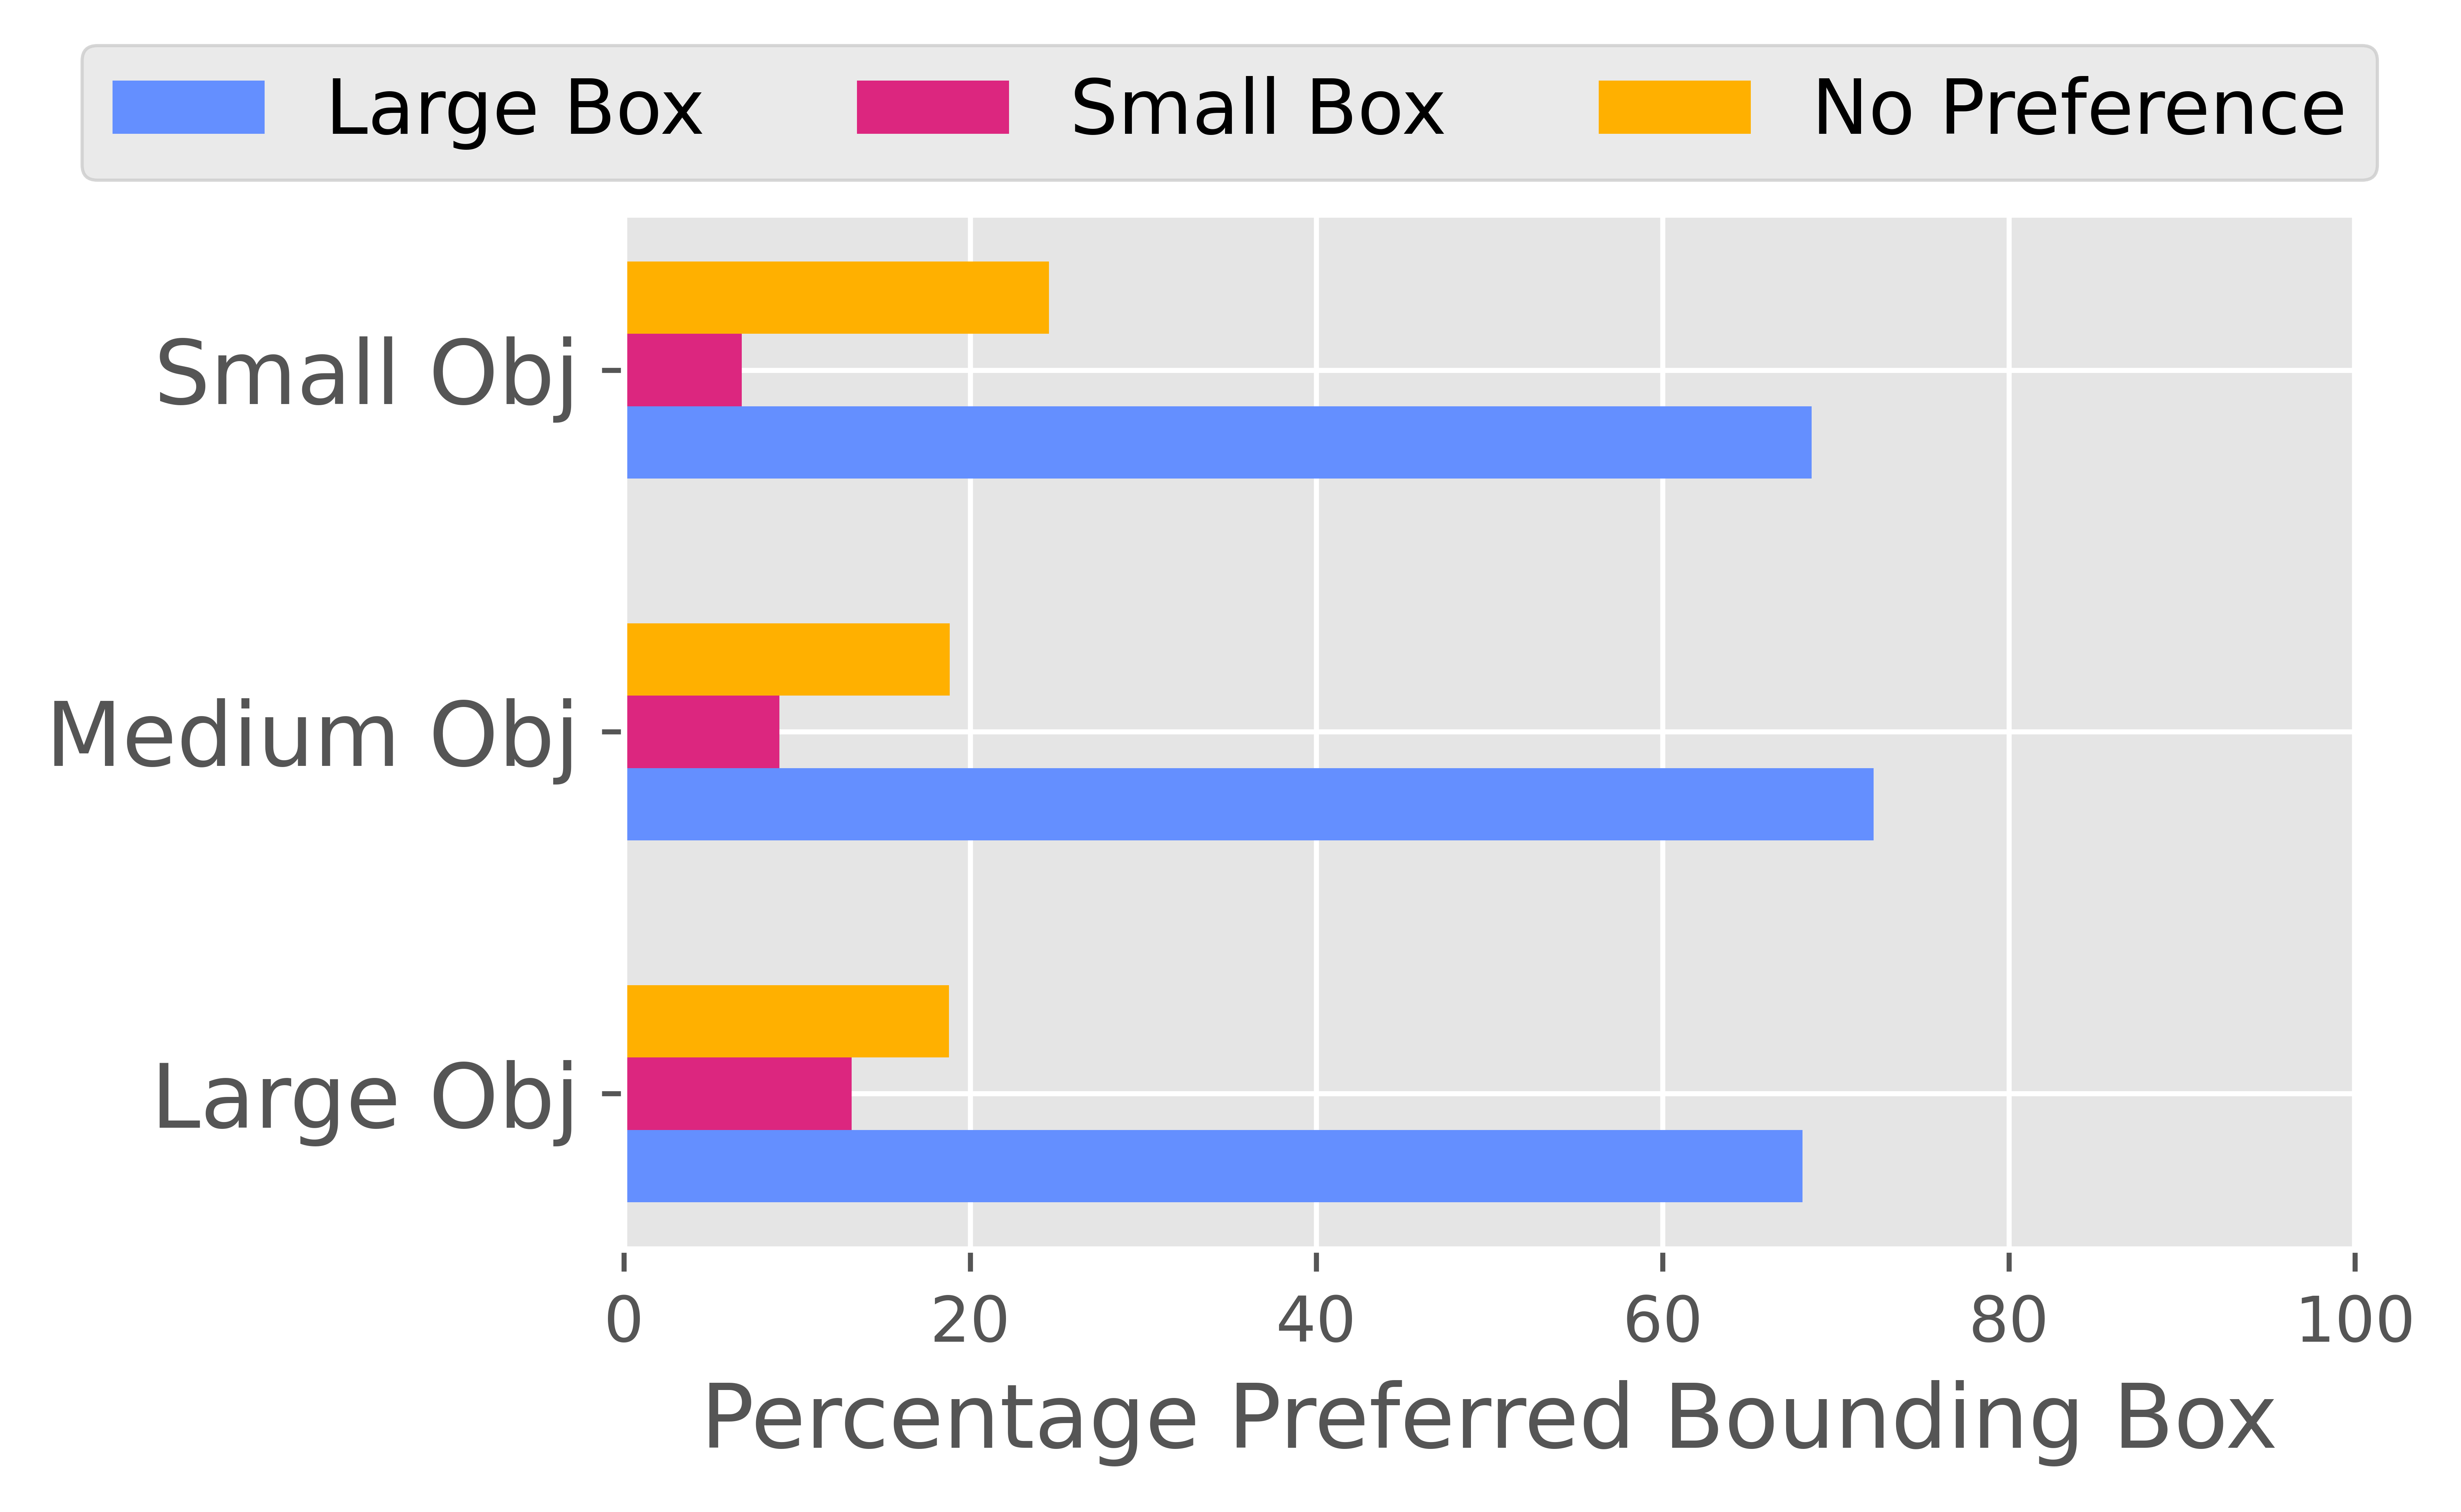 |
| (b) Object Size vs. Bounding Box Size |
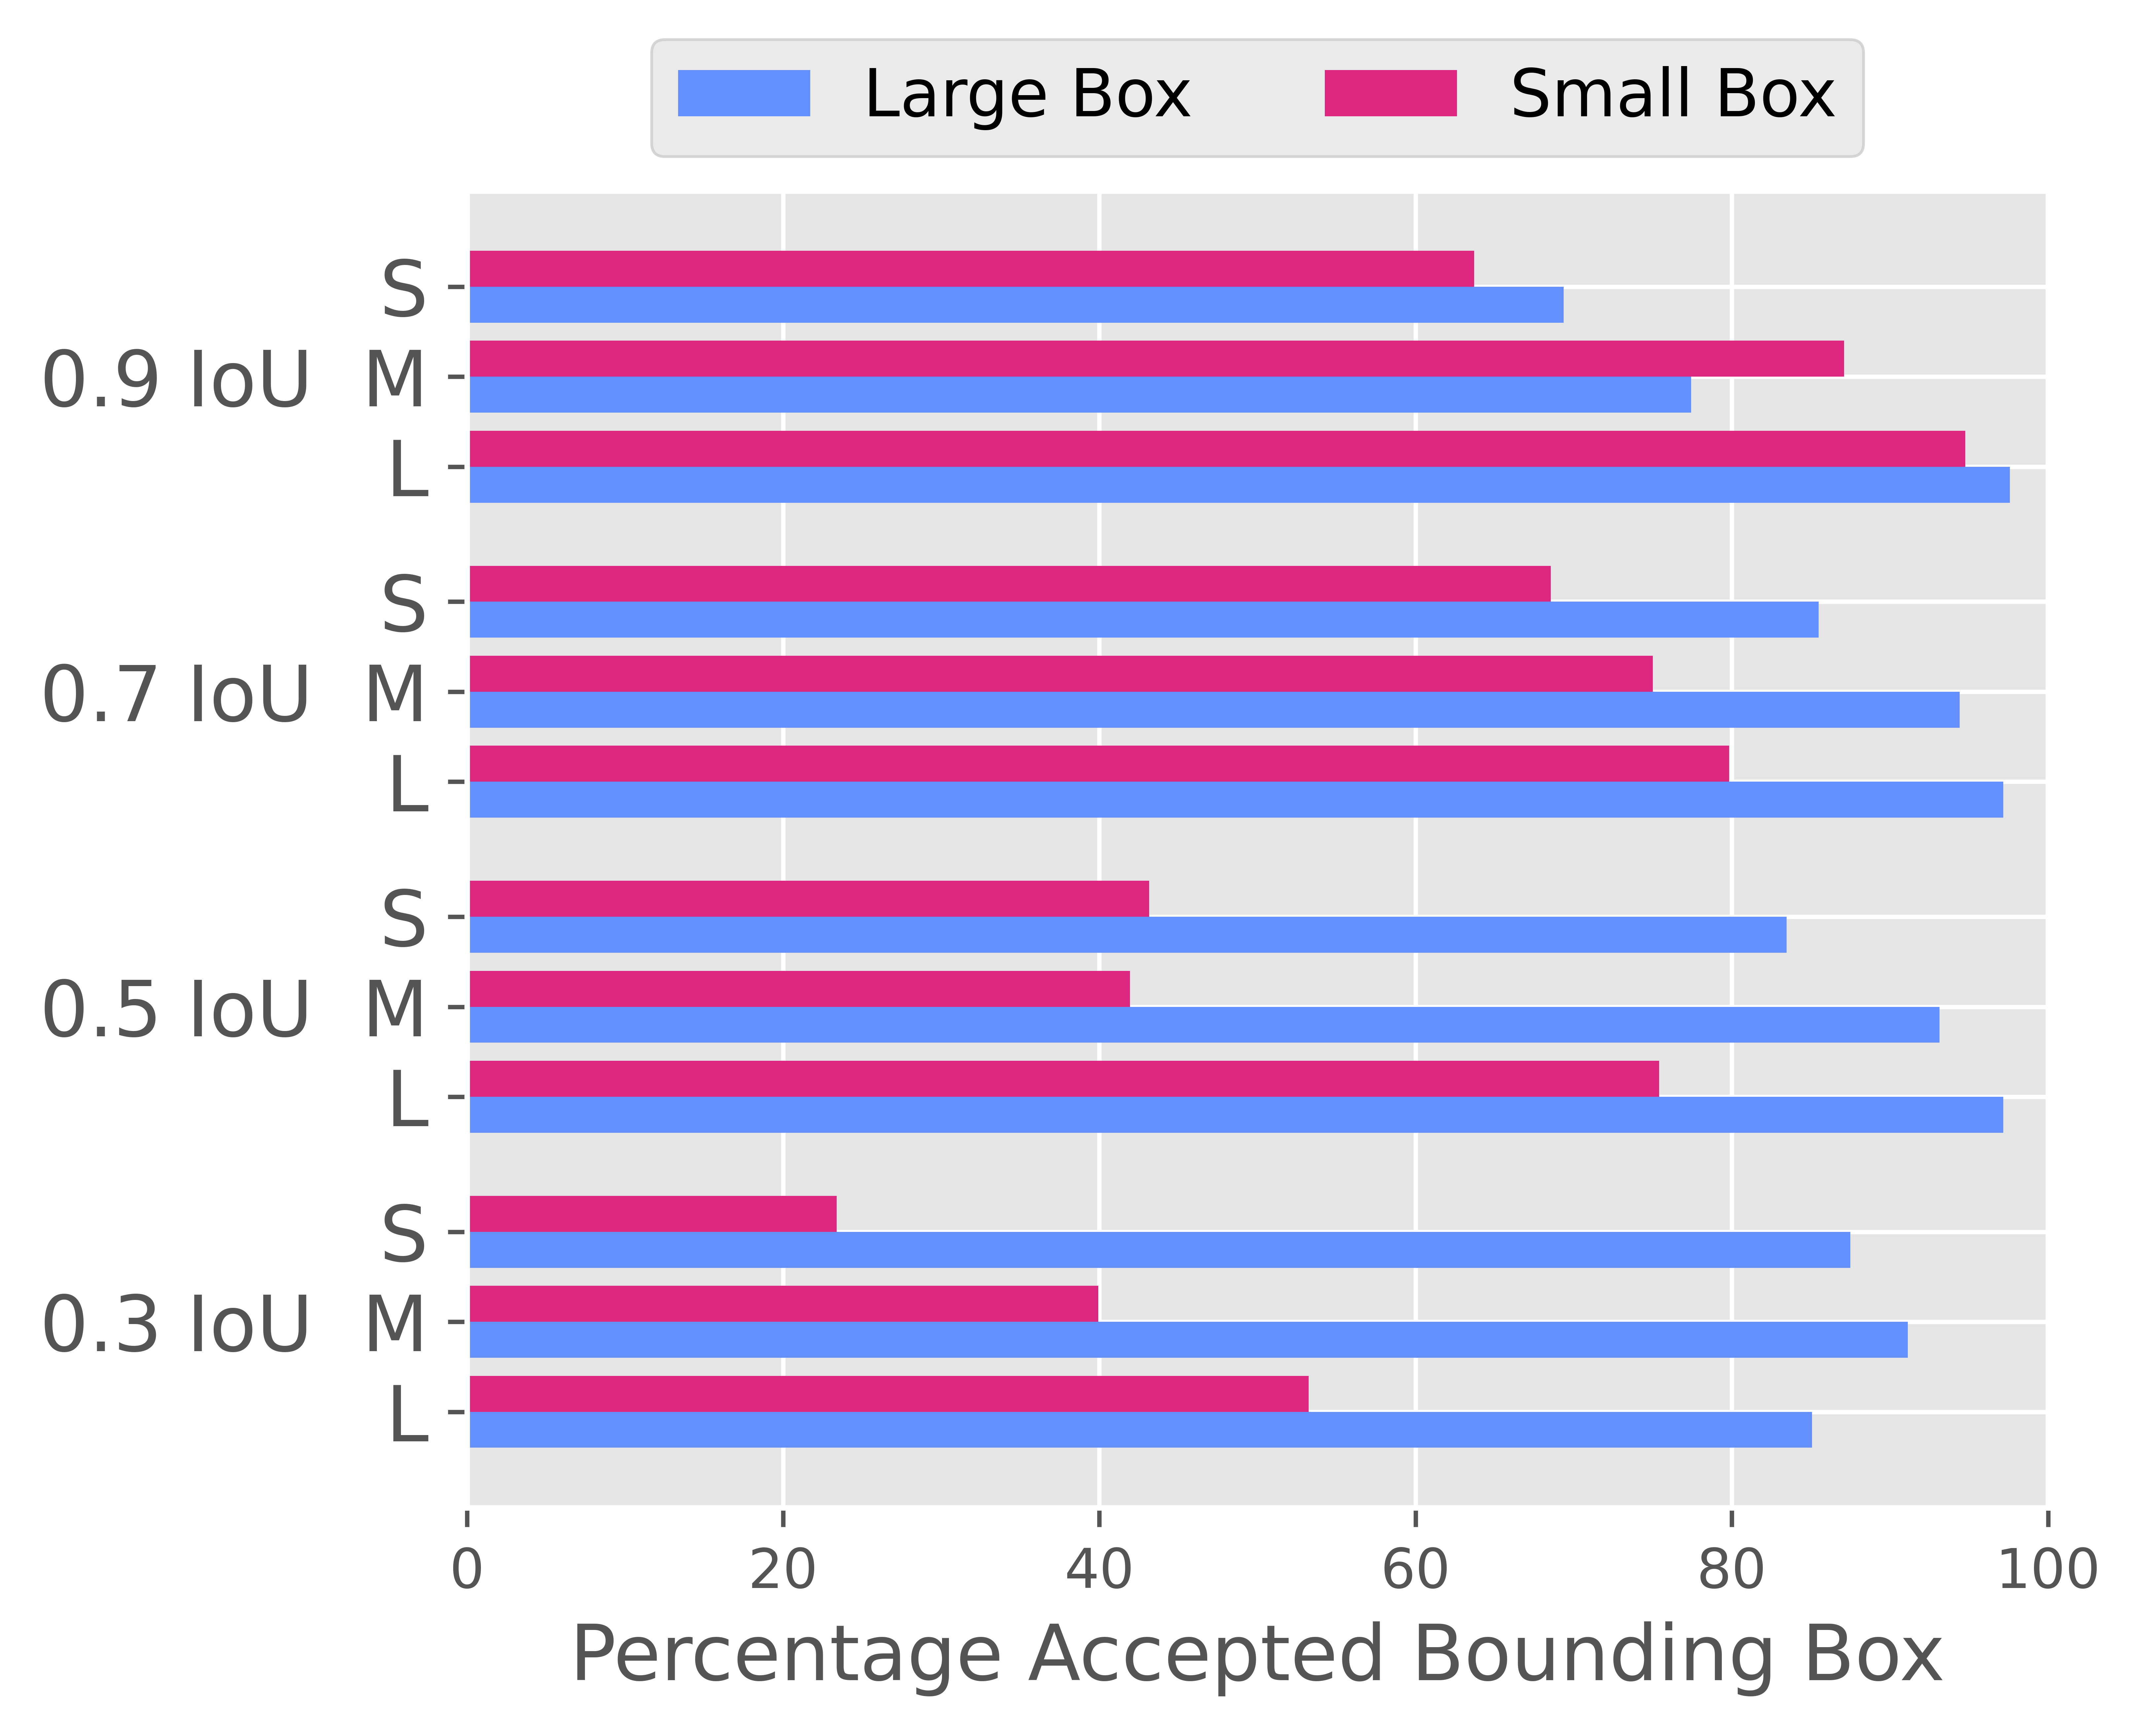
Size Acceptance. In Figure 4(b), we show the percentage of accepted small and large boxes, for each IoU value and image size. For each IoU value, the acceptance of small bounding boxes decreases with the decrease of object size, the smaller the object, the less accepted the small bounding boxes. Large bounding boxes are always more accepted than small bounding boxes, disregarding IoU values and object sizes. The exception are medium objects with 0.9 IoU, where small boxes are statistically significantly more accepted (z=-2.82, ). For the rest of the cases, large bounding boxes are statistically significantly more accepted than small bounding boxes for IoU values of 0.3, 0.5 and 0.7 and all object sizes (), but are not more accepted for neither small nor large objects with 0.9 IoU. We also found, c.f. Z-test, that (1) large bounding boxes are always statistically significantly accepted () and (2) small bounding boxes are only statistically significantly more accepted for 0.9 and 0.7 IoU (all object sizes) and large objects with 0.5 IoU.
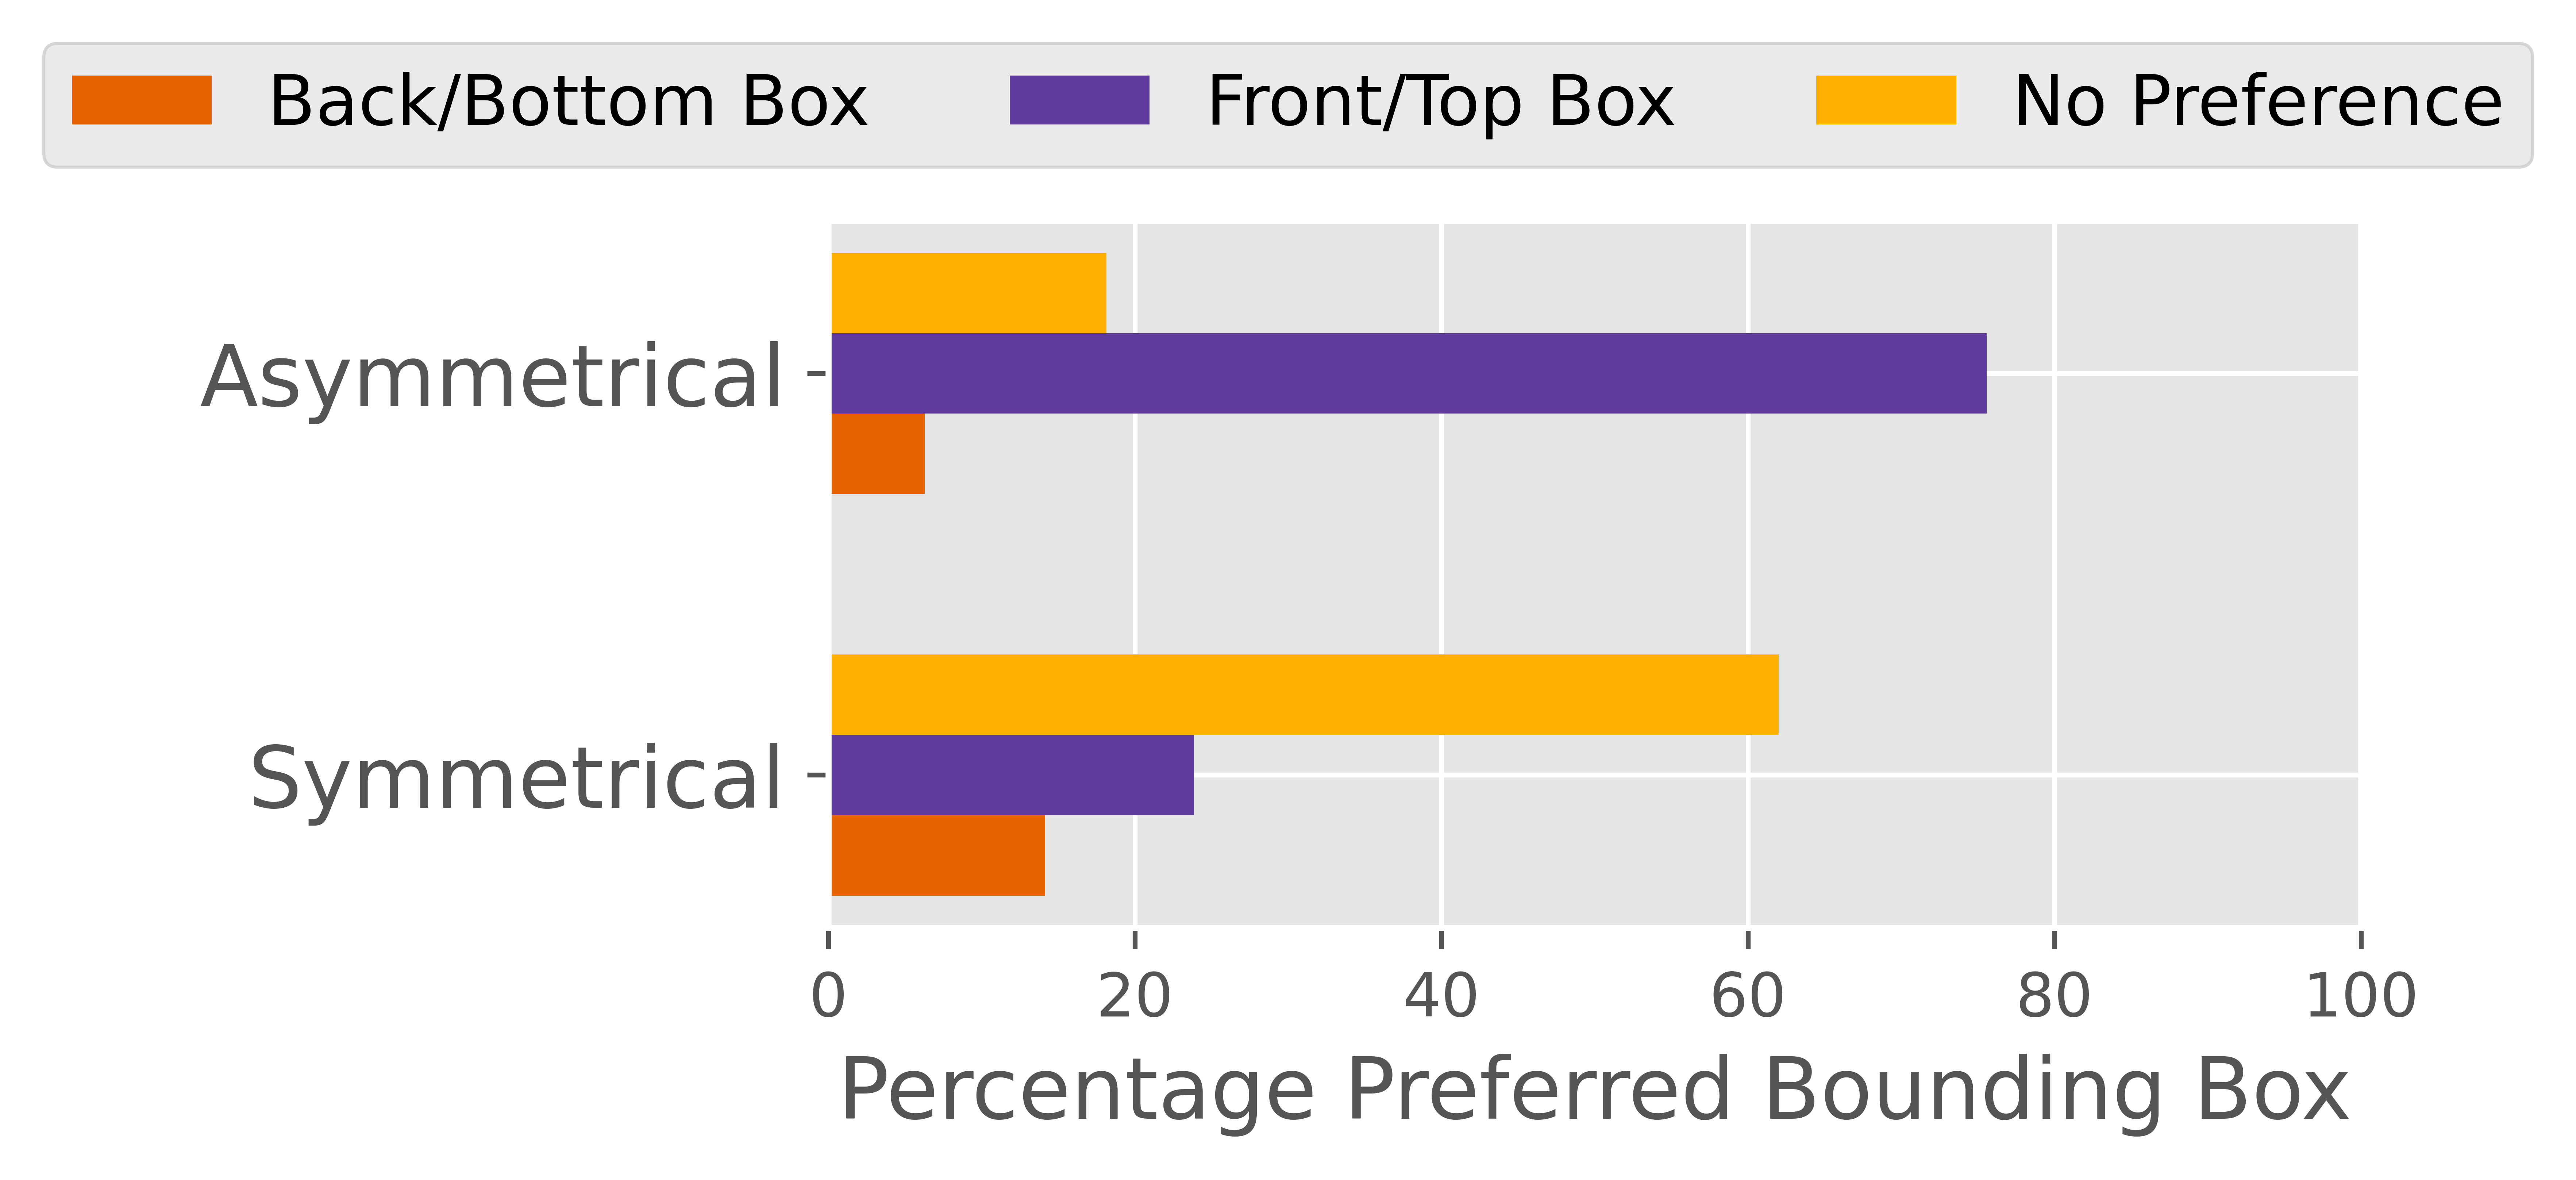
Position Preference. Figure 6(a) presents the results of the Position Preference user study. For symmetrical objects, participants have no preference regarding the position (front/top or back/bottom) of the bounding box, no preference being chosen the most. According to the Cochran’s Q test, we also find that there are statistically significant differences in proportions among the three options chosen by study participants ((2)=268.76, ). A pairwise posthoc Dunn test with Bonferroni correction indicates that there are statistically significant differences between the proportions in which no preference and front bounding boxes are preferred (), as well as between the proportions of no preference and back bounding boxes ().
 |
| (a) Preferred Box Position |
 |
| (b) Accepted Box Position |
For asymmetrical objects, however, the most preferred bounding box is positioned at the front of the object. The Cochran’s Q test shows that the difference in proportions among the three options is statistically significant ((2) = 576.74, ). Posthoc analysis using the Dunn test with Bonferroni correction shows that these differences are statistically significant between each two possible answers (front and no preference, front and back).
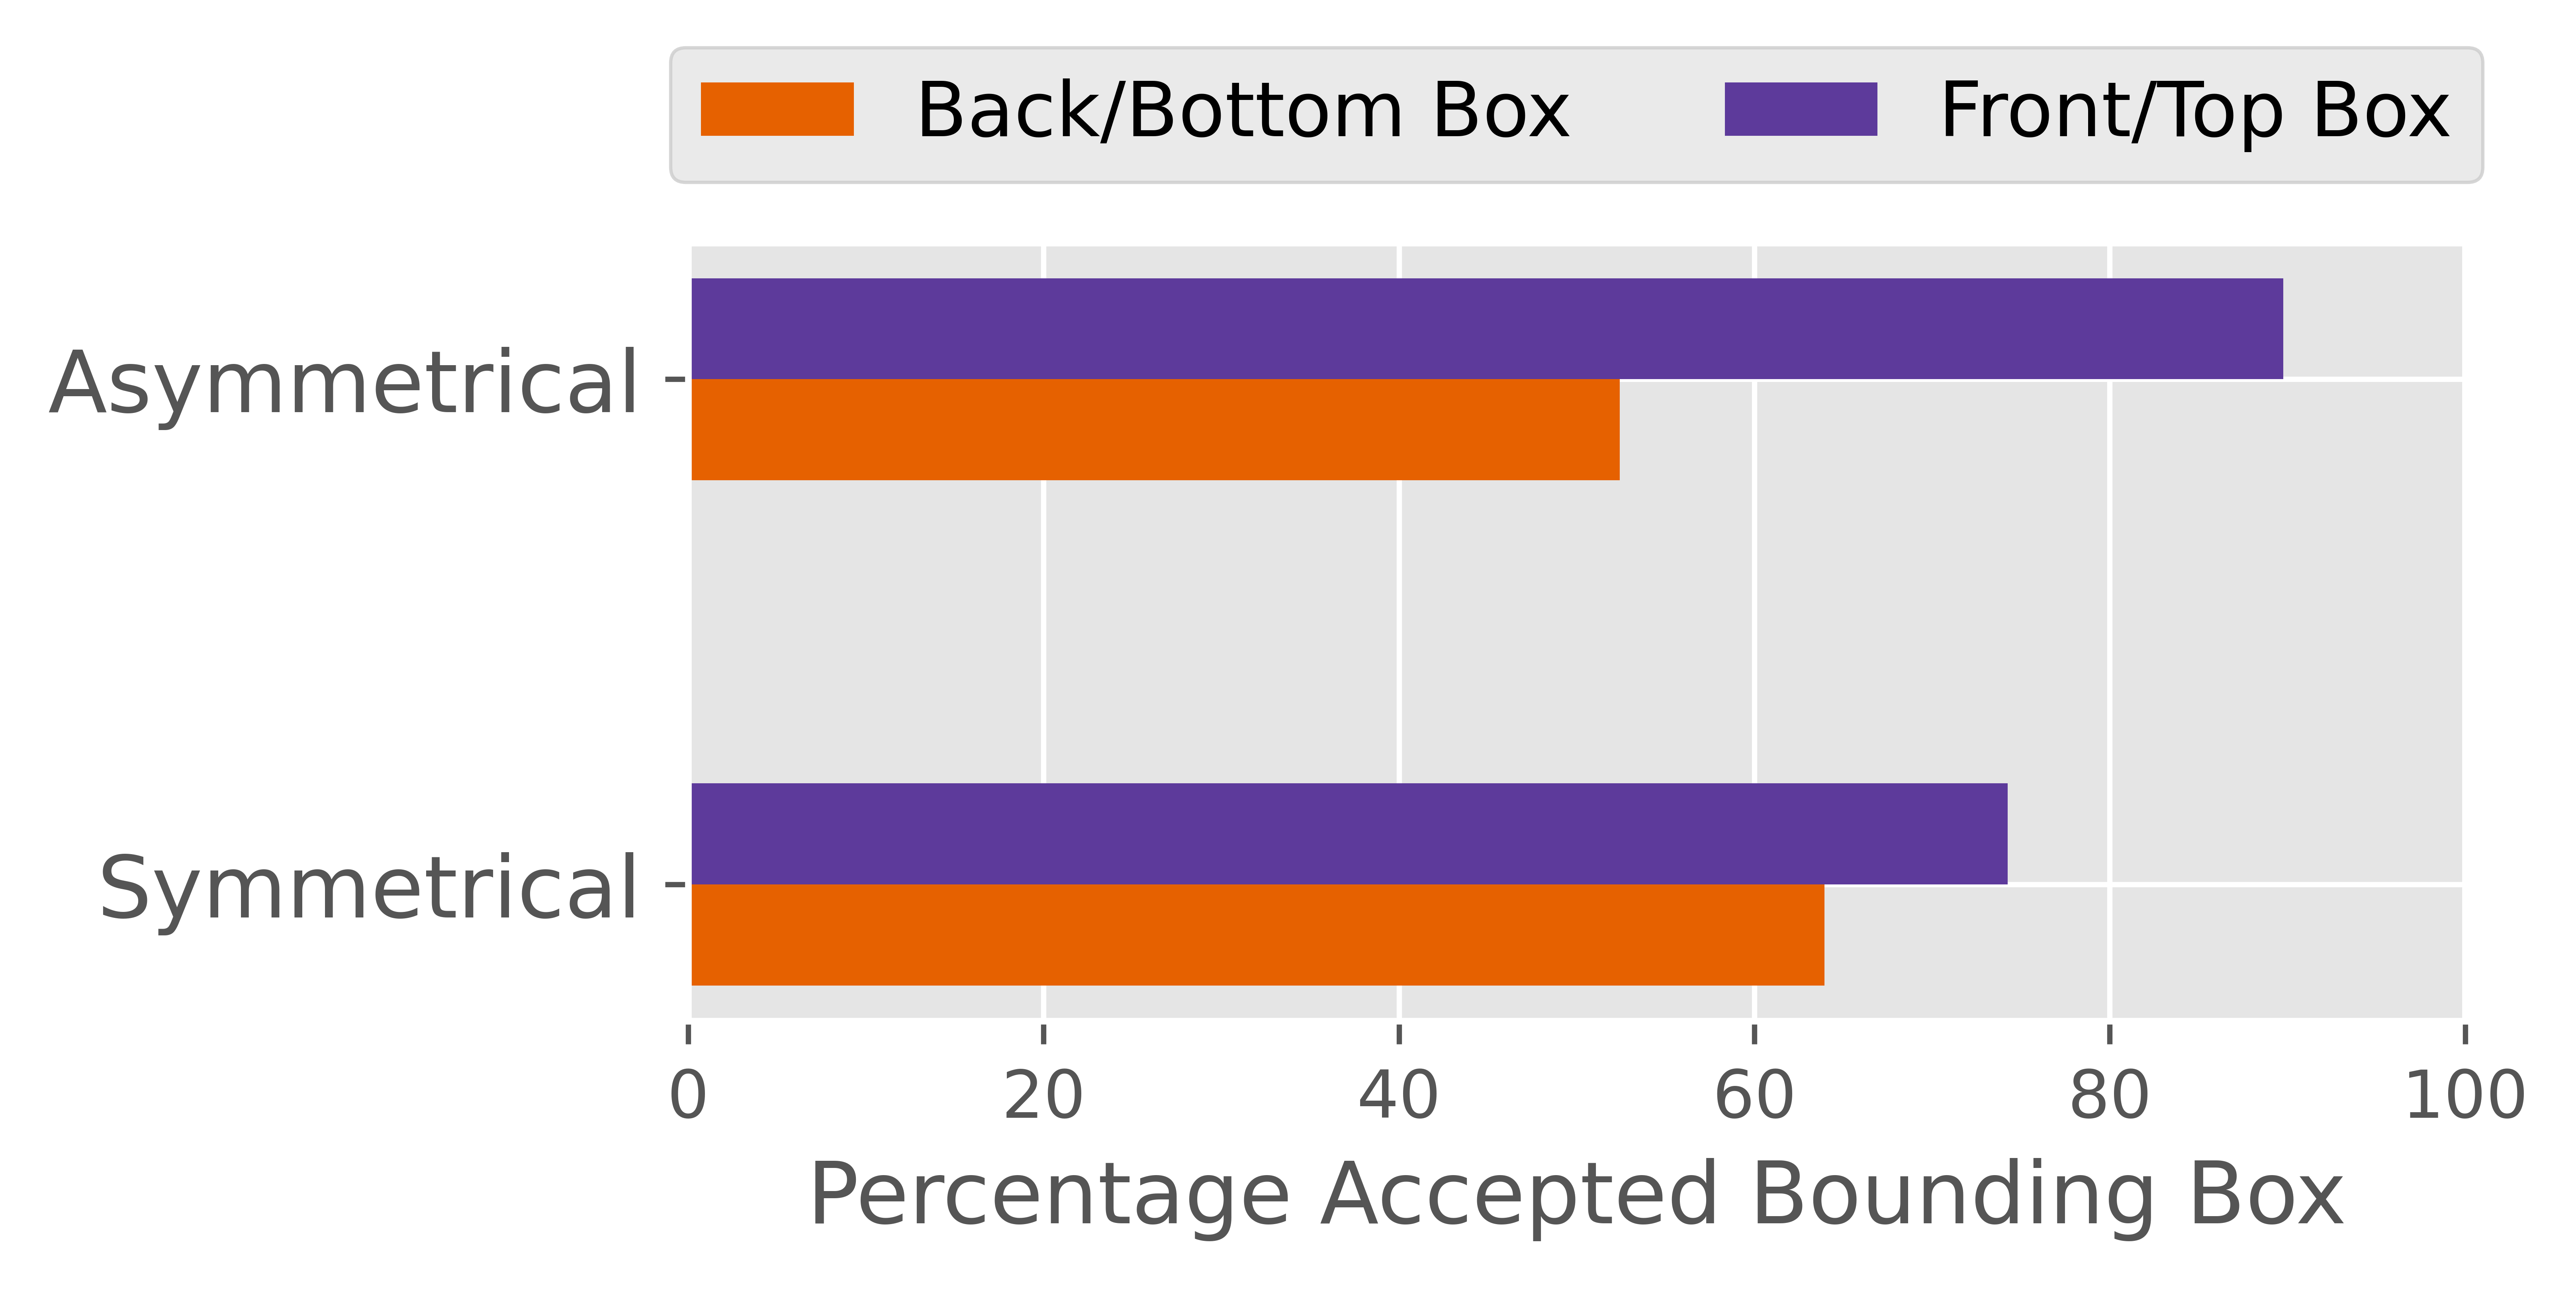
Position Acceptance. Figure 6(b) presents the results of the Accepted Box Position study. For both symmetrical and asymmetrical objects, the front bounding box is accepted in higher proportions than the back bounding box. For symmetrical objects, we found sufficient evidence, c.f. Z-test, that the proportion of back (z = -7.16, ) and front (z = -12.62, ) bounding boxes of being accepted is higher than the proportion of not being accepted. For asymmetrical objects, however, only front bounding boxes are statistically significant accepted (z = -20.18, ). Similarly, for each object type, we analyze whether one type of bounding boxes is more accepted than the other. For both symmetrical and asymmetrical objects, the front bounding boxes are statistically significant more accepted than back bounding boxes.
4 Discussion
In this paper, we performed four user studies to understand which object detections are preferred and accepted by humans. We addressed two main features of object localization, namely the scale (large, small) and the position (front/top, back/bottom) of the bounding boxes, and we experimented with objects of various sizes (small, medium, large) and symmetries (symmetrical and asymmetrical).
Our studies show a statistically significant relationship between the IoU value and the preferred bounding box size, as well as between the object size and the preferred bounding box size. Large bounding boxes are both the most preferred and the most accepted, while object detectors accept and prefer large and small boxes similarly if the boxes have the same IoU scores. We also found that for asymmetrical objects, the position of the bounding box matters for study participants, since they tend to choose bounding boxes that define or help them identify the object. This observation contrasts current state-of-the-art object localization models [24, 25, 26, 27, 28, 29, 30], where all bounding box positions are considered correct, regardless of their orientation, when the IoU is higher than the threshold.
Object detection models, when intended for humans, should be developed in a user-centric manner i.e., they should incorporate end-users preferences and comply with end-users needs. Thus, future studies should focus more on understanding which aspects of the objects should be captured by bounding boxes. The current study can also be extended by considering multiple datasets, occluded or truncated objects or images with multiple objects, as well as bounding boxes that are not centered, or which are shifted in random positions. Nevertheless, future studies should consider improving object detectors based on human preferences.
References
- [1] K. He, G. Gkioxari, P. Dollár, and R. Girshick, “Mask r-cnn,” in ICCV, 2017.
- [2] Z. Cao, G. Hidalgo, T. Simon, S. Wei, and Y. Sheikh, “Openpose: realtime multi-person 2d pose estimation using part affinity fields,” IEEE TPAMI, vol. 43, no. 1, pp. 172–186, 2019.
- [3] O. S. Kayhan, B. Vredebregt, and J. C. van Gemert, “Hallucination in object detection—a study in visual part verification,” in ICIP. IEEE, 2021.
- [4] Z. Li, M. Dong, S. Wen, X. Hu, P. Zhou, and Z. Zeng, “Clu-cnns: Object detection for medical images,” Neurocomputing, vol. 350, pp. 53–59, 2019.
- [5] D. Hoiem, Y. Chodpathumwan, and Q. Dai, “Diagnosing error in object detectors,” in ECCV. Springer, 2012, pp. 340–353.
- [6] M. Everingham, L. Van Gool, C. K. I. Williams, J. Winn, and A. Zisserman, “The PASCAL Visual Object Classes Challenge 2012 (VOC2012) Results,” .
- [7] A. Kuznetsova, H. Rom, N. Alldrin, J. Uijlings, I. Krasin, J. Pont-Tuset, S. Kamali, S. Popov, M. Malloci, A. Kolesnikov, T. Duerig, and V. Ferrari, “The open images dataset v4: Unified image classification, object detection, and visual relationship detection at scale,” IJCV, 2020.
- [8] G. Salton and M. J. McGill, Introduction to Modern Information Retrieval, McGraw-Hill, Inc., 1986.
- [9] O. S. Kayhan and J. C. van Gemert, “Evaluating context for deep object detectors,” 2022.
- [10] T.-Y. Lin, M. Maire, S. J. Belongie, L. D. Bourdev, R. B. Girshick, J. Hays, P. Perona, D. Ramanan, P. Dollár, and C. L. Zitnick, “Microsoft COCO: common objects in context,” CoRR, vol. abs/1405.0312, 2014.
- [11] X. Zhu, C. Vondrick, D. Ramanan, and C. C. Fowlkes, “Do we need more training data or better models for object detection?.,” in BMVC. Citeseer, 2012, vol. 3.
- [12] S. Song, L. Zhang, and J. Xiao, “Robot in a room: Toward perfect object recognition in closed environments,” CoRR, abs/1507.02703, 2015.
- [13] J. Yuen, B. Russell, C. Liu, and A. Torralba, “Labelme video: Building a video database with human annotations,” in CVPR, 2009, pp. 1451–1458.
- [14] B. C. Russell, A. Torralba, K. P. Murphy, and W. T. Freeman, “Labelme: a database and web-based tool for image annotation,” International journal of computer vision, vol. 77, no. 1-3, pp. 157–173, 2008.
- [15] D. P. Papadopoulos, J. R. R. Uijlings, F. Keller, and V. Ferrari, “We don’t need no bounding-boxes: Training object class detectors using only human verification,” in CVPR, 2016, pp. 854–863.
- [16] O. Russakovsky, L. Li, and L. Fei-Fei, “Best of both worlds: human-machine collaboration for object annotation,” in CVPR, 2015, pp. 2121–2131.
- [17] Hao Su, Jia Deng, and Li Fei-Fei, “Crowdsourcing annotations for visual object detection,” in Workshops at the AAAI Conference on Artificial Intelligence, 2012.
- [18] J. Pang, K. Chen, J. Shi, H. Feng, W. Ouyang, and D. Lin, “Libra r-cnn: Towards balanced learning for object detection,” in CVPR, 2019, pp. 821–830.
- [19] T. Lin, M. Maire, S. Belongie, J. Hays, P. Perona, D. Ramanan, P. Dollár, and C. L. Zitnick, “Microsoft COCO: Common Objects in Context,” in ECCV, 2014.
- [20] M. L. McHugh, “The chi-square test of independence,” Biochemia medica, vol. 23, no. 2, pp. 143–149, 2013.
- [21] R. Schumacker, “Z test for differences in proportions,” Learning statistics using R. SAGE Publications, 2017.
- [22] W. G. Cochran, “The comparison of percentages in matched samples,” Biometrika, vol. 37, no. 3/4, pp. 256–266, 1950.
- [23] E. W. Weisstein, “Bonferroni correction,” https://mathworld. wolfram. com/, 2004.
- [24] R. Girshick, J. Donahue, T. Darrell, and J. Malik, “Region-based convolutional networks for accurate object detection and segmentation,” PAMI, 2015.
- [25] R. Girshick, “Fast r-cnn,” in Proceedings of the IEEE international conference on computer vision, 2015, pp. 1440–1448.
- [26] S. Ren, K. He, R. B. Girshick, and Jian Sun, “Faster R-CNN: towards real-time object detection with region proposal networks,” CoRR, vol. abs/1506.01497, 2015.
- [27] J. Redmon, S. Divvala, R. Girshick, and A. Farhadi, “You only look once: Unified, real-time object detection,” in CVPR, 2016.
- [28] W. Liu, D. Anguelov, D. Erhan, C. Szegedy, S. Reed, C.-Y. Fu, and A. Berg, “Ssd: Single shot multibox detector,” 2016, vol. 9905, pp. 21–37.
- [29] T.-Y. Lin, P. Goyal, R. Girshick, K. He, and P. Dollár, “Focal loss for dense object detection,” in ICCV, 2017.
- [30] J. Redmon and A. Farhadi, “Yolov3: An incremental improvement,” arXiv preprint arXiv:1804.02767, 2018.