Redshift Evolution of the Feedback / Cooling Equilibrium in the Core of 48 SPT Galaxy Clusters:
A Joint Chandra – SPT – ATCA analysis
Abstract
We analyze the cooling and feedback properties of 48 galaxy clusters at redshifts selected from the South Pole Telescope (SPT) catalogs to evolve like the progenitors of massive and well-studied systems at . We estimate the radio power at the brightest cluster galaxy (BCG) location of each cluster from an analysis of Australia Telescope Compact Array (ATCA) data. Assuming that the scaling relation between radio power and active galactic nucleus (AGN) cavity power observed at low redshift does not evolve with redshift, we use these measurements in order to estimate the expected AGN cavity power in the core of each system. We estimate the X-ray luminosity within the cooling radius of each cluster from a joint analysis of the available Chandra X-ray and SPT Sunyaev-Zel’dovich (SZ) data. This allows us to characterize the redshift evolution of the ratio. When combined with low-redshift results, these constraints enable investigations of the properties of the feedback/cooling cycle across 9 Gyr of cluster growth. We model the redshift evolution of this ratio measured for cool core clusters by a log-normal distribution - and constrain the slope of the mean evolution . This analysis improves the constraints on the slope of this relation by a factor of two. We find no evidence of redshift evolution of the feedback/cooling equilibrium in these clusters which suggests that the onset of radio-mode feedback took place at an early stage of cluster formation. High values of are found at the BCG location of non-cool core clusters which might suggest that the timescales of the AGN feedback cycle and the cool core / non-cool core transition are different. This work demonstrates that joint analyses of radio, SZ, and X-ray data solidifies the investigation of AGN feedback at high redshifts.
1 Introduction
Early investigations of the properties of the intracluster medium (ICM) surrounding the brightest cluster galaxy (BCG) of galaxy clusters revealed central cooling times significantly shorter than the age of the universe (e.g. Fabian & Nulsen, 1977; Edge et al., 1992; Sanderson et al., 2006). Neither massive reservoirs of cold gas, nor the consequent high star formation rates, have however been observed in the cores of the vast majority of these systems (e.g. Fabian , 1994; Fogarty et al., 2017; McDonald et al., 2018). A proposed solution to this cooling-flow problem is that cooling is balanced by non-gravitational processes induced by the supermassive black hole at the center of the BCG that inject energy back into the ICM (e.g. Voit & Nulsen, 2005; Fabian & Sanders, 2006; Gaspari et al., 2012). The accretion rate of these active galactic nuclei (AGN) at high redshifts is very close to the Eddington limit, which leads to radiative quasar-mode feedback (e.g. Fabian , 2012). On the other hand, most AGN observed in the core of nearby clusters present much lower accretion rates and induce mechanical radio-mode feedback in the form of powerful jets that carve cavities into the ICM (e.g. Randall et al., 2011). Unveiling the onset of radio-mode feedback at high redshift is essential to understand this transition in the accretion rate of central AGN and its impact on cluster formation.
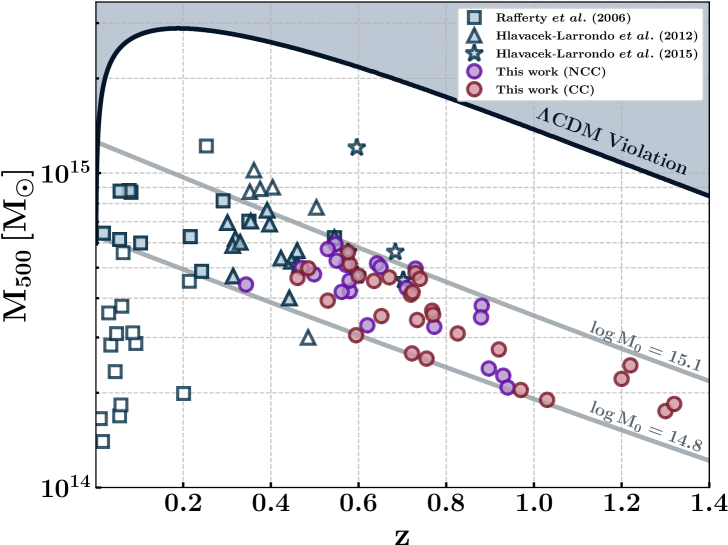
To this end, several X-ray analyses have been conducted on samples of giant elliptical galaxies and clusters in order to detect and characterize cavities and study the equilibrium between cooling and feedback (e.g. Rafferty et al., 2006; Nulsen et al., 2009; Hlavacek-Larrondo et al., 2012, 2015, 2020). For example, Hlavacek-Larrondo et al. (2015) studied 83 clusters at selected from the the South Pole Telescope (SPT) catalog (Bleem et al., 2015) with available Chandra data in order to detect and characterize X-ray cavities around the BCG. These studies, however, only enabled significant detections of cavities at redshifts because of the strong redshift dimming of the X-ray surface brightness. Out of the 83 clusters considered by Hlavacek-Larrondo et al. (2015), only 6 presented convincing cavities around the BCG (see Fig. 1). As detecting X-ray cavities and characterizing the central cooling properties of clusters at high redshift is extremely challenging with current or planned near-term X-ray observatories, it is essential to propose new methods in order to keep pushing the investigation of AGN feedback to higher redshifts.
In this work, we present a joint analysis of radio, Sunyaev-Zel’dovich (SZ), and X-ray observations realized with the Australia Telescope Compact Array (ATCA), SPT, and Chandra, respectively. We use the ATCA data in order to estimate the AGN jet power at the BCG location of 48 SPT clusters at selected to evolve like the progenitors of well-studied systems at . We further estimate the X-ray luminosity within the cooling radius of these clusters from the joint analysis of the Chandra and SPT data in order to characterise the redshift evolution of the feedback / cooling balance during cluster growth.
In §2 we summarize the cluster selection procedure as well as the data used in this paper. In §3 we present how we estimate the cavity power in the core of each cluster. The measurement of the associated cooling luminosity is described in §4 and the characterization of the redshift evolution of the cooling / feedback balance is presented in §5. In §6 we discuss the implications of this study for AGN feedback at high redshift before summarizing our work in §7. Throughout this paper, we consider a flat CDM cosmology with , , and .
2 Cluster Selection and Data Set
The cluster selection procedure is detailed in Ruppin et al. (2021); we briefly summarize it here. We use the analytic formula for the mean mass growth rate of haloes as a function of redshift obtained by Fakhouri et al. (2010) in order to select clusters from the SPT catalogs defined in Bleem et al. (2015) and Huang et al. (2019). The selected clusters are the progenitors of halos with a mass enclosed between M M⊙111M500 is defined as the mass enclosed within a sphere with a mean mass density equal to 500 times the critical density of the Universe at the cluster redshift. and M M⊙ at .
Among all SPT clusters satisfying this condition, 73 have been observed by Chandra as part of four dedicated projects. The Chandra X-ray Visionary Project (XVP; PI: B. Benson) described in McDonald et al. (2013) enabled obtaining counts in the 0.7-2 keV band for 49 clusters during Chandra cycles 12 and 13. Three of these clusters have been further observed with Chandra thanks to another large program (PI: J. Hlavacek-Larrondo). A third large program (PI: M. McDonald) targeted 18 clusters at and allowed us to obtain an average of 180 counts per cluster (Ruppin et al., 2021). The latest program (PI: F. Ruppin), targeting 7 clusters at is currently on-going but the observations of 6 of these clusters are completed.
In this paper, we aim to study the evolution of the cooling and feedback balance in the cores of clusters lying along a common evolutionary track. To this end, we further consider radio observations realized with ATCA for a sub-sample of these clusters during three separate observing runs. A single map of the whole SPTpol footprint (Huang et al., 2019) was realized in May 2013 in the 6A configuration at 2 GHz with a root mean square (rms) noise varying between 60 and 120 Jy/beam across the map (O’Brien et al., 2016). Targeted observations of XVP clusters were made in January 2015 at 2 GHz with an rms noise varying between 28 and 55 Jy/beam. Some of these clusters were further followed-up at 5 and 9 GHz in August 2016 if a strong detection was made at 2 GHz. We reach an rms noise varying between 30 and 67 Jy/beam at 5 GHz and between 19 and 77 Jy/beam at 9 GHz. All observations have been reduced using the 05/21/2015 release of the MIRIAD software (Sault et al., 1995).
Among the 73 SPT clusters satisfying our progenitor selection, 48 have available ATCA data. If a significant radio source is observed in the ATCA data of a given cluster, we make sure that it is located within arcsec of the BCG to exclude potential foreground or background contamination. We estimate the BCG location in these clusters from a visual inspection of available optical and IR imaging from Bleem et al. (2015) and Huang et al. (2019) based on galaxy size and brightness. We use the X-ray peak position as extra information to solve cases in which multiple BCGs could be identified in the same cluster. The mass-redshift distribution of this sample of 48 clusters is shown in Fig. 1 (circles) along with samples from previous studies. This sample allows us to study the cooling / feedback equilibrium in a redshift range that was previously unexplored () while overlapping with samples that have been characterized by Rafferty et al. (2006); Hlavacek-Larrondo et al. (2012, 2015). This enables validation of our methodology that does not rely on X-ray cavity detection in contrast to these previous surveys. We only consider the cool core clusters (red points in Fig. 1) in the following in order to match the cluster properties of these low redshift samples as much as possible. The cool core / non-cool core discrimination is performed by the joint analysis of the Chandra and SPT observations of the selected clusters following the procedure described in Ruppin et al. (2021) (see §4). We will discuss the results obtained for the non-cool core clusters (purple points) in §6.3.
3 Estimation of Cavity Power
As detecting X-ray cavities at high redshift with current facilities is extremely challenging, we propose to rely on the scaling relation between AGN jet power and radio power at 1.4 GHz calibrated by Cavagnolo et al. (2010). Instead of measuring the properties of X-ray cavities to estimate the power of the AGN jets that carved them, we assume that the Cavagnolo et al. (2010) scaling relation does not evolve with redshift and we measure the AGN radio power from the ATCA observations of each cluster considered in this work to infer the corresponding jet power. We stress that the Cavagnolo et al. (2010) scaling relation considers the total radio power measured at 1.4 GHz without discriminating between synchrotron emission from the mini-halo and the AGN lobes. We can therefore use the total radio power estimated with ATCA at 1.4 GHz in order to infer the associated jet power.
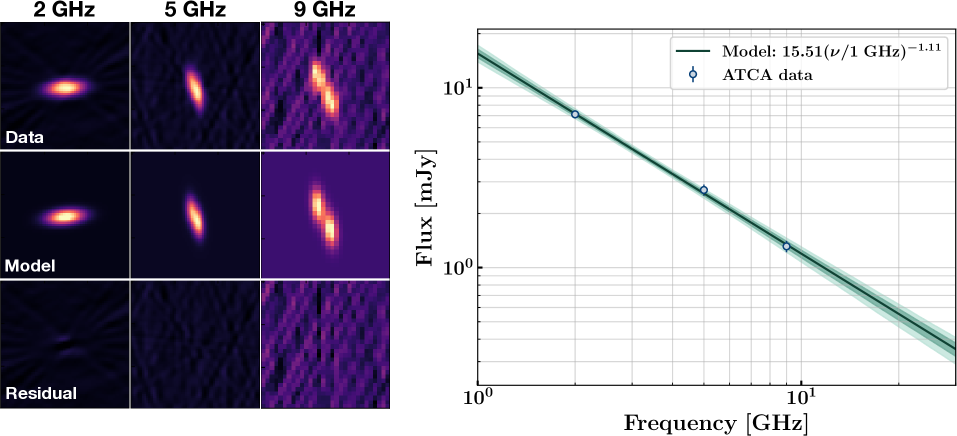
We model the ATCA radio data using a sum of 2D Gaussian functions with a position angle and minor and major axes lengths fixed to the ones of the PSF model in each frequency band. If an AGN is detected within of the BCG location in the considered ATCA map, we perform a Markov Chain Monte Carlo (MCMC) analysis in order to estimate the best-fit values of the amplitude and sky-position of each Gaussian function considered in our model. We iterate this analysis with an increasing number of Gaussian functions until the best-fit value does not decrease significantly given the RMS noise in the data. The AGN flux density is obtained by integrating the signal in the best-fit model and the corresponding uncertainty is estimated by sampling the posterior distribution of all model parameters. If the AGN detection is not associated with the BCG or no radio AGN is detected in the cluster region, we estimate an upper limit on the AGN flux density based on the ATCA RMS noise measured in a region empty of radio signal within a 5 arcmin radius from the BCG location.
We show the results obtained with the ATCA data of SPT-CLJ0307-6225 in Fig. 2. We use it as a representative example of a cluster with a significant AGN detection. The signal in most maps at 2 GHz is well modelled with a single 2D Gaussian function as shown in the left column of the left panel. Indeed, the ATCA angular resolution at this frequency is often too small to resolve the AGN signal. Our model is flexible enough to subtract all the significant signal observed in the data as shown in the residuals shown in the bottom row.
Among the 48 clusters considered in this work, 11 have been observed at 2, 5, and 9 GHz with ATCA. We use the flux densities estimated in each band in order to fit the spectral energy distribution (SED) of the AGN at the core of these systems. The SED is modelled as a power law with free amplitude at 1 GHz and spectral index. The choice for this model is motivated by previous studies of AGN radio emission in clusters such as Kokotanekov et al. (2017) who find a very good agreement between this model and the data obtained in the GHz range. We show the best-fit SED model of the AGN detected in SPT-CLJ0307-6225 in the right panel of Fig. 2 along with its associated and confidence regions. The mean spectral index measured for this sample of 11 clusters is . We have checked that this sub-sample of clusters is not biased towards particular core properties. Among these 11 clusters, 5 are classified as cool cores in (Ruppin et al., 2021) and 6 as non-cool cores. Therefore, we use the mean spectral index estimated with this sample to model the SED of all other 37 clusters with only one ATCA measurement at 2 GHz. Knowing the redshift of every cluster in our sample, we use these SED models to estimate the rest frame flux density at 1.4 GHz, . The radio power at this frequency is then given by:
| (1) |
where is the cluster luminosity distance. The uncertainty on the radio power is obtained by sampling the error bars on , which take into account both the measurement error in the ATCA bands and the uncertainty on the spectral index, as well as the error on the redshift that accounts for % of the total error budget through the factor. The associated AGN cavity power is further deduced from the Cavagnolo et al. (2010) scaling relation:
| (2) |
with an intrinsic scatter dex and a correlation coefficient between the slope and intercept of 0.72. We estimate the uncertainty on the cavity power by sampling the error bars on , the covariance matrix associated with the slope and intercept of the Cavagnolo et al. (2010) scaling relation as well as its intrinsic scatter. Our results are summarized in Table 2 and 3.
4 X-ray Luminosity within Cooling Radius
| Data | |||
|---|---|---|---|
| Rafferty et al. 2006 + Hlavacek-Larrondo et al. 2012 | |||
| Rafferty et al. 2006 + Hlavacek-Larrondo et al. 2012 + This work |
The X-ray data reduction is made using the Chandra Interactive Analysis of Observations (CIAO) software v4.13 along with the calibration database (CALDB) v4.9.5222https://cxc.cfa.harvard.edu/ciao/. After reprocessing the level 1 event files and removing flares from lightcurves (Markevitch et al., 2001), we identify point sources with wavelet filters (Vikhlinin et al., 1998) and mask them to produce a cleaned event file. We further extract the X-ray surface brightness profile of each cluster in the 0.7-2.0 keV band using the same binning definition considered in McDonald et al. (2017) and Ruppin et al. (2021). The center that we consider to extract the X-ray surface brightness profile is the BCG location found with the available optical / IR data. The surface brightness profiles are vignetting-corrected using the exposure map estimated in the same energy band.
The analysis procedure used to estimate the ICM thermodynamic profiles of each cluster depends on the quality of the Chandra observations. The 36 clusters observed in the context of the XVP program can be fully processed with an X-ray only analysis as we have enough X-ray counts to constrain the ICM temperature from the analysis of their X-ray spectrum. For these clusters, we extract spectra at different angular distances from the deprojection center requiring at least 500 counts in the 0.7-7.0 keV band. We subtract the particle background using stowed background files scaled to the number of counts observed in the 9-12 keV band. We repeat the same procedure in regions of the ACIS-I chips free from cluster emission in order to estimate the astrophysical background spectrum. We jointly fit the cluster and background spectra using a single-temperature plasma (APEC; Smith et al., 2001) model combined with a soft X-ray Galactic background (APEC, , , ), a hard X-ray cosmic spectrum BREMSS (), and a Galactic absorption model (PHABS). The Galactic column density is fixed to the value given by Kalberla et al. (2005). We fix the cluster redshift to the SPT catalog value and the ICM metallicity to (Mantz et al., 2020). The resulting X-ray temperature measurement allows us to estimate the ICM emission measure profile. We apply the procedure detailed in Ruppin et al. (2021) in order to estimate the ICM density profile from a Bayesian forward fit of the emission measure profile based on a Vikhlinin parametric model (VPM; Vikhlinin et al., 2006a).
The 12 high-redshift clusters in our sample presenting only an average of counts due to ICM emission over the entire image have been analysed using the joint X-ray/SZ analysis detailed in Ruppin et al. (2021). We jointly fit the Chandra surface brightness profile and the SPT integrated Compton parameter using a VPM model for the ICM density and a generalized Navarro-Frenk-White model (gNFW; Nagai et al., 2007) for the ICM pressure. This procedure allows us to bypass the analysis of the X-ray spectrum of these clusters as they do not present enough counts to enable measuring reliable X-ray temperatures. Following Hudson et al. (2010), we classify a cluster as a cool core (CC) if the central ICM density measured at kpc is such that .
We finally estimate the isochoric cooling time profile:
| (3) |
where is the ICM proton density assuming the ionization fraction of a fully ionized plasma with an abundance of (Anders & Grevesse , 1989). The ICM temperature profile is either the one obtained from the deprojection of the Chandra spectra of the XVP clusters or the one obtained from the combination of the ICM electron density () and pressure () profiles: . We use the cooling function estimated by Sutherland & Dopita (1993) for an optically-thin plasma with a metallicity to compute .
We estimate the cooling radius of each cluster as the radius enclosing a plasma with a cooling time lower than 7.7 Gyr. We use this threshold to enable comparing our results to the ones obtained in previous studies (Rafferty et al., 2006; Hlavacek-Larrondo et al., 2012, 2015) that use this definition of the cooling radius. We estimate the X-ray luminosity between 0.2 and 100 keV within the cooling radius using the CIAO tool modelflux. The error bars on the estimated luminosity are obtained by varying the size of the the cooling radius to account for the uncertainty on the cooling time profile as well as by sampling the uncertainty on the ICM temperature within the cooling radius. Our results are summarized in Table 2 and 3.
5 Evidence for Constant Feedback to Cooling Ratio with Redshift
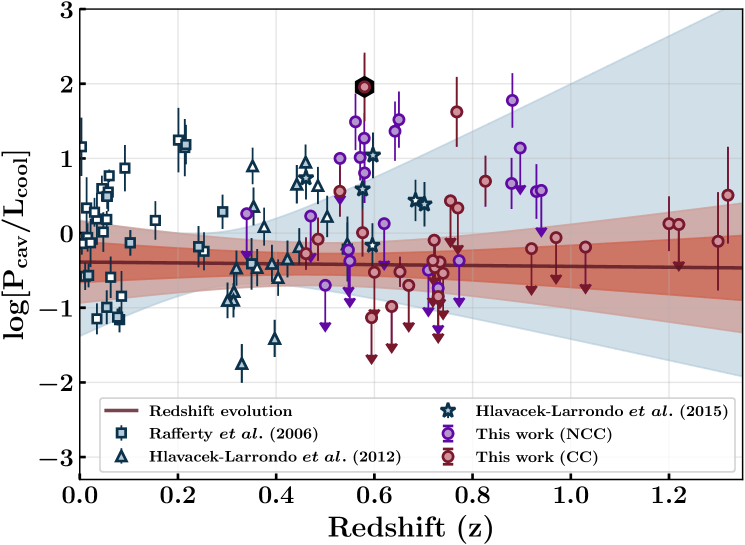
We use our estimates of the AGN cavity power (§3) and X-ray luminosity inside the cooling radius (§4) to study the redshift evolution of the ratio in our sample of CC clusters. The results are presented as red points in Fig. 3. Among the 27 CC clusters in our sample, 15 do not display any significant radio signal at the BCG location in the ATCA data and are presented as upper limits. All but two clusters in our CC sample verify , in agreement with results obtained by Rafferty et al. (2006); Hlavacek-Larrondo et al. (2012, 2015) at low redshift (blue symbols). The cluster SPT-CLJ0528-5300 at has already been studied in detail by Calzadilla et al. (2019) who find a ratio in agreement with our estimate. The case of SPT-CLJ2245-6206 at with will be discussed in §6.2 along with the results obtained for non-cool core clusters (purple points) in §6.3.
We use the Bayesian linear regression package LinMix (Kelly , 2007) in order to fit the redshift evolution of the ratio, taking upper limits into account. We model the redshift evolution of as , where and are respectively the intercept and slope of the power law defining the mean of the Gaussian distribution with intrinsic scatter . The clusters from Rafferty et al. (2006); Hlavacek-Larrondo et al. (2012) that satisfy our progenitor selection (filled symbols in Fig. 3) and our constraints on CC clusters are jointly fit to obtain the dark line in Fig. 3. The results of the fits are given in Table 1 with and without including our constraints in the analysis. The dark and light orange regions show the and confidence intervals associated with the mean of the distribution. The blue shaded region corresponds to the confidence interval associated with the regression realised by considering the Rafferty et al. (2006); Hlavacek-Larrondo et al. (2012) data points only (filled squares and triangles in Fig. 3). We note that among the 6 clusters with convincing cavity detections in Hlavacek-Larrondo et al. (2015), only 4 satisfy our progenitor selection cuts and they are all located at the high mass end (see Fig. 1). Less massive SPT clusters studied by Hlavacek-Larrondo et al. (2015) in the same redshift range (i.e. ) might have shown convincing X-ray cavities with longer exposures. We therefore chose to exclude these 4 data points from the fit of the redshift evolution of in order to minimize selection effects.
We find that including our results reduces the uncertainty on the slope by a factor of 2.3, from to . The high redshift anchor brought by our study enables reaching a regime where the uncertainty on is limited by the intrinsic scatter of the distribution. The measured slope is compatible with an absence of redshift evolution of the feedback to cooling ratio up to .
6 Discussion and Implications for AGN Feedback
6.1 Onset of radio-mode feedback
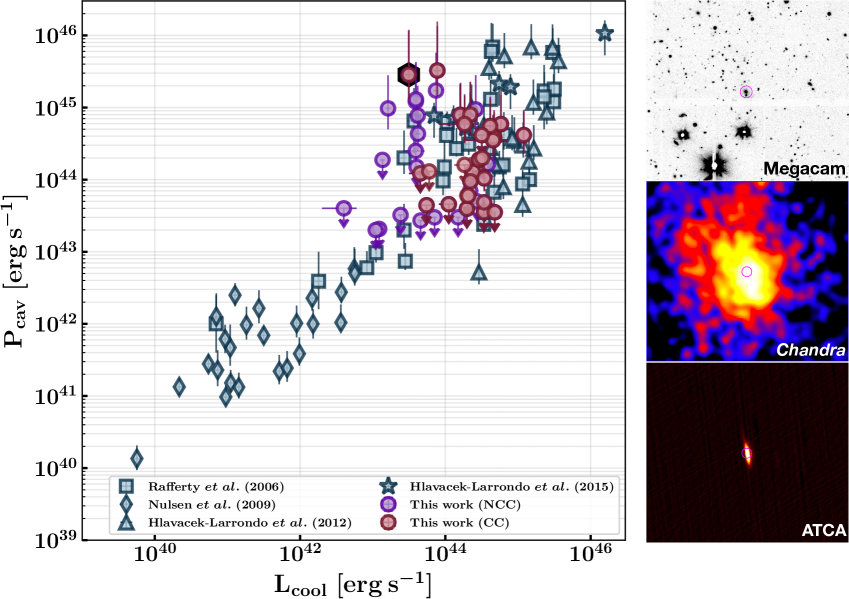
First, we note that the distribution of CC clusters in the plane shown in Fig. 4 agrees with previous samples at lower redshift. This suggests that the scaling relation calibrated by Cavagnolo et al. (2010) does not significantly evolve with redshift.
The results presented in §5 show that the equilibrium between the power generated by AGN mechanical feedback and the cooling of the hot X-ray emitting phase surrounding the BCG has remained stable in the past 9 Gyr of cluster growth. As shown in Fig. 4, all CC clusters with a significant AGN detection in the BCG present powerful radio-mode feedback (). This suggests that the onset of radio-mode feedback took place at an early stage () of cluster formation.
Moreover, Fig. 3 shows that AGN mechanical feedback is a dominant heating source balancing cooling in cluster cores as at all redshifts. The fact that this ratio is not compatible with at all redshifts does not imply that other significant feedback mechanisms are required to avoid runaway cooling in cluster cores. A sample average may indeed imply that the AGN duty cycle is lower than 50% and that the feeding timescale is longer than the feedback one. The hint for a slight negative slope in Fig. 3 is most probably due to the fact that we include upper limits in the analysis of the redshift evolution of while non-detections were not included in previous works.
Radio-loud AGN have been shown to have marginal impact on SZ cluster detection with SPT (Bleem et al., 2020). Assuming the ratio between the number of clusters hosting a radio-loud AGN above a given luminosity threshold and the total number of clusters in our SPT sample is representative of the AGN duty cycle of energy injection , we find that and where we take into account the binomial uncertainties. This suggests that AGN duty cycles do not evolve significantly with redshift up to . While unusually high cooling flows and star formation rates can be observed in individual systems at high redshift (e.g. the Phoenix cluster McDonald et al. (2019)), this work supports a scenario in which radio-mode feedback is able to suppress most of the ICM cooling since the transition between protoclusters and clusters (Muldrew et al., 2015).
6.2 The case of SPT-CLJ2245-6206
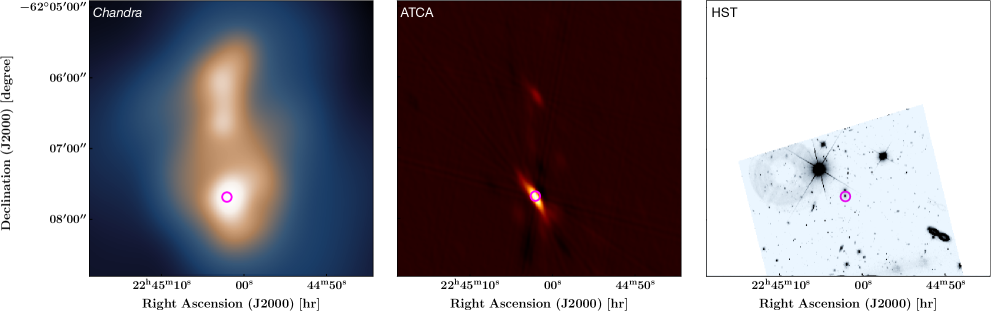
We discuss the results obtained in the particular case of SPT-CLJ2245-6206 at . This cluster is characterized by , i.e. the highest feedback response to cooling observed in our sample. This cluster displays the second highest value of in Fig. 4 and its cooling luminosity is an order of magnitude lower than the one observed in most CC in this sample. The particularity of this cluster is that it displays a clear bimodal morphology (see Fig. 5). The main halo (south) hosting a radio loud AGN in the BCG (magenta circle) presents a rather spherical morphology and is merging with a second sub-halo (north). Although the central density of the main halo is high enough to categorize it as a CC, it presents hints of disturbance that may have been caused by the passage of a shock front induced by the on-going merger event. This would explain the lower cooling luminosity measured at the core of this cluster. This system may be considered as a transition state between the CC and NCC sub-samples studied in this paper.
6.3 Feedback in non-cool core clusters
We investigate how the results presented in this work change if we include clusters categorized as non-cool cores (NCC) in the analysis. We stress that the radio power estimates given in Table 3 are associated with AGN detections at the location of the BCG. If no radio AGN is detected in the cluster field or if it is located at arcsec from the location of the BCG we provide an upper limit on the radio power.
As shown in Fig. 3, we find that the ratios estimated in NCC clusters are on average higher than the ones found in CC clusters. However, adding the NCC clusters to the fit presented in §5 does not change the constraints on the slope significantly but rather increases the intrinsic scatter of the relation by 18%. As shown in Fig. 4, the distributions of estimates in CC and NCC are very similar. The high ratios found in NCC are thus driven by the lower cooling luminosities measured on average in these clusters. We show the Magellan/Megacam band image of the SPT-CLJ0542-4100 cluster along with its Chandra and ATCA maps in the right panel of Fig. 4 as a representative example of a NCC cluster with a strong radio AGN detection at the location of the BCG. We propose the following interpretation to explain these observations.
As all NCC clusters with a significant radio AGN detection in this sample display a disturbed morphology, recent merging events are probably the cause of the core disturbance. The transition between CC and NCC has been shown to occur on very short timescales compared to the central cooling time in NCC clusters (Rossetti et al., 2011). If the AGN feedback timescale is much longer than the transition between CC and NCC, observing a BCG at the center of a NCC cluster with strong radio emission can be quite likely. We may therefore be observing the few NCC clusters displaying a high ratio in a state during which the radio emission is still on-going but the AGN feeding has been reduced by stirring and mixing turbulence that perturbs the dense CC. The radio power that we measure would then be comparable with that found in CC, but the X-ray luminosity measured in the cooling radius would be much lower. In this scenario, we expect the radio power to decrease once the feedback response from previous feeding ends. At this point, a dense core would form again at the BCG location and the gas cooling time would drop below the threshold that enables condensation to occur (Gaspari et al., 2020). This scenario is also supported by the properties of SPT-CLJ2245-6206 discussed in §6.2. Deeper X-ray data combined with dedicated simulations would however be necessary to test this scenario.
7 Summary
We report the first characterization of the feedback/cooling equilibrium in the core of progenitor-selected clusters at . Unlike previous studies focusing on the detection of X-ray cavities to estimate the AGN feedback response to gas cooling, we use dedicated ATCA radio observations in the GHz band in order to estimate the radio power at 1.4 GHz. This allows us to estimate the AGN cavity power from the use of a previously calibrated scaling relation between AGN radio and cavity powers whose evolution is assumed to be negligible with redshift. The joint analysis of Chandra X-ray and SPT SZ observations of the high-redshift clusters in our sample enables both the estimation of their X-ray luminosity within the cooling radius, , and its comparison with the estimated AGN cavity power. We find that the ratios estimated in these clusters are compatible with the ones found at low redshift. We jointly fit our estimates with the ones obtained in previous studies in order to constrain the redshift evolution of the feedback/cooling equilibrium. We find that this work reduces the uncertainty on the slope of this relation by a factor of 2.3. The latter is compatible with 0 which suggests that radio-mode feedback has balanced gas cooling in the BCG for more than 9 Gyr. This work highlights the importance of joint multi-wavelength analyses to push the investigation of AGN feedback towards higher redshift before the next generation X-ray observatories such as Athena (Barret et al., 2020) come into play.
Acknowledgements
Support for this work was provided by the National Aeronautics and Space Administration through SAO Award Number SV2-82023 and Chandra Award Number GO9-20117A issued by the Chandra X-Ray Observatory Center, which is operated by the Smithsonian Astrophysical Observatory for and on behalf of NASA under contract NAS8-03060. This work was performed in the context of the South-Pole Telescope scientific program. SPT is supported by the National Science Foundation through grants PLR-1248097, OPP-1852617, AST-1814719, and AST-2109035. Partial support is also provided by the NSF Physics Frontier Center grant PHY-0114422 to the Kavli Institute of Cosmological Physics at the University of Chicago, the Kavli Foundation and the Gordon and Betty Moore Foundation grant GBMF 947 to the University of Chicago. Argonne National Laboratory’s work was supported by the U.S. Department of Energy, Office of High Energy Physics, under contract DE-AC02-06CH11357. B.B. is supported by the Fermi Research Alliance LLC under contract no. De-AC02-07CH11359 with the U.S. Department of Energy. GM acknowledges funding from the European Union’s Horizon 2020 research and innovation programme under the Marie Skłodowska-Curie grant agreement No MARACHAS - DLV-896778. The Australia Telescope Compact Array is part of the Australia Telescope National Facility (https://ror.org/05qajvd42) which is funded by the Australian Government for operation as a National Facility managed by CSIRO. We acknowledge the Gomeroi people as the traditional owners of the Observatory site. CR acknowledges support from the Australian Research Council’s Discovery Projects scheme (DP200101068).
| (1) | (2) | (3) | (4) | (5) | (6) | (7) |
|---|---|---|---|---|---|---|
| Name | ||||||
| SPT-CLJ0509-5342 | ||||||
| SPT-CLJ0334-4659 | ||||||
| SPT-CLJ0346-5439 | ||||||
| SPT-CLJ2245-6206 | ||||||
| SPT-CLJ2331-5051 | ||||||
| SPT-CLJ2232-5959 | ||||||
| SPT-CLJ0033-6326 | ||||||
| SPT-CLJ0243-5930 | ||||||
| SPT-CLJ2222-4834 | ||||||
| SPT-CLJ0352-5647 | ||||||
| SPT-CLJ0102-4603 | ||||||
| SPT-CLJ2329-5831 | ||||||
| SPT-CLJ2043-5035 | ||||||
| SPT-CLJ2301-4023 | ||||||
| SPT-CLJ2352-4657 | ||||||
| SPT-CLJ0406-4805 | ||||||
| SPT-CLJ2320-5233 | ||||||
| SPT-CLJ0528-5300 | ||||||
| SPT-CLJ2359-5010 | ||||||
| SPT-CLJ0058-6145 | ||||||
| SPT-CLJ2357-5421 | ||||||
| SPT-CLJ2355-5850 | ||||||
| SPT-CLJ2335-5434 | ||||||
| SPT-CLJ2334-5308 | ||||||
| SPT-CLJ2336-5252 | ||||||
| SPT-CLJ2323-5752 | ||||||
| SPT-CLJ2355-5514 |
| (1) | (2) | (3) | (4) | (5) | (6) | (7) |
|---|---|---|---|---|---|---|
| Name | ||||||
| SPT-CLJ0217-5245 | ||||||
| SPT-CLJ0655-5234 | ||||||
| SPT-CLJ0200-4852 | ||||||
| SPT-CLJ2306-6505 | ||||||
| SPT-CLJ2335-4544 | ||||||
| SPT-CLJ0307-5042 | ||||||
| SPT-CLJ0456-5116 | ||||||
| SPT-CLJ2148-6116 | ||||||
| SPT-CLJ0256-5617 | ||||||
| SPT-CLJ0307-6225 | ||||||
| SPT-CLJ0123-4821 | ||||||
| SPT-CLJ0542-4100 | ||||||
| SPT-CLJ2218-4519 | ||||||
| SPT-CLJ0310-4647 | ||||||
| SPT-CLJ0324-6236 | ||||||
| SPT-CLJ2328-5533 | ||||||
| SPT-CLJ2343-5024 | ||||||
| SPT-CLJ0533-5005 | ||||||
| SPT-CLJ2304-5718 | ||||||
| SPT-CLJ2311-5820 | ||||||
| SPT-CLJ2325-5116 |
References
- Anders & Grevesse (1989) Anders, E., & Grevesse, N., 1989, Geochim. Cosmochim. Acta, 53, 197
- Barret et al. (2020) Barret, D., Decourchelle, A., Fabian, A., et al. 2020, Astron. Nachrichten, 341, 224-235
- Bleem et al. (2015) Bleem, L. E., Stalder, B., de Haan, T., et al. 2015, ApJS 216, 27
- Bleem et al. (2020) Bleem, L. E., Bocquet, S., Stalder, B., et al. 2020, ApJS 247, 25
- Calzadilla et al. (2019) Calzadilla, M. S., McDonald, M., Bayliss, M., et al., 2019, ApJ 887, L17
- Cavagnolo et al. (2010) Cavagnolo, K. W., McNamara, B. R., Nulsen, P. E. J., et al., 2010, ApJ 720, 1066
- Edge et al. (1992) Edge, A. C., Stewart, G. C. & Fabian, A. C., 1992, MNRAS 258, 177
- Fabian & Nulsen (1977) Fabian, A. C., & Nulsen, P. E. J., 1977, MNRAS 180, 479
- Fabian (1994) Fabian, A. C., 1994, ARA&A 32, 277
- Fabian & Sanders (2006) Fabian, A. C., & Sanders, J. S., 2006, proceedings of ”Heating vs Cooling in Galaxies and Clusters of Galaxies”, arXiv:astro-ph/0612426
- Fabian (2012) Fabian, A. C., 2012, ARA&A 50, 455
- Fakhouri et al. (2010) Fakhouri, O., Ma, C.-P., & Boylan-Kolchin, M., 2010, MNRAS 406, 2267–2278
- Flores et al. (2021) Flores, A. M., Mantz, A. B., Allen, S. W., et al., 2021, accepted in MNRAS, arXiv:2108.12051
- Fogarty et al. (2017) Fogarty, K., Postman, M., Larson, R., et al., 2017, ApJ 846, 103
- Gaspari et al. (2012) Gaspari, M., Ruszkowski, M., & Sharma, P., 2012, ApJ 746, 94
- Gaspari et al. (2020) Gaspari, M., Tombesi, F., Cappi, M., et al., 2020, Nat. Astron., 4, 10-13
- Hlavacek-Larrondo et al. (2012) Hlavacek-Larrondo, J., Fabian, A. C., Edge, A. C., et al., 2012, MNRAS 421, 1360-1384
- Hlavacek-Larrondo et al. (2015) Hlavacek-Larrondo, J., McDonald, M., Benson, B. A., et al., 2015, ApJ 805, 35
- Hlavacek-Larrondo et al. (2020) Hlavacek-Larrondo, J., Rhea, C. L., Webb, T., et al., 2020, ApJ 898, L50
- Huang et al. (2019) Huang, N., Bleem, L. E., Stalder, B., et al. 2019, ApJ 159, 3
- Hudson et al. (2010) Hudson, D. S., Mittal, R., Reiprich, T. H., et al. 2010, A&A, 513, A37
- Kalberla et al. (2005) Kalberla, P. M. W., Burton, W. B., Hartmann, D., et al. 2005, A&A 440, 775
- Kelly (2007) Kelly, B. C., 2007, ApJ 665, 1489-1506
- Kokotanekov et al. (2017) Kokotanekov, G., Wise, M., Heald, G. H., et al. 2017, A&A 605, A48
- Mantz et al. (2020) Mantz, A. B., Allen, S. W., Glenn Morris, R., et al. 2020, MNRAS 496, 1554-1564
- Markevitch et al. (2001) Markevitch, M., 2001, memo ACIS background, http://cxc.harvard.edu/contrib/maxim/bg
- McDonald et al. (2013) McDonald, M., Benson, B. A., Vikhlinin, A., et al. 2013, ApJ 774, 23
- McDonald et al. (2017) McDonald, M., Allen, S. W., Bayliss, M., et al. 2017, ApJ, 843, 28
- McDonald et al. (2018) McDonald, M., Gaspari, G., McNamara, B. R., & Tremblay, G. R., 2018, ApJ 858, 45
- McDonald et al. (2019) McDonald, M., McNamara, B. R., Voit, G. M., et al. 2019, ApJ 885, 63
- Muldrew et al. (2015) Muldrew, S. I., Hatch, N. A., & Cooke, E. A., 2015, MNRAS 452, 2528–2539
- Nagai et al. (2007) Nagai, D., Vikhlinin, A., & Kravtsov, A. V. 2007, ApJ, 655, 98
- Nulsen et al. (2009) Nulsen, P., Jones, C., Forman, W., et al., 2009, AIP Conference Proceedings 1201, 198
- O’Brien et al. (2016) O’Brien, A. N., Tothill, N. F. H., Norris, R. P., & Filipović, M. D., 2016, Proceedings of Science for ”The many facets of extragalactic radio surveys: towards new scientific challenges”, Bologna, Italy 20-23 October 2015 (EXTRA-RADSUR2015), arXiv:1602.01914
- Rafferty et al. (2006) Rafferty, D. A., McNamara, B. R., Nulsen, P. E. J., & Wise , M. W., 2006, ApJ 652, 216-231
- Randall et al. (2011) Randall, S. W., Forman, W. R., Giacintucci, S., et al., 2011, ApJ 726, 86
- Rossetti et al. (2011) Rossetti, M., Eckert, D., Cavalleri, B. M., et al., 2011, A&A 532, A123
- Ruppin et al. (2021) Ruppin, F., McDonald, M., Bleem, L. E., et al., 2021, ApJ 918, 43
- Sanderson et al. (2006) Sanderson, A. J. R., Ponman, T. J., & O’Sullivan, E., 2006, MNRAS 372, 1496-1508
- Sault et al. (1995) Sault, R. J., Teuben, P. J., & Wright, M. C. H., 1995, in ASP Conf. Ser. 77, Astronomical Data Analysis Software and Systems IV, ed. R. A. Shaw, H. E. Payne, & J. J. E. Hayes 433
- Smith et al. (2001) Smith, R. K., Brickhouse, N. S., Liedahl, D. A., & Raymond, J. C., 2001, ApJ, 556, L91
- Sutherland & Dopita (1993) Sutherland, R. S., & Dopita, M. A., 1993, ApJS, 88, 253
- Vikhlinin et al. (1998) Vikhlinin, A., McNamara, B.R., Forman, W., et al. 1998, ApJ, 498, L21
- Vikhlinin et al. (2006a) Vikhlinin, A., Kravtsov, A., Forman, W., et al., 2006a, ApJ, 640, 691
- Voit & Nulsen (2005) Voit, G. M., & Donahue, M., 2005, ApJ 634, 955-963