Distributed HVDC Emergency Power Control; case study Nordic Power System
Abstract
Frequency Containment Reserves might be insufficient to provide an appropriate response in the presence of large disturbances and low inertia scenarios. As a solution, this work assesses the supplementary droop frequency-based Emergency Power Control (EPC) from HVDC interconnections, applied in the detailed Nordic Power System model. EPC distribution and factors that determine the EPC performance of an HVDC link are the focus of interest. The main criteria are the maximum Instantaneous Frequency Deviation and used EPC power. The presented methodology is motivated based on the theoretical observation concerning linearized system representation. However, the assessed and proposed properties of interest, such as provided EPC active and reactive power, their ratio, and energy of total loads and losses in the system due to the EPC, concern highly nonlinear system behavior. Finally, based on the obtained study, remarks on the pragmatical importance of the EPC distribution to the frequency nadir limitation are provided.
Index Terms:
Control distribution, Frequency Containment Reserves, Emergency Power Control, HVDC power control, Nordic Power System.I Introduction
In the presence of today’s trend of integrating renewable energy sources and increasing the capacity of High Voltage Direct Current (HVDC) interconnections, there is a natural consequence of a reduction in power system kinetic energy. In other words, system inertia tends to fall more often below values in which controlling frequency after a large disturbance becomes a significant challenge [1], [2]. In these cases, conventional Frequency Containment Reserves (FCR) provided by synchronous generators equipped by governor-turbine systems may be insufficient to provide adequate speed of response [3], [4]. Failing to do so, frequency may not be kept within the acceptable margins, and protection schemes are activated in the form of load shedding or generations tripping, leading to considerable costs.
Therefore, technical and economic motivations have already been recognized for introducing Fast Frequency Reserves (FFR) and power support over HVDC interconnections [5], [6]. Depending on the system characteristics, the responsible System Operator (SO) defines compliant requirements towards reserves eg. FFR or HVDC systems. The essential properties of reserves are related to the capacity, control method or strategy, and market integration. Moreover, all of these aspects must be coordinated to bring an efficient and implementable solution. Procuring more reserves may decrease the frequency deviations. However, providing much more than needed implies an increased cost. Therefore, it is of interest to investigate the right amount of reserves and their speed of response to satisfy SO requirements.
The total inertia and damping characteristic are considered unique system properties, vital for frequency control, and typically aimed to be augmented by inverter-based units. [7], [8]. Thus, units’ locations and the problem of distributing the reserves in the system are neglected. The primary reason is the assumption of a decoupling between active power-frequency and reactive power-voltage loops [9].
More recent work [10]-[15] opened the question of locations of the (fast) active power units in the context of their frequency control effectiveness. Studies [10] and [11] have shown how virtual inertia should be distributed among various locations in the grid to provide adequate support to the system in the presence of single or multiple disturbances. Effectively, these studies analyzed the solutions to unequal distribution of mechanical inertia in large systems given in [12]. Further extensions of this problem are done in [13] - [15], where the damping coefficient distribution is also considered.
Comparing the different approaches, one can notice that the central aspect of the distribution issue is criteria that define satisfying response performance in terms of frequency deviation. An evaluation criterion is most often the maximum Instantaneous Frequency Deviation (IFD). In addition, studies discussing virtual inertia typically use the maximum Rate of Change of Frequency (RoCoF), which is important for some systems such as Great Britain or Ireland [16], [17]. Considering more factors in criteria as advanced studies in [13] and [15] do, such as the specific cost of power/energy delivered from the supporting units or frequency energy output to an impulse disturbance, bring more attention to the distribution matter. However, this does not necessarily imply the problem’s urgency since, for SOs, control optimization may not be a priority, and many factors are hard to measure or penalize adequately.
Even though recent studies opened the question of active power support distribution, they neglected the significant nonlinearities which follow the system response after a large disturbance. Those originate from the complex models of loads and other controllers, both frequency and voltage based, carefully designed and distributed in large systems impacting the overall system response.
The analysis in[18] illustrated the impact of voltage controllers and the importance of detailed large-scale systems for accurate FCR assessment. It is shown how excluding voltage dynamics, implying the change to total loads and losses response, can lead to incorrect IFDs values. Furthermore, besides directly providing additional active power, the studies [19]-[22] investigated the actual utilization of reactive power/voltage control for the frequency support purpose, while [23] analyzed different load models’ impact.
The focus of this work is the problem of distribution of Emergency Power Control (EPC) utilized in the HVDC interconnections. The EPC presents a specific ”emergency” control measure to support the FCR during severe disturbances (one form of FFR). Even though quite unlikely to occur, during these conditions, the system must respond adequately i.e., keep the maximum IFD within the required margins and avoid further disconnections of loads or generation.
EPC is applied as supplementary active power control loop in HVDC converter. Depending on the type of converter, Line Commutated Converter (LCC) or Voltage Source Converter (VSC) type, one can notice different nature in dynamic active/reactive power response coupling [9]. In other words, sometimes providing active power also implies the reactive power response. These have not been studied before in the context of HVDC EPC, and their consideration is one of the contributions of this work.
This study aims to answer how the choice of HVDC link providing EPC, i.e. how its location in the system, impacts the maximum IFD. The approach investigates each HVDC link individually with the same EPC gain. The analyzed test case is large-scale Nordic Power System (NPS) experiencing highly nonlinear behavior after large disturbances. As the vital factors of interest, this paper is the first of its kind to address:
-
•
responses of both active and side-effected reactive power due to EPC from the chosen HVDC link;
-
•
dynamic responses of total loads and losses implied by the EPC.
It is proposed how these factors should be considered and correlated with the EPC performance between various HVDC links. The theoretical motivation to support this methodology is also provided. Furthermore, the results of multiple disturbances is presented. Finally, the difference between efficient and inefficient distribution is illustrated through the needed total EPC active power.
II Methodology
The purpose of EPC is to support the frequency response after a significant power imbalance. That usually means the EPC activation comes with the specified frequency threshold, and reducing the maximum IFD is the main task of interest. 111Since there is the activation threshold, the maximum RoCoF is not affected. Suppose there are many HVDC links potentially involved in the EPC service. In that case, the question is how EPC should be distributed and how significant that distribution is for the presented task? This work assesses this question in a case study with the NPS where, besides existing HVDC links, also the near-future links are involved. By studying this problem, one can understand how to use less power to provide more efficient frequency support for the investigated system. Less power also means less impact in the providing systems.
Previous studies of EPC in the NPS in [3] and [24] confirmed that droop frequency-based method, in overall, outperforms the currently applied ramp/step one. It is also shown that this type of HVDC supplementary power control improves the system small-signal stability [25], [26]. Furthermore, ENTSO-e and the respective SOs proposed in [6] that frequency droop EPC should be considered for the future operation in the NPS. That is why this study also utilizes the droop frequency-based EPC method. Nevertheless, it can be noted that one can apply the same methodology even for the other choice of the EPC design.
To analyze and compare the performance among different HVDC links’ EPC, this study is interested in two aspects: i) the power responses of an HVDC link, and ii) respective system response investigated through total AC system loads and losses. The first one depends on the type of HVDC converter, its control modes, and operating condition. The latter is a function of the first, but also depends on the HVDC and disturbance locations. These relationships are explained in more detail in the following subsections. The analysis is given in the context of slower dynamics concerning system frequency control and converters’ outer control loops.
II-A The relationships between HVDC active and reactive power responses
LCC HVDC
According to [9], reactive power consumption (LCC always consume reactive power) can be defined with the following:
| (1) |
where and are active and reactive power of LCC, respectively, and the parameter is the angle by which the converter line current lags its voltage. Relationship (1) is valid for both rectifier and inverter, i.e., regardless if HVDC LCC is importing or exporting power, is positive since in the LCC power flow is predetermined.
In dynamic assessment, assuming that LCC uses the current set point to control the active power (as in the test cases of this work), then besides , also and are affected [9], as seen from:
| (2) | ||||
where , , and are the ”direct” properties of current, voltage, and no-load and zero firing angle voltage, respectively. The angle is either ignition delay ( for rectifier) or excitation advance ( for inverter) angle. Reactance reflect the commutation overlap phenomena and is the number of LCC bridges in series. More details are provided in [9].
From here, it is observed that active and reactive LCC power control are coupled. The level of coupling depends on the operating point and LCC control design.
Even more, each LCC has reactive shunts switching on and off with predefined number of steps and power sizes. Their purpose is to support the voltage at Point of Common Coupling (PCC) and compensate for the reactive power consumption of an LCC. The activation is triggered at the specified LCC reactive power levels [9]. These ones are also taken into account when analyzing the EPC responses provided by LCC HVDC. 222In the system, there are also additional shunts to support the voltage stability regardless of the HVDC LCC links.
VSC HVDC
The reactive power of VSC HVDC can be decoupled from its active power when the converter is set to reactive control mode. However, that is not the case when VSC controls the AC voltage at the PCC. That is because different active power injections affect the voltage magnitude at PCC.
After a significant active power disturbance, besides frequency, voltage magnitudes are also disturbed. Voltage controllers installed in both converters and generators modify the reactive power output to reduce these oscillations. When EPC is additionally introduced, these reactive powers are further affected (since everything is coupled).
These phenomena could be quite nonlinear and challenging to evaluate even more when the reactive current limits implemented in the converters are reached. Nevertheless, in further analysis, the effort is provided to consider those nonlinearities and recognize the properties of interest.
II-B The motivation from the linearized single-EPC single-frequency model
First, the model is linearized in order to motivate which property adequately reflects the HVDC reactive power contribution due to the EPC. The system is assessed with the EPC from the HVDC link, and the EPC active power is defined as:
| (3) |
where is the EPC gain (MW/Hz) and is the measured frequency deviation in the feedback loop.
Recognizing there is a certain coupling between active and reactive power in the HVDC control 333The star ”*” represents the property implied due to only EPC—meaning that it is zero when there is no EPC., let this coupling be represented through such that:
| (4) |
Both powers have positive direction of injection into the bus. Considering the control mode and HVDC type, it can be noticed that:
The closed loop system with a disturbance as input and frequency as output is shown in Fig. 1.
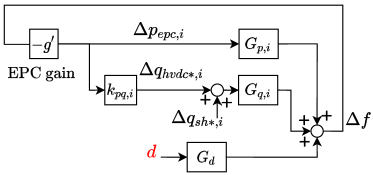
The transfer functions , , and represent the input-output mapping between EPC active and reactive power, and disturbance (respectively) to frequency. The shunt reactive power is assessed as a separate input since it is not directly connected to the frequency.
Then, the frequency can be represented through inputs and such as:
| (5) |
The special cases of this equation are:
Further, (5) can be reformulated in the following form:
| (6) |
where:
| (7) |
It is interesting to observe that , or equivalent, taking into account the shunt participation , impacts the frequency response. Therefore, the analysis should not focus on the side-effected reactive power alone but rather on its ratio with active power response due to EPC. In the following subsections, it is proposed how to also consider nonlinearities and their impact on the response.
Remark: The previous observations are not based on rigorous analysis since the system is quite simplified, but they provide insights which variables could be of potential interest in the following studies related to the detailed nonlinear model representation.
II-C Analysis of AC system loads and losses responses
As defined in (3), activation of active power EPC is in proportion to the frequency deviation i.e. less deviation means less EPC power provided for the same EPC gains. However, that information is not sufficient to explain what is happening with the overall system response. Therefore, the proposal focuses on assessing the EPC impact on the total loads and losses in the system.
The location of the EPC may matter more if the loads are voltage-dependent and the flows change affect the losses in the system. The reasoning is that power injections impact the (nearby) load voltage magnitudes, affecting the load power and then finally, the frequency response. For example, in under-frequency cases, their increase negatively impacts the efforts to reduce the frequency deviations. Activating the EPC in various locations reflects on the total active power of loads and losses differently. Therefore, there is an interest to correlate them to EPC performance to improve the frequency nadir.
It can be noted that even though these are challenging to assess in large systems, the total changes in loads due to EPC are typically condensed in the nearby voltage-dependent loads. Also, the response of losses can be correlated to disturbance and EPC locations by considering the power flow scenario in the AC system.
II-D Testing the individual HVDC EPC through simulations and assessing the overall response
The initial scenario is a dimensioning incident with only FCR. In that scenario, there is no HVDC active power contribution. To compare, the performance is evaluated for each link, one activated at a time, in the same scenario with the same EPC gain (MW/Hz).
The idea is to compare assessment criteria with the EPC response for active and reactive power HVDC (plus shunt) contributions, changes in active power loads and losses, and frequency improvement. The focus is on the frequency response until the maximum IFD, since that is the primary property of interest.
While testing the individual EPC performance of the HVDC link, the idea is to study the difference between cases (A) and (B) defined as:
-
•
(A) FCR only, and
-
•
(B) FCR plus one EPC case of the HVDC link.
The mechanisms behind the difference in performance are explained through reactive power impacting the loads and the transmission losses both impacted by the location of EPC support and disturbance. The values and assessment criteria of interest are:
-
•
EPC active power injection:
(8) -
•
EPC reactive power change as a side effect of EPC:
(9) where is an inherent HVDC/ shunt (in case of LCC) reactive power response;
-
•
The integral of a ratio between total reactive power change due to EPC and EPC active power support until the time of the frequency minimum :
(10) The rationale is that the IFD is a function of the active power imbalance during the time from the disturbance to the IFD. Here, (10) captures the coupling of the reactive and active power hence the impact from reactive power.
-
•
Total system load energy change due to EPC injection until the time of frequency minimum , defined as:
(11) where:
(12) and is a total system active power load response; The rationale in (11) is the change in loads in the time from the disturbance to the IFD.
-
•
Total system losses energy change due to EPC injection until the time of frequency minimum , defined as:
(13) where:
(14) and is a total system active power losses response;
-
•
The improvement in the maximum IFD (nadir) due to EPC, obtained as:
(15)
Assessing each link identifies the size of each factor and how they differ. Finally, the comparison among HVDC links performance is given for the various disturbance sizes and locations.
Remark: It can be noted that there is no strictly fair and overall comparison between the HVDC links regarding the EPC since one would need to keep the same operating point and isolate the impact of the active and reactive power, which are coupled. That is not happening in the actual case with constant operating point change, various disturbances, and all nonlinearities. However, the goal here is to analyze the dominant factors in the EPC performance and specific characteristics for the given scenario and NPS test case.
III System model
The studies performed in this work are applied to the Northern European AC/DC power system test case, with the full system description regarding the NPS, HVDC links, neighboring system equivalents, and the North Sea Wind Power Hub (NSWPH) given in [18]. Those descriptions relate to the modeling details, which are carefully chosen to serve the studies of frequency control assessment in the current and near-future scenarios for the NPS. This manuscript provides only the changes to the model given in [18] and the most essential properties needed to follow the context of work. Since all components are represented by generic models and no proprietary information is involved, the model has been made publicly available and can be accessed at [27] and used through the DigSilent PowerFactory 2020 software [28] (or newer).
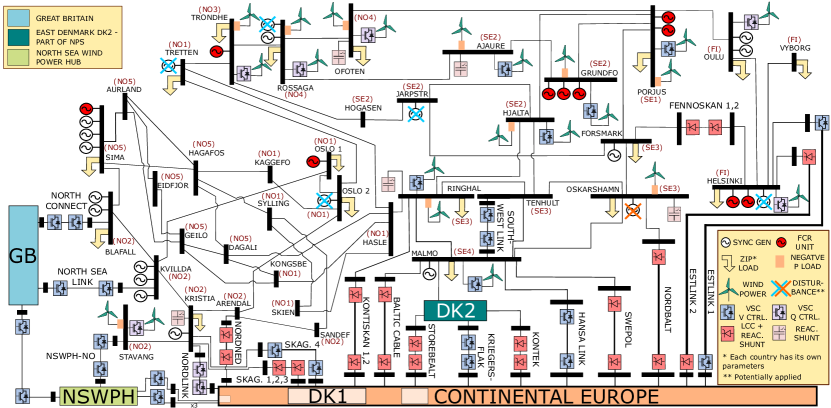
The single line diagram of the NPS part is given in Fig. 2. The figure includes the legend with the essential elements used in the illustration. Since the study analyzes the NPS, the single line diagram comprises Finland, Sweden, Norway, and HVDC interconnections. DK2 (part of NPS) is simplified due to its smaller geographical and system size, and large complexity.
The focus of interest is the NPS response for the largest N-1 power disturbance, the trip of nuclear power plant Oskarshamn 3, marked with an orange ”X” sign over a generator in Fig 2. This is a dimensioning incident for the FCR study in the NPS, and it creates a power step disturbance of 1450 MW and 103 MVAr with a kinetic energy loss of 3.29 GWs. The response constraints are defined such that the maximum allowed IFD and Steady-State Frequency Deviation (SSFD) are 0.9 Hz and 0.4 Hz, respectively [18]. Other disturbances, indicated with the blue ”X” signs in Fig. 2, are also analyzed.
The FCR units, mainly responsible for taking care of a large disturbance, are distributed among ten synchronous generators marked red in Fig. 2. The total regulating strength of the FCR is 3468 MW/Hz, designed to ensure the SSFD is below 0.4 Hz. Considering the typical turbine dynamics of FCR units in the NPS, the dynamic parameters of the governors are tuned to fulfill the exiting FCR dynamic requirements presented in [4].
To highlight the challenges in the frequency control, the inertia constant of non-hydro generation is reduced by half compared to the model given in [18] 444There is no clear guideline on which nuclear or fossil-fuel units will be decommissioned in the future (apart from the ones already removed). Therefore, the alternative way of assessing lower inertia values was to reduce generator inertia constants of all non-hydro units.. In that way, the total kinetic energy of the system is 104.8 GWs, which is slightly smaller than the minimum inertia scenario ever recorded in the NPS [29] - 110 GWs. Considering that the rated power of synchronous machines is 36.9 GW, the system inertia constant is then s. It can be observed that now, FCR alone cannot keep the maximum IFD within the allowed margin of 0.9 Hz, and additional support from the EPC is required.
The test system has both current and future LCC and VSC HVDC interconnections that can be utilized for the EPC (all of them besides the Kriegers Flak). The operating point was adjusted according to the commonly observed power flow orientations in HVDC links and load centers to consider a plausible scenario for the future system. Consequently, HVDC links do not have the same headroom for providing the EPC, as shown in Table LABEL:tab:HVDCall. represents the rated power of the link555In reality, the future NSWPH-NO link’s capacity is still uncertain, and it might be set/decreased to 1400 MW., while is its import active power.
| # | Name | Acronym | Type | ||
|---|---|---|---|---|---|
| (MW) | (MW) | ||||
| 1 | Baltic Cable | BC | LCC | 600 | 276 |
| 2 | Estlink 2 | EST2 | LCC | 650 | -468 |
| 3 | Kontek | K | LCC | 600 | 350 |
| 4 | Kontiskan 1 | KS1 | LCC | 380 | 200 |
| 5 | Kontiskan 2 | KS2 | LCC | 360 | 180 |
| 6 | NorNed | NoNd | LCC | 700 | -450 |
| 7 | Storebaelt | SB | LCC | 600 | 100 |
| 8 | Skagerrak 3 | SK3 | LCC | 500 | -350 |
| 9 | SwePol | SwPl | LCC | 600 | 100 |
| 10 | Skagerrak 1-2 | SK12 | LCC | 500 | -250 |
| 11 | NordBalt | NB | VSC | 700 | -600 |
| 12 | Estlink 1 | EST1 | VSC | 350 | -251 |
| 13 | Skagerrak 4 | SK4 | VSC | 700 | -250 |
| 14 | Hansa link | HL | VSC | 700 | 400 |
| 15 | Nord Link | NL | VSC | 1400 | -400 |
| 16 | North Connect | NC | VSC | 1400 | -487 |
| 17 | North Sea Link | NSL | VSC | 1400 | -787 |
| 18 | NSWPH-NO | NSWPH | VSC | 2100 | -443 |
The applied EPC method is droop frequency-based with a frequency threshold of Hz. Each HVDC link measures its local frequency (Hz) and, when activated, provides additional support by changing the active power reference by (MW) such as:
| (16) |
where (pu)/(MW/Hz) is the EPC gain and Hz is nominal frequency.
As shown in [18], depending on specific voltage control distribution in the system, there is a different maximum IFD. That is why it is necessary to carefully design the reactive power/voltage control applied in both generators and converters. All the generators illustrated in Fig. 2 and those with rated power above 40 MVA have implemented automatic voltage regulators and Power System Stabilizers (PSSs) to improve rotor angle stability.
An estimated onshore and offshore wind integration is included through VSC converters and negative active power loads. Following the current standards in the NPS, the ”wind” VSCs integrated in Norway, Finland and Denmark control the reactive power. However, the ones installed in Sweden control the AC voltage to compensate for the loss of voltage control implied by the conventional generator decommission. Also, all VSC HVDC links control the AC voltage, besides Nord Link (NL) and NSWPH-NO. It is important to highlight that the reactive current of the VSCs has to be limited to 0.3 pu, and dynamic parameters controlling it are adjusted to avoid the bang-bang effect while providing voltage support during large disturbances.
All LCC HVDC links have transformers with load tap changers and reactive shunts at both sides. Shunts have capacities equal to half of the converter’s rated power. They are activated with five identical steps and a time constant of 0.5 s to support the voltage profile after faults or disturbances.
Loads are represented as static ZIP models with parameters obtained from the Nordic TSOs’ study [30]. From here, it is noted that active power loads are voltage-dependent, having the possibility to impact the frequency response, which is vital for the analysis in this work.
IV Results
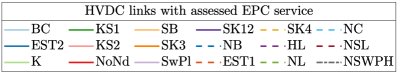
In this section, the case studies illustrate the individual performance of each HVDC EPC support for the same MW/Hz gain in the presented NPS test case. The performance is assessed with respect to the improvement in maximum IFD, defined in (15). The acronyms of HVDC links tested for the EPC support are given in Fig. 3 representing the set , with the colors used for further plots and noticeable difference between marking LCC (solid lines) and VSC links (dashed lines). This analysis aims to answer how the distribution of EPC matters and the mechanisms behind. The performance is evaluated by the difference in the response between only FCR (case A) and EPC activated on one HVDC link (case B).
IV-A FCR response for the dimensioning incident
Initially, the system response is presented in Fig. 4 for the FCR-only case (A), where the applied disturbance is the trip of nuclear power plant Oskarshamn 3. Left plots in Fig. 4 show the frequency response of ten FCR units distributed in the system and loads’ voltage magnitude response in the whole system, on the right666DK2 area contains much more loads, but only four of them are given since there is a similar response from the rest of them.. From these figures, it can be concluded that the system has a solid level of damping in-between frequencies but poor common-mode damping. That means PSSs provide sufficient support to system small-signal stability, while the low inertia implies large (system) frequency deviation. These oscillations can also be observed in voltage magnitude plots. Due to the more localized nature, voltage responses have various deviations across the system. They are a function of distributed system parameters and voltage control, which have to be carefully designed, especially for the cases of large disturbances.
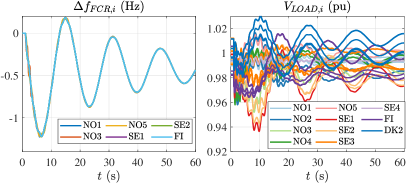
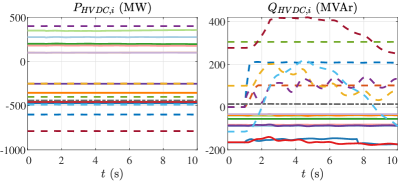
In the FCR-only scenario, the inherent responses of HVDC links’ active (on the left) and reactive powers (on the right) are presented in Fig. 5. From here, one can see that active powers do not change (almost at all) since there is no supplementary action (i.e. no EPC). That is also the case for the reactive powers unless the VSC HVDC links control the AC voltage at PCC without reaching the current limit. That refers to a typical converter 0.3 pu reactive or 1 pu absolute current limit.
The responses of voltage and frequency must be stable and within the required limits, which is the case for voltage () pu, but not for frequency where the maximum allowed frequency deviation is Hz. Therefore, the system needs EPC support, and further, it is studied how various HVDC links could reduce the maximum IFD.
IV-B Individual EPC HVDC testing based on frequency improvement
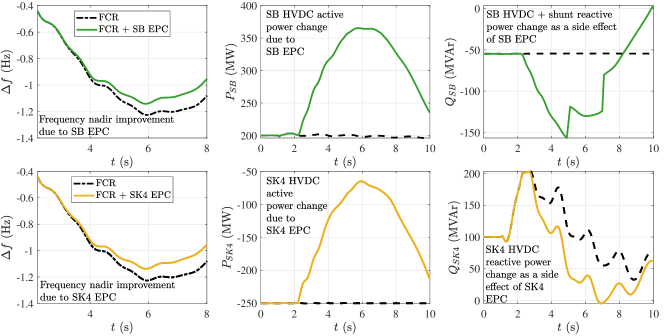
Each link is individually tested with the EPC gain equal to 250 MW/Hz, with the control defined by (16). Two cases of HVDC links, LCC type StoreBealt (upper graphs related to SB) and VSC type Skagerrak 4 (bottom graphs related to SK4), are given in Fig 6 to illustrate the contribution of individual EPC support.
Figure 6 shows the system response comparison due to single EPC support for the frequency and active and reactive power change of the same link; graphs are presented from left to right, respectively. Active power change is a direct consequence of control defined in (16), while reactive power change is a side effect resulting from control coupling. The main criterion of the single EPC performance is the ability to improve the maximum IFD (defined in (15)), which is shown in the left graphs. The correlation to different improvement levels is partly explained through the change in the ratio between reactive and active power response behavior until the moment of nadir.
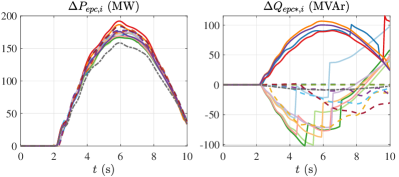
In further, all HVDC links which can potentially participate in EPC are assessed individually for the presented disturbance. To compare them, the focus is given only on the difference between single-EPC (B) and FCR-only (A) cases since the latter one is the same for all. Eighteen responses of HVDC links are given in Fig. 7 (meaning, there are eighteen different simulations), which are connected to the exact coloring and notation of Fig 3. Power responses represent a difference between the applied EPC and the FCR-only case for the link which provides EPC. 777There are slight changes in HVDC power response between other non-providing EPC links among different cases, but those are neglected. However, it is also discussed how the nearby VSC HVDC could interact with the EPC providing LCC HVDC links.
The applied EPC gain should not be too high and imply the violation of active power limits of any tested links, and that is satisfied by fulfilling the following condition:
| (17) |
where, referring to link of set illustrated in Fig. 3, is the available EPC capacity in MW, and is the maximum IFD for the FCR-only case, equal to 1.226 Hz (see Fig. 4).
On the other side, the tested gain could be smaller, but in that case, there will be a marginal impact on the system response and nonlinearities of required EPC response will not be highlighted. EPC gains (pu) are different among each other, but (MW/Hz) are the same in order to have the fair comparison.
As explained previously, it is expected that the response of active powers are quite similar, while reactive powers behave differently. LCC HVDC links during normal operation consume power regardless of import or export scenario. However, consumption of reactive power has opposite behavior when EPC is applied depending on:
-
•
LCC import plus EPC implies an increase in reactive power consumption;
-
•
LCC export plus EPC implies a decrease in reactive power consumption,
following the relationship defined in (1) and (2). It is assumed that EPC injects a positive power into the grid following an under frequency event.
That opposite behavior of reactive power of LCC HVDC links during EPC support implies different impact on terminal voltage, and nearby voltage-dependent active power load.
The reactive power response of HVDC LCC links is measured at the high-voltage transformer terminal, so plots in Figs. 5- 7 consider the contributions of reactive shunts. They are activated to support the voltage profile at the LCC PCC and depend on the initial power flow scenario and rating of a converter.
The reactive power response of VSC HVDC links after a large disturbance depends on the converter capacity and parameters responsible for AC voltage control. From Fig.5 it can be observed that some of the links reach their reactive power limits immediately after the fault, while others manage to support the AC voltage more efficiently. Naturally, if no limits are reached, VSC links reduce their reactive power injections comparing the EPC and FCR-only case, as shown in Fig. 7.
Remark: The injections of active or reactive power increase the voltage magnitude of that bus. EPC support increases the active power injection. Then, to control the voltage at the same reference, negative reactive power change is implied from the VSC voltage control loop. That is why dashed lines referring to VSC HVDC (if not saturated) are below zero in Fig. 7.
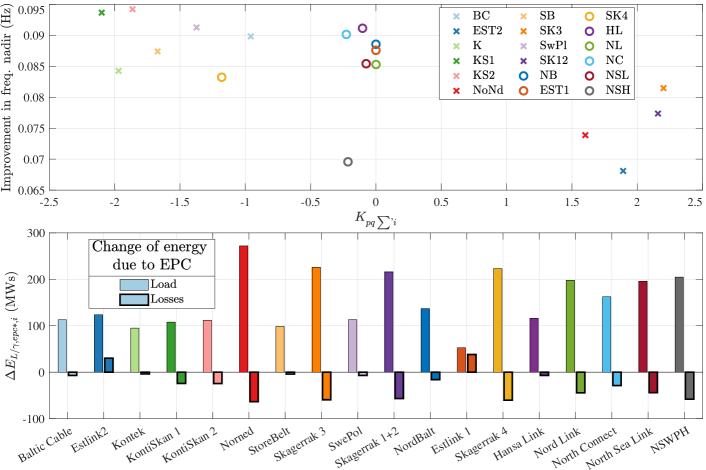
Fig. 8 shows the improvement in frequency nadir values for compared HVDC links as a function , defined in (10). The results of the nadir improvements can be correlated, but they are not strictly explained by , as linearzied approach also indicated with (6) and (7).
To explain further the behavior of frequency response, the change of energy of loads (first bars) and losses (second bars), defined in (11) and (13), respectively, are given in Fig.8. It can be seen that typically, higher improvements in max IFD are correlated to lower increase in loads and losses (their energy)—highlighting the importance of both EPC active and side-effected reactive powers location’s injection.
Observations:
-
•
NorNed link gives the largest overall impact on the summarized loads and losses following the lower efficiency in the nadir improvement;
-
•
Estlink 2 gives the lowest nadir improvement;
-
•
KontiSkan 1 and 2 provide the best improvement in nadir following the high negative value of ;
-
•
VSC links besides Skagerrak 4 have small values of due to reactive current limits, and quite similar impact on the nadir;
-
•
Estlink 1 and 2 are the only ones increasing the losses, which makes sense since they are the only ones providing the support from Finland and ”stress” the load flow even more (see Fig. 2);
-
•
NSWPH HVDC link notably provides lower EPC active power output, as seen in Fig. 7. The main reason is its participation in power-sharing between other links in the NSWPH, as explained in [18]. Therefore, applying the same EPC gain does not provide the same performance as it is the case for ”regular” point-to-point links;
-
•
Results presented in Fig. 8 indicate that SK3 does not provide so much of less frequency improvement than SK4 even though there is a fundamental difference between values. The reason for that is because they are connected to the same bus. Therefore, they also interact with each other, and injection of reactive power by LCC SK3 link is compensated by the reactive power adjustments in VSC SK4 (since its reactive power is not saturated). These adjustments cannot be seen in the plot since the measurements are only given for the link which provide EPC. An alternative to overcome this might be a unique assessment of the links which are connected at the same bus or nearby.
IV-C Results concerning various disturbances
The previously presented results concern the fixed disturbance, which is the most severe one according to N-1 criteria. Nevertheless, it is of interest to analyze different disturbances and if there is a change in links’ EPC rankings regarding their ability to improve the maximum IFD.
The results in Fig. 9 illustrate the ability of HVDC EPCs to provide relative frequency nadir improvements for the different generators trips in the system. The x-axis of the figure shows the zone where disturbance is made and its active power. These generators are also marked with blue color in Fig. 2.
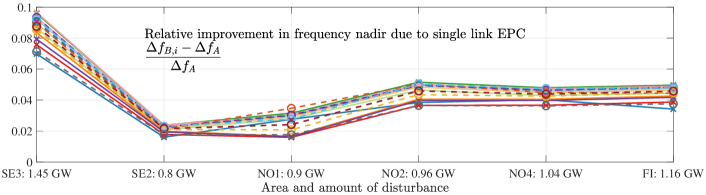
The relative improvement in frequency is the largest for the dimensioning incident. Following the most significant disturbance, there is the most prominent frequency drop, so the EPC has a relatively more effective impact and opportunity to improve the frequency. Depending on the case, there could be various percentage-wise comparisons among links for the rest of the disturbances. The ”NO1” and ”SE2” cases are examples of the largest and smallest difference among links’ EPC performance.
IV-D Summarized EPC response to support the maximum IFD
The previous studies were done for the specified EPC gain in MW/Hz. For the NPS, the relevant total EPC gain is the one that provides the improvement to the maximum allowed IFD of 0.9 Hz. The presented results show that value is reached with different EPC power depending on the EPC distribution.
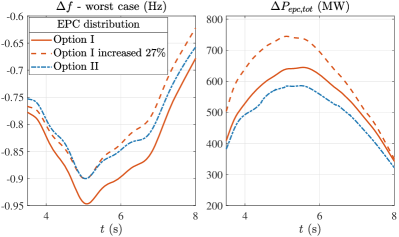
Referring to Fig. 8, let there be two options for EPC distribution with the following MW/Hz gains:
-
•
Option I) (or the ”bad one”) NorNed: 500 MWHz, Estlink 2: 500 MW/Hz, Skagerrak 1: 125 MW/Hz, and Skagerrak 2: 125 MW/Hz;
-
•
Option II) (or the ”good one”) KontiSkan 1: 250 MWHz, KontiSkan 2: 250 MW/Hz, SwePol: 250 MW/Hz, North Connect: 250 MW/Hz, and Hansa Link: 250 MW/Hz.
Both options have the total EPC gain of 1250 MW/Hz by default. Their performance is shown in Fig. 10. Clearly, Option II performs better and can keep the frequency within the limit of 0.9 Hz of deviation, in contrast to Option I. For the EPC distribution Option I to reach 0.9 Hz, an additional increase of 27% of EPC gain is needed (an equal increase on all EPC links), as also shown in Fig. 10. That implies a difference of around 160 MW between total EPC reserves on these two options for the same maximum allowed IFD for the assessed cases.
IV-E Main takeaways
In the following, the study provides the more general observations made from the given results and theoretical findings.
-
1.
EPC decreases frequency deviation by affecting the active power of the utilized HVDC link. However, the question is if there is a difference in performance depending on the location, HVDC type and control design, and operating conditions.
-
2.
The ones that create difference are typically electrically close to large voltage-dependent loads.
-
3.
The EPC of HVDC LCC links may have a different ability to improve the frequency deviation after a large power disturbance depending on if they import or export power. This property implies the sign of their side-effected reactive power response due to the EPC.
-
4.
The contribution of LCC side-effected reactive power can be mitigated by nearby voltage controllers, such as those implemented in VSC or generators. However, that is valid only if those voltage controllers are not saturated, which can happen during a large power disturbance.
-
5.
When VSC HVDC provides EPC, and its reactive power is not saturated, it tends to inject reactive power, which further decreases the frequency deviations.
-
6.
Each operating scenario and predefined disturbance choice define the specific list of ”good” links to utilize for the EPC. They are typically ”importing” LCC links, which are not electrically close to voltage controllers, and VSC, which reactive power does not get saturated during the disturbance. Also, it is preferred that power injections do not increase the losses in the grid.
-
7.
The difference between the ”good” or ”bad” distribution of EPC could imply around 25% of the total EPC active power difference needed to fulfill the same frequency requirements.
V Conclusion
The studies on the carefully designed NPS show that FCR fails to keep the maximum IFD within the defined margins. Therefore, additional support from the HVDC links is assessed in the form of EPC. The main question is how EPC should be distributed when the droop frequency-based control method is applied. To answer that, this study investigated the performance of each HVDC links’ EPC concerning its ability to improve maximum IFD for the specified gain. The rationale to assess different HVDC links is i) injection of additional power in various locations implies a different impact on responses of total loads and losses, and ii) apart from active power change, due to control coupling in HVDC converter, there is an inherent response of reactive power (from both HVDC and shunts) further impacting the response of loads and losses.
Firstly, system linearization showed that the ratio between provided EPC active power and side affected reactive power correlates to the frequency response. To capture the nonlinearities of response, this study considers the integral of the given ratio from the moment of EPC activation to the moment of frequency nadir. It is shown that LCC reactive power response primarily depends on import/export scenario, while VSC on the applied AC voltage control strategy.
It is shown that this property (calculated integral) is well correlated with the rankings in frequency improvement among links but does not fully explain it. The strength of how much the EPC actually affects the improvement in maximum IFD is further investigated through the difference in energy of total loads and losses in the system due to applied EPC until the frequency nadir. For the given system configuration and positions of HVDC links, losses are typically decreased (besides Estlinks), while due to large EPC active power injections, the loads are increased, but to various extents.
The differences in EPC performances are also confirmed for various disturbances, showing that they could vary in relative impact to frequency improvement and links’ comparison.
Finally, to present the result’s importance, this work shows the needed EPC for the two opposite distribution choices, i.e., the good and bad options in terms of performance according to previously obtained results. It concludes that, for the largest disturbance and low inertia scenario, to keep the frequency within limits, the given EPCs are different by around 27% in total EPC gain, reflecting around 160 MW in total EPC power. With further inertia reduction, it is expected for these MW only to increase and the question of EPC distribution to be more pronounced.
Acknowledgment
The authors would like to thank Thierry Van Cutsem, an independent consultant/adviser and a retired Adjunct Professor of the University of Liège and Research Director of the Fund for Scientific Research, for valuable discussions and comments on this work.
This work is supported by the multiDC project, funded by Innovation Fund Denmark, Grant Agreement No. 6154-00020B.
References
- [1] N. Hatziargyriou, J. Milanovic, C. Rahmann, V. Ajjarapu, C. Canizares, I. Erlich, D. Hill, I. Hiskens, I. Kamwa, B. Pal, P. Pourbeik, J. Sanchez-Gasca, A. Stankovic, T. Van Cutsem, V. Vittal, and C. Vournas, “Definition and Classification of Power System Stability – Revisited & Extended,” IEEE Trans. Power Syst., vol. 36, no. 4, pp. 3271-3281, July 2021.
- [2] E. Ørum et al., “Future System Inertia 2,” European Network of Transmission System Operators for Electricity (ENTSO-E), Tech. Rep., Aug. 2018.
- [3] D. Obradović, M. Ghandhari and R. Eriksson, “Assessment and design of frequency containment reserves with HVDC interconnections,” 2018 North American Power Symposium (NAPS), Fargo, ND, 2018, pp. 1-6.
- [4] E. Agneholm (convener) et al., “FCR-D design of requirements – phase 2”, ENTSO-E Report, Jan. 2019.
- [5] ENTSO-E: “Fast Frequency Reserve – Solution to the Nordic inertia challenge,” European Network of Transmission System Operators for Electricity (ENTSO-E), Tech. Rep., Dec. 2019.
- [6] “Operational Limits and Conditions for Mutual Frequency support over HVDC”, ENTSO-e Tech. Rep., 2021.
- [7] S. S. Guggilam, C. Zhao, E. Dall’Anese, Y. C. Chen and S. V. Dhople, ”Optimizing DER Participation in Inertial and Primary-Frequency Response,” IEEE Trans. Power Syst., vol. 33, no. 5, pp. 5194-5205, Sept. 2018.
- [8] R. Eriksson, N. Modig, and K. Elkington, “Synthetic inertia versus fast frequency response: a definition”. IET Renewable Power Generation, 12: 507-514, 2018.
- [9] P. Kundur, Power System Stability and Control, New York, NY: McGraw-Hill, 1994.
- [10] B. K. Poolla, S. Bolognani and F. Dörfler, “Optimal Placement of Virtual Inertia in Power Grids,” IEEE Trans. Automat. Contr., vol. 62, no. 12, pp. 6209-6220, Dec. 2017.
- [11] B. K. Poolla, D. Groß and F. Dörfler, “Placement and Implementation of Grid-Forming and Grid-Following Virtual Inertia and Fast Frequency Response,” IEEE Trans. Power Syst., vol. 34, no. 4, pp. 3035-3046, July 2019.
- [12] B. A. Osbouei, “Local Inertia; Understanding the impact of the distribution of inertial response,” Elia, Belgian transmission system operator, Tech. Rep., Oct. 2018.
- [13] D. Groß, S. Bolognani, B. K. Poolla, and F. Dörfler, “Increasing the resilience of low-inertia power systems by virtual inertia and damping,” in Proc. Bulk Power Syst. Dyn. Control Symp., 2017.
- [14] T. S. Borsche, T. Liu and D. J. Hill, ”Effects of rotational Inertia on power system damping and frequency transients,” 2015 54th IEEE Conference on Decision and Control (CDC), 2015, pp. 5940-5946.
- [15] A. Mešanović, U. Munz, and C. Heyde, “Comparison of , , and pole optimization for power system oscillation damping with remote renewable generation,” in Proc. IFAC Workshop Control Transmiss. Distrib. Smart Grids, 2016, pp. 103–108.
- [16] National Grid, “Operating a Low Inertia System - A System Operability Framework document,” Tech. Rep., Feb. 2020.
- [17] EirGrid and SONI, “RoCoF Alternative and Complementary Solutions Project,” Tech. Rep., Mar. 2016.
- [18] D. Obradović, M. Dijokas, G. Misyris, T. Weckesser, and T. Van Cutsem, “Frequency dynamics of the Northern European AC/DC power system: a look-ahead study,” IEEE Trans. Power Syst., Early Access, Feb., 2022.
- [19] Y. Wan, M. A. A. Murad, M. Liu and F. Milano, “Voltage frequency control using SVC devices coupled with voltage dependent loads,” IEEE Trans. Power Syst., vol. 34, no. 2, pp. 1589-1597, March 2019.
- [20] Z. Akhtar, B. Chaudhuri and S. Y. Ron Hui, “Primary frequency control contribution from smart loads using reactive compensation,” IEEE Trans. Smart Grid, vol. 6, no. 5, pp. 2356-2365, Sept. 2015.
- [21] T. Cui, W. Lin, Y. Sun, J. Xu and H. Zhang, “Excitation voltage control for emergency frequency regulation of island power systems with voltage-dependent loads,” IEEE Trans. Power Syst., vol. 31, no. 2, pp. 1204-1217, March 2016.
- [22] R. Grondin, I. Kamwa, L. Soulieres, J. Potvin and R. Champagne, “An approach to PSS design for transient stability improvement through supplementary damping of the common low-frequency,” IEEE Trans. Power Syst., vol. 8, no. 3, pp. 954-963, Aug. 1993.
- [23] A. Adrees and J. Milanović, “Effect of load models on angular and frequency stability of low inertia power networks,” IET Gener. Transm. Distrib., 13: 1520-1526, 2019.
- [24] D. Obradović, M. Dijokas, A. Tosatto, T. Van Cutsem, and R. Eriksson, “Assessment of HVDC Frequency Control Methods in the Nordic Test System,” in CIGRE 2020, Paris, France, 2020, pp. 1–10.
- [25] D. Obradović, M. Oluić, R. Eriksson and M. Ghandhari, “Supplementary Power Control of an HVDC System and its Impact on Electromechanical Dynamics,” IEEE Trans. Power Syst., vol. 36, no. 5, pp. 4599-4610, Sept. 2021.
- [26] L. Harnerfors, N. Johansson and L. Zhang, “Impact on interarea modes of fast HVDC primary frequency control,” IEEE Trans. Power Syst., vol. 32, no. 2, pp. 1350-1358, Mar. 2017.
- [27] M. Dijokas, D. Obradović, G. Misyris, T. Weckesser and T. Van Cutsem, Northern European AC/DC Power System model, GitHub repository, 2021. Available: https://github.com/thematt199310/NorthEuropeanAC-DCPowerSystem-Model/
- [28] “Powerfactory 2020: User Manual,” DIgSILENT GmbH, Gomaringen, Germany, June, 2020.
- [29] “Record low inertia in the Nordic power system,” Fingrid report, June 26, 2021. [Online] Available: https://www.fingrid.fi/en/pages/news/news/2021/record-low-inertia-in-the-nordic-power-system/
- [30] E. Hillberg, “Development of improved aggregated load models for power system network planning in the Nordic power system Part 2: Method verification,” Cigre 2018 Session, Ref. C4-310 2018, Paris, 2018.