Quantification of Crystal Packing Similarity from Spherical Harmonic Transform
Abstract
In this work, we present a new computational approach to characterize and classify molecular packing in the solid states. The key idea is to project each neighboring molecule (or short contact) from the centered molecule into a unit sphere according to the interaction energy. Consequently, the similarity between two spherical images can be evaluated from the spherical harmonics expansion based on the maximum cross-correlation. We apply this approach to successfully reproduce the previous packing assignment on a small amount of data with an improved categorization. Furthermore, we conduct a packing similarity analysis over 2000 hydrocarbon crystal data sets and uncover a set of abundant packing motifs. Unlike the previous approaches based on the subjective visual comparison at the real space, our approach provides a more robust way to measure the packing similarity, thus paving the way for a rapid classification of large scale crystal data.
I INTRODUCTION
Molecular solids have been extensively used as key components in chemical industries such as medicine Lee, Erdemir, and Myerson (2011), fertilizers, dyes Zhuo et al. (2022), pesticides Yang et al. (2017), and high energy explosives Liu et al. (2018), as well as electronics industry since the discovery of bulk conductivity in polycyclic aromatic compounds in 1950s Kallmann and Pope (1960). While some molecules can aggregate with no particular order, such as amorphous solids, most organic solids are crystalline, and their physical properties largely depend on regularly repeating intermolecular packing. Nevertheless, understanding the packing of molecules is a rather elusive subject due to the variety of molecular shapes. Unlike the packing of spheres in the atomic crystals, geometry analysis on the irregularly shaped molecules appears to be more of an art than a science. It is visually difficult to capture the pattern even for experienced researchers Day and Motherwell (2006).
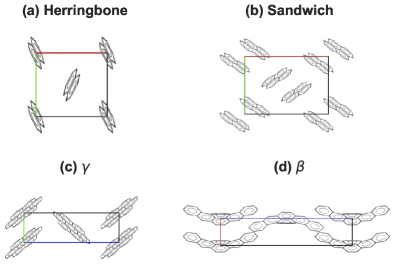
To ease the visual challenge, most early works focused on the simple shapes. Among them, Robertson first proposed to divide planar aromatic hydrocarbons (PAH) into two categories based on the ratio of molecular area to the thickness Robertson (9511). It was found that the disk-like molecules tend to stack together via rigid translation (stack-promoting), while the molecules with smaller areas prefer the glide-like reflections (glide-promoting). Using energetic as well as geometrical criteria, Desiraju and Gavezotti Desiraju and Gavezzotti (1989) extended the categorization of PAHs into four groups and used them as a guide for prediction of crystal packing for new molecules. As shown in Fig. 1, they include (i)herringbone, in which each molecular column has interactions with the nonparallel neighboring molecules; (ii) sandwich, consisting of the herringbone motif with sandwich-type diads; (iii) , the flattened-out herringbone; and (iv) , a layered structure made up of graphite-like planes.
The packing motif concept has been applied to establish the correlations between these materials’ packing and observed physical properties (e.g., charge transport for organic semiconductors Campbell, Yang, and Day (2017); Zhang et al. (2018) and insensitivity for molecular explosives Mathieu (2017)). Despite its popularity in crystal analysis, the definition of four patterns, like many other chemical nomenclatures, lacks a mathematical rigor. From the definition, it is hard to define the boundary between and . Even within the herringbone group, some crystals clearly have different packing as compared to others. Although several tools have also been developed to automate the assignment of packing motif Campbell, Yang, and Day (2017); Loveland et al. (2020); Ito et al. (2020), they sometimes yield inconsistent results due to the subjective choice of projection plane or simply due to the ambiguity of the definition itself.
In addition, the Hirshfield fingerprint has been commonly used to analyze the complex information contained in a molecular crystal structure into a single, unique full colour plot McKinnon, Fabbiani, and Spackman (2007). Derived from the Hirshfeld surface, these 2D-fingerprint plots provide a visual summary of the frequency of each combination of internal and external distances across the surface of a molecule, so they do not only indicate which intermolecular interactions are present, but also the relative area of the surface corresponding to each kind of interaction. Other analysis techniques Motherwell (2010); Spackman, Thomas, and Jayatilaka (2016); Carugo et al. (2017) were also proposed recently. However, the interpretation is either too abstract or too cumbersome, and they also lack a simple criterion to judge if two crystals are truly similar or not. On the other hand, the COMPACK algorithm Chisholm and Motherwell (2005) is commonly used to check if two structures are identical or not when they consist of the similar molecules. Nevertheless, it is not suitable to compare the similarity between two crystals with different constituents, which is important in many crystal engineering applications.
To address the aforementioned challenge, we introduce the image approach in combination with spherical harmonics expansion to quantify the packing similarity of organic crystals. This essentially involves a two-step process. First, we construct the spherical images to represent the molecular packing and energy distribution in a crystal. Second, the similarity of two spherical images (i.e., crystal packing) is computed by the maximum normalized cross correlation in the Fourier space. In the following, we present the methodology and its application to a set of hydrocarbon crystal data. Due to its mathematical rigor, this approach can be fully automated for a rapid classification of distinct crystal packing motifs in a large data set, regardless of the molecular choices.
II Computational Methodology
II.1 Image Representation of Molecular Packing
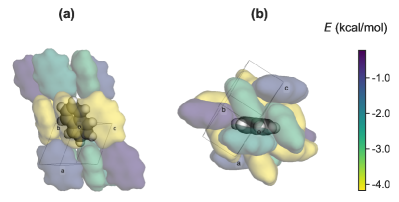
Although it is highly subjective to describe the crystal packing, there is a general consensus that at least two factors are of critical importance. First, the geometry has been widely used to understand the packing. The simplest analysis is to count the coordination number as a function of the cutoff distance. Moreover, the spatial distribution of neighboring molecules can also analyzed with more sophisticated tools Steinhardt, Nelson, and Ronchetti (1983); Honeycutt and Andersen (1987). However, crystal packing is not simply a geometry problem. The intermolecular energy should be taken into account as well, as described by Desiraju and Gavezotti Desiraju and Gavezzotti (1989), as well as the 2D-fingerprint of the Hirshfeld surface McKinnon, Fabbiani, and Spackman (2007). Using the naphthalene crystal (referred as NAPHTA in the Cambridge Crystal Database) as an example, a molecule can be generally considered to have 16 neighbors (see Fig. 2). Based on the intermolecular interactions, these molecules can divided to four tiers, colored in yellow (6), green (6), light blue (2) and deep blue (2). The last tier is often omitted because their interactions are much weaker. One can consider that the most important yellow tier molecules form the equator while the less important green and blue molecules are distributed on the Southern and Northern Hemispheres by following some pattern. Therefore, a good representation should be able to probe such characteristics of the spatial distribution of both molecules and energetics.
Inspired by those previously developed approaches, we construct the spherical image to represent the packing as follows,
-
1.
Choose the center molecule () and find the neighboring molecules or intermolecular short contacts .
-
2.
For each , compute the bonding energies () with respect to . If denotes a molecule, is the sum of all interactions between and .
-
3.
Project each onto the unit sphere centered at with the spherical coordinates . If denotes a short contact (e.g., CC or CH pairs), the center of the atomic pair is used as the reference point to determine . When denotes a molecule, the molecular center shall be used as the reference.
-
4.
For each , place a Gaussian based on in the unit sphere grids.
Therefore, we come up with two definitions of spherical functions as follows:
| (1) |
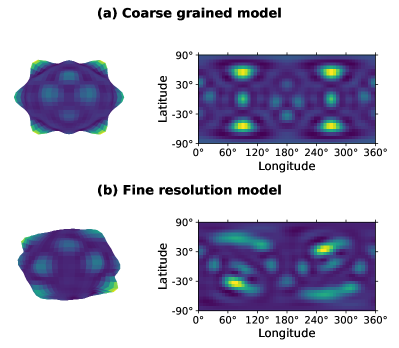
In general, can be considered as a coarse-grained descriptor for the molecular packing. Fig. 3a shows the representation for a naphthalene crystal (see Fig. 2). Unlike other descriptors such as Hirshfield fingerprint plots McKinnon, Fabbiani, and Spackman (2007), the spherical image can be easily interpreted since it retains the spatial information. For instance, the center of each hot spot denotes the position of the neighboring molecule. In NAPHTA, one can clearly find six bright spots at the equator plane, and four less bright spots at each of the hemispheres. This information is consistent with our analysis from Fig. 2. It is essentially the arrangement of hot spots in the sphere. For such a spherical image, it is also common to plot its cylindrical projection as used in the map of the Earth. On the other hand, , shown in Fig. 3b is a break-down version of or a projection of the Hirshfield surface into the unit sphere Spackman, Thomas, and Jayatilaka (2016). It can capture more details when describing the molecular packing. As one can see in the projection map in Fig. 3b, some bright spots becomes rather diffusive, indicating that the intermolecular interaction are from multiple short contacts between the center and surrounding molecules, while the very hot spots suggest that there exist very strong interactions such as CH bonds for the PAH system, or hydrogen bonds for the general cases. Therefore, may be more advantageous for a direct comparison of two different images.
When computing the intermolecular energy, one can use different approaches from empirical force fields to more advanced electronic structure methods. In our case, we follow an empirical atom-atom potential Gavezzotti (1994) due to its simplicity. In addition, it is important to note that the choice of Gaussian smearing is to ensure a smooth distribution when comparing two distinct local environments. As such, it can be also used to characterize the packing environments in an aggregate, amorphous solid, or even liquid. In the following, we will keep = 0.1 Å at the unit sphere for all the subsequent calculations. To construct the spherical image, we uniformly sampled 10,000 grids on the unit sphere according to the Fibonacci method, which is more efficient than the evenly spaced grid sampling on ().
II.2 Real Spherical Harmonic Expansion
For a real valued spherical function , it can be expressed as a series of spherical harmonic functions,
| (2) |
where is the spherical harmonic coefficient, is the spherical harmonic function, and are the spherical harmonic degree and order. The details of are given in the appendix.
Similar to the Fourier transform of a one-dimension spectrum, the purpose of spherical harmonic expansion is to efficiently extract the features from the frequency domain with only a few coefficients. It is straightforward to show that can be calculated by the integral
| (3) |
In general, consists of real valued numbers. Fig. 4a shows the power spectrum of obtained from the naphthalene crystal. Compared to the grids in the real space, these coefficients provide an economical way to store all information to reconstruct the images. With the increase of spherical harmonic degree , it is expected that more details of the function can be described. However, the at very high order simply means the noise. Therefore, there should be a cutoff when it is found that further increase of no longer brings any notable improvement.
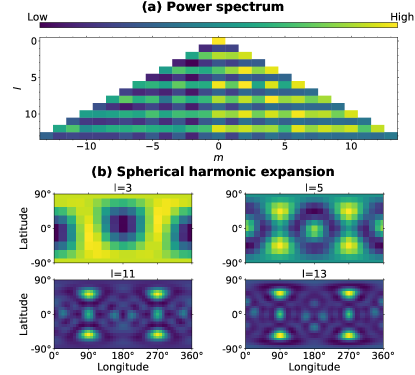
In practice, we construct the spherical image by sampling 10,000 grids on the unit sphere according to the Fibonacci method, and compute the expansion coefficients from eq. 3. Fig. 4b plots the recovered images from different values. In this work, we choose = 13 that should be sufficient to recover all spherical images in high accuracy.
II.3 Cross-correlation on the Sphere
Having established the compact description for one crystal packing (), we can apply the same scheme to describe another crystal named . Obviously, we arrive at the point to address the original question, namely, how to quantify the similarity between and ? It is clear that the use of expansion coefficients is advantageous to reconstruct the original function. Therefore, we wish to compute the similarity based on these coefficients.
One possible solution is to derive a set of rotation-invariant arrays. For instance, the power spectrum has been popularly used in distinguishing the local environments of an atomic crystal Steinhardt, Nelson, and Ronchetti (1983); Bartók, Kondor, and Csányi (2013). However, it can lead to a substantial dimensionality reduction from the original coefficients () to a power spectrum (), This indicates that a lot of information is lost during this process. Indeed, we found this is not sufficient since many different packing patterns may share a similar power spectrum.
To avoid unnecessary information loss, we aim to seek a better metric by considering all coefficients when comparing the similarity. For image similarity analysis, a common way is to analyze the cross-correlation spectrum spectrum between two functions and ,
| (4) |
From the cross-correlation, we can further define a scalar metric at the Fourier space that is bounded between 0 and 1,
| (5) |
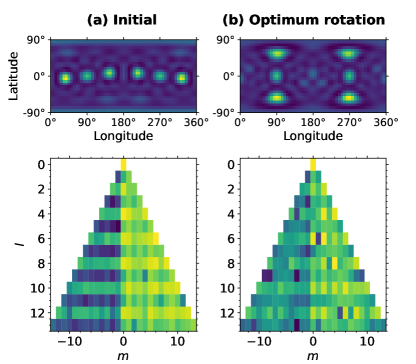
According to the definition, and is identical if . When has a strong deviation from 1, it means and are less similar. However, it is important to note that the coefficients are subject to change under a rotation (, which can also be denoted by a set of Euler angles ). Therefore, we seek to maximize by sampling all possible rotational space of the SO(3). In practice, we perform deterministic quasi random sampling from the low-discrepancy Sobol sequence Joe and Kuo (2008) to generate a uniform grids of on the sphere. Then we rotate accordingly, and is further maximized based on the derivative-free optimization method as implemented in the Scipy.optimize tool box Virtanen et al. (2019). Finally, the search returns the , a scalar number between 0 and 1, as well as the rotation () on that achieves the best match. Fig. 5 shows the initial and optimized rotation for PHENAN when it is compared with naphthalene by following this procedure. For the initial state in Fig. 5a, it returns . However, the true becomes 0.931 after the best rotation is found.
III Results
With this new image approach, we proceed to build the first link between inorganic and organic crystallography. Considering hydrocarbon molecules as the simplest category, like elemental allotropes in the atomic crystals, can we classify them by some packing motif? If so, what will be the most common motifs, like body-centered-cubic (bcc), face-centered-cubic (fcc), hexagonal-close-packing (hcp) and diamond types? In the following, we will first validate the approach in a small set of previously investigated systems and then present our own categorization for a more extended data consisting of over 2000 crystals.
III.1 Regroup of 30 PAH crystals
In 1989, Desaraju and Gavezotti have defined four prototypical packing for about 30 crystals of disk-shaped PAH molecules Desiraju and Gavezzotti (1989). Their pioneering work has significantly influenced the following studies in crystal engineering. With this new image approach, we revisited this data set. We calculated the similarity function for each structure pair. From the computed similarity matrix, we performed an unsupervised hierarchical agglomerative clustering, Fig. 6 displays the resulting dendrogram plot of the 30 PAH crystals. Clearly, our results largely agree with the previous assignment Desiraju and Gavezzotti (1989). Out of 30 samples, we found that 24 of them are closely clustered into three groups, corresponding to the previously assigned herringbone, sandwich and types. This is encouraging, given that our calculation is fully automated without any supervision. From these results, we can also analyze each cluster in detail.
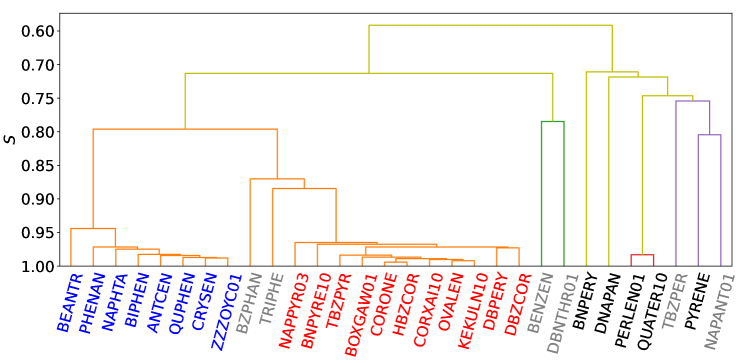
Herringbone is the most common group. Using NAPHTA as the reference, we found that most crystals within this group (colored in red in Fig. 6) have rather high values, including CRYSEN (0.975), ANTCEN (0.974), ZZZOYC01 (0.945), QUPHEN (0.941), BIPHEN (0.938), PHENAN (0.931), BEANTR (0.896).
Sandwich was the least common group with only five examples in its original proposal Desiraju and Gavezzotti (1989). Compared to the herringbone group, the values between each member are smaller. However, they can be clearly grouped to the same big branch (colored in black in Fig. 6) with the unsupervised clustering method, indicating a strong correlation. According to our analysis, there actually exist two types of sandwich crystals. The details will be discussed in the following section.
are almost identical if one only focuses on the arrangement of molecular centers in Figs. 1c-d. They can be only distinguished by counting the ratio of CC and CH interactions Desiraju and Gavezzotti (1989). Indeed, the converted coarse grained tends to group them together (colored in red in Fig. 6) with the high threshold value among three major clusters. However, one can always use the fine resolution model to search for really matched crystals.
Despite the overall agreement, some structures, colored in grey in Fig. 6 cannot be assigned to the same groups as suggested in the previous literature. For instance, the benzene crystal (BENZEN) was grouped to the herringbone type, but the authors also mentioned that it was more like an outlier Desiraju and Gavezzotti (1989). Similarly, several other crystals (including BZPHAN, TRIPHE, DBNTHR01, TBZPER, NAPANT01) clearly exhibit different patterns from any of four types as shown in Fig. 1. The differences can be directly detected by a trivial visual analysis. Therefore, our image approach is more advantageous since it can provide a robust way to detect such outliers without ambiguity.
III.2 Common prototypes on a larger data set
Encouraged by the successful application on the 30 PAH crystals, we systematically inquired all crystals from the Cambridge Structural Database by searching for the systems containing only C and H elements and no more than one molecule in the asymmetric unit. After removing the duplicate entries, we obtained 2007 crystals (see more details in the supplementary materials). This data set serves as the test bed to further validate our image approach.
III.2.1 The naphthalene family
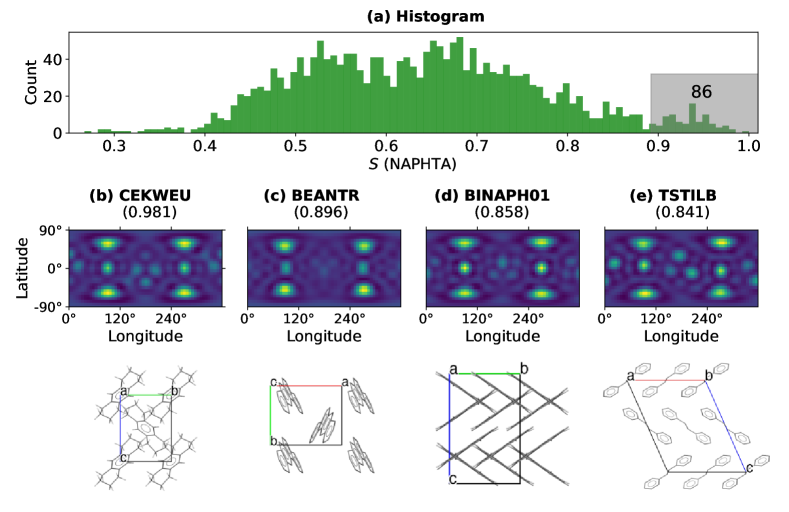
In the early days of small molecule crystallography, the naphthalene crystal was considered to be the common salt of organic crystal Kitaigorodsky (2012). This type of crystal packing was assigned to the herringbone group, which was found to occur more often than any other group. Fig. 7a plots the histogram of the distances between NAPHTA with all other hydrocarbon crystals. The entire distribution can be roughly described by some normal distribution with a mean around 0.6-0.7 (more details can be found in the supplementary materials). Here we focus on the region with high values. Among the entire data set, we found CEKWEU (Fig. 7b) has the best match with NAPHTA. Although the molecule in CEKWEU is not flat, the mapping is obvious as they share the same space group () and Wykcoff position, as well as similar molecular orientation. In addition, Figs. 7c-e displays several structures with different values. By analyzing these patterns as well as the 3D structure, we decide to set a threshold of 0.892, leading to 86 crystals belonging to the naphthalene family.
It is important to note that our similarity calculation does impose any symmetry constraints. As shown in Table 1, several space groups, e.g., , , , , occur more often. Clearly, all of them follow group-subgroup relations. For instance, the molecules containing four or more aromatic rings crystallize in the with Z=2 (e.g., TENCEN, PENCEN), but the overall packing is still close to that of NAPHTA. It would be interesting to collect more data and use them to predict the possible phase transition.
| Space group | # of molecules per cell | Occurrence |
|---|---|---|
| 2 | 34 | |
| 4 | 14 | |
| 4 | 9 | |
| 2 | 7 | |
| 2 | 5 | |
| 4 | 5 | |
| 4 | 3 | |
| 4 | 2 | |
| 4 | 2 | |
| 4 | 2 |
Finally, we emphasize that the coarse-grained image model is still limited by its molecular approximation. Therefore, it is not able to detect the difference in terms of molecular shape. This can be corrected by the fine-resolution model. If we simulate the similarity based on , only three crystals ANTCEN (0.917), CEKWEU (0.834), DMANTR (0.833) can match NAPHTA well. Therefore, we suggest the use of when it is necessary to find a really good match on a reference crystal.
III.2.2 Other common prototypes
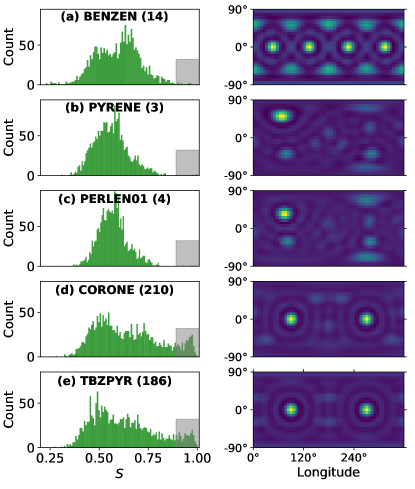
We also checked other common prototypes. The results are summarized in Fig. 8.
BENZEN. The crystal structure of benzene is an outlier of herringbone and was less investigated in terms of packing. It was considered to have a pseudo-fcc arrangement due to strong X-ray reflections at the (111) plane Cox (1958). However, from the projection image as shown in Fig. 8a, such a type can also be explained to have four strongly interacted molecules surrounding the center molecule forming the equator plane, while four secondary interactions are evenly distributed in each of the Northern and Southern Hemispheres. In our explanation, we take into account the fact that the 12 neighboring molecules do not have the same interactions with the centering molecules, which is different from a typical fcc atomic crystal. To our knowledge, there are no previous reports on the crystal sharing the same packing pattern with BENZEN. Here our analysis suggests that at least 14 crystals belong to this family with the threshold distance value of 0.89, such as NUNCUW (0.966) and FAPZOL (0.962).
Sandwich. As shown in Figs. 8b-c, both PYRENE and PERlEN01 has one very bright spot in the upper left of the projection image, however, other less bright spots notably differ from each other. Such subtle differences can be easily ignored when one just focuses on the common projection plane. The between PYRENE and PERLEN01 is only 0.753. Among the entire dataset, such packings do not appear often, with only 3 PYRENE and 4 PERLEN03 types.
. Two representative crystals (CORONE and TBZPYR), as shown in Figs. 8d-e, are nearly identical in terms of the strong characteristics. Both CORONE (210) and TBZPYR (186) can find a lot of structures sharing the same packing pattern. The value between CORONE and TBZPYR is 0.975. Therefore, these two families are expected to have a lot of overlaps.
III.2.3 A complete categorization
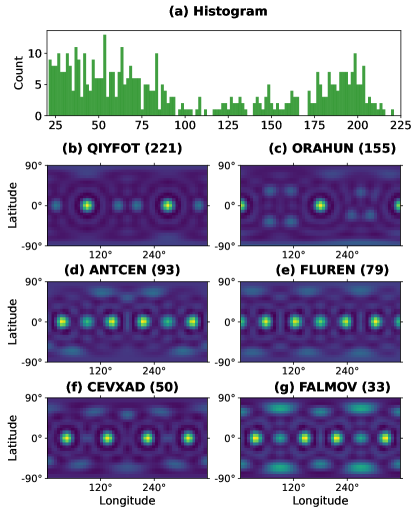
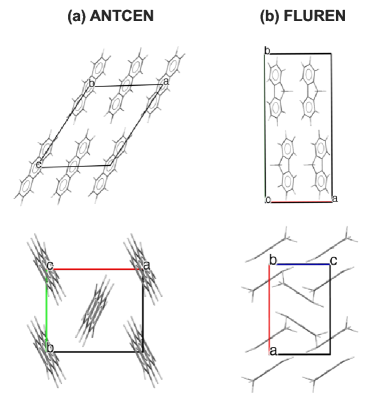
We also performed a systematic pairwise distance analysis for the entire 2007 crystal data set. Using the threshold of 0.88, we count the number of similar structures for each crystal as shown in Fig. 9a. From the distribution, it is clear that many structures possessing the pattern of two strong bright spots (see Figs. 9b-c) are most abundant. This pattern is also consistent with what we have observed in . However, we note that other neighbors in the crystal can adopt different packing sequences. Therefore, there exist many subtypes within this family. The second large group is featured by the pattern of six bright spots forming the equatorial plane (see Figs. 9d-e)). Therefore, the most important feature of this group is that the molecules form close packing layers with strong intermolecular interactions Kitaigorodskii (2003). Within this group, ANTCEN belongs to the common naphthalene family. However, the projection map in Fig. 9d is rotated to put the six bright spots in the equatorial plane. Another frequent-occurring subgroup is shown in Fig. 9e of FLUREN. The structure differs from ANTCEN by the relative shifting of molecules in the adjacent layers. As shown in Fig. 10, the strong similarity between ANTCEN and FLUREN can be easily detected in real space. However, it can also be seen that ANTCEN follows the herringbone pattern and FLUREN adopts the sandwich type from other choices of projection. This drastic difference clearly suggests the limitation of interpreting structure by visual projection. On the other hand, our spherical image representation provides more rigorous comparison by capturing both similarity and dissimilarity at all directions. Finally, we also observe another group of structures with four bright spots in the equatorial plane (see Figs. 9g-h). This is less common. Each structure of this group has only 30-50 similar structures within the 2007 data set.
IV Conclusions
In sum, we present an image approach to characterize and classify molecular packing from the local neighboring environment. The similarity between two crystals (i.e., images) can be evaluated from the spherical harmonics expansion based on the maximum cross-correlation. We apply this approach to investigate the packing similarity analysis over 2000 C-H crystal data sets and categorize them by similarity. Compared to the previous approaches based on visual comparison in the real space, our spherical harmonics expansion provides a robust way to measure the packing similarity. It is suitable for a rapid search for similar crystal structures by crystal packing from a large data set. For instance, there is a general perception that herringbone is high-mobility Mattheus et al. (2001); Jurchescu, Meetsma, and Palstra (2006); Izawa, Miyazaki, and Takimiya (2008). Our tool can clearly be applied to search for new candidates with a similar packing pattern. In the future, a more extensive crystal packing motif library can be built by using this criterion. When such templates becomes available, it can map the relation between molecule properties and crystal packing to guide the design of new materials. Alternatively, it can also be used to complement the crystal structure prediction by chemical substitution of the well defined structural prototypes Reilly et al. (2016).
Acknowledgments
Q.Z. acknowledge the NSF (DMR-2142570) and Sony Group Corporation for their financial supports. The computing resources are provided by XSEDE (TG-DMR180040).
Appendix A Real Spherical Harmonics
The real spherical harmonics are defined as
| (6) |
where normalized associated Legendre functions with the 4-normalized spherical harmonic functions are given by
| (7) |
and is the Kronecker delta function.
The unnormalized associated Lengendre functions are from the following relations
| (8) |
Contributions
O.Z. conceived the idea, wrote the code, and performed the simulation; W.T. participated in code development, Q.Z and H.S wrote the paper.
Data availability
The data sets generated during and/or analysed during the current study are available from the corresponding author on reasonable request.
Code availability
The codes used to calculate the results of this study are available in https://github.com/qzhu2017/PyXtal.
Conflict of interest
Q.Z. have received research funding from Sony Group Corporation.
REFERENCES
References
- Lee, Erdemir, and Myerson (2011) A. Y. Lee, D. Erdemir, and A. S. Myerson, “Crystal polymorphism in chemical process development,” Annu. Rev. Chem. Biomol. Eng. 2, 259–280 (2011).
- Zhuo et al. (2022) Z. Zhuo, C. Wei, M. Ni, J. Cai, L. Bai, H. Zhang, Q. Zhao, L. Sun, J. Lin, W. Liu, et al., “Organic molecular crystal with a high ultra-deep-blue emission efficiency of 85% for low-threshold laser,” Dyes and Pigments , 110425 (2022).
- Yang et al. (2017) J. Yang, C. Hu, X. Zhu, Q. Zhu, M. D. Ward, and B. Kahr, “Ddt polymorphism and the lethality of crystal forms,” Angew. Chem. 129, 10299–10303 (2017).
- Liu et al. (2018) G. Liu, R. Gou, H. Li, and C. Zhang, “Polymorphism of energetic materials: a comprehensive study of molecular conformers, crystal packing, and the dominance of their energetics in governing the most stable polymorph,” Cryst. Growth Des. 18, 4174–4186 (2018).
- Kallmann and Pope (1960) H. Kallmann and M. Pope, “Bulk conductivity in organic crystals,” Nature 186, 31–33 (1960).
- Day and Motherwell (2006) G. M. Day and W. S. Motherwell, “An experiment in crystal structure prediction by popular vote,” Cryst. Growth Des. 6, 1985–1990 (2006).
- Robertson (9511) J. M. Robertson, “The measurement of bond lengths in conjugated molecules of carbon centres,” Proc. R. Soc. London Ser. A 207, 101–110 (19511).
- Desiraju and Gavezzotti (1989) G. R. Desiraju and A. Gavezzotti, “Crystal structures of polynuclear aromatic hydrocarbons. classification, rationalization and prediction from molecular structure,” Acta Cryst. B 45, 473–482 (1989).
- Campbell, Yang, and Day (2017) J. E. Campbell, J. Yang, and G. M. Day, “Predicted energy–structure–function maps for the evaluation of small molecule organic semiconductors,” J. Mater. Chem. C 5, 7574–7584 (2017).
- Zhang et al. (2018) N.-X. Zhang, A.-M. Ren, L.-F. Ji, S.-F. Zhang, and J.-F. Guo, “Theoretical investigations on molecular packing motifs and charge transport properties of a family of trialkylsilylethynyl-modified pentacenes/anthradithiophenes,” J. Phys. Chem. C 122, 18880–18894 (2018).
- Mathieu (2017) D. Mathieu, “Sensitivity of energetic materials: Theoretical relationships to detonation performance and molecular structure,” Ind. Eng. Chem. Res. 56, 8191–8201 (2017).
- Loveland et al. (2020) D. Loveland, B. Kailkhura, P. Karande, A. M. Hiszpanski, and T. Y.-J. Han, “Automated identification of molecular crystals’ packing motifs,” J. Chem. Inf. Model. 60, 6147–6154 (2020).
- Ito et al. (2020) D. Ito, R. Shirasawa, Y. Iino, S. Tomiya, and G. Tanaka, “Estimation and prediction of ellipsoidal molecular shapes in organic crystals based on ellipsoid packing,” Plos one 15, e0239933 (2020).
- McKinnon, Fabbiani, and Spackman (2007) J. J. McKinnon, F. P. Fabbiani, and M. A. Spackman, “Comparison of polymorphic molecular crystal structures through hirshfeld surface analysis,” Cryst. Growth Des. 7, 755–769 (2007).
- Motherwell (2010) W. Motherwell, “Molecular shape and crystal packing: a database study,” CrystEngComm 12, 3554–3570 (2010).
- Spackman, Thomas, and Jayatilaka (2016) P. R. Spackman, S. P. Thomas, and D. Jayatilaka, “High throughput profiling of molecular shapes in crystals,” Sci. Rep. 6, 22204 (2016).
- Carugo et al. (2017) O. Carugo, O. A. Blatova, E. O. Medrish, V. A. Blatov, and D. M. Proserpio, “Packing topology in crystals of proteins and small molecules: A comparison,” Sci. Rep. 7, 1–12 (2017).
- Chisholm and Motherwell (2005) J. A. Chisholm and S. Motherwell, “Compack: a program for identifying crystal structure similarity using distances,” J. Appl. Crystallogr. 38, 228–231 (2005).
- Steinhardt, Nelson, and Ronchetti (1983) P. J. Steinhardt, D. R. Nelson, and M. Ronchetti, “Bond-orientational order in liquids and glasses,” Phys. Rev. B 28, 784–805 (1983).
- Honeycutt and Andersen (1987) J. D. Honeycutt and H. C. Andersen, “Molecular dynamics study of melting and freezing of small lennard-jones clusters,” J. Phys. Chem. 91, 4950–4963 (1987).
- Gavezzotti (1994) A. Gavezzotti, “Are crystal structures predictable?” Acc. Chem. Res. 27, 309–314 (1994).
- Bartók, Kondor, and Csányi (2013) A. P. Bartók, R. Kondor, and G. Csányi, “On representing chemical environments,” Phys. Rev. B 87, 184115 (2013).
- Joe and Kuo (2008) S. Joe and F. Y. Kuo, “Constructing sobol sequences with better two-dimensional projections,” SIAM Journal on Scientific Computing 30, 2635–2654 (2008).
- Virtanen et al. (2019) P. Virtanen, R. Gommers, T. E. Oliphant, M. Haberland, T. Reddy, D. Cournapeau, E. Burovski, P. Peterson, W. Weckesser, J. Bright, S. J. van der Walt, M. Brett, J. Wilson, K. Jarrod Millman, N. Mayorov, A. R. J. Nelson, E. Jones, R. Kern, E. Larson, C. Carey, İ. Polat, Y. Feng, E. W. Moore, J. Vand erPlas, D. Laxalde, J. Perktold, R. Cimrman, I. Henriksen, E. A. Quintero, C. R. Harris, A. M. Archibald, A. H. Ribeiro, F. Pedregosa, P. van Mulbregt, and S. . . Contributors, “SciPy 1.0–Fundamental Algorithms for Scientific Computing in Python,” arXiv e-prints , arXiv:1907.10121 (2019).
- Kitaigorodsky (2012) A. Kitaigorodsky, Molecular crystals and molecules, Vol. 29 (Elsevier, 2012).
- Cox (1958) E. G. Cox, “Crystal structure of benzene,” Rev. Mod. Phys. 30, 159–162 (1958).
- Kitaigorodskii (2003) A. Kitaigorodskii, “Organic chemical crystallography, con sultants bureau: New york, 1961 (originally published in russian by the press of the academy of sciences of the ussr, moscow, 1955); spek, al, single-crystal structure validation with the program platon,” J. Appl. Crystallogr 36, 7–13 (2003).
- Mattheus et al. (2001) C. C. Mattheus, A. B. Dros, J. Baas, A. Meetsma, J. L. d. Boer, and T. T. M. Palstra, “Polymorphism in pentacene,” Acta Cryst. C 57, 939–941 (2001).
- Jurchescu, Meetsma, and Palstra (2006) O. D. Jurchescu, A. Meetsma, and T. T. M. Palstra, “Low-temperature structure of rubrene single crystals grown by vapor transport,” Acta Cryst. B 62, 330–334 (2006).
- Izawa, Miyazaki, and Takimiya (2008) T. Izawa, E. Miyazaki, and K. Takimiya, “Molecular ordering of high-performance soluble molecular semiconductors and re-evaluation of their field-effect transistor characteristics,” Adv. Mater. 20, 3388–3392 (2008).
- Reilly et al. (2016) A. M. Reilly, R. I. Cooper, C. S. Adjiman, S. Bhattacharya, A. D. Boese, J. G. Brandenburg, P. J. Bygrave, R. Bylsma, J. E. Campbell, R. Car, et al., “Report on the sixth blind test of organic crystal structure prediction methods,” Acta Cryst. B 72, 439–459 (2016).
- Wieczorek and Meschede (2018) M. A. Wieczorek and M. Meschede, “Shtools: Tools for working with spherical harmonics,” Geochemistry, Geophysics, Geosystems 19, 2574–2592 (2018).
- Fredericks et al. (2021) S. Fredericks, K. Parrish, D. Sayre, and Q. Zhu, “Pyxtal: A python library for crystal structure generation and symmetry analysis,” Comput. Phys. Comm. 261, 107810 (2021).