Top quark mass measurements at the threshold with CEPC
Abstract
We present a study of top quark mass measurements at the threshold based on CEPC. A centre-of-mass energy scan near two times of the top mass is performed and the measurement precision of top quark mass, width and are evaluated using the production rates. Realistic scan strategies at the threshold are discussed to maximise the sensitivity to the measurement of the top quark properties individually and simultaneously in the CEPC scenarios assuming a limited total luminosity of 100 fb-1. With the optimal scan for individual property measurements, the top quark mass precision is expected to be 9 MeV, the top quark width precision is expected to be 26 MeV, and can be measured at a precision of 0.00039. Taking into account the uncertainties from theory, background subtraction, beam energy and luminosity spectrum, the top quark mass can be measured at a precision of 14 MeV optimistically and 34 MeV conservatively at CEPC.
1 Introduction
Top quark, the heaviest fundamental particle observed so far, plays an important role in the Standard Model (SM). It provides the strongest coupling to the SM Higgs boson and opens doors to new physics beyond the SM (BSM). Till now, the top quark mass have only been measured at hadron collisions, e.g. the Tevatron and the Large Hadron Collider (LHC), using the direct reconstruction of the invariant mass of the top quark decay products. In future electron-positron colliders the top quark mass can be measured not only by the direct reconstruction but also by a scan on the centre-of-mass energy at the \ttbarthreshold. The cross-section of \ttbarincreases sharply as the centre-of-mass energy going through the \ttbarthreshold and depends strongly on the top quark mass, width and , which provides a sensitive probe to these measurements. This is the so-called threshold-scan method that was discussed for top quark mass measurements at an electron-positron collider Fadin:1987wz; Fadin:1988fn; Strassler:1990nw; Bigi:1986jk.
In experiments, the top quark mass has been measured by using the direct reconstruction of the top quark decay products as 174.30 0.35 (stat.) 0.54 (syst.) GeV from the combined results of CDF and D0 at Tevatron CDF:2016vzt, 172.69 0.25 (stat.) 0.41 (syst.) GeV with ATLAS ATLAS:2018fwq and 172.44 0.13 (stat.) 0.47 (syst.) GeV with CMS CMS:2015lbj at the LHC. The precision till now is about half a GeV and it is mainly limited by the systematic uncertainties that are not easily reduced in the future. On the contrary, the threshold-scan method has been widely used LEP:2020w; BESIII:2019 and shown good performance with a precision of top quark mass measurement at about 20-30 MeV that was studied previously with ILC, CLIC and FCC-ee Martinez:2002st; Seidel:2013sqa; Horiguchi:2013wra; CLICdp:2018esa; FCC:2018evy.
The threshold-scan method also provides a theoretically well defined mass that can be calculated with a high degree of precision and can be easily converted to various theoretical schemes. This cannot be realised in the reconstructed top mass peak method in which the generated mass peak is usually used as a template to fit to the observed data, since the generator mass is not well-defined theoretically.
In this article, we discuss the threshold-scan method and propose realistic scan strategies for the top quark mass measurements with electron-positron collisions based on the Circular Electron Positron Collider (CEPC). The experimental conditions at CEPC are introduced in Sec. 2. The threshold-scan method applied to the CEPC senarios, the realistic scan strategies and the optimal precision in top quark measurements are discussed in Sec.3. The systematic uncertainties from the theoretical calculation on the cross-section, the beam energy, the luminosity spectrum and the background contamination are discussed in Sec. 4. Eventually the conclusions are presented in Sec. 5.
2 Experimental conditions at CEPC
CEPC is a large concept collider with a circumference of 100 km and two interaction points CEPCStudyGroup:2018rmc; CEPCStudyGroup:2018ghi. The accelerator complex consists of a linear accelerator (Linac), a damping ring (DR), the booster, the collider and several transport lines. The center-of-mass energy of CEPC will be 240 GeV, at which collision energy it will serve as a Higgs factory, generating more than one million Higgs particles corresponding to a total luminosity of 5.6 ab-1 as a baseline design. The design also allows operation at 91 GeV for a Z factory and at 160 GeV for the threshold scan. The number of Z particles will be close to 1 trillion from 16 ab-1 data taking, and pairs about 15 million from 2.6 ab-1 data taking. These unprecedented large number of particles make the CEPC a powerful instrument not only for precision measurements on these important particles, but also in the search for new physics. Apart from those, CEPC could also ramp up the center-of-mass energy to reach the threshold. A preliminary plan is to collect a total luminosity of 100 fb-1.
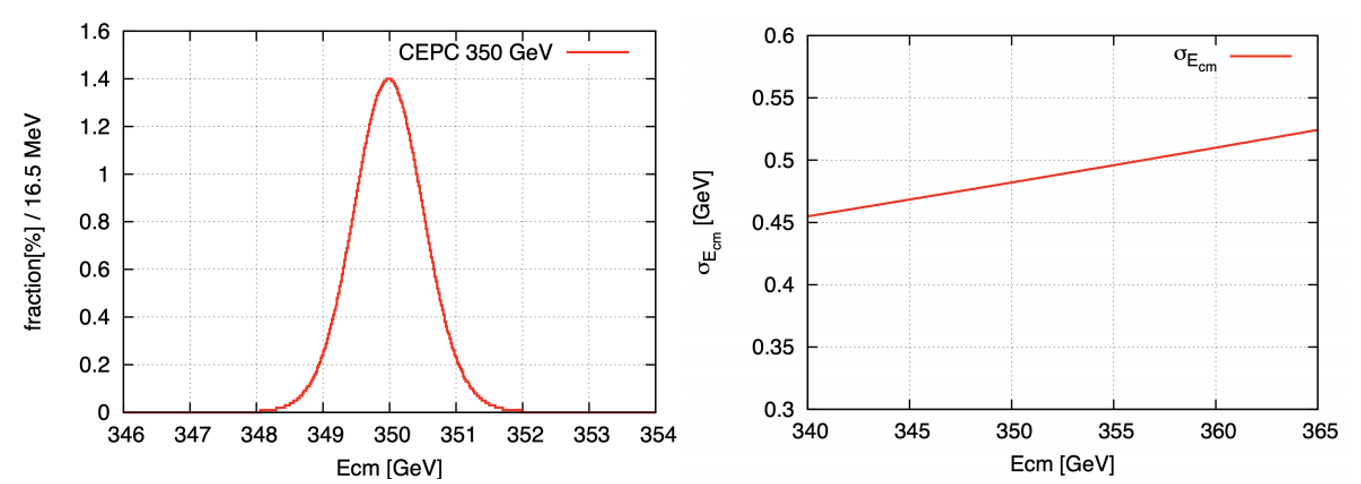
Unlike linear colliders, circular colliders have bending magnets in the acceleration ring, which help to constrain the beam energy spread. Thus, the luminosity spectrum (LS) is more concentrated at the beam energy peak. The spread of LS increases as the centre-of-mass energy rises. At CEPC, LS is modeled by a simple Gaussian distribution and its width is a function of centre-of-mass energy :
| (1) |
which is shown in Fig. 1. Thus, is roughly 500 MeV around the threshold. resulting in a luminosity spectrum with more than 90 % of the luminosity in the top 1 % of the energy at 350 GeV, compared to 77 % of that in the top 1 % at CLIC, at the same energy Linssen:1425915; Aicheler:1500095.
3 Top quark mass measurements at the threshold
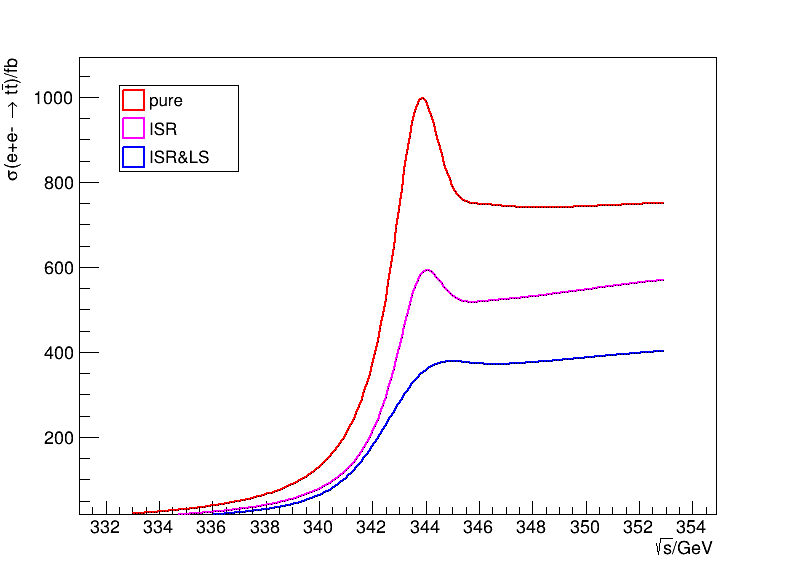
The package QQbar_threshold (VERSION 2.2.0) is used Beneke:2016kkb; Beneke:2017rdn to calculate the \ttbarcross section around the threshold. The potential-subtracted (PS) scheme is used for the top quark mass, GeV. The width is set to GeV and the strong coupling to . The cross section is calculated in N3LO QCD in resumed non-relativistic perturbation theory Beneke:2013jia; Beneke:2015kwa and NNLO in electroweak Beneke:2017rdn. Two important beam effects, e.g. the initial state radiation (ISR) and the LS that is a function of centre-of-mass energy based on the CEPC scenario, are both taken into account with QQbar_threshold.
The cross-section as a function of centre-of-mass energy is shown in Fig. 2 including the calculation without ISR or LS, the one with ISR and the one with both ISR and LS. The original cross-section curve is significantly worn down by the two effects both smearing out the energy distribution of the beam particles.
The number of \ttbarevents are calculated with the cross-section that is a function of top quark mass, width and , and the corresponding luminosity assumed for the centre-of-mass energy in the scan. The semi-leptonic and full-hadronic decay modes are taken into account. The signal efficiency and acceptance follow the same as evaluated in Ref.Seidel:2013sqa. The background contribution is relatively low and can be subtracted as discussed in Ref.Seidel:2013sqa. The background is neglected for the nominal estimations in this section but its impact will be discussed as systematic uncertainties later in Sec. 4.
To extract the top quark mass, width and , the number of events are counted at each centre-of-mass energy in the scan. A likelihood function is constructed to perform the fits with the counted numbers, between the expected number of events evaluated with the cross-section turn-on curve and the observed number of events from the CEPC. The latter number is simply set equal to the former to make the nominal evaluation and estimate the measurement precision, i.e. the one-sigma error in in the likelihood curve. The likelihood function is defined as
| (2) |
where the observed number of events () should follow the Poissonian distribution with the expected mean as under certain centre-of-mass energy ( indexed with ). The likelihood function combines all energy points by multiplying all the Poissonian probability under each collision energy. In the equation, stands for the cross-section, for the top quark mass, for the top quark width, for the strong coupling, for the luminosity allocated to the collisions at the centre-of-mass energy of , and for the selection efficiency times acceptance of the \ttbarsignal events. The precision of measurement on , and is evaluated by minimising the negative log likelihood function.
The cross-section turn-on curve contains different amounts of information for top quark mass, width and along the centre-of-mass energy scan points. One needs to find out what level of sensitivity the cross-section curve can provide for the measurements. The Fisher information is used here as a rule of thumb. At a certain centre-of-mass energy () one can consider the measured cross-section () as a random variable which follows a Gaussian distribution () with its mean value centred at the true cross-section (, where can be top quark properties like top quark mass and width as well as the strong coupling ). Thus the Fisher information reads
| (3) |
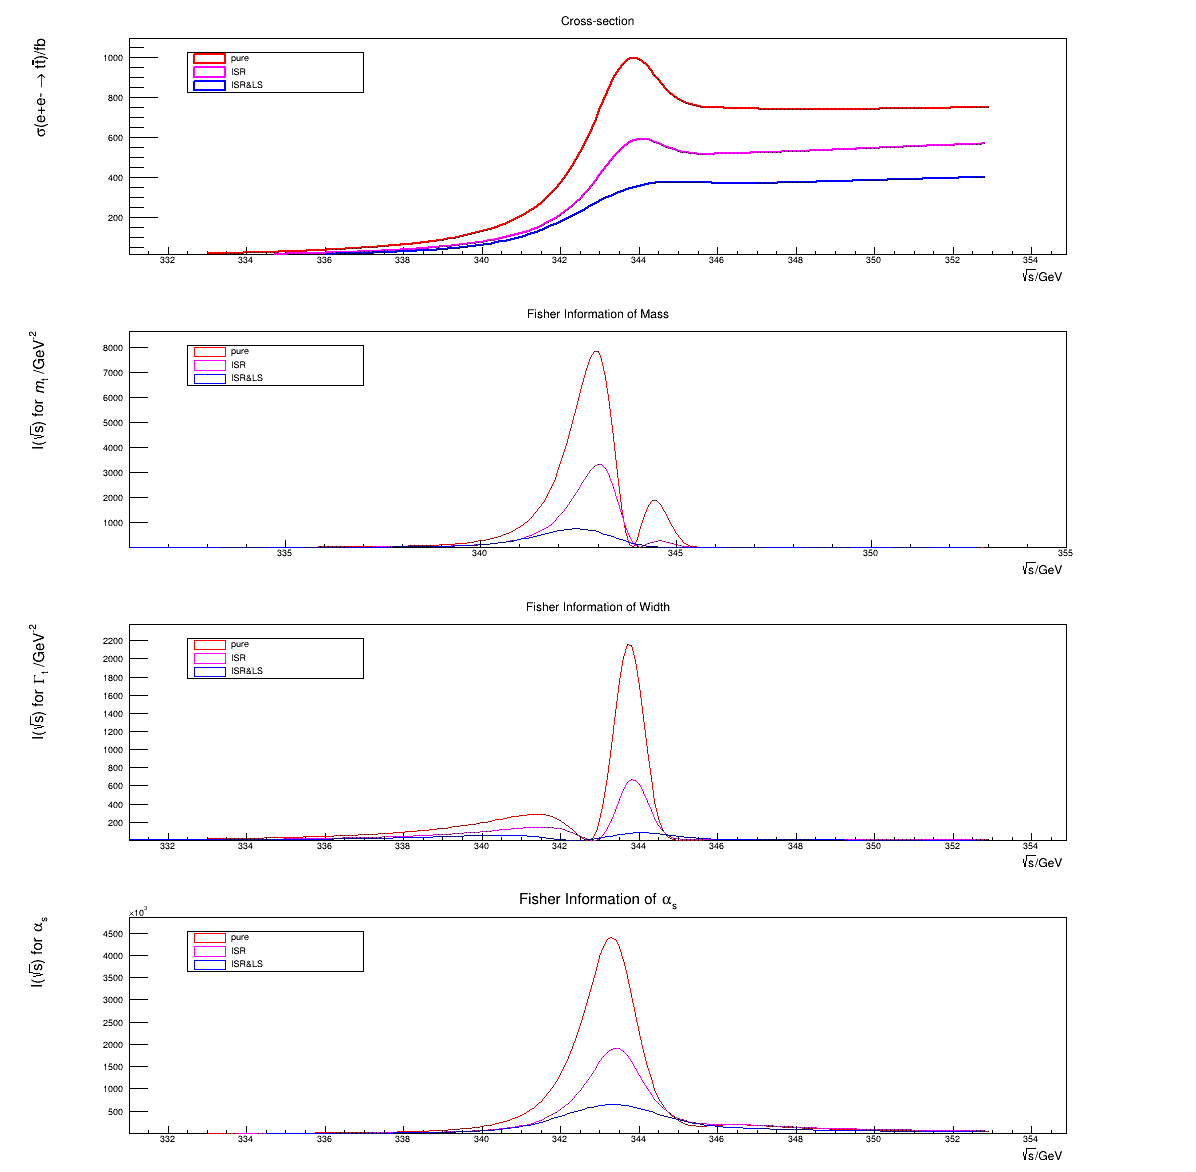
In this way, the Fisher information can reflect the sensitivity to the measurements of top quark mass, width and as a function of centre-of-mass energy, respectively, as shown in Fig. 3. The larger the value in the Y-axis of the Fisher information is, the more sensitive to the relevant measurement the cross-section at this centre-of-mass energy would be. The cross-section curve is found most sensitive to top quark mass when the cross-section ramps up around the threshold, and is sensitive to top quark width when the cross-section peaks, while it is sensitive to by its overall rate thus mainly close to the cross-section peak.
The effects of ISR and LS wear out the original cross-section curve resulting significant drops in Fish information for all three parameters as shown in Fig.3. Considering the ISR effect only, collisions at = 343.00 GeV provides the highest sensitivity to the top quark mass, = 343.75 GeV for top quark width and = 343.5 GeV for . Considering both ISR and LS effects, the optimal energy points are shifted, mostly due to the fact that the spread of LS is not a constant, instead, increases as the energy rises. Then collisions at = 342.75 GeV provides the highest sensitivity to the top quark mass measurements, = 344.00 GeV for top quark width, and = 343.25 GeV for .
With the total luminosity limited to 100 pb-1, we discuss the optimal scan strategy with only statistical uncertainty in this section. Firstly, the luminosity is evenly allocated to each centre-of-mass energy scan point. Using the Fisher information as a guide, one can propose various grids of collision energy and evaluate the sensitivities. The following grids are tested.
-
•
8-point grid: {341, 342, 342.5, 342.75, 343, 343.5, 344.5, 345} GeV
-
•
6-point grid: {342, 342.5, 342.75, 343, 343.5, 344.5} GeV
-
•
4-point grid: {342.5, 342.75, 343, 343.5} GeV
-
•
1-point grid: {342.75} GeV
among which the energy point most sensitive to top mass that is indicated by Fisher information is included. The likelihood function defined in Eq. 2 is calculated for each scan grid and the error at 68% confidence level in the likelihood scan is taken as the statistical uncertainty. The uncertainties on top mass measurement are then 13 MeV from 8 energy points, 12 MeV from 6 energy points, 10 MeV from 4 energy points and 9 MeV from 1 energy point. Therefore, when allocating luminosity evenly to the centre-of-mass energy points in the scan, the optimal solution is to take all the data at the energy point that is most sensitive to top mass given that the optimal energy point is known. Further tests are performed for unevenly allocating the luminosity around the optimal energy point, the conclusion does not change.
To find the optimal energy point that has the most sensitivity to the top quark mass measurement, a simple low-luminosity scan can be performed. By the time of CEPC, the LHC or HL-LHC should be able to provide the top quark mass measurement with a certain level of precision. According to that one can scan evenly in the range with very low luminosity and then sort the scan points in the order of the top quark mass measurement error, just like the list in Tab. 1, where 6 energy points, {340, 341, 342, 343, 344, 345}, are scanned with even luminosity of 1 fb-1 per energy point and the top three are shown. From this scan, one can identify the optimal energy point should sit between 342 GeV and 343 GeV. Then a finer grid between 342 GeV and 343 GeV, {342.25, 342.5, 342.75, 343, 343.25, 343.5}, can be scanned, again with even luminosity of 1 fb-1 per energy point, as shown in Tab. 2, from which one can get closer to the optimal energy point. This process can be iterated with more times to get close enough to the best energy point.
| (GeV) | precision (MeV) |
|---|---|
| 343 | 3.0 |
| 342 | 3.5 |
| 341 | 5.6 |
| (GeV) | precision (MeV) |
|---|---|
| 342.75 | 2.9 |
| 342.50 | 3.0 |
| 343.00 | 3.0 |
With the CEPC setup, the ultimate statistical precision is calculated individually for top quark mass, width and at their optimal energy points that are determined with a quick scan using low luminosity, respectively, assuming the total luminosity of 100 fb-1 for each case. The statistical uncertainties of these measurements are listed in Tab. 3. Relevant systematic uncertainties are discussed in the next section.
| Centre-of-mass energy | Precision of | Precision of | Precision of |
|---|---|---|---|
| 342.75 GeV optimal for | 9 MeV | 343 MeV | 0.00041 |
| 344.00 GeV optimal for | 50 MeV | 26 MeV | 0.00047 |
| 343.25 GeV optimal for | 15 MeV | 40 MeV | 0.00040 |
As already shown in Tab. 3, the optimal energy point for cannot provide the best precision for and , as their optimal energies are all different. One can consider to use two energy points or more to reach a certain level of precision of and while not to degrade too much the precision of . Two energy points that have a total luminosity limited to 100 fb-1 are discussed in the following. Considering both and , a various luminosity fractions between the two optimal energy points are tested, as shown in Tab. 4. Since the optimal energy point for is relative far away from the one for , a small fraction like 20% luminosity allocated for is already improving significantly its precision. A fraction even up to 50% for still do not degrade too much the precision of but improves an order of magnitude in the precision of . A similar test is performed for and , as shown in Tab. 5. The precision of does not seem to change much when allocating luminosity to its optimal energy point, mostly due to the fact that the optimal energy points for and are close.
| Lumi fractions for [342.75,344.00] GeV | precision (MeV) | precision (MeV) |
|---|---|---|
| [100%, 0%] | 9 | 343 |
| [80%, 20%] | 11 | 58 |
| [50%, 50%] | 13 | 36 |
| [20%, 80%] | 20 | 30 |
| [0%, 100%] | >50 | 26 |
| Lumi fractions for [342.75,343.25] GeV | precision (MeV) | precision |
|---|---|---|
| [100%, 0%] | 9 | 0.00041 |
| [80%, 20%] | 10 | 0.00041 |
| [50%, 50%] | 11 | 0.00040 |
| [20%, 80%] | 13 | 0.00040 |
| [0%, 100%] | 15 | 0.00039 |
4 Systematic uncertainties
The threshold-scan method depends on the theoretical calculation of the cross-section curve as a function of the centre-of-mass energy. The uncertainty of the theoretical calculation is considered as 3% based on conservative estimations from Ref. Stahlhofen:2011iqb and 1% assumed to be achieved by the time of the experiments. This follows the same assumption as in Ref. Seidel:2013sqa. The 1% and 3% uncertainty on the cross-section will lead to a measurement uncertainty of top quark mass 9 MeV and 26 MeV, which are in the same level of the statistical uncertainty and three times of that, respectively.
The background is considered to be subtracted cleanly from the observed data given the good signal-background separation in their shapes, such as the reconstructed top quark mass or a combined kinematic variable, and the statistical dominance of the signal events in the final fitting region. The background uncertainties are added to the likelihood function Eq. 2 as a nuisance parameter constrained by a Gaussian prior. The background efficiencies are taken from Ref. Seidel:2013sqa, and the cross-sections are calculated with Wizard V1.95 Kilian:2007gr; Moretti:2001zz, as shown in Tab.6. Considering the background uncertainty as 1% optimistically and 5% conservatively, a measurement uncertainty of top quark mass of 4 MeV and 18 MeV is reached. From this, the background uncertainty is crucial. Measures like taking data below the threshold to constrain the background might need to be considered.
| (GeV) | (fb) | (fb) | (fb) | (fb) |
|---|---|---|---|---|
| 352 | ||||
| 500 |
The variations in the beam energy could also lead to uncertainties on the top quark mass measurement. The beam energy uncertainty was reported at a level of 10-4 in the operation of LEP LEPEnergyWorkingGroup:2004mbb; OPAL:2004xxz and the studies of ILC Boogert:2009ir, which already impacts the top quark measurement less than the statistical uncertainty as discussed in Ref. Seidel:2013sqa. In the CEPC scenario, the beam energy could vary 2.6 MeV as estimated from the accelerator team. This impacts the measurement of top quark mass maximally by 2 MeV, way below the statistical uncertainty.
The other aspect from the beam is the uncertainty of the luminosity spectrum. Variations on the spread of the luminosity spectrum, i.e. the width in Eq. 1, of 10% and 20% are considered. The corresponding uncertainties on the top quark mass measurement are 3 Mev and 5 MeV, respectively. These are quite different than the CLIC scenario in Ref. Seidel:2013sqa given the different controls of the luminosity spectrum in circular and linear colliders. Furthermore, the improvement of the top quark mass measurement by having a better luminosity spectrum, e.g. a smaller spread , is evaluated. The reduction of the energy spread of 20% and 50% can lead to the statistical uncertainty of top quark mass measurement of 9.0 MeV and 8.4 MeV, with respect to our nominal statistical uncertainty of 9.1 MeV. It appears that a large improvement in luminosity spectrum does not bring much improvement in top quark mass measurement. This should be due to the excellent luminosity spectrum in circular colliders.
Taking into account all these uncertainties, the CEPC is expected to measure the top quark mass with a precision of 14 MeV and 34 MeV in the optimistic and conservative assumptions respectively, as shown in Tab. 7
| Source | precision (MeV) | |
|---|---|---|
| Optimistic | Conservative | |
| Statistics | 9 | 9 |
| Theory | 9 | 26 |
| Background | 4 | 18 |
| Beam energy | 2 | 2 |
| Luminosity spectrum | 3 | 5 |
| Total | 14 | 34 |
5 Conclusions
We have studied the expected precision of the top quark mass, width and in \ttbarproduction using an energy scan around the \ttbarthreshold based on the CEPC scenario, assuming a total integrated luminosity of 100