Early results from GLASS-JWST VIII: An Extremely Magnified Blue Supergiant Star at Redshift 2.65 in the Abell 2744 Cluster Field
Abstract
We report the discovery of an extremely magnified star at redshift in James Webb Space Telescope (JWST) NIRISS pre-imaging of the Abell 2744 galaxy-cluster field. The star’s background host galaxy lies on a fold caustic of the foreground lens, and the cluster creates a pair of images of the region close to the lensed star. We identified the bright transient in one of the merging images at a distance of from the critical curve, by subtracting the JWST F115W and F150W imaging from coadditions of archival Hubble Space Telescope (HST) F105W and F125W images and F140W and F160W images, respectively. Since the time delay between the two images should be only hours, the transient must be the microlensing event of an individual star, as opposed to a luminous stellar explosion which would persist for days to months. Analysis of individual exposures suggests that the star’s magnification is not changing rapidly during the observations. From photometry of the point source through the F115W, F150W, and F200W filters, we identify a strong Balmer break, and modeling allows us to constrain the star’s temperature to be approximately 7,000–12,000 K.
1 Introduction
Galaxies and galaxy clusters act as massive gravitational lenses that are able to magnify intrinsically faint background sources. Their magnifying power becomes greatest for intrinsically compact sources adjacent to their critical curves (or caustics in the source plane), because regions of greatest magnification are small. Indeed, the possibility that stars that could become highly magnified by galaxy-cluster lenses was suggested in the early 1990’s (Miralda-Escude, 1991).
The first example of an extremely magnified star was a blue supergiant in a spiral galaxy at (dubbed Icarus) discovered by Kelly et al. (2018). The star was identified in the Hubble Space Telescope (HST) imaging of the MACS J1149.5+2223 galaxy cluster field taken to follow up Supernova (SN) Refsdal (Kelly et al., 2015; Treu et al., 2016; Rodney et al., 2016; Kelly et al., 2016). Microlensing of the background star by a foreground object in the lens caused its magnification to increase by a factor of approximately three to 2000. The cluster lens has the effect of boosting the effective lensing effect of foreground microlenses (Diego et al., 2018; Venumadhav et al., 2017). The Spock events in an arc at in the MACS J0416.1-2403 galaxy-cluster fields were probable microlensing events (Rodney et al., 2018), and a second star dubbed Warhol (, Chen et al., 2019; Kaurov et al., 2019) was identified from microlensing events found in HST imaging of the galaxy cluster. More recently, Welch et al. (2022) reported a highly magnified star dubbed Earendel at behind galaxy cluster field WHL0137–08. Unlike the previous examples, microlensing, which provides direct evidence that the source has a size of less than tens of AU, has not yet been detected for Earendel, and the constraints on its size come from the galaxy-cluster lens model.
With a photon collection area a factor of six greater than that of HST and sensitivity across the infrared, the James Webb Space Telescope (JWST) improves our ability to detect transient events within highly magnified regions of galaxy cluster fields. Through observations of such extreme-magnification events, we can probe individual stars at cosmological distances, including potentially individual Population III stars (Windhorst et al., 2018).
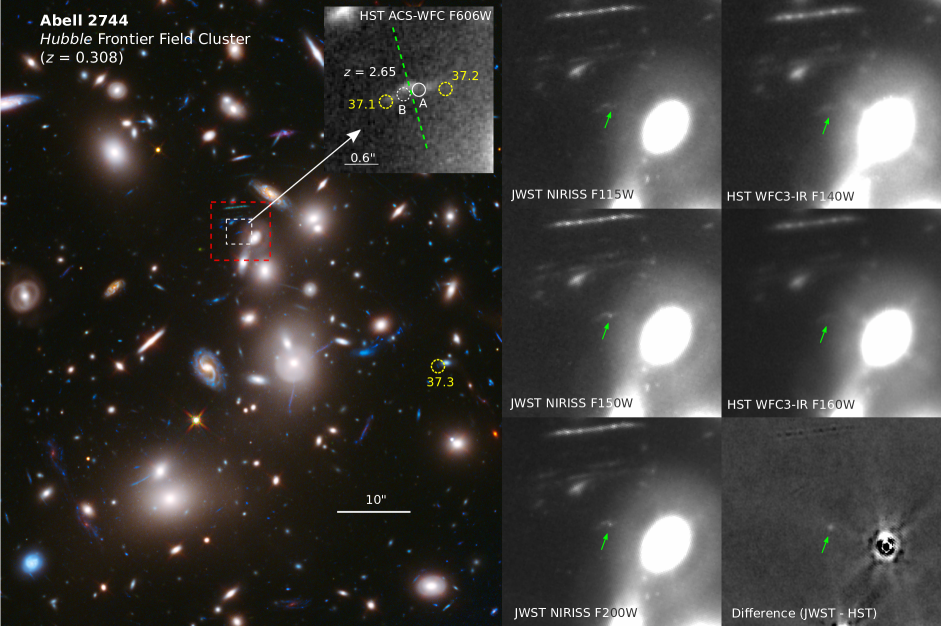
Here we report the discovery of an extremely magnified star at in the first set of JWST images of the Abell 2744 galaxy-cluster field, which were acquired by the GLASS-JWST program (PI: Treu; ERS-1324; Treu et al., 2022). As shown in Fig. 1, the event was detected in JWST NIRISS (the Near Infrared Imager and Slitless Spectrograph Doyon et al., 2012) imaging at a separation of from the inferred location of the critical curve. In this paper, we describe the JWST NIRISS pre-imaging in Section 2. Section 3 provides the details of our data analysis and results. Our conclusions and discussions are presented in Section 4. We assume a concordance cold dark matter cosmological model with , , and a Hubble constant H. All magnitudes are in the AB system (Oke & Gunn, 1983).
2 Data
The JWST Director’s Discretionary Early Release Science Program ERS 1324 (PI T. Treu; Through the Looking GLASS: A JWST Exploration of Galaxy Formation and Evolution from Cosmic Dawn to Present Day) acquired the NIRISS imaging of the Abell 2744 galaxy-cluster field, as the pre-imaging component to slitless spectroscopy (Roberts-Borsani et al., 2022)[paper I]. A total of 24 NIRISS imaging exposures were acquired from 2022-06-28 22:04:38.674 UTC to 2022-06-29 10:41:13.507 UTC in the F115W, F150W, and F200W filters. Details on observing strategy can be found in Treu et al. (2022). We retrieved stage two images and combined the imaging using the JWST pipeline 111https://jwst-pipeline.readthedocs.io/en/latest/jwst/introduction.html.
3 Data Analysis and Results
3.1 A Transient
As shown in Fig. 1, the transient we report here was detected in the JWST NIRISS F150W and F200W imaging. The transient’s flux did not vary significantly among the 16 F150W and F200W exposures acquired during the -day visit to the field. There is no statistically significant detection of this transient in F115W imaging. The transient’s coordinates are , in the World Coordinate System (WCS) of the official images produced by the Hubble Frontier Field survey collaboration (Lotz et al., 2017).
The transient was identified in the difference image between a convolved JWST image and the HST template. To compare HST images with the JWST NIRISS F150W image, we combined the HST WFC3-IR F140W and WFC3-IR F160W coadded images to create a template, since the wavelength range of the JWST NIRISS F150W filter is spanned by the two HST WFC3-IR filters. The effective wavelengths of the JWST NIRISS F150W, HST WFC3-IR F140W, and HST WFC3-IR F150W filters are 14846 Å, 13734 Å, and 15278 Å, respectively. We then compute a transition kernel , for which , where and are point-spread functions of the two telescopes. The kernel is determined using the Richardson–Lucy algorithm (Richardson, 1972; Lucy, 1974) based on a set of manually selected bright (but not saturated), isolated sources present in the imaging from both telescopes. Details are described in Appendix A. The transient is visibly apparent (with significance) in the resulting difference image, as shown in the bottom-right panel in Fig. 1.
After correcting for Galactic dust extinction ( mag; Schlafly & Finkbeiner 2011), we obtain flux densities within a 0.12′′ aperture centered on the transient position of nJy, nJy, and nJy for the NIRISS F115W, F150W, F200W filters, respectively.
3.2 Underlying Arc
The redshift of the underlying arc was measured to be 2.6501 from spectroscopy acquired using the Low Resolution Imaging Spectrometer (LRIS) mounted on the Keck-I telescope (Mahler et al., 2018). A so-called fold caustic creates mirror, merging images of a galaxy that intersects it. Such a pair of mirrored images allow us to estimate the position of the critical curve. For the arc where this event has been detected, we are able to identify the critical curve’s location based on the arc’s morphology, as shown by the green dashed line in the inserted panel in Fig. 1, where and label the positions of the transient and its mirrored image on opposite sides of the critical curve, respectively. In the JWST observation, no counter image of the transient is detected.
We measure the photometry of the arc based on the official coadded images taken from the Hubble Frontier Field survey (Lotz et al., 2017). We find the total stellar mass and the star-formation rate of the arc are and , respectively, without correction for lensing magnification. The surface stellar-mass density of the cluster at the position of the arc is .
3.3 Gravitational Lens Models
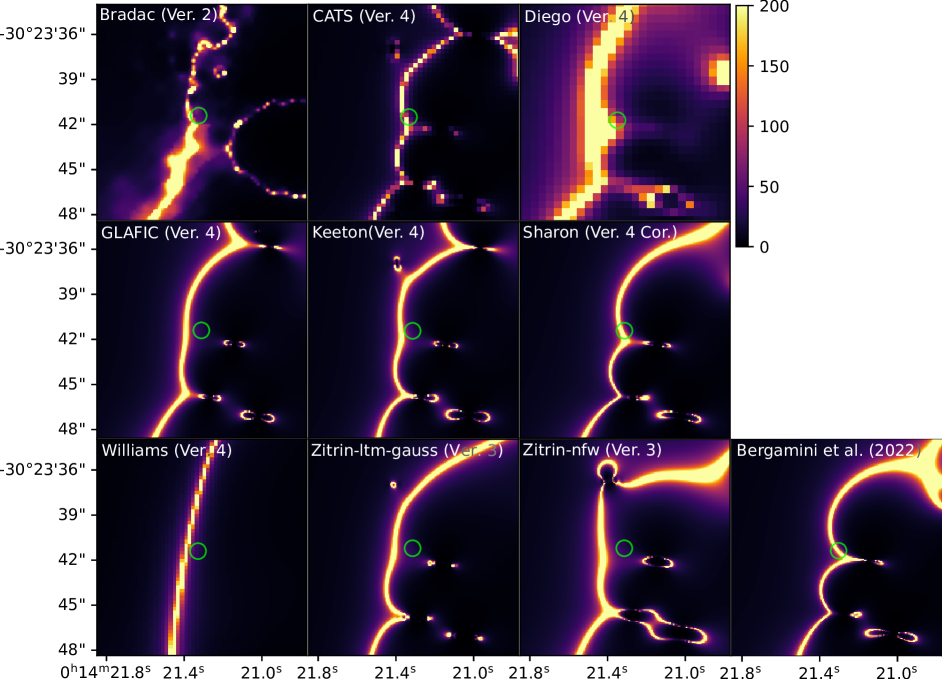
Using the published Frontier Fields Lens Models222https://archive.stsci.edu/pub/hlsp/frontier (Lotz et al., 2017) listed in Table 1 and a recent model (Bergamini et al., 2022) for the Abell 2744 galaxy cluster, we calculate their magnification maps at and compare these maps with the position of the transient, as shown in Fig. 2. The predicted magnification at the position of the newly discovered transient is listed in Table 1. For newly released model from Bergamini et al. (2022), we obtained the magnification the best-fit model generated from the paper’s Strong Lensing Online Tool. We can see that the position of the event is close to the predicted galaxy-cluster critical curves from these lens models. The model predictions are also, in general, consistent with the multiple images of the arc, although these models’ predictions for the position of the critical curve have large uncertainties. We also note that the Frontier Fields Lens Models were constructed before the spectroscopic redshift of this system was known.
The position of the transient, marked by in the inserted image in the left panel of Fig. 1, is from the inferred location of the critical curve as shown by the green dashed line. We evaluate the magnification at the position offset by from these models’ predicted critical curve. As listed in Table 1, except Diego V4 and Zitrin-nfw V3, all the other models predict a magnification of at from the critical curve, while Diego V4 and Zitrin-nfw V3 favor even greater magnifications.
Furthermore, for models with a resolution smaller than , we compute the relative time delay between position and its counter-image as labeled in the inserted image in the left panel of Fig. 1. We find that all the selected models predict a relative delay of less than 4 hours. This is smaller than the duration of the JWST observation. Thus, if the event were a supernova in the arc, we should detect a counter-image at the position in the JWST imaging. The non-detection of the counter-image of the transient at the other side of the critical curve allows us to exclude a multiply imaged stellar explosion.
As shown in the left panel in Fig. 1, the arc is consistent with a set of multiple images (37.1, 37.2, and 37.3). According to Table A1 in Mahler et al. (2018), 37.1 and 37.2 have the same spectroscopic redshift , while the redshift of 37.3 has not yet been confirmed.
| Model | 68% CI of | (hours) | ||||
|---|---|---|---|---|---|---|
| Before MUSE Spectroscopy | ||||||
| Bradač (v2)bbWang et al. (2015); Hoag et al. (2016); Bradač et al. (2009, 2005) | 55 | (35, 188) | 0.76 | 0.28 | 172 | N/A |
| Zitrin-ltm-gauss (v3)ccZitrin et al. (2013, 2009) (see also Merten et al. 2011a, 2009) | 47 | (36, 204) | 0.73 | 0.34 | 195 | 1.68 |
| Zitrin-nfw (v3)ddZitrin et al. (2013, 2009) (see also Merten et al. 2011a, 2009) | 19 | (14, 26) | 0.85 | 0.24 | 270 | 3.14 |
| After MUSE Spectroscopy | ||||||
| CATS (v4)eeMahler et al. (2018) | 64 | (50, 89) | 0.79 | 0.26 | 110 | N/A |
| Diego (v4)ffDiego et al. (2005a, b, 2007, 2015) | 84 | (75, 93) | 0.89 | 0.16 | 710 | N/A |
| GLAFIC (v4)ggKawamata et al. (2018, 2016); Oguri (2010) | 22 | (20, 24) | 0.80 | 0.28 | 184 | 0.59 |
| Keeton (v4)hhMcCully et al. (2014); Ammons et al. (2014); Keeton (2010) | 31 | (23, 47) | 0.80 | 0.27 | 178 | 0.56 |
| Sharon (v4 Cor.)iiJohnson et al. (2014); Jullo et al. (2007) | 282 | (172, 730) | 0.73 | 0.29 | 161 | 2.95 |
| Williams/GRALE (v4)jjSebesta et al. (2016); Liesenborgs et al. (2006) | 26 | (18, 86) | 0.83 | 0.26 | 160 | N/A |
| Bergamini et al. (2020)kkBergamini et al. (2022) | 122 | (70, 423) | N/A | N/A | N/A | N/A |
3.4 Spectral Energy Distribution of the Lensed Star
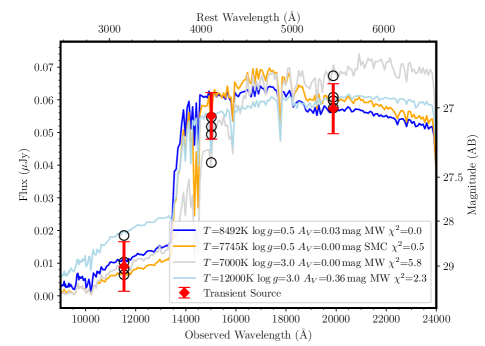
We fit the spectral energy distribution (SED) of the lensed-star candidate measured from the JWST NIRISS F115W, F150W, and F200W imaging. A stellar atmosphere model (Lejeune et al., 1998) and a host-galaxy extinction curve are simultaneously fit into the measured SED of the lensed star. As shown in Fig. 3, we find the best-fit photospheric temperature of 8,500 K for a MW (; Cardelli et al. 1989) extinction law, and the best-fit photospheric temperature of 7,700 K for a SMC (; Gordon et al. 2003) extinction law). Fig. 3 also shows that models with 7,000 K and 12,000 K temperatures are also consistent with 1–2 with the measured fluxes.
3.5 Constraints on the source size and magnification
The flux of the transient in the F150W and F200W imaging did not vary significant across exposures, and hence the total time duration of the event is unconstrained. However, we can determine a lower limit on the event duration. The transient has been detected across a period of days (8.4 hours) from the first F150W exposure to the last F200W exposure. Thus, the duration of the microlensing peak must be days.
At an offset of from the galaxy-cluster critical curve near the position of the transient, we obtain (, , according to the GLAFIC V4 model, where and , and and are convergence and shear), where the Einstein radius of a microlens should be exaggerated by the cluster lens, and a microlensing peak will appear during the caustic crossing, as described in Oguri et al. (2018); Diego et al. (2018); Venumadhav et al. (2017); Meena et al. (2022).
Oguri et al. (2018) derived a pair of equations that enable constraints on the size of the lensed source, given limits on its duration, and its maximum magnification. However, these equations only apply when the microlensing arises from a single microlens (i.e., the microcaustics are not overlapping). We measure a stellar-mass density of and infer an optical depth for microlensing of at the position of the transient (as described in detail in Appendix B). Consequently, we can have a reasonable expectation that the simplified, Oguri et al. (2018) analysis should yield accurate inferences. We note that Diego et al. (2018) and Venumadhav et al. (2017) provide full treatments of microlensing through simulations.
The source crossing time for the caustic-crossing event, according to Oguri et al. (2018), is given by
| (1) |
Thus, the minimum radius of the source is given the minimum 0.35-day event duration and the assumption that the characteristic velocity is 500. Abell 2744 is a complex galaxy cluster merger with a characteristic velocity of (Merten et al., 2011b) as inferred from measurements of the galaxies’ velocities and that of the gas in the intracluster medium. The southern “clump,” where we detect the transient, has a peculiar velocity of as reported by Owers et al. (2011). Assuming the cluster’s transverse velocity of , the minimum radius of the source is . Moreover, from Eq. 26 in Oguri et al. (2018), the maximum magnification during a caustic crossing for the lensing geometry of this event is given by
| (2) |
where is the mass of the micro lens. We note that the arc is behind the outskirt of a bright galaxy in the cluster. Assuming a micro lens with , we have the maximum magnification , , and for , , and , respectively. For , we have the maximum magnification . For a more massive microlens with , we have the maximum magnification .
In addition, for a solar-mass microlens and a transverse velocity of the cluster lens, the time between caustic crossings (Oguri et al., 2018) will be as long as .
3.6 Luminosity and Magnification of Lensed Star
For stars of different spectral types and absolute magnitudes, we evaluate the required magnification to reach the observed apparent magnitude of in the JWST NIRISS F150W imaging. We perform the same calculation as that in Chen et al. (2019), and our results are listed in Table 2. As we can see, based on the constraints on the minimum source size and the maximum magnification we described above, for a microlens with a few solar masses, a main sequence star is not sufficiently luminous. A very luminous () blue supergiant (A0 or F5) is required to explain the microlensing event that we have discovered. We note that, at lower metallicities, stars of equal temperature become comparatively more luminous.
| Spec. Model | Temp | F150W | ||||
|---|---|---|---|---|---|---|
| Extreme BSG | A5 | 8491 K | -8.50 | 37.04 | -1.20 | 9894 |
| Extreme BSG | F0 | 7211 K | -8.50 | 37.22 | -1.03 | 11665 |
| MS | O5V | 39810 K | -5.40 | 39.33 | -2.01 | 81613 |
| MS | O9V | 35481 K | -4.00 | 40.80 | -1.95 | 315414 |
| MS | B0V | 28183 K | -3.70 | 41.10 | -1.94 | 416393 |
| MS | B1V | 22387 K | -3.20 | 41.73 | -1.81 | 745490 |
| MS | B3V | 19054 K | -2.10 | 42.92 | -1.72 | 2237247 |
| MS | B5-7V | 14125 K | -2.10 | 43.04 | -1.61 | 2479165 |
| MS | B8V | 11749 K | -1.08 | 44.12 | -1.54 | 6720452 |
| MS | A5V | 8491 K | 2.40 | 47.94 | -1.20 | 226668196 |
| MS | F0V | 7211 K | 3.20 | 48.92 | -1.03 | 558299929 |
4 Discussion
The transient we discovered in the JWST NIRISS pre-imaging can be interpreted as an extremely magnified (by a factor of ), luminous () blue/blue-white supergiant (Deneb-like) that was magnified by the Abell 2744 cluster lens and a solar-mass microlens. From the best-fit SED model, as shown in Fig. 3, the Balmer discontinuity at Å in the observer’s frame can explain why the lensed star is only visible through JWST NIRISS F150W and F200W filter but not detected with statistical significance in the F115W imaging.
We note that our constraints on the source size and the maximum caustic-crossing magnification are based on a solar-mass microlens. A more massive microlens can provide higher magnification which would allow the lensed star to be comparatively less luminous. Hence, our constraints on the luminosity and types of the lensed star will be relaxed for a massive microlens. In particular, potential populations of primordial black holes with masses of would manifest themselves due to their action as microlenses (Diego et al., 2018). The discoveries of this kind of lensed stars in JWST and HST observations could be used to place constraints on the abundance of primordial black holes as a promising candidate to compact dark matter.
Since we observe no significant evolution in the transient’s brightness, we cannot place an upper bound on the event’s duration and the source size. Since most stars are observed in binary systems with a separation of (Sana et al., 2014, 2012), additional transients could become visible within several weeks if the source is composed of multiple stars.
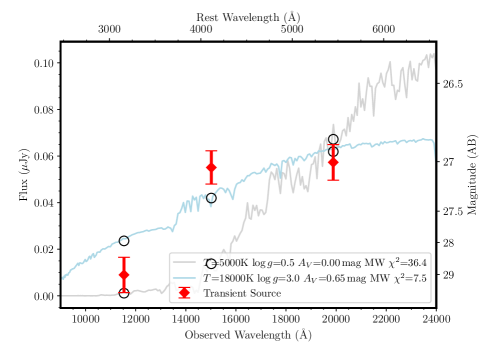
A potential alternative to a luminous lensed star is a stellar-mass black hole accreting mass from an asymptotic giant branch (AGB) companion. Such systems could potentially be more common than luminous stars since the amount of time lower-mass stars spend on the AGB stage can greatly exceed the lifetimes of high-mass stars (Windhorst et al., 2018). We note that accretion disks of stellar-mass black holes may be difficult to distinguish from massive stars during microlensing events because of their similar temperatures, sizes, and luminosities. However, the continuum spectrum of an optically thick, steady-state accretion disk can be described by the integrated black-body spectra over the disk’s temperature profile, which should not exhibit a significant break in its SED at Å (in the rest frame) as we observed for this object. Thus, our observation does not favor a lensed stellar-mass black hole accretion disk.
It is possible, in principle, that this new transient could instead originate from the bright galaxy in the cluster. However, it is unlikely to be an SN in the galaxy cluster due to its apparent brightness and the non-detection of its rest-frame -band flux. It is also possible, in principle, that the transient could be a multiply imaged SN where only one image has become highly magnified (or demagnified) by a microlens or subhalo. However, extreme magnification of a SN should be extremely rare, and the large physical size of a SN photosphere means that substantial demagnification or magnification of each image by a microlens becomes improbable. Follow-up observations could constrain the duration of the microlensing event and the existence of any possible counter images.
Microlensing events with lower magnifications should be much more common than events with greater magnifications. JWST’s high angular resolution, wavelength coverage in the infrared, and sensitivity should enable the collection of an extensive sample of highly magnified stars.
Appendix A Differencing between the HST WFC3-IR and JWST NIRISS imaging
To search for transients, we convolve and then subtract the JWST F115W and F150W imaging from coadditions of archival HST F105W and F125W images and F140W and F160W images, respectively. The JWST NIRISS imaging has much sharper angular resolution compared to the HST WFC3-IR imaging. We therefore convolve the JWST imaging with a transition kernel , for which
| (A1) |
where and are point-spread functions of the two telescopes, and denotes the convolution operation. For a source , we have
| (A2) |
where we used the commutative and associative properties of convolution. In Eq. A2, we note that and are observations of present in the JWST and HST imaging, respectively. Thus, we can utilize sources from the JWST and HST imaging to determine the kernel .
For this paper, we determine the kernel using the Richardson–Lucy iteration algorithm (Richardson, 1972; Lucy, 1974). An observed image can be written as
| (A3) |
where , , and , and are the observation, source, PSF, and noises, respectively. For an iteration number , the estimate of (denoted by ) can be written as
| (A4) |
where is the flipped PSF. We applied Eq. A4 on Eq. A2 to solve for using the iteration, for which , , and . To minimize the accumulation of noise during the iteration, we manually selected a set of several bright (but not saturated) and isolated sources including stars and galaxies present in the imaging from both telescopes, and then coadded their images for the iteration. We note that, in Eq. A2, need not be a point source, and hence and may be either images of stars or galaxies.
Appendix B Optical Depth of Microlensing
The optical depth of microlensing (Diego et al., 2018) can be given by
| (B1) |
where is the solid angle covered by the Einstein ring from microlenses, and is the number density of the microlenses at an angular-diameter distance . Assuming that all mass along the line of sight is concentrated in the cluster lens, Eq. B1 can be simplified as
| (B2) |
where is the magnification of the macro lens from the cluster, is the Einstein radius, and is the surface number density of the microlenses in the cluster lens. We note that, for point-mass microlenses, is proportionally to the surface mass density of microlenses.
We measured the photometry in the vicinity of the transient including emissions from the wings of cluster member galaxies and from the intracluster light, and then fit it using the FAST++ software (Kriek et al., 2009; Schreiber & Dickinson, 2017) to obtain the stellar mass. We obtained a surface stellar-mass density of . Plugging it into Eq. B2 (assuming solar-mass microlenses) and for , we have the microlensing optical depth of at the position of the transient.
References
- Ammons et al. (2014) Ammons, S. M., Wong, K. C., Zabludoff, A. I., & Keeton, C. R. 2014, ApJ, 781, 2, doi: 10.1088/0004-637X/781/1/2
- Bergamini et al. (2022) Bergamini, P., Acebron, A., Grillo, C., et al. 2022, arXiv e-prints, arXiv:2207.09416. https://arxiv.org/abs/2207.09416
- Bradač et al. (2005) Bradač, M., Schneider, P., Lombardi, M., & Erben, T. 2005, A&A, 437, 39, doi: 10.1051/0004-6361:20042233
- Bradač et al. (2009) Bradač, M., Treu, T., Applegate, D., et al. 2009, ApJ, 706, 1201, doi: 10.1088/0004-637X/706/2/1201
- Cardelli et al. (1989) Cardelli, J. A., Clayton, G. C., & Mathis, J. S. 1989, ApJ, 345, 245, doi: 10.1086/167900
- Chen et al. (2019) Chen, W., Kelly, P. L., Diego, J. M., et al. 2019, ApJ, 881, 8, doi: 10.3847/1538-4357/ab297d
- Diego et al. (2005a) Diego, J. M., Protopapas, P., Sandvik, H. B., & Tegmark, M. 2005a, MNRAS, 360, 477, doi: 10.1111/j.1365-2966.2005.09021.x
- Diego et al. (2005b) Diego, J. M., Sandvik, H. B., Protopapas, P., et al. 2005b, MNRAS, 362, 1247, doi: 10.1111/j.1365-2966.2005.09372.x
- Diego et al. (2007) Diego, J. M., Tegmark, M., Protopapas, P., & Sandvik, H. B. 2007, MNRAS, 375, 958, doi: 10.1111/j.1365-2966.2007.11380.x
- Diego et al. (2015) Diego, J. M., Broadhurst, T., Benitez, N., et al. 2015, MNRAS, 446, 683, doi: 10.1093/mnras/stu2064
- Diego et al. (2018) Diego, J. M., Kaiser, N., Broadhurst, T., et al. 2018, ApJ, 857, 25, doi: 10.3847/1538-4357/aab617
- Doyon et al. (2012) Doyon, R., Hutchings, J. B., Beaulieu, M., et al. 2012, in Society of Photo-Optical Instrumentation Engineers (SPIE) Conference Series, Vol. 8442, Space Telescopes and Instrumentation 2012: Optical, Infrared, and Millimeter Wave, ed. M. C. Clampin, G. G. Fazio, H. A. MacEwen, & J. Oschmann, Jacobus M., 84422R, doi: 10.1117/12.926578
- Gordon et al. (2003) Gordon, K. D., Clayton, G. C., Misselt, K. A., Landolt, A. U., & Wolff, M. J. 2003, ApJ, 594, 279, doi: 10.1086/376774
- Hoag et al. (2016) Hoag, A., Huang, K.-H., Treu, T., et al. 2016, ApJ, 831, 182, doi: 10.3847/0004-637X/831/2/182
- Johnson et al. (2014) Johnson, T. L., Sharon, K., Bayliss, M. B., et al. 2014, ApJ, 797, 48, doi: 10.1088/0004-637X/797/1/48
- Jullo et al. (2007) Jullo, E., Kneib, J.-P., Limousin, M., et al. 2007, New Journal of Physics, 9, 447, doi: 10.1088/1367-2630/9/12/447
- Kaurov et al. (2019) Kaurov, A. A., Dai, L., Venumadhav, T., Miralda-Escudé, J., & Frye, B. 2019, ApJ, 880, 58, doi: 10.3847/1538-4357/ab2888
- Kawamata et al. (2018) Kawamata, R., Ishigaki, M., Shimasaku, K., et al. 2018, ApJ, 855, 4, doi: 10.3847/1538-4357/aaa6cf
- Kawamata et al. (2016) Kawamata, R., Oguri, M., Ishigaki, M., Shimasaku, K., & Ouchi, M. 2016, ApJ, 819, 114, doi: 10.3847/0004-637X/819/2/114
- Keeton (2010) Keeton, C. R. 2010, General Relativity and Gravitation, 42, 2151, doi: 10.1007/s10714-010-1041-1
- Kelly et al. (2015) Kelly, P. L., Rodney, S. A., Treu, T., et al. 2015, Science, 347, 1123, doi: 10.1126/science.aaa3350
- Kelly et al. (2016) Kelly, P. L., Brammer, G., Selsing, J., et al. 2016, ApJ, 831, 205, doi: 10.3847/0004-637X/831/2/205
- Kelly et al. (2018) Kelly, P. L., Diego, J. M., Rodney, S., et al. 2018, Nature Astronomy, 2, 334, doi: 10.1038/s41550-018-0430-3
- Kriek et al. (2009) Kriek, M., van Dokkum, P. G., Labbé, I., et al. 2009, ApJ, 700, 221, doi: 10.1088/0004-637X/700/1/221
- Lejeune et al. (1998) Lejeune, T., Cuisinier, F., & Buser, R. 1998, A&AS, 130, 65, doi: 10.1051/aas:1998405
- Liesenborgs et al. (2006) Liesenborgs, J., De Rijcke, S., & Dejonghe, H. 2006, MNRAS, 367, 1209, doi: 10.1111/j.1365-2966.2006.10040.x
- Lotz et al. (2017) Lotz, J. M., Koekemoer, A., Coe, D., et al. 2017, ApJ, 837, 97, doi: 10.3847/1538-4357/837/1/97
- Lucy (1974) Lucy, L. B. 1974, AJ, 79, 745, doi: 10.1086/111605
- Mahler et al. (2018) Mahler, G., Richard, J., Clément, B., et al. 2018, MNRAS, 473, 663, doi: 10.1093/mnras/stx1971
- McCully et al. (2014) McCully, C., Keeton, C. R., Wong, K. C., & Zabludoff, A. I. 2014, MNRAS, 443, 3631, doi: 10.1093/mnras/stu1316
- Meena et al. (2022) Meena, A. K., Arad, O., & Zitrin, A. 2022, MNRAS, 514, 2545, doi: 10.1093/mnras/stac1511
- Merten et al. (2009) Merten, J., Cacciato, M., Meneghetti, M., Mignone, C., & Bartelmann, M. 2009, A&A, 500, 681, doi: 10.1051/0004-6361/200810372
- Merten et al. (2011a) Merten, J., Coe, D., Dupke, R., et al. 2011a, MNRAS, 417, 333, doi: 10.1111/j.1365-2966.2011.19266.x
- Merten et al. (2011b) —. 2011b, MNRAS, 417, 333, doi: 10.1111/j.1365-2966.2011.19266.x
- Miralda-Escude (1991) Miralda-Escude, J. 1991, ApJ, 379, 94, doi: 10.1086/170486
- Oguri (2010) Oguri, M. 2010, PASJ, 62, 1017, doi: 10.1093/pasj/62.4.1017
- Oguri et al. (2018) Oguri, M., Diego, J. M., Kaiser, N., Kelly, P. L., & Broadhurst, T. 2018, Phys. Rev. D, 97, 023518, doi: 10.1103/PhysRevD.97.023518
- Oke & Gunn (1983) Oke, J. B., & Gunn, J. E. 1983, ApJ, 266, 713, doi: 10.1086/160817
- Owers et al. (2011) Owers, M. S., Randall, S. W., Nulsen, P. E. J., et al. 2011, ApJ, 728, 27, doi: 10.1088/0004-637X/728/1/27
- Richardson (1972) Richardson, W. H. 1972, Journal of the Optical Society of America (1917-1983), 62, 55
- Roberts-Borsani et al. (2022) Roberts-Borsani, G., Morishita, T., Treu, T., et al. 2022, arXiv e-prints, arXiv:2207.11387. https://arxiv.org/abs/2207.11387
- Rodney et al. (2016) Rodney, S. A., Strolger, L.-G., Kelly, P. L., et al. 2016, ApJ, 820, 50, doi: 10.3847/0004-637X/820/1/50
- Rodney et al. (2018) Rodney, S. A., Balestra, I., Bradac, M., et al. 2018, Nature Astronomy, 2, 324, doi: 10.1038/s41550-018-0405-4
- Sana et al. (2012) Sana, H., de Mink, S. E., de Koter, A., et al. 2012, Science, 337, 444, doi: 10.1126/science.1223344
- Sana et al. (2014) Sana, H., Le Bouquin, J. B., Lacour, S., et al. 2014, ApJS, 215, 15, doi: 10.1088/0067-0049/215/1/15
- Schlafly & Finkbeiner (2011) Schlafly, E. F., & Finkbeiner, D. P. 2011, ApJ, 737, 103, doi: 10.1088/0004-637X/737/2/103
- Schreiber & Dickinson (2017) Schreiber, C., & Dickinson, H. 2017, FAST++, https://github.com/cschreib/fastpp
- Sebesta et al. (2016) Sebesta, K., Williams, L. L. R., Mohammed, I., Saha, P., & Liesenborgs, J. 2016, MNRAS, 461, 2126, doi: 10.1093/mnras/stw1433
- Treu et al. (2016) Treu, T., Brammer, G., Diego, J. M., et al. 2016, ApJ, 817, 60, doi: 10.3847/0004-637X/817/1/60
- Treu et al. (2022) Treu, T., Roberts-Borsani, G., Bradac, M., et al. 2022, arXiv e-prints, arXiv:2206.07978. https://arxiv.org/abs/2206.07978
- Venumadhav et al. (2017) Venumadhav, T., Dai, L., & Miralda-Escudé, J. 2017, ApJ, 850, 49, doi: 10.3847/1538-4357/aa9575
- Wang et al. (2015) Wang, X., Hoag, A. T., Huang, K.-H., et al. 2015, ApJ, 811, 29, doi: 10.1088/0004-637x/811/1/29
- Welch et al. (2022) Welch, B., Coe, D., Diego, J. M., et al. 2022, Nature, 603, 815, doi: 10.1038/s41586-022-04449-y
- Windhorst et al. (2018) Windhorst, R. A., Timmes, F. X., Wyithe, J. S. B., et al. 2018, ApJS, 234, 41, doi: 10.3847/1538-4365/aaa760
- Zitrin et al. (2009) Zitrin, A., Broadhurst, T., Umetsu, K., et al. 2009, MNRAS, 396, 1985, doi: 10.1111/j.1365-2966.2009.14899.x
- Zitrin et al. (2013) Zitrin, A., Meneghetti, M., Umetsu, K., et al. 2013, ApJ, 762, L30, doi: 10.1088/2041-8205/762/2/L30