Beam Energy Dependence of Fifth and Sixth-Order Net-proton Number Fluctuations in Au+Au Collisions at RHIC
B. E. Aboona
Texas A&M University, College Station, Texas 77843
J. Adam
Czech Technical University in Prague, FNSPE, Prague 115 19, Czech Republic
L. Adamczyk
AGH University of Science and Technology, FPACS, Cracow 30-059, Poland
J. R. Adams
Ohio State University, Columbus, Ohio 43210
I. Aggarwal
Panjab University, Chandigarh 160014, India
M. M. Aggarwal
Panjab University, Chandigarh 160014, India
Z. Ahammed
Variable Energy Cyclotron Centre, Kolkata 700064, India
D. M. Anderson
Texas A&M University, College Station, Texas 77843
E. C. Aschenauer
Brookhaven National Laboratory, Upton, New York 11973
J. Atchison
Abilene Christian University, Abilene, Texas 79699
V. Bairathi
Instituto de Alta Investigación, Universidad de Tarapacá, Arica 1000000, Chile
W. Baker
University of California, Riverside, California 92521
J. G. Ball Cap
University of Houston, Houston, Texas 77204
K. Barish
University of California, Riverside, California 92521
R. Bellwied
University of Houston, Houston, Texas 77204
P. Bhagat
University of Jammu, Jammu 180001, India
A. Bhasin
University of Jammu, Jammu 180001, India
S. Bhatta
State University of New York, Stony Brook, New York 11794
J. Bielcik
Czech Technical University in Prague, FNSPE, Prague 115 19, Czech Republic
J. Bielcikova
Nuclear Physics Institute of the CAS, Rez 250 68, Czech Republic
J. D. Brandenburg
Ohio State University, Columbus, Ohio 43210
X. Z. Cai
Shanghai Institute of Applied Physics, Chinese Academy of Sciences, Shanghai 201800
H. Caines
Yale University, New Haven, Connecticut 06520
M. Calderón de la Barca Sánchez
University of California, Davis, California 95616
D. Cebra
University of California, Davis, California 95616
J. Ceska
Czech Technical University in Prague, FNSPE, Prague 115 19, Czech Republic
I. Chakaberia
Lawrence Berkeley National Laboratory, Berkeley, California 94720
P. Chaloupka
Czech Technical University in Prague, FNSPE, Prague 115 19, Czech Republic
B. K. Chan
University of California, Los Angeles, California 90095
Z. Chang
Indiana University, Bloomington, Indiana 47408
D. Chen
University of California, Riverside, California 92521
J. Chen
Shandong University, Qingdao, Shandong 266237
J. H. Chen
Fudan University, Shanghai, 200433
Z. Chen
Shandong University, Qingdao, Shandong 266237
J. Cheng
Tsinghua University, Beijing 100084
Y. Cheng
University of California, Los Angeles, California 90095
S. Choudhury
Fudan University, Shanghai, 200433
W. Christie
Brookhaven National Laboratory, Upton, New York 11973
X. Chu
Brookhaven National Laboratory, Upton, New York 11973
H. J. Crawford
University of California, Berkeley, California 94720
M. Csanád
ELTE Eötvös Loránd University, Budapest, Hungary H-1117
G. Dale-Gau
University of Illinois at Chicago, Chicago, Illinois 60607
A. Das
Czech Technical University in Prague, FNSPE, Prague 115 19, Czech Republic
M. Daugherity
Abilene Christian University, Abilene, Texas 79699
I. M. Deppner
University of Heidelberg, Heidelberg 69120, Germany
A. Dhamija
Panjab University, Chandigarh 160014, India
L. Di Carlo
Wayne State University, Detroit, Michigan 48201
L. Didenko
Brookhaven National Laboratory, Upton, New York 11973
P. Dixit
Indian Institute of Science Education and Research (IISER), Berhampur 760010 , India
X. Dong
Lawrence Berkeley National Laboratory, Berkeley, California 94720
J. L. Drachenberg
Abilene Christian University, Abilene, Texas 79699
E. Duckworth
Kent State University, Kent, Ohio 44242
J. C. Dunlop
Brookhaven National Laboratory, Upton, New York 11973
J. Engelage
University of California, Berkeley, California 94720
G. Eppley
Rice University, Houston, Texas 77251
S. Esumi
University of Tsukuba, Tsukuba, Ibaraki 305-8571, Japan
O. Evdokimov
University of Illinois at Chicago, Chicago, Illinois 60607
A. Ewigleben
Lehigh University, Bethlehem, Pennsylvania 18015
O. Eyser
Brookhaven National Laboratory, Upton, New York 11973
R. Fatemi
University of Kentucky, Lexington, Kentucky 40506-0055
S. Fazio
University of Calabria & INFN-Cosenza, Italy
C. J. Feng
National Cheng Kung University, Tainan 70101
Y. Feng
Purdue University, West Lafayette, Indiana 47907
E. Finch
Southern Connecticut State University, New Haven, Connecticut 06515
Y. Fisyak
Brookhaven National Laboratory, Upton, New York 11973
F. A. Flor
Yale University, New Haven, Connecticut 06520
C. Fu
Central China Normal University, Wuhan, Hubei 430079
C. A. Gagliardi
Texas A&M University, College Station, Texas 77843
T. Galatyuk
Technische Universität Darmstadt, Darmstadt 64289, Germany
F. Geurts
Rice University, Houston, Texas 77251
N. Ghimire
Temple University, Philadelphia, Pennsylvania 19122
A. Gibson
Valparaiso University, Valparaiso, Indiana 46383
K. Gopal
Indian Institute of Science Education and Research (IISER) Tirupati, Tirupati 517507, India
X. Gou
Shandong University, Qingdao, Shandong 266237
D. Grosnick
Valparaiso University, Valparaiso, Indiana 46383
A. Gupta
University of Jammu, Jammu 180001, India
W. Guryn
Brookhaven National Laboratory, Upton, New York 11973
A. Hamed
American University of Cairo, New Cairo 11835, New Cairo, Egypt
Y. Han
Rice University, Houston, Texas 77251
S. Harabasz
Technische Universität Darmstadt, Darmstadt 64289, Germany
M. D. Harasty
University of California, Davis, California 95616
J. W. Harris
Yale University, New Haven, Connecticut 06520
H. Harrison
University of Kentucky, Lexington, Kentucky 40506-0055
W. He
Fudan University, Shanghai, 200433
X. H. He
Institute of Modern Physics, Chinese Academy of Sciences, Lanzhou, Gansu 730000
Y. He
Shandong University, Qingdao, Shandong 266237
S. Heppelmann
University of California, Davis, California 95616
N. Herrmann
University of Heidelberg, Heidelberg 69120, Germany
L. Holub
Czech Technical University in Prague, FNSPE, Prague 115 19, Czech Republic
C. Hu
Institute of Modern Physics, Chinese Academy of Sciences, Lanzhou, Gansu 730000
Q. Hu
Institute of Modern Physics, Chinese Academy of Sciences, Lanzhou, Gansu 730000
Y. Hu
Lawrence Berkeley National Laboratory, Berkeley, California 94720
H. Huang
National Cheng Kung University, Tainan 70101
H. Z. Huang
University of California, Los Angeles, California 90095
S. L. Huang
State University of New York, Stony Brook, New York 11794
T. Huang
University of Illinois at Chicago, Chicago, Illinois 60607
X. Huang
Tsinghua University, Beijing 100084
Y. Huang
Tsinghua University, Beijing 100084
Y. Huang
Central China Normal University, Wuhan, Hubei 430079
T. J. Humanic
Ohio State University, Columbus, Ohio 43210
D. Isenhower
Abilene Christian University, Abilene, Texas 79699
M. Isshiki
University of Tsukuba, Tsukuba, Ibaraki 305-8571, Japan
W. W. Jacobs
Indiana University, Bloomington, Indiana 47408
A. Jalotra
University of Jammu, Jammu 180001, India
C. Jena
Indian Institute of Science Education and Research (IISER) Tirupati, Tirupati 517507, India
A. Jentsch
Brookhaven National Laboratory, Upton, New York 11973
Y. Ji
Lawrence Berkeley National Laboratory, Berkeley, California 94720
J. Jia
Brookhaven National Laboratory, Upton, New York 11973
State University of New York, Stony Brook, New York 11794
C. Jin
Rice University, Houston, Texas 77251
X. Ju
University of Science and Technology of China, Hefei, Anhui 230026
E. G. Judd
University of California, Berkeley, California 94720
S. Kabana
Instituto de Alta Investigación, Universidad de Tarapacá, Arica 1000000, Chile
M. L. Kabir
University of California, Riverside, California 92521
S. Kagamaster
Lehigh University, Bethlehem, Pennsylvania 18015
D. Kalinkin
University of Kentucky, Lexington, Kentucky 40506-0055
Brookhaven National Laboratory, Upton, New York 11973
K. Kang
Tsinghua University, Beijing 100084
D. Kapukchyan
University of California, Riverside, California 92521
K. Kauder
Brookhaven National Laboratory, Upton, New York 11973
H. W. Ke
Brookhaven National Laboratory, Upton, New York 11973
D. Keane
Kent State University, Kent, Ohio 44242
M. Kelsey
Wayne State University, Detroit, Michigan 48201
Y. V. Khyzhniak
Ohio State University, Columbus, Ohio 43210
D. P. Kikoła
Warsaw University of Technology, Warsaw 00-661, Poland
B. Kimelman
University of California, Davis, California 95616
D. Kincses
ELTE Eötvös Loránd University, Budapest, Hungary H-1117
I. Kisel
Frankfurt Institute for Advanced Studies FIAS, Frankfurt 60438, Germany
A. Kiselev
Brookhaven National Laboratory, Upton, New York 11973
A. G. Knospe
Lehigh University, Bethlehem, Pennsylvania 18015
H. S. Ko
Lawrence Berkeley National Laboratory, Berkeley, California 94720
L. K. Kosarzewski
Czech Technical University in Prague, FNSPE, Prague 115 19, Czech Republic
L. Kramarik
Czech Technical University in Prague, FNSPE, Prague 115 19, Czech Republic
L. Kumar
Panjab University, Chandigarh 160014, India
S. Kumar
Institute of Modern Physics, Chinese Academy of Sciences, Lanzhou, Gansu 730000
R. Kunnawalkam Elayavalli
Yale University, New Haven, Connecticut 06520
R. Lacey
State University of New York, Stony Brook, New York 11794
J. M. Landgraf
Brookhaven National Laboratory, Upton, New York 11973
J. Lauret
Brookhaven National Laboratory, Upton, New York 11973
A. Lebedev
Brookhaven National Laboratory, Upton, New York 11973
J. H. Lee
Brookhaven National Laboratory, Upton, New York 11973
Y. H. Leung
University of Heidelberg, Heidelberg 69120, Germany
N. Lewis
Brookhaven National Laboratory, Upton, New York 11973
C. Li
Shandong University, Qingdao, Shandong 266237
C. Li
University of Science and Technology of China, Hefei, Anhui 230026
W. Li
Rice University, Houston, Texas 77251
X. Li
University of Science and Technology of China, Hefei, Anhui 230026
Y. Li
University of Science and Technology of China, Hefei, Anhui 230026
Y. Li
Tsinghua University, Beijing 100084
Z. Li
University of Science and Technology of China, Hefei, Anhui 230026
X. Liang
University of California, Riverside, California 92521
Y. Liang
Kent State University, Kent, Ohio 44242
R. Licenik
Nuclear Physics Institute of the CAS, Rez 250 68, Czech Republic
Czech Technical University in Prague, FNSPE, Prague 115 19, Czech Republic
T. Lin
Shandong University, Qingdao, Shandong 266237
M. A. Lisa
Ohio State University, Columbus, Ohio 43210
C. Liu
Institute of Modern Physics, Chinese Academy of Sciences, Lanzhou, Gansu 730000
F. Liu
Central China Normal University, Wuhan, Hubei 430079
H. Liu
Indiana University, Bloomington, Indiana 47408
H. Liu
Central China Normal University, Wuhan, Hubei 430079
L. Liu
Central China Normal University, Wuhan, Hubei 430079
T. Liu
Yale University, New Haven, Connecticut 06520
X. Liu
Ohio State University, Columbus, Ohio 43210
Y. Liu
Texas A&M University, College Station, Texas 77843
Z. Liu
Central China Normal University, Wuhan, Hubei 430079
T. Ljubicic
Brookhaven National Laboratory, Upton, New York 11973
W. J. Llope
Wayne State University, Detroit, Michigan 48201
O. Lomicky
Czech Technical University in Prague, FNSPE, Prague 115 19, Czech Republic
R. S. Longacre
Brookhaven National Laboratory, Upton, New York 11973
E. Loyd
University of California, Riverside, California 92521
T. Lu
Institute of Modern Physics, Chinese Academy of Sciences, Lanzhou, Gansu 730000
N. S. Lukow
Temple University, Philadelphia, Pennsylvania 19122
X. F. Luo
Central China Normal University, Wuhan, Hubei 430079
L. Ma
Fudan University, Shanghai, 200433
R. Ma
Brookhaven National Laboratory, Upton, New York 11973
Y. G. Ma
Fudan University, Shanghai, 200433
N. Magdy
State University of New York, Stony Brook, New York 11794
D. Mallick
National Institute of Science Education and Research, HBNI, Jatni 752050, India
S. Margetis
Kent State University, Kent, Ohio 44242
C. Markert
University of Texas, Austin, Texas 78712
H. S. Matis
Lawrence Berkeley National Laboratory, Berkeley, California 94720
J. A. Mazer
Rutgers University, Piscataway, New Jersey 08854
G. McNamara
Wayne State University, Detroit, Michigan 48201
K. Mi
Central China Normal University, Wuhan, Hubei 430079
S. Mioduszewski
Texas A&M University, College Station, Texas 77843
B. Mohanty
National Institute of Science Education and Research, HBNI, Jatni 752050, India
I. Mooney
Yale University, New Haven, Connecticut 06520
A. Mukherjee
ELTE Eötvös Loránd University, Budapest, Hungary H-1117
M. I. Nagy
ELTE Eötvös Loránd University, Budapest, Hungary H-1117
A. S. Nain
Panjab University, Chandigarh 160014, India
J. D. Nam
Temple University, Philadelphia, Pennsylvania 19122
Md. Nasim
Indian Institute of Science Education and Research (IISER), Berhampur 760010 , India
D. Neff
University of California, Los Angeles, California 90095
J. M. Nelson
University of California, Berkeley, California 94720
D. B. Nemes
Yale University, New Haven, Connecticut 06520
M. Nie
Shandong University, Qingdao, Shandong 266237
T. Niida
University of Tsukuba, Tsukuba, Ibaraki 305-8571, Japan
R. Nishitani
University of Tsukuba, Tsukuba, Ibaraki 305-8571, Japan
T. Nonaka
University of Tsukuba, Tsukuba, Ibaraki 305-8571, Japan
A. S. Nunes
Brookhaven National Laboratory, Upton, New York 11973
G. Odyniec
Lawrence Berkeley National Laboratory, Berkeley, California 94720
A. Ogawa
Brookhaven National Laboratory, Upton, New York 11973
S. Oh
Lawrence Berkeley National Laboratory, Berkeley, California 94720
K. Okubo
University of Tsukuba, Tsukuba, Ibaraki 305-8571, Japan
B. S. Page
Brookhaven National Laboratory, Upton, New York 11973
R. Pak
Brookhaven National Laboratory, Upton, New York 11973
J. Pan
Texas A&M University, College Station, Texas 77843
A. Pandav
National Institute of Science Education and Research, HBNI, Jatni 752050, India
A. K. Pandey
Institute of Modern Physics, Chinese Academy of Sciences, Lanzhou, Gansu 730000
T. Pani
Rutgers University, Piscataway, New Jersey 08854
A. Paul
University of California, Riverside, California 92521
B. Pawlik
Institute of Nuclear Physics PAN, Cracow 31-342, Poland
D. Pawlowska
Warsaw University of Technology, Warsaw 00-661, Poland
C. Perkins
University of California, Berkeley, California 94720
J. Pluta
Warsaw University of Technology, Warsaw 00-661, Poland
B. R. Pokhrel
Temple University, Philadelphia, Pennsylvania 19122
M. Posik
Temple University, Philadelphia, Pennsylvania 19122
T. Protzman
Lehigh University, Bethlehem, Pennsylvania 18015
V. Prozorova
Czech Technical University in Prague, FNSPE, Prague 115 19, Czech Republic
N. K. Pruthi
Panjab University, Chandigarh 160014, India
M. Przybycien
AGH University of Science and Technology, FPACS, Cracow 30-059, Poland
J. Putschke
Wayne State University, Detroit, Michigan 48201
Z. Qin
Tsinghua University, Beijing 100084
H. Qiu
Institute of Modern Physics, Chinese Academy of Sciences, Lanzhou, Gansu 730000
A. Quintero
Temple University, Philadelphia, Pennsylvania 19122
C. Racz
University of California, Riverside, California 92521
S. K. Radhakrishnan
Kent State University, Kent, Ohio 44242
N. Raha
Wayne State University, Detroit, Michigan 48201
R. L. Ray
University of Texas, Austin, Texas 78712
R. Reed
Lehigh University, Bethlehem, Pennsylvania 18015
H. G. Ritter
Lawrence Berkeley National Laboratory, Berkeley, California 94720
C. W. Robertson
Purdue University, West Lafayette, Indiana 47907
M. Robotkova
Nuclear Physics Institute of the CAS, Rez 250 68, Czech Republic
Czech Technical University in Prague, FNSPE, Prague 115 19, Czech Republic
J. L. Romero
University of California, Davis, California 95616
M. A. Rosales Aguilar
University of Kentucky, Lexington, Kentucky 40506-0055
D. Roy
Rutgers University, Piscataway, New Jersey 08854
P. Roy Chowdhury
Warsaw University of Technology, Warsaw 00-661, Poland
L. Ruan
Brookhaven National Laboratory, Upton, New York 11973
A. K. Sahoo
Indian Institute of Science Education and Research (IISER), Berhampur 760010 , India
N. R. Sahoo
Shandong University, Qingdao, Shandong 266237
H. Sako
University of Tsukuba, Tsukuba, Ibaraki 305-8571, Japan
S. Salur
Rutgers University, Piscataway, New Jersey 08854
S. Sato
University of Tsukuba, Tsukuba, Ibaraki 305-8571, Japan
W. B. Schmidke
Brookhaven National Laboratory, Upton, New York 11973
N. Schmitz
Max-Planck-Institut für Physik, Munich 80805, Germany
F-J. Seck
Technische Universität Darmstadt, Darmstadt 64289, Germany
J. Seger
Creighton University, Omaha, Nebraska 68178
R. Seto
University of California, Riverside, California 92521
P. Seyboth
Max-Planck-Institut für Physik, Munich 80805, Germany
N. Shah
Indian Institute Technology, Patna, Bihar 801106, India
P. V. Shanmuganathan
Brookhaven National Laboratory, Upton, New York 11973
M. Shao
University of Science and Technology of China, Hefei, Anhui 230026
T. Shao
Fudan University, Shanghai, 200433
M. Sharma
University of Jammu, Jammu 180001, India
N. Sharma
Indian Institute of Science Education and Research (IISER), Berhampur 760010 , India
R. Sharma
Indian Institute of Science Education and Research (IISER) Tirupati, Tirupati 517507, India
S. R. Sharma
Indian Institute of Science Education and Research (IISER) Tirupati, Tirupati 517507, India
A. I. Sheikh
Kent State University, Kent, Ohio 44242
D. Y. Shen
Fudan University, Shanghai, 200433
K. Shen
University of Science and Technology of China, Hefei, Anhui 230026
S. S. Shi
Central China Normal University, Wuhan, Hubei 430079
Y. Shi
Shandong University, Qingdao, Shandong 266237
Q. Y. Shou
Fudan University, Shanghai, 200433
F. Si
University of Science and Technology of China, Hefei, Anhui 230026
J. Singh
Panjab University, Chandigarh 160014, India
S. Singha
Institute of Modern Physics, Chinese Academy of Sciences, Lanzhou, Gansu 730000
P. Sinha
Indian Institute of Science Education and Research (IISER) Tirupati, Tirupati 517507, India
M. J. Skoby
Ball State University, Muncie, Indiana, 47306
Purdue University, West Lafayette, Indiana 47907
N. Smirnov
Yale University, New Haven, Connecticut 06520
Y. Söhngen
University of Heidelberg, Heidelberg 69120, Germany
Y. Song
Yale University, New Haven, Connecticut 06520
B. Srivastava
Purdue University, West Lafayette, Indiana 47907
T. D. S. Stanislaus
Valparaiso University, Valparaiso, Indiana 46383
M. Stefaniak
Ohio State University, Columbus, Ohio 43210
D. J. Stewart
Wayne State University, Detroit, Michigan 48201
B. Stringfellow
Purdue University, West Lafayette, Indiana 47907
Y. Su
University of Science and Technology of China, Hefei, Anhui 230026
A. A. P. Suaide
Universidade de São Paulo, São Paulo, Brazil 05314-970
M. Sumbera
Nuclear Physics Institute of the CAS, Rez 250 68, Czech Republic
C. Sun
State University of New York, Stony Brook, New York 11794
X. Sun
Institute of Modern Physics, Chinese Academy of Sciences, Lanzhou, Gansu 730000
Y. Sun
University of Science and Technology of China, Hefei, Anhui 230026
Y. Sun
Huzhou University, Huzhou, Zhejiang 313000
B. Surrow
Temple University, Philadelphia, Pennsylvania 19122
Z. W. Sweger
University of California, Davis, California 95616
P. Szymanski
Warsaw University of Technology, Warsaw 00-661, Poland
A. Tamis
Yale University, New Haven, Connecticut 06520
A. H. Tang
Brookhaven National Laboratory, Upton, New York 11973
Z. Tang
University of Science and Technology of China, Hefei, Anhui 230026
T. Tarnowsky
Michigan State University, East Lansing, Michigan 48824
J. H. Thomas
Lawrence Berkeley National Laboratory, Berkeley, California 94720
A. R. Timmins
University of Houston, Houston, Texas 77204
D. Tlusty
Creighton University, Omaha, Nebraska 68178
T. Todoroki
University of Tsukuba, Tsukuba, Ibaraki 305-8571, Japan
C. A. Tomkiel
Lehigh University, Bethlehem, Pennsylvania 18015
S. Trentalange
University of California, Los Angeles, California 90095
R. E. Tribble
Texas A&M University, College Station, Texas 77843
P. Tribedy
Brookhaven National Laboratory, Upton, New York 11973
T. Truhlar
Czech Technical University in Prague, FNSPE, Prague 115 19, Czech Republic
B. A. Trzeciak
Czech Technical University in Prague, FNSPE, Prague 115 19, Czech Republic
O. D. Tsai
University of California, Los Angeles, California 90095
Brookhaven National Laboratory, Upton, New York 11973
C. Y. Tsang
Kent State University, Kent, Ohio 44242
Brookhaven National Laboratory, Upton, New York 11973
Z. Tu
Brookhaven National Laboratory, Upton, New York 11973
T. Ullrich
Brookhaven National Laboratory, Upton, New York 11973
D. G. Underwood
Argonne National Laboratory, Argonne, Illinois 60439
Valparaiso University, Valparaiso, Indiana 46383
I. Upsal
Rice University, Houston, Texas 77251
G. Van Buren
Brookhaven National Laboratory, Upton, New York 11973
J. Vanek
Brookhaven National Laboratory, Upton, New York 11973
I. Vassiliev
Frankfurt Institute for Advanced Studies FIAS, Frankfurt 60438, Germany
V. Verkest
Wayne State University, Detroit, Michigan 48201
F. Videbæk
Brookhaven National Laboratory, Upton, New York 11973
S. A. Voloshin
Wayne State University, Detroit, Michigan 48201
F. Wang
Purdue University, West Lafayette, Indiana 47907
G. Wang
University of California, Los Angeles, California 90095
J. S. Wang
Huzhou University, Huzhou, Zhejiang 313000
X. Wang
Shandong University, Qingdao, Shandong 266237
Y. Wang
University of Science and Technology of China, Hefei, Anhui 230026
Y. Wang
Central China Normal University, Wuhan, Hubei 430079
Y. Wang
Tsinghua University, Beijing 100084
Z. Wang
Shandong University, Qingdao, Shandong 266237
J. C. Webb
Brookhaven National Laboratory, Upton, New York 11973
P. C. Weidenkaff
University of Heidelberg, Heidelberg 69120, Germany
G. D. Westfall
Michigan State University, East Lansing, Michigan 48824
D. Wielanek
Warsaw University of Technology, Warsaw 00-661, Poland
H. Wieman
Lawrence Berkeley National Laboratory, Berkeley, California 94720
G. Wilks
University of Illinois at Chicago, Chicago, Illinois 60607
S. W. Wissink
Indiana University, Bloomington, Indiana 47408
R. Witt
United States Naval Academy, Annapolis, Maryland 21402
J. Wu
Central China Normal University, Wuhan, Hubei 430079
J. Wu
Institute of Modern Physics, Chinese Academy of Sciences, Lanzhou, Gansu 730000
X. Wu
University of California, Los Angeles, California 90095
Y. Wu
University of California, Riverside, California 92521
B. Xi
Shanghai Institute of Applied Physics, Chinese Academy of Sciences, Shanghai 201800
Z. G. Xiao
Tsinghua University, Beijing 100084
W. Xie
Purdue University, West Lafayette, Indiana 47907
H. Xu
Huzhou University, Huzhou, Zhejiang 313000
N. Xu
Lawrence Berkeley National Laboratory, Berkeley, California 94720
Q. H. Xu
Shandong University, Qingdao, Shandong 266237
Y. Xu
Shandong University, Qingdao, Shandong 266237
Y. Xu
Central China Normal University, Wuhan, Hubei 430079
Z. Xu
Brookhaven National Laboratory, Upton, New York 11973
Z. Xu
University of California, Los Angeles, California 90095
G. Yan
Shandong University, Qingdao, Shandong 266237
Z. Yan
State University of New York, Stony Brook, New York 11794
C. Yang
Shandong University, Qingdao, Shandong 266237
Q. Yang
Shandong University, Qingdao, Shandong 266237
S. Yang
South China Normal University, Guangzhou, Guangdong 510631
Y. Yang
National Cheng Kung University, Tainan 70101
Z. Ye
Rice University, Houston, Texas 77251
Z. Ye
University of Illinois at Chicago, Chicago, Illinois 60607
L. Yi
Shandong University, Qingdao, Shandong 266237
K. Yip
Brookhaven National Laboratory, Upton, New York 11973
Y. Yu
Shandong University, Qingdao, Shandong 266237
H. Zbroszczyk
Warsaw University of Technology, Warsaw 00-661, Poland
W. Zha
University of Science and Technology of China, Hefei, Anhui 230026
C. Zhang
State University of New York, Stony Brook, New York 11794
D. Zhang
Central China Normal University, Wuhan, Hubei 430079
J. Zhang
Shandong University, Qingdao, Shandong 266237
S. Zhang
University of Science and Technology of China, Hefei, Anhui 230026
X. Zhang
Institute of Modern Physics, Chinese Academy of Sciences, Lanzhou, Gansu 730000
Y. Zhang
Institute of Modern Physics, Chinese Academy of Sciences, Lanzhou, Gansu 730000
Y. Zhang
University of Science and Technology of China, Hefei, Anhui 230026
Y. Zhang
Central China Normal University, Wuhan, Hubei 430079
Z. J. Zhang
National Cheng Kung University, Tainan 70101
Z. Zhang
Brookhaven National Laboratory, Upton, New York 11973
Z. Zhang
University of Illinois at Chicago, Chicago, Illinois 60607
F. Zhao
Institute of Modern Physics, Chinese Academy of Sciences, Lanzhou, Gansu 730000
J. Zhao
Fudan University, Shanghai, 200433
M. Zhao
Brookhaven National Laboratory, Upton, New York 11973
C. Zhou
Fudan University, Shanghai, 200433
J. Zhou
University of Science and Technology of China, Hefei, Anhui 230026
S. Zhou
Central China Normal University, Wuhan, Hubei 430079
Y. Zhou
Central China Normal University, Wuhan, Hubei 430079
X. Zhu
Tsinghua University, Beijing 100084
M. Zurek
Argonne National Laboratory, Argonne, Illinois 60439
M. Zyzak
Frankfurt Institute for Advanced Studies FIAS, Frankfurt 60438, Germany
(February 24, 2023)
Abstract
We report the beam energy and collision centrality dependence of fifth and sixth order cumulants (, ) and factorial cumulants (, ) of net-proton and proton number distributions, from center-of-mass energy () 3 GeV to 200 GeV Au+Au collisions at RHIC. Cumulant ratios of net-proton (taken as proxy for net-baryon) distributions generally follow the hierarchy expected from QCD thermodynamics, except for the case of collisions at 3 GeV. The measured values of for 0-40% centrality collisions show progressively negative trend with decreasing energy, while it is positive for the lowest energy studied. These observed negative signs are consistent with QCD calculations (for baryon chemical potential, 110 MeV) which contains the crossover transition range. In addition, for energies above 7.7 GeV, the measured proton , within uncertainties, does not support the two-component (PoissonBinomial) shape of proton number distributions that would be expected from a first-order phase transition. Taken in combination, the hyper-order proton number fluctuations suggest that the structure of QCD matter at high baryon density, MeV at = 3 GeV is starkly different from those at vanishing MeV at = 200 GeV and higher collision energies.
An important goal of heavy-ion physics is to study the phase structure of strongly interacting matter. The phase diagram of such strongly-interacting matter, known as the Quantum Chromodynamics (QCD) phase diagram, shows the phase structure as a function of temperature () and baryon chemical potential () Rajagopal and Wilczek (2000); Bzdak et al. (2020).
Lattice QCD (LQCD) calculations have established the quark-hadron phase transition as a smooth crossover at vanishing Aoki et al. (2006). At large , QCD-based model calculations indicate that the crossover is replaced by a first-order transition Ejiri (2008); Bowman and Kapusta (2009) which terminates at a critical point.
Varying the collision energy of heavy nuclei results in a variation in and of the strongly-interacting system produced in these collisions, allowing an experimental study of the QCD phase diagram Braun-Munzinger and Stachel (2007). Event-by-event fluctuations or cumulants of net-particle number () distributions in heavy-ion collisions are sensitive observables for this study Stephanov et al. (1999); Stephanov (2009, 2011); Asakawa et al. (2009). The cumulants are extensive quantities that can be used to characterize the shape of a distribution. The fifth and sixth-order cumulants, relevant to the current study, are defined as follows: and , where (For details see Supplemental Material Material ). For a thermalized system, the ratio of cumulants are directly linked to the susceptibilities () calculated in a fixed volume, as done in lattice QCD, and in QCD-based and thermal models Gavai and Gupta (2011); Gupta et al. (2011); Karsch and Redlich (2011); Garg et al. (2013). Experimental measurement of higher order cumulants are also important to understand thermalization in high energy nuclear collisions where the size and duration of the medium is limited Gupta et al. (2022). The cumulants, up to the fourth order of various net-particle multiplicity distributions have been analyzed from the first phase of the beam energy scan (BES) program at the Relativistic Heavy-Ion Collider (RHIC) facility Aggarwal et al. (2010); Adamczyk et al. (2014a); Adam et al. (2021); Abdallah et al. (2021a); Adamczyk et al. (2018, 2014b); Adam et al. (2020); Pandav et al. (2022) and by the HADES experiment at GSI Adamczewski-Musch et al. (2020).
The fourth-to-second order cumulant ratio, , of net-proton number distributions from the Solenoidal Tracker at RHIC (STAR) experiment shows a non-monotonic collision energy dependence that is qualitatively consistent with expectations from a critical point in the QCD phase diagram Adam et al. (2021).
Up to the fourth-order net-proton cumulant ratios, the experimental measurements are positive Adam et al. (2021) which is reproduced by several model calculations. These include calculations with a crossover quark-hadron transition such as the LQCD Bazavov et al. (2020) and the QCD-based functional renormalization group (FRG) model Fu et al. (2021), and those without any phase transition effects like the hadronic transport model UrQMD Bleicher et al. (1999) and the thermal hadron resonance gas (HRG) model Garg et al. (2013). Only after extending the order of fluctuations to five and six (also called hyper-orders) do the theoretical calculations with and without QCD phase transitions show a difference in sign. Negative sign of baryon number susceptibility ratios, and (also called hyper-skewness and hyper-kurtosis, respectively) is predicted by LQCD Borsanyi et al. (2018); Bazavov et al. (2020) near the quark-hadron transition temperature for 110 MeV. The FRG calculations also yield negative and over a wide range 24 – 420 MeV corresponding to central Au+Au collisions at GeV Fu et al. (2021). Additionally, a particular ordering of susceptibility ratios: is predicted by LQCD Bazavov et al. (2020). This is in contrast to the HRG model predictions with an ideal gas equation of state in a grand canonical ensemble framework which remain positive at unity for all ratios Borsanyi et al. (2018).
In search of the first-order phase transition, the factorial cumulants of proton multiplicity distributions have been suggested Bzdak and Koch (2019). Factorial cumulants, , up to the sixth order can be defined in terms of cumulants Ling and Stephanov (2016) as , , , , and . The presence of a mixed phase in a first-order phase transition results in a bimodal or two-component structure in the proton multiplicity distribution. Such a bimodal distribution, modeled as PoissonBinomial distributions, yields large factorial cumulants which increase in magnitude and alternate in sign with increasing order Bzdak et al. (2018); Bzdak and Koch (2019). In probing the two-component nature, the factorial cumulants are less demanding statistically and are more sensitive than regular cumulants Bzdak and Koch (2019).
The work reported in this letter is intended to identify the nature of the phase transition over a wide range in by examining the sign of the hyper-order fluctuations. A recent study of net-proton sixth-order cumulants by STAR hints at a crossover in Au+Au collisions at GeV ( MeV) Abdallah et al. (2021b). In this work, we present new data down to the lowest energy accessible by STAR ( GeV and MeV), along with the measurements of fifth-order net-proton cumulants and fifth- and sixth-order proton factorial cumulants.
The data from Au+Au collisions having signals in trigger detectors Adler et al. (2001); Llope et al. (2004) above a noise threshold (called minimum bias) at ten collision energies from 3 to 200 GeV from the STAR BES-I and fixed-target (FXT) program were analyzed. The number of analyzed events at each energy is summarized in Table 1.
Table 1: Total event statistics (in millions) in Au+Au collisions for various collision energies ().
(GeV)
3
7.7
11.5
14.5
19.6
27
39
54.4
62.4
200
Events
140
3
6.6
20
15
30
86
550
47
900
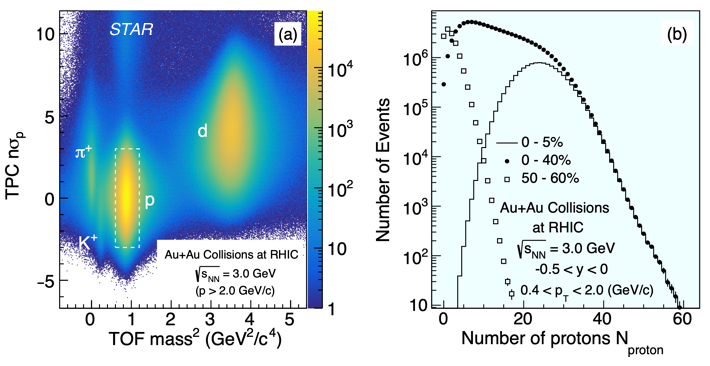
The 3 GeV collision data were collected in FXT mode with a constraint on the interaction point (also known as the primary vertex) along the beam axis () of cm, and the remaining energies were taken in the collider mode of detector operation with within cm from the center of the STAR detector except for 7.7 GeV data, where cm was used Abdallah et al. (2021a); Adamczyk et al. (2017). The tracking and particle identification (PID) are carried out using time projection chamber (TPC) and time of flight (TOF) detectors Ackermann et al. (2003). Protons and antiprotons are required to have rapidity at collider energies, and at 3 GeV due to the asymmetric detector acceptance in the fixed-target mode. The distance of closest approach (DCA) of the (anti-)proton tracks to the primary vertex is required to be less than 1 cm to suppress background Adamczyk et al. (2014a). The transverse momentum criterion of GeV/ is applied at all energies. A variable Adamczyk et al. (2018) that quantifies, in terms of standard deviation, the difference between measured from the TPC and its expected value for protons Bichsel (2006) is utilized for proton identification. We used . In addition, mass squared () measured using the TOF detector is required to satisfy in the range GeV/ to achieve high purity for protons Abdallah et al. (2021a). For FXT energy at 3 GeV, PID using both TPC and TOF is shown in panel (a) of Fig. 1. At this energy, if momentum GeV/, only the TPC is used for PID; otherwise, both TPC and TOF are used. The purity of protons in the selected kinematic space is higher than 95% at all energies Adam et al. (2021). Centrality is determined using the charged-particle multiplicity measured by the TPC, excluding protons and anti-protons to avoid self-correlations. Results from 0-40% and 50-60% centrality classes are reported. Pile-up events, which happen when separate collisions are reconstructed as a single event, are removed from the analysis by examining the correlation between multiplicities registered in the TPC and TOF Adam et al. (2021); Abdallah et al. (2021b). Additionally, at higher energies, 27 GeV, information from a vertex position detector is used for removing pileup events Abdallah et al. (2021a). Because of higher collision rates with the FXT configuration, the pile-up effect becomes large compared to that in collider mode. The correction of cumulants for this effect is then done following the method suggested in Ref. Zhang et al. (2022).
Figure 1: (a) Particle identification using (TPC) versus (TOF) for Au+Au minimum bias collisions at 3 GeV (FXT). A momentum criterion 2 GeV/ is applied when using for proton PID. (b) Proton multiplicity distributions from three collision centralities. These distributions are not corrected for detector efficiency and pile-up effects.Figure 2: (a), (b), (c) of proton distribution in Au+Au collisions from 3 GeV to 200 GeV. The results are shown for 0-40% (squares) and 50-60% (diamonds) centralities. The bars and bands on the data points represent the statistical and systematic uncertainties, respectively. The Two-Component Model (0-40%) and UrQMD model (0-40% and 50-60%) calculations are shown as red, brown bands and blue dashed lines, respectively. The Two-Component Model (with Binomial and Poissonian distributions as constituent components) requires up to the fourth order as inputs to predict and . Uncertainties are statistical for the model calculations. The and data at 7.7 GeV (0-40%) are scaled down by a factor of 4 for clarity of presentation.
Panel (b) of Fig 1 shows proton multiplicity distributions for 0-5%, 0-40% and 50-60% collision centralities for Au+Au collisions at 3 GeV. Because the number of anti-protons is negligible at this energy (less than the number of protons by 6 orders of magnitude Abdallah et al. (2022)), cumulants of proton distributions are calculated instead of net-proton distributions. Cumulants are then corrected for finite detector efficiency assuming binomial detector response Bzdak and Koch (2012); Kitazawa and Asakawa (2012); Luo (2015); Bzdak and Koch (2015); Kitazawa (2016); Nonaka et al. (2017); Luo and Nonaka (2019). In previous work, relaxing the binomial assumption and implementing an unfolding-based correction for cumulants up to the sixth order for Au+Au collisions at GeV yielded values consistent with an analytical binomial correction formula within uncertainties Adam et al. (2021); Abdallah et al. (2021b). To suppress the initial-volume fluctuation effects on cumulants for a given centrality, a centrality bin width correction (CBWC) is performed Luo et al. (2013). While Monte-Carlo studies have shown that at low multiplicities and lower energies residual volume fluctuation effects may remain, the magnitude of the additional correction is highly model dependent Sugiura et al. (2019); Abdallah et al. (2022). Further theoretical understanding of these residual effects are clearly needed before applying to the data and therefore in this analysis only the CBWC is performed. From cumulants, we construct the factorial cumulants and ratios of cumulants which are the observables of this work. The statistical uncertainties on these observables are estimated using the bootstrap method Efron (1979); Luo (2015); Pandav et al. (2019). Systematic uncertainties are estimated by varying track selection, particle identification criteria, background estimates (DCA), and track reconstruction efficiency.
Figure 2 shows collision energy dependence of proton factorial cumulants, , and for 0-40% and 50-60% centralities. At 7.7 GeV, large positive and negative are observed for 0-40% collisions, albeit with large uncertainties. In contrast, at higher energies, the factorial cumulants of all orders show small deviations from zero and from UrQMD expectations. UrQMD calculations reproduce the 3 GeV measurements. The energy dependence trend of the and measurements is largely reproduced by calculations from a Two-Component Model for proton multiplicity, motivated by the assumption of a first-order phase transition, which inputs in its construction the experimental data of up to the fourth order and predicts and Bzdak et al. (2018); Bzdak and Koch (2019) (see Supplemental Material Material for details). Vanishing values of factorial cumulants would imply that only the Poissonian part of the Two-Component Model survives.
The small deviation from zero observed for the proton and the absence of a sign change with increasing order for energies above 7.7 GeV within uncertainties does not support the two-component structure for the proton multiplicity distributions at those energies. Note that at 54.4 GeV, a sign change is observed with increasing order for the three factorial cumulants at a level of ( is the statistical and systematic uncertainties added in quadrature). However the Two-Component Model calculation does not show such a trend. The peripheral 50-60% measurements are either positive or consistent with zero within uncertainties at all energies.
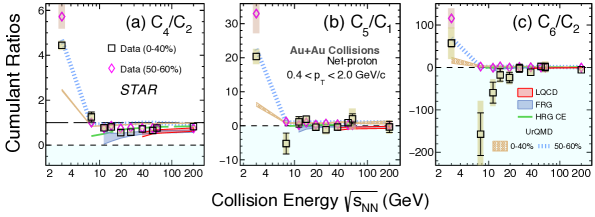
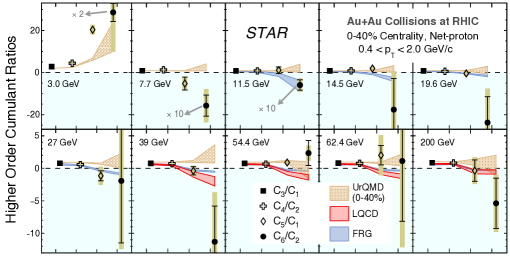
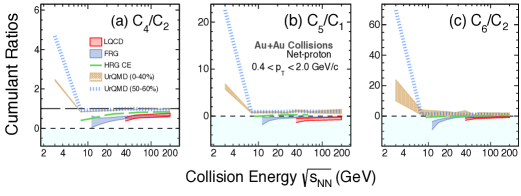
Figure 3: (a), (b) and (c) of the net-proton distribution in Au+Au collisions from 3 GeV to 200 GeV. The results are shown for 0-40% (squares) and 50-60% (diamonds) centralities. The bars and bands on the data points represent the statistical and systematic uncertainties, respectively. LQCD ( GeV) Bazavov et al. (2020), FRG ( GeV) Fu et al. (2021), UrQMD (0-40%, 50-60%), and HRG model calculations ( GeV) with canonical ensemble Braun-Munzinger et al. (2021) (HRG CE) are shown as red, gray, brown bands, blue and green dashed lines, respectively.Figure 4: (filled square), (open cross), (open diamond) and (filled circle) of net-proton distributions in 0-40% Au+Au collisions from 3 GeV to 200 GeV. The bars and bands on the data points represent the statistical and systematic uncertainties, respectively. LQCD ( GeV) Bazavov et al. (2020), FRG ( GeV) Fu et al. (2021) and UrQMD calculations (0-40% centrality) are shown as red, blue and brown bands respectively. The data at 3 GeV (7.7 and 11.5 GeV) are scaled down by a factor of 2 (10) for clarity of presentation.
As proxies for net-baryon cumulant ratios Kitazawa and Asakawa (2012), , and of net-proton distributions in Au+Au collisions from 3 GeV to 200 GeV for 0-40% and 50-60% centralities are presented in Fig. 3. for 0-40% centrality is positive at all energies.
Various model calculations presented for are also positive.
for 0-40% centrality exhibits weak collision energy dependence and fluctuates about zero with significance except at 3 GeV where it has a large positive value. for the same centrality is increasingly negative from higher to lower energies down to 7.7 GeV and becomes positive at 3 GeV. The deviations of from zero at all the energies are within . When interpreting the 3 GeV data, one should keep in mind that the initial volume fluctuation effects become significant due to lower charged particle multiplicity. The increasingly negative sign of with decreasing energy in the range 7.7 GeV to 200 GeV is qualitatively consistent with LQCD and FRG calculations that include a crossover quark-hadron transition, subject to caveats discussed in Ref. Abdallah et al. (2021b). The overall significance of observing negative in more than half of the collision energies in the range 7.7 GeV to 200 GeV is found to be (see Supplemental Material Material ). The UrQMD expectations for these two ratios are either positive or consistent with zero within uncertainties. Expectations from HRG CE are positive for energies greater than 19.6 GeV and become negative only for lower energies (see Supplemental Material Material for an enlarged view of model calculations). Recent hydrodynamic calculations also show a similar energy dependence trend as HRG CE Vovchenko et al. (2022). All three ratios are non-negative for peripheral 50-60% centrality and qualitatively consistent with UrQMD expectations. As the event statistics are lowest at 7.7 GeV (1.2 million events in 0-40% centrality) among all energies, within the current statistical limitations, the robustness of the negative sign of at 7.7 GeV (0-40%) was verified by performing a study on K-statistics Fisher (1930) (also known as unbiased estimators of a population’s cumulants) and on the sample size dependence of net-proton which involved creating random samples of varying event statistics from 7.7 GeV data (see Supplemental Material Material ). Measurements of the three ratios at collider energies using the same rapidity acceptance as for 3 GeV FXT data, i.e., , yield similar conclusions regarding the sign as reported here (see Supplemental Material Material ).
A particular ordering of net-baryon cumulant ratios: , predicted by LQCD was subjected to experimental verification in Fig. 4.
Within uncertainties, the measurements for 0-40% centrality in the energy range 7.7 GeV to 200 GeV are consistent with the ordering expected from LQCD (although at 54.4 and 62.4 GeV, the hierarchy is not as clear as at other energies). While the FRG calculations also follow the predicted hierarchy, the UrQMD calculations within uncertainties do not show any clear ordering and remain non-negative at all energies.
At 3 GeV the cumulant ratios show a reverse ordering: . The probability that the higher energy data would follow a 3 GeV ordering varies between (see Supplemental Material Material ). The ordering observed at 3 GeV is reproduced by UrQMD calculations. These observations suggest that the interactions are dominantly hadronic at 3 GeV. Recent results by the STAR experiment on proton showing suppression at 3 GeV for central 0-5% Au+Au collisions also supports this inference, indicating that the possible critical point could only exist at collision energies higher than 3 GeV Abdallah et al. (2022).
In conclusion, measurements of net-proton and and proton and are reported in Au+Au collisions over a broad range of collision energies from 3 GeV to 200 GeV corresponding to a range of 750 MeV to 24 MeV. The data are presented for 0-40% and 50-60% collision centralities. For the first time, we test the ordering of cumulant ratios expected from QCD thermodynamics. While the overall measured trend for cumulant ratios from 7.7 GeV to 200 GeV seem to follow this hierarchy, a reverse ordering is seen at 3 GeV. for 0-40% centrality is increasingly negative with decreasing energy, except at 3 GeV where it is positive. Their deviations from zero at each energy are within . The significance of finding negative (0-40%) at more than half of the collision energies over the range 7.7 GeV to 200 GeV was found to be . The negative sign of is consistent with QCD calculations ( MeV) that include a crossover quark-hadron transition.
In contrast, the peripheral 50-60% data, and calculations from the UrQMD model which does not include any QCD transition, are either positive or consistent with zero.
Proton factorial cumulants , , (0-40%) are presented as sensitive observables to probe a possible first-order phase transition Bzdak and Koch (2019). The measurements indicate the possibility of a sign change at low collision energies, although the uncertainties are large. For energies above 7.7 GeV, the measured proton within uncertainties do not support the two-component (PoissonBinomial) shape of proton distributions that is expected from a first-order phase transition.
Peripheral 50-60% data do not show a sign change with increasing order and are consistent with calculations from the UrQMD model at all energies. The agreement between the presented data and UrQMD at 3 GeV suggests that matter is predominantly hadronic at such low collision energies.
Taken together, the hyper-order proton number fluctuations suggest that the structure of QCD matter at high baryon density, MeV at GeV is starkly different from those at vanishing MeV at GeV and higher collision energies. Precision measurements in BES-II with large event statistics will be necessary to confirm these observations.
We thank the RHIC Operations Group and RCF at BNL, the NERSC Center at LBNL, and the Open Science Grid consortium for providing resources and support. This work was supported in part by the Office of Nuclear Physics within the U.S. DOE Office of Science, the U.S. National Science Foundation, National Natural Science Foundation of China, Chinese Academy of Science, the Ministry of Science and Technology of China and the Chinese Ministry of Education, the Higher Education Sprout Project by Ministry of Education at NCKU, the National Research Foundation of Korea, Czech Science Foundation and Ministry of Education, Youth and Sports of the Czech Republic, Hungarian National Research, Development and Innovation Office, New National Excellency Programme of the Hungarian Ministry of Human Capacities, Department of Atomic Energy and Department of Science and Technology of the Government of India, the National Science Centre and WUT ID-UB of Poland, the Ministry of Science, Education and Sports of the Republic of Croatia, German Bundesministerium für Bildung, Wissenschaft, Forschung and Technologie (BMBF), Helmholtz Association, Ministry of Education, Culture, Sports, Science, and Technology (MEXT) and Japan Society for the Promotion of Science (JSPS).
(11)S. Material, “See Supplemental Material towards
the end, for definition of cumulants and K-statistics, Two-Component Model
calculation, significance calculation, magnified version of model
calculations, statistics dependence of at 7.7 GeV, measurements
with rapidity window ,” .
Fisher (1930)R. A. Fisher, Proceedings of the London Mathematical Society s2-30, 199 (1930).
I Supplemental Material
I.1 Two-Component Model calculations
In a two-component, or bimodal, distribution, the total probability distribution is a combination of two separate constituent distributions, and , so that
(1)
where the parameter ( ) specifies the relative contribution of the two.
The factorial cumulants () of such a distributions up to the sixth order can be expressed in terms of factorial cumulants of the two constituent distributions ( and ) as follows Bzdak et al. (2018).
(2)
(3)
(4)
(5)
(6)
(7)
where = () for = 1, 2, 3, 4, 5, 6.
For the Two-Component Model used in this letter to calculate expectations for the fifth- and sixth-order proton factorial cumulants, we follow the procedure suggested in Refs. Bzdak et al. (2018); Bzdak and Koch (2019). The two constituent distributions of this Two-Component Model are the binomial () and Poissonian () distributions; this choice is made keeping in mind the baryon number conservation Bzdak et al. (2018). The binomial distribution has two parameters: number of trials () and probability of success (), while the Poissonian has only one parameter, the mean (). Thus, a Two-Component Distribution with binomial and Poisson distributions as constituents has four parameters in total: , , and . Factorial cumulants of the binomial and Poisonian distributions can be deduced from their parameters. Following the recommendation in Ref. Bzdak et al. (2018), we fix the value and then using data and the equations for the first-, third-, and fourth-order factorial cumulants, we extract the remaining parameters. Note that at = 7.7 GeV, the equations for first-, second-, and fourth-order factorial cumulants were employed for extracting the parameters, as the former choice of equation resulted in unphysical values of the parameter (1). Nonetheless, both sets of parameters predict the sign change and comparable values of fifth- and sixth-order factorial cumulants. The extracted parameters at all energies are summarized in Table 2. With all four parameters of the Two-Component Distributions known, predictions are made for the fifth- and sixth-order factorial cumulants. To evaluate the statistical uncertainties on the predictions, the resampling method suggested in Ref. Bzdak and Koch (2019) is performed.
Table 2: The parameters of the Two-Component Model calculations at all collision energies.
(GeV)
3
7.7
11.5
14.5
19.6
27
39
54.4
62.4
200
0.04035
0.0601
0.0483
0.0411
0.0429
0.03088
0.0284
0.0647
0.0285
0.0313
0.306096
0.00745336
0.0642206
0.0221282
0.793785
0.562374
0.587115
0.999963
0.0226576
0.0135979
16.98
15.16
18.32
16.46
12.78
12.39
11.22
10.17
11.73
8.3
I.2 Cumulants and -statistics
Cumulants quantify the characteristics of a distribution. The cumulants of a distribution up to the sixth order are defined as
(8)
(9)
(10)
(11)
(12)
(13)
where is the first raw moment or the mean and () are the central moments defined as = with being the variate whose distribution is considered and = - . The cumulants are well known statistical quantities. For example, the first- and second-order cumulants are the mean and variance. The third- and fourth-order cumulants reflect the skewness and kurtosis of a distribution, respectively.
In most statistical analyses, the information about the population is not known a priori but rather inferred using the sample. One only has a given sample to work with, which forms a subset of the population. Measurements are performed on the available sample to infer the traits of the population. If the sample size is sufficiently large, cumulant measurements of the sample itself can serve as reasonable estimates of a population’s cumulants. -statistics are known to be unbiased estimators of a population’s cumulants Fisher (1930). If a sample size is sufficiently large, the -statistics and cumulants of the sample should be consistent with one another, so measuring both and comparing them is one method to assess the adequacy of a sample size. -statistics () up to sixth-order can be expressed in terms of central moments () of the sample as follows Fisher (1930).
(14)
(15)
(16)
(17)
(18)
(19)
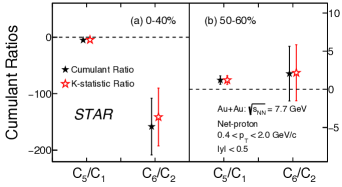
When the sample size () is large such that , the -statistics and cumulants converge to the same value as can be clearly seen in the example of . Among all the STAR Au+Au data samples, = 7.7 GeV has the fewest number of recorded events. We calculated the ratio of fifth-to-first and sixth-to-second order -statistics of net-proton distributions in Au+Au collisions at = 7.7 GeV for 0-40% and 50-60% collision centralities, and their comparison with cumulant ratios and is shown in Fig. 5. These -statistics ratios of fifth and sixth orders are consistent with the corresponding cumulant ratios, which demonstrates that the statistics in = 7.7 GeV are sufficient for the fifth- and sixth-order K-statistics and cumulants to agree.
Figure 5: Net-proton cumulant ratio and and their corresponding -statistics ratios in Au+Au collisions at = 7.7 GeV in 0-40% (a) and 50-60% (b) collision centralities. Only statistical uncertainties are shown.
I.3 Statistics dependence of /
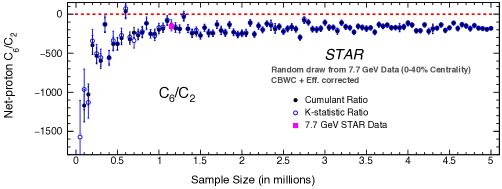
We performed random sampling from the STAR data to create sub-samples of various sizes in order to study sample size dependence of sixth-order cumulants and -statistics. Events were randomly drawn with replacement to create these sub-samples, with each event having the same probability of being chosen. As higher order cumulants are known to be statistics-hungry, we conducted this study for the sixth-order cumulant using STAR data at =7.7 GeV (because it is the smallest sample), and the net-proton was observed to have a large negative value for 0-40% centrality. Figure 6 shows net-proton as a function of sample size where each of the simulated samples (referred to below as ”subsamples”) are independently drawn from observed events at = 7.7 GeV (0-40% centrality). Also shown are the -statistics ratio measurements of the same order. All the necessary corrections done with STAR data are also carried out for each subsample. The 7.7 GeV data set from STAR has 1.2 million events in 0-40% centrality. In this study, subsample size is varied in the range of 0.05 - 5 million events, in steps of 0.05 million. In the entire range of subsample size studied, the net-proton is negative (with the exception of a very few cases where is it consistent with zero within uncertainty). The value is more negative in the smaller-statistics subsamples and as the subsample size increases, the value saturates near the observed value in the true data sample. No cases with positive were found. The -statistics ratio of the same order also shows a similar trend and remains consistent with the cumulant ratio within uncertainties.
One caveat in this study to be kept in mind is that while performing random draws from the real data, the subsample events will be constrained by the total available events in STAR data.
Figure 6: Net-proton cumulant ratio (filled black circles) and the corresponding -statistics ratio (open blue circles) as a function of subsample size. Samples of different sizes are created by random draws from STAR Au+Au collision data at = 7.7 GeV, 0-40% centrality. Measurements are centrality bin width corrected (CBWC) and also corrected for efficiency. The STAR data for 0-40% centrality (filled magenta square) is also shown. Only statistical uncertainties are shown.
I.4 Model calculations for Net-proton , and
Figure 7: Same as Fig. 3 with only model results. Lattice QCD (39 – 200 GeV) Bazavov et al. (2020), FRG (11.5 – 200 GeV) Fu et al. (2021), UrQMD (0-40%, 50-60%) Bleicher et al. (1999), and HRG model calculations (7.7 – 200 GeV) with canonical ensemble Braun-Munzinger et al. (2021) are shown as red, grey, brown bands, blue and green dashed lines, respectively.
Figure 7 reproduces an enlarged version of the model calculations already presented in Fig. 3. The lattice QCD (LQCD) and functional renormalization group (FRG) model predictions are negative for and while they are positive for . The UrQMD model calculations are either positive or consistent with zero within uncertainties for the two centralities presented. The HRG model calculations with canonical ensemble (HRG CE) yield positive values of the three net-proton cumulant ratios except at low collision energies, where 0 ( 11.5 GeV) and 0 ( 19.6 GeV).
I.5 and measurements in rapidity range -0.50
Figure 8: Same as Fig. 3 except that the net-proton (a), (b) and (c) measurements with rapidity window for (anti-)proton selection for 0-40% centrality are also shown for Au+Au collisions from = 7.7 – 54.4 GeV (blue diamond markers). The bars and bands on the datapoints represent statistical and systematic uncertainties, respectively.
The fifth- and sixth-order fluctuations reported in this work spans a broad range of energies for Au+Au collisions, from = 3 – 200 GeV. The key aspect of the measurement is to look for a sign change in fifth- and sixth-order cumulants. While the Au+Au collision dataset collected in the collider mode of detector operation allows for symmetric rapidity acceptance for (anti-)proton selection, the detector acceptance in the FXT mode forbids such a choice of rapidity window and thus the measurements instead were carried out with (anti-)proton rapidity range of . As a check for any systematic effect of this difference in rapidity acceptance, the net-proton , and with (anti-)proton selected within -0.50 were also measured in the collider energies from = 7.7 – 54.4 GeV for the 0-40% centrality. As shown in Fig. 8, the sign and the energy dependence of the net-proton and measured with , are largely consistent with those obtained with the rapidity range (default case). The sign of for the two rapidity windows are also consistent, i.e. positive at all collision energies presented. The three cumulant ratios at collider energies are seen to be closer to the Poisson limit at unity when the rapidity coverage of measurements is decreased from to .
I.6 Significance calculation
Negative sign of net-proton from = 7.7 – 200 GeV:
The net-proton for 0-40% centrality in Au+Au collisions from nine collision energies in the range = 7.7 – 200 GeV becomes increasingly negative with decreasing collision energy. The overall significance of observing negative net-proton (0-40% centrality) in more than half of the collision energies in the range = 7.7 –- 200 GeV is found to be 1.7. This significance is obtained by randomly varying the data points at each energy within their respective total Gaussian uncertainties (statistical and systematic uncertainties added in quadrature), a million times (we call them trials). Then, the number of trials out a million, where at least five or more collision energies have negative , was calculated. This probability is obtained to be 95.3522%, which corresponds to a 1.7 effect.
Ordering of cumulant ratios:
The measurements of proton cumulant ratios in Au+Au collisions at = 3 GeV show a reverse ordering compared to the lattice QCD calculation Bazavov et al. (2020), namely .
Using a statistical test, we found that the observed ordering at = 3 GeV does not follow the lattice QCD expectation with a 3.8 significance. This significance is obtained by randomly varying all the six cumulants at 3 GeV, simultaneously within the total Gaussian uncertainties (statistical and systematic uncertainties added in quadrature), a million times (we call them trials). Then, from each new set of cumulants, cumulant ratios were constructed and the lattice-QCD-predicted ordering was checked. The number of trials in which the lattice-QCD-predicted ordering was observed was found to be 65. Thus, the probability that the expected ordering was not followed is, , which corresponds to a 3.8 effect.
In the main text, we also report the probability of the measurements at higher collision energies, = 7 – 200 GeV, showing a reverse ordering as seen in = 3 GeV. The statistical test described above was performed for each higher energy, and we counted the number of trails out of one million in which the reverse ordering was observed. This probability at various energies is tabulated in Table 3.
Table 3: Probability (in %) of observing a reverse ordering as shown by = 3 GeV data, at various higher collision energies