Maximal X-ray feedback in the pre-reionization universe
1Department of Astronomy, University of Texas, Austin, TX 78712, USA
Abstract
X-ray feedback in the pre-reionization Universe provided one of the major energy sources for reionization and the thermal evolution of the early intergalactic medium. However, X-ray sources at high redshift have remained largely inaccessible to observations. One alternative approach to study the overall effects of X-ray feedback in the early Universe is a full cosmological simulation. Toward this goal, in this paper we create an analytic model of X-ray feedback from accretion onto supermassive black holes (SMBHs), to be used as a sub-grid model in future cosmological simulations. Our analytic model provides a relation between the mass of a dark matter halo and the SMBH it hosts, where the efficiency is governed by an energy balance argument between thermal feedback and the confining gravitational potential of the halo. To calibrate the model, we couple the halo-level recipe with the Press-Schechter halo mass function and derive global mass and energy densities. We then compare our model to various observational constraints, such as the resulting soft X-ray and IR cosmic radiation backgrounds, to test our choice of model parameters. We in particular derive model parameters that do not violate any constraints, while providing maximal X-ray feedback prior to reionization. In addition, we consider the contribution of SMBH X-ray sources to reionization and the global 21 cm absorption signal.
keywords:
early universe – dark ages, reionization, first stars – intergalactic medium – X-rays: galaxies1 Introduction
In the early Universe, sources of X-ray radiation had a significant effect on cosmic history (Mesinger et al., 2013). First, X-ray and UV radiation drove the early stages of reionization (Glover & Brand, 2003; Baek et al., 2010). Noticeable differences in the timing and topology of reionization occur depending on the leading radiation source. When UV sources dominate, reionization is thought to occur in bubbles of ionized gas within a neutral background (e.g., Loeb & Barkana, 2001; McQuinn et al., 2007). However, when X-ray sources dominate, the ionized regions are distributed more evenly due to the large mean free path of X-rays (Fragos et al., 2013; Pritchard & Furlanetto, 2007). Furthermore, the X-ray radiation would have delayed reionization by increasing the Jeans mass through preheating, so that the timescale for halo formation was longer (Jeon et al., 2014; Finkelstein et al., 2019). On the contrary, X-ray radiation could suppress small-scale structure formation, thus in turn reducing recombination losses of ionizing photons, to accelerate reionization (Finlator et al., 2012; Emberson et al., 2013). However, there is still considerable uncertainty on what sources dominate reionization. The general view is that UV sources dominate and drive reionization (e.g., Ciardi et al., 2003; Parsa et al., 2018; Finkelstein et al., 2019; Robertson et al., 2015; Naidu et al., 2020), while some studies stress the role of active galactic nuclei (AGN) in completing reionization (e.g., Madau & Haardt, 2015; Volonteri et al., 2016).
The overall impact of X-ray feedback on star formation in the early Universe is complex. On the one hand, sources heat nearby gas and thus hinder star formation (Jeon et al., 2014). However, at larger distances, X-ray feedback may be able to compensate for the negative feedback from the UV photo-dissociation of molecular hydrogen, the main coolant in primordial star forming haloes. The partial ionization from X-rays can result in an enhanced abundance of free electrons in predominantly neutral hydrogen gas, in turn catalyzing the formation of hydrogen molecules (Glover & Brand, 2003). The net effect can be additional cooling in protogalaxies, thus enhancing the early star formation rate.
Moreover, from the observed AGN X-ray and bolometric luminosities, the black hole (BH) accretion rate can be inferred if a constant radiative efficiency is assumed. Previous work found evidence for a correlation between the BH accretion rate and the star formation rate (SFR) for bulge-dominated galaxies (Yang et al., 2019), possibly because the supermassive black holes (SMBHs) coevolve with the stellar component of host galaxies (e.g. Kormendy & Ho, 2013; Davis et al., 2018). This correlation can be used to determine the BH accretion density, to constrain models of BH formation and evolution (Yang et al., 2021). However, the known accretion density inferred from X-ray observations is an order of magnitude lower than what is predicted in theoretical simulation results (e.g., Crain et al., 2015; Weinberger et al., 2017; Volonteri et al., 2016). The reason for the discrepancy may be the observational bias due to obscured AGNs at high redshift (Weigel et al., 2015; Vito et al., 2016; Yang et al., 2021). Therefore, the nature of X-ray feedback, its sources and overall strength, needs to be better understood to deduce the progress of reionization, the formation and evolution of protogalaxies, and the implications from observations with frontier facilities, such as the James Webb Space Telescope (JWST).
Although X-ray feedback has been considered in many simulations of the early Universe (e.g., Ahn et al., 2015; Fragos et al., 2013; Monsalve et al., 2019; Jeon et al., 2014), its overall amplitude is highly uncertain, mainly due to the current lack of direct observations (Reines & Comastri, 2016). Here, we therefore seek to determine the maximum X-ray feedback allowed by existing cosmological constraints, to be employed as a ‘maximal’ sub-grid model in future cosmological simulations. Direct constraints are the SMBH mass density at lower redshifts and the quasar luminosity function. For the SMBH mass density, we will consider local measurements (e.g. Fukugita & Peebles, 2004; Graham & Driver, 2007; Marconi et al., 2004), as well as semi-empirical determinations around (e.g. Mahmood et al., 2005; Tucci & Volonteri, 2017). While we model sources at , beyond current observational capabilities, we compare extrapolations of our model to existing observations of the quasar luminosity function at (e.g. Shen et al., 2020). Furthermore, X-ray sources have a significant impact on reionization, as stated previously, and they also indirectly affect the signal from 21 cm cosmology. Finally, X-ray feedback has to be consistent with cosmic radiation backgrounds, including the soft X-ray background111We do not consider the hard X-ray background, as the AGN that produce this component peaked at , outside the time period considered here (Di Matteo et al., 1999; Mushotzky et al., 2000).. We further consider the cosmic infrared background (CIB) as an indirect constraint, as the CIB is a global repository of reprocessed ionizing radiation at high redshifts, including the ionization resulting from X-ray photons.
Our resulting model of maximal X-ray feedback in the early Universe can be tested and improved with upcoming frontier facilities over a large range of wavelengths. Among them are the Euclid mission to study the CIB (Kashlinsky et al., 2018), the Square Kilometer array to map the cosmological 21 cm line (Ghara et al., 2017), the JWST to observe AGN emission from accretion at high redshifts (Volonteri et al., 2017), and the Athena and Lynx X-ray observatories (Barret et al., 2013; Gaskin et al., 2019) to directly observe high redshift AGN and quasar X-ray sources.
This paper is organized as follows. In Section 2, we discuss our modeling of X-ray feedback. We first model the number density and energy output for each X-ray source. In Section 3, we discuss the cosmological constraints considered here: reionization, the quasar luminosity function, the soft X-ray background, the CIB, and the 21 cm line. We conclude by summarizing our results in Section 4.
2 Modeling X-ray Feedback
We will model X-ray feedback in the pre-reionization Universe by considering AGN/SMBH and X-ray binaries (Mirabel et al., 2011; Baek et al., 2010; Jeon et al., 2014; Fragos et al., 2013). For SMBH sources, we consider ‘standard’ formation pathways from massive stellar seeds, and will only briefly comment on the alternative direct collapse black hole (DCBH) channel, as the conditions for DCBH seed formation may be rare and difficult to achieve (Bromm & Loeb, 2003; Habouzit et al., 2016).
2.1 Number and Mass Density of Sources
2.1.1 AGN/SMBH Sources
To derive the AGN/SMBH number density, we employ the Press-Schechter (PS) formalism (Press & Schechter, 1974). More specifically, the PS formalism provides the mass function of dark matter haloes, evaluated with the Colossus package for Python (Diemer, 2018). When integrating the PS function over mass to obtain total mass densities, we consider an upper halo limit of , following prior work (e.g. Shankar et al., 2006; Anglés-Alcázar et al., 2017). For simplicity, we assume that each halo contains a black hole with mass proportional to the halo mass, such that
| (1) |
To determine , we consider a global energy balance argument. The fraction of the BH rest mass energy that is converted into radiation and is subsequently absorbed to heat the gas should equal the potential energy of the gas confined in the gravitational potential well of the host halo:
| (2) |
Here, is the virial radius of the halo, and the fraction of the BH rest energy that will be deposited locally into the halo gas as heat energy. Assuming that , where is the cosmological baryon-to-mass ratio for density parameters in baryons and matter of and , respectively (Planck Collaboration et al., 2016), and applying the relation between virial mass and radius of the halo:
| (3) |
where is the background density of the Universe at redshift , we can express the BH efficiency as follows
| (4) |
To complete our prescription, we need to further model the energy conversion factor, which is expected to be of order for the lower range of AGN radiative efficiencies (Davis & Laor, 2011). In somewhat more detail, we assume that accretion onto the SMBH is proceeding at the Eddington rate, consistent with observations of high- quasars that they radiate at the Eddington luminosity (e.g. Mortlock et al., 2011; Wu et al., 2015; Bañados et al., 2018). Assuming that the accretion disk is truncated at the radius of the last stable orbit for a non-rotating central BH, the resulting luminosity is
| (5) |
Further assuming a feedback-limited duty cycle of over which the SMBH is active, the feedback energy deposited locally as heat can be rewritten as
| (6) |
where is the optical depth of the halo gas. Within the framework of Eddington-limited BH growth, we can equate the AGN duty cycle with the Salpeter time, (e.g. Woods et al., 2019). The optical depth to absorption can be estimated as , where is the mean free path for a photon emitted by the AGN traveling through the surrounding halo gas. The latter has an approximate number density of , where is the hydrogen mass. Using a radiative efficiency of 0.1, the feedback efficiency and optical depth become
| (7) |
| (8) |
For the cross section, , we consider both Thomson scattering in a fully ionized phase, with a cross section of cm2, and photo-ionization in (substantially) neutral hydrogen gas with (Barkana & Loeb, 2001):
| (9) |
where is the Planck constant and the frequency. We average over frequency, weighted by the non-thermal flux given in equ. 5 of Jeon et al. (2014), and normalizing to the Eddington luminosity. The non-thermal flux refers to the power-law spectral component above a critical frequency, . With frequency limits of keV/ and 10 keV/ (Jeon et al., 2014), the effective photo-ionization cross section is cm2. We consider two limiting cases for the optical depth, corresponding to photon transport in predominantly neutral and fully ionized gas, where the photo-ionization cross section will apply to the neutral part of the halo and the Thomson cross section to the ionized part.
To account for this two-phase configuration, we evaluate a weighted sum of the photon retention probability, using the two different optical depths:
| (10) |
Here, is the fraction of lines of sight, originating at the center, that intersect the neutral phase, assumed to occupy a torus-like geometry around the central black hole, and are the Thomson and photo-ionization optical depths, respectively. This geometry is thought to be established by the vertical outflow from the AGN, with a torus opening angle that varies according to type of the AGN, as well as its luminosity and emission line structure (Kawakatu & Ohsuga, 2011; Marin et al., 2012; Sazonov et al., 2015; Ichikawa et al., 2015). Such wide range of ionization-cone opening angles is supported by observations as well (He et al., 2018). We specifically assume an average half-opening angle for the torus of 30∘, following the low-luminosity AGN opening angles of Sazonov et al. (2015), given that low-luminosity sources dominate the overall AGN number density. In Equ. 10, we thus set .
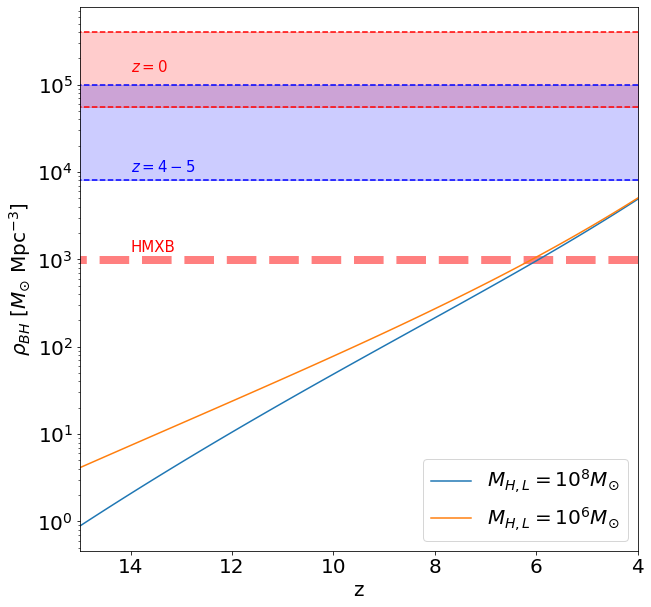
From Fig. 1, it is evident that the resulting SMBH mass density does not overproduce the approximate value estimated for (e.g. Mahmood et al., 2005; Tucci & Volonteri, 2017), and is clearly less than the local density at (e.g. Graham & Driver, 2007). This is also a consistency check on our simplifying assumption that every halo hosts a SMBH. Even though this may not be strictly correct for increasingly high redshifts, every halo eventually will host a SMBH at later times. Changing our assumption on the SMBH occupation fraction would thus only affect the high- parts of Fig. 1, while the lower redshift prediction is quite robust. Furthermore, the choice of lower limit for the halo mass does not make a significant difference at lower redshifts, where typical SMBH host masses are much larger, and where most of our constraints are tested.
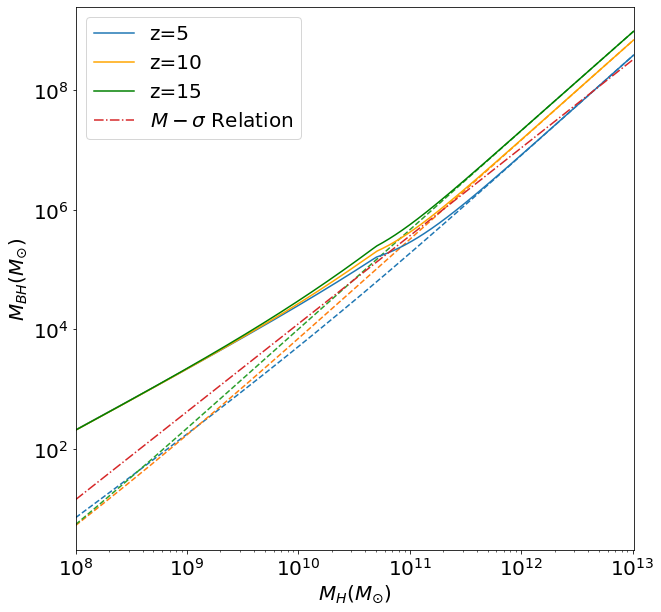
Fig. 2 shows the relation between host halo mass and SMBH mass within our model, based on Equ. 1, and for comparison also the empirical relation from Evrard et al. (2008) and Kormendy & Ho (2013). Our idealized model is comparable in slope and scale to the observed relation. To avoid SMBH mass values that are unrealistically low, we have also added seed black hole masses to our relation, such that . The seed masses are set as , and have lower and upper limits of and M⊙ to not have unrealistic seed black hole masses (e.g. Inayoshi et al., 2020). The effects of the seed black holes are further discussed in Section 2.1.3 below.
2.1.2 Stellar X-ray Binaries
Another important source of X-ray feedback in the early Universe is provided by stellar-remnant X-ray binaries (e.g. Mirabel et al., 2011), in particular high-mass X-ray binaries (HMXBs). A number of studies have focused on the binary statistics of Pop III stars (Stacy & Bromm, 2013; Liu et al., 2021), also extrapolating to the final remnant stage, with considerable uncertainties remaining. As an illustrative example, Jeon et al. (2014) selected around 30% of Pop III binaries in their simulation to form HMXBs, following Power et al. (2009). While Jeon et al. (2014) capture HMXBs from Pop III, their modeling of subsequent, metal-enriched populations is highly incomplete. Comprehensively determining the contribution from HMXBs to the aggregate mass and energy densities considered here, would require a separate, dedicated study, which is beyond the scope of this paper. With this caveat in mind, we reproduce their HMXB mass accretion density, as shown in Fig. 1, as a ballpark comparison for our black hole model. We do not however explicitly include the HMXB contribution in our modelling, but only consider SMBH emission.
2.1.3 Seed Black Holes
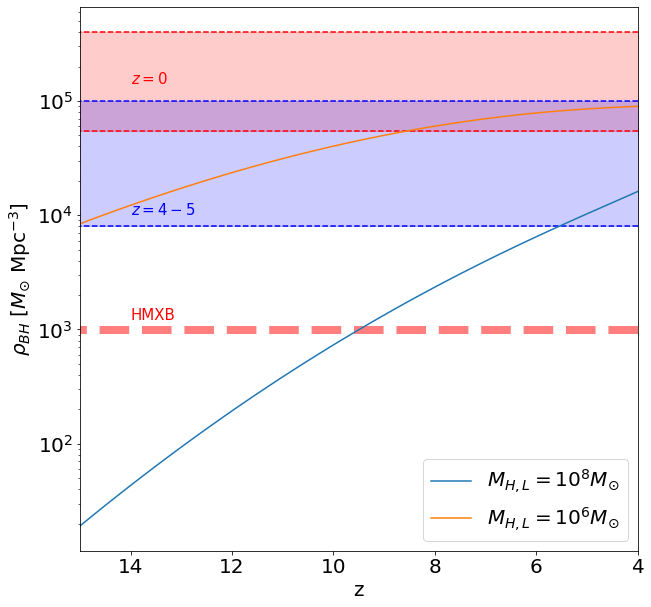
We now consider the impact of explicitly modelling seed black holes in the resulting global BH mass densities in somewhat greater detail. Specifically including the mass-dependent seed masses used in producing Fig. 2, we show the modified densities in Fig. 3, which is to be compared with Fig. 1, where seed BHs had been ignored. Now, to not violate the density constraints, the lower halo mass limit becomes important. Evidently, for a lower limit of 106 M⊙, the global mass density in SMBH is overproduced, even challenging the constraint. The lower limit of 108 M⊙, on the other hand, corresponding to an atomic cooling halo, produces a more realistic mass density. Therefore, the 106 M⊙ (minihalo) mass limit can be considered as the minimum halo mass required to trigger Pop III star formation (e.g. Bromm, 2013), whereas the minimum halo mass to host a central SMBH is 108 M⊙, which is of the same order as the suggested minimum mass to host a bona-fide first galaxy (e.g. Bromm & Yoshida, 2011).
Furthermore, we conclude that DCBH seeds of 105 M⊙ need to be rare, at least compared to our optimistic assumption that every halo hosts a central SMBH, to not overproduce the resulting mass density (also see Smith & Bromm, 2019, and references therein). If we included a M⊙ DCBH seed black hole in every atomic cooling halo, the total BH mass density would be overproduced. More specifically, the fraction of atomic cooling haloes hosting DCBH seeds may be as low as (assuming a comoving number density of atomic cooling haloes of 10 Mpc-3 at ), depending on the strength of the Lyman-Werner background at that time (Habouzit et al., 2016). Finally, not all minihaloes near M⊙ can host 100 M⊙ seeds, as the global mass density would be overproduced in that case, as shown in Fig. 3. However, the remaining constraints and tests are based on the radiation output (Soltan, 1982), and will thus only depend on the mass accreted onto the SMBH, shown in Fig. 1. Therefore, the halo lower mass limit will not greatly affect the other tests applied to our model, and choosing 108 M⊙ as the lower limit is reasonable, as this choice also satisfies the global BH mass density constraint.
2.2 Energy Density
To convert the BH mass densities in Fig. 1 to energy densities, we need to calculate the total energy output of an AGN source over its lifetime. The AGN spectral energy distribution is often modeled with two components: a non-thermal (NT) part and a thermal multi-colour disk (MCD) one (e.g. Jeon et al., 2012, 2014). The NT component dominates above , corresponding to the X-ray band. Conversely, the MCD component is responsible for producing the UV energy density. Assuming that the total AGN luminosity is given by the Eddington luminosity, equally shared by the NT and MCD components, the total X-ray and UV luminosities both equal 0.5. Further assuming that an AGN source is active for a Salpeter time, the total X-ray/UV energy produced per solar mass in BHs is
| (11) |
To calculate the energy from X-ray binaries, we follow Jeon et al. (2014), who also assume the Eddington value for the HMXB bolometric luminosity. Again, half of the luminosity will be in the X-ray band, so that the same equation as above can be used for HMXBs. Their contribution is not included in our figures however as we consider only SMBH radiation.
3 Cosmological Constraints
3.1 Reionization
To test if our model is consistent with the observational constraint that reionization is complete by (e.g. Kulkarni et al., 2019; Becker et al., 2015), we compare the UV intensity derived from our SMBH mass density with the minimum intensity required to reionize the Universe (Madau et al., 1999). Specifically, we derive the ionizing intensity from our model as follows:
| (12) |
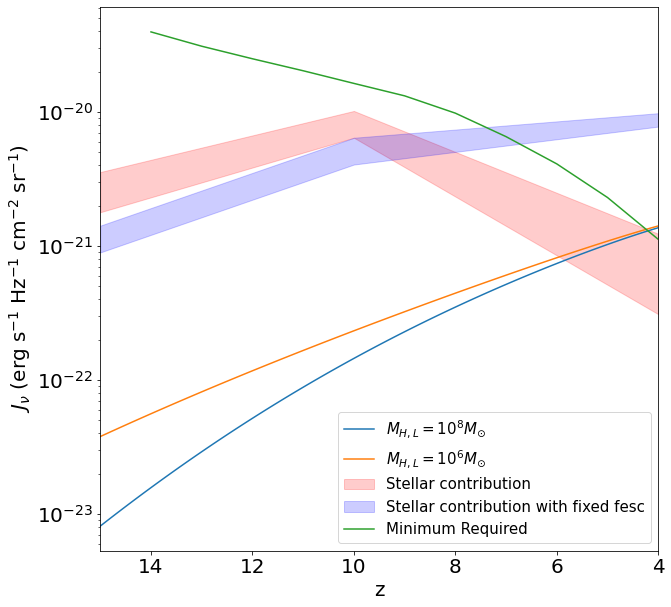
where is the physical energy density in the UV band produced by AGN sources. In Fig. 4, we further reproduce the observed intensity from star-forming galaxies from Finkelstein et al. (2019). Our model does not exceed the minimum required intensity before , and does therefore not predict an unrealistically early epoch of reionization, which would be in conflict with observations. Our model also predicts that X-ray and stellar sources made similar contributions to the ionizing photon budget by , not long after the end of reionization.
3.2 X-ray Luminosity Function
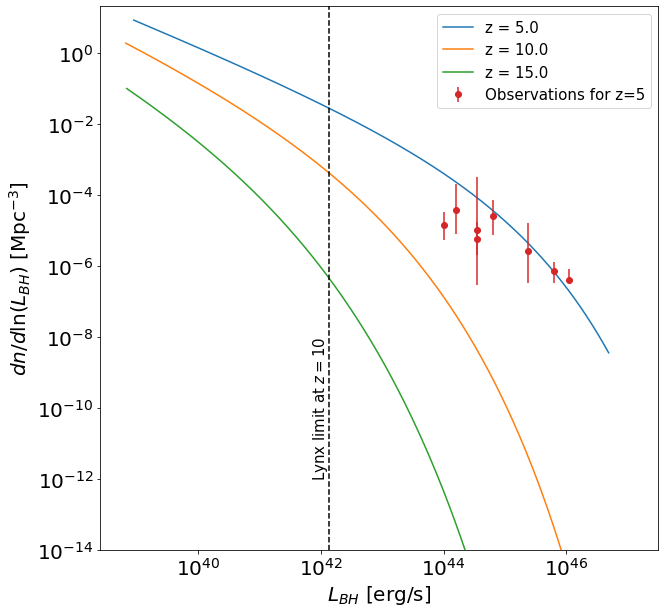
We convert our PS halo mass functions, , to luminosity functions at different redshifts, expressed in comoving units and assuming that sources emit at the Eddington luminosity:
| (13) |
Note that the factor in the second equality here arises from the halo mass dependence in Equ. 4. In Fig. 5, we compare our derived bolometric luminosity functions to observations at (Shen et al., 2020). The predicted function at is broadly consistent with the observations. It is currently not possible to directly probe the AGN luminosity function at the highest redshifts, leaving only the high-luminosity tail at the lowest redshifts modeled here accessible to observations.222However, a number of additional empirical constraints on the quasar luminosity function at exist (e.g. Jiang et al., 2016). Future facilities, such as Lynx, Athena, and AXIS, will push to significantly fainter limits, promising a much more detailed scrutiny of the high- AGN population. In particular, these frontier facilities will be able to observe X-ray luminosities as low as erg s-1 near (Marchesi et al., 2020; Habouzit et al., 2022).
3.3 Soft X-ray background
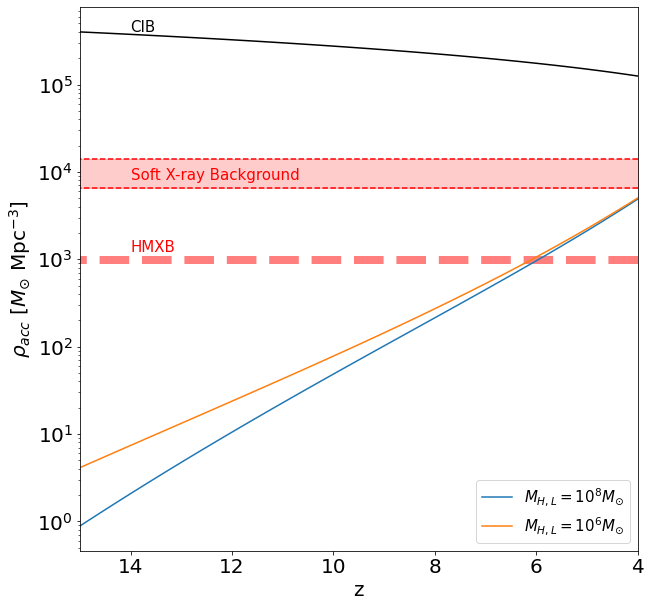
The soft X-ray background is the lower energy part of the X-ray background ( keV) with contributions mainly from AGNs, but also from galaxies and stellar sources (McQuinn, 2012; Cappelluti et al., 2012). While most of the background has been resolved into point and extended sources with Chandra and XMM–Newton (Moretti et al., 2003; Bauer et al., 2004; Lehmer et al., 2012), a sizeable 5–10% of the background remains unresolved. Low-luminosity AGNs most likely make up the bulk of this unresolved fraction, and for consistency, our model cannot overproduce the energy deposited into the X-ray background. For simplicity, we assume that the entire BH mass density, as shown in Fig. 1, has been assembled through radiatively efficient accretion, such that . We thus effectively neglect any contribution to the BH mass budget from seed BHs and mergers. At least the former approximation is well justified, as discussed above. With these idealized assumptions, we plot SMBH mass accretion densities in Fig. 6, and compare to the upper limit for the unresolved soft X-ray background, expressed in the same units (Salvaterra et al., 2012). As can be seen, our model does not exceed this limit even at , demonstrating overall consistency with the X-ray background observations.
3.4 Cosmic infrared background
X-ray feedback contributes indirectly to the cosmic infrared background, as well. More specifically, recombining gas that is ionized by X-rays produces Ly photons. The Ly radiation, emitted at is then redshifted into the infrared by , thus contributing to the CIB today (Rybicki & Lightman, 1986; Santos et al., 2002). The current limits on the unresolved CIB, therefore, impose another global constraint on pre-reionization X-ray feedback. To illustrate this additional constraint, Fig 6 also shows the accretion density required for SMBHs to produce the observed CIB fluctuations, given by equation 16 in Helgason et al. (2016). Our model accretion lies far below this value, thus obeying the CIB constraint, but also predicting that SMBHs alone cannot account for the observed level of CIB fluctuations.
3.5 21 cm radiation
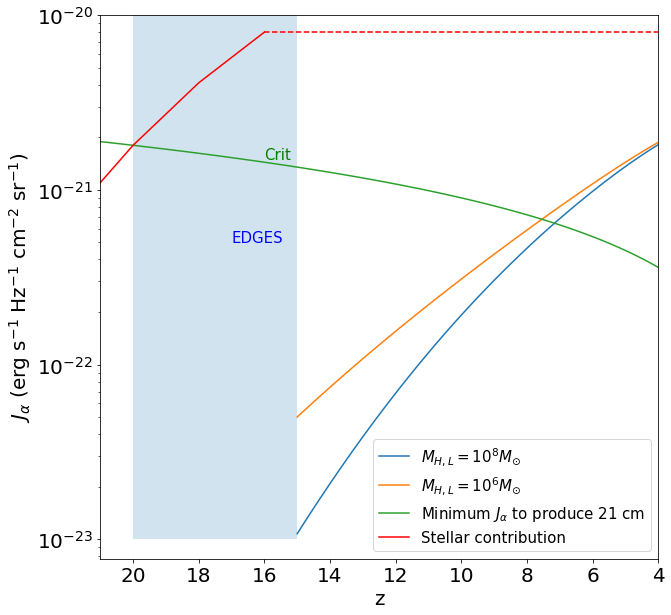
In general, X-ray sources indirectly contribute to the cosmological 21 cm signature (e.g. Furlanetto et al., 2006). The X-ray emission heats the surrounding neutral hydrogen gas and produces Ly photons. The total Ly radiation, including all available sources, is then able to produce observable 21 cm lines from the Wouthuysen–Field effect (Field, 1958; Wouthuysen, 1952). Here, neutral hydrogen absorbs Ly photons and produces a change in spin state during relaxation, thus rendering the 21 cm transition detectable in absorption relative to the CMB (Pritchard & Loeb, 2012). In Fig. 7, we compare the Ly intensity from our model to the critical intensity required to produce the 21 cm line via the Wouthuysen-Field coupling (Ciardi & Madau, 2003). For simplicity, we assume that each ionization event results in the emission of a Lyman- photon, such that (see Equ. 12). A detailed modeling of the complex radiative transfer and nebular reprocessing involved is beyond the scope of this paper333The standard nebula physics of case-B recombination predicts that only 0.68 of all recombinations would result in the emission of a Ly photon. Such order-unity corrections would not change any of our conclusions.. For comparison with the AGN contribution, we also reproduce the Ly intensity originating in massive Pop III stars (Schauer et al., 2019). Our model does not reach the minimum intensity until , while the stellar intensity does at .
The moment of ‘cosmic dawn’, when Wouthuysen-Field coupling first becomes effective, is currently under vigorous debate. The Experiment to Detect the Global Epoch of Reionization Signature (EDGES) had reported a strong, global absorption feature at 78 MHz, corresponding to a redshift of for the line centre (Bowman et al., 2018). We indicate the EDGES constraint in Fig. 7, as well, implying that our modeled AGN intensity does not produce the 21 cm line too early, and is thus consistent with observations. We note that the recent result from the Shaped Antenna Measurement of the Background Radio Spectrum (SARAS) has cast doubt on the original EDGES detection (Singh et al., 2022), but the radio-astronomical debate is far from over.
Besides the Wouthuysen-Field effect, X-ray feedback can affect the 21 cm signal through pre-heating of the diffuse gas. Specifically, HMXBs have been shown to pre-heat the IGM and increase the brightness temperature on large scales (e.g. Jeon et al., 2014). The overall effect is that the heated IGM, outside the regions that are ionized by stellar sources, can produce the 21 cm line at early times, whereas the fully-ionized IGM at later times cannot (Baek et al., 2010). However, this effect is difficult to assess with our current model considering the complex physics of the IGM and the clustering of AGN sources. A cosmological simulation will be able to study this heating effect comprehensively.
4 Summary and Conclusions
In this paper, we have constructed a model to explore the impact of X-ray feedback from high-redshift AGN on the Universe before reionization. X-ray feedback can have conflicting effects on reionization and early star formation, so we assess limits on the available X-ray feedback within our model. We follow a semi-analytical approach, starting with the Press-Schechter halo mass function (Press & Schechter, 1974), and imposing a balance between the dark matter halo gravitational potential energy and the feedback energy from a central SMBH, to derive a relationship between the halo and black hole mass. We further use the halo-SMBH mass relation to predict SMBH mass densities over cosmic time. We in particular choose our model parameters to produce the maximum amount of X-ray feedback possible. The SMBH occupation fraction is set to unity, so that every halo above a critical mass ( or M⊙) hosts at least one SMBH for maximal feedback.
We subject our model to a number of tests to see if it violates any observational constraints. Among the tests, we consider the global SMBH mass density, the completion of reionization, the quasar luminosity function, select cosmic radiation backgrounds, and the (redshifted) 21 cm line, imprinted by neutral hydrogen in the early IGM. Regarding the mass density, luminosity function, and the cosmic backgrounds considered, our model does not overproduce the current observational constraints. Regarding reionization and the 21 cm line, our model does not produce the corresponding couplings between radiation fields and hydrogen gas too early, and is thus also consistent with these observations. Our X-ray feedback model, thus tested and constrained, can serve as a sub-grid model in future cosmological simulations of high- galaxy formation.
In our derivation of the model, only a few free parameters remain including the SMBH occupation fraction and the 3D geometry of regions in the halo. However, modifying the free parameters may contradict the empirical constraints. Our model predictions are close to the observed upper limits on the luminosity function and the soft X-ray background, as shown in Figures 5 and 6, such that the feedback cannot be much higher. We further argue that our choice for these parameters have physical merit. The chosen ionized fraction of the halo is in line with previous work on AGN opening angles (Sazonov et al., 2015). The occupation fraction is most likely unity at lower redshifts, as every observed galaxy hosts a black hole at its center (Kormendy & Ho, 2013). Although deviations from our simple ‘one SMBH per halo’ assumption are likely at high redshifts, imposing this condition on all haloes and cosmic times is adequate for our current semi-analytic model.
We seemingly have little freedom in designing our subgrid model, because the model parameters are tightly constrained by seemingly robust physical arguments. Within the original energy feedback argument, the dimensionless parameter is effectively set by assuming Eddington-limited accretion, occurring over the Salpeter timescale. However, some previous studies have argued that in the early Universe, SMBHs went through super-Eddington accretion instead (e.g. Pezzulli et al., 2016; Regan et al., 2019). We have also assumed a simple, bipolar geometry for the ionized regions, whereas the true situation is likely much more complex, requiring sophisticated 3D radiative transfer simulations to fully capture reality (Alvarez & Abel, 2007; McQuinn et al., 2007). Nevertheless, our idealized model serves to explore the relevant parameter space, thus informing follow-up cosmological simulations.
Our modeling is subject to a number of caveats. Clearly, our treatment of SMBH accretion and the structure of the ionized halo regions is highly idealized. The constraints mostly derive from observations at lower redshifts, so that the high- modelling is only indirectly tested. For example, the most direct constraints considered here, the SMBH mass density and the quasar luminosity function, are currently observed only at low redshifts (Shen et al., 2020), and even the constraint at on the BH mass density involves model extrapolations (Mahmood et al., 2005; Tucci & Volonteri, 2017). Even the most robust tests therefore exhibit considerable uncertainties, which will be addressed with future observations at higher redshifts.
Overall, our model indicates that X-ray feedback was important in the evolution of the early Universe. While the model X-ray feedback does not significantly contribute to the CIB or the 21 cm line, Fig. 4 indicates that the contribution from AGN may have been comparable to stellar sources in completing the reionization of the Universe. Furthermore, Fig. 6 implies that high- AGNs could explain the unresolved soft X-ray background. Thus, excluding X-ray feedback when studying early cosmic evolution will not be realistic. In contrast, previous work such as Cappelluti et al. (2017) concluded that the emission from high- AGN sources would have to be heavily obscured in Compton-thick envelopes to not violate existing constraints. In this case, the large optical depth would significantly reduce the impact of any AGN feedback. In future work, employing cosmological simulations, we will more thoroughly explore such radiative transfer effects. To improve our modelling of X-ray feedback, direct observations of high-redshift AGN/SMBH sources will be needed. More specifically, distinguishing the feedback from AGN and stars at high redshifts may be possible with future X-ray observatories, such as Athena and Lynx (Barret et al., 2013; Ricarte & Natarajan, 2018; Gaskin et al., 2019), or with observations of the rest-frame UV at different wavebands with JWST (Volonteri et al., 2017).
Data availability
The data underlying this article will be shared on reasonable request to the corresponding author.
References
- Ahn et al. (2015) Ahn K., Xu H., Norman M. L., Alvarez M. A., Wise J. H., 2015, ApJ, 802, 8
- Alvarez & Abel (2007) Alvarez M. A., Abel T., 2007, MNRAS, 380, L30
- Anglés-Alcázar et al. (2017) Anglés-Alcázar D., Faucher-Giguère C.-A., Kereš D., Hopkins P. F., Quataert E., Murray N., 2017, MNRAS, 470, 4698
- Bañados et al. (2018) Bañados E., et al., 2018, Nature, 553, 473
- Baek et al. (2010) Baek S., Semelin B., Di Matteo P., Revaz Y., Combes F., 2010, A&A, 523, A4
- Barkana & Loeb (2001) Barkana R., Loeb A., 2001, Phys. Rep., 349, 125
- Barret et al. (2013) Barret D., et al., 2013, in Cambresy L., Martins F., Nuss E., Palacios A., eds, SF2A-2013: Proceedings of the Annual meeting of the French Society of Astronomy and Astrophysics. pp 447–453 (arXiv:1310.3814)
- Bauer et al. (2004) Bauer F. E., Alexander D. M., Brandt W. N., Schneider D. P., Treister E., Hornschemeier A. E., Garmire G. P., 2004, AJ, 128, 2048
- Becker et al. (2015) Becker G. D., Bolton J. S., Madau P., Pettini M., Ryan-Weber E. V., Venemans B. P., 2015, MNRAS, 447, 3402
- Bowman et al. (2018) Bowman J. D., Rogers A. E. E., Monsalve R. A., Mozdzen T. J., Mahesh N., 2018, Nature, 555, 67
- Bromm (2013) Bromm V., 2013, Reports on Progress in Physics, 76, 112901
- Bromm & Loeb (2003) Bromm V., Loeb A., 2003, ApJ, 596, 34
- Bromm & Yoshida (2011) Bromm V., Yoshida N., 2011, ARA&A, 49, 373
- Cappelluti et al. (2012) Cappelluti N., et al., 2012, MNRAS, 427, 651
- Cappelluti et al. (2017) Cappelluti N., et al., 2017, ApJ, 837, 19
- Ciardi & Madau (2003) Ciardi B., Madau P., 2003, ApJ, 596, 1
- Ciardi et al. (2003) Ciardi B., Ferrara A., White S. D. M., 2003, MNRAS, 344, L7
- Crain et al. (2015) Crain R. A., et al., 2015, Monthly Notices of the Royal Astronomical Society, 450, 1937
- Davis & Laor (2011) Davis S. W., Laor A., 2011, ApJ, 728, 98
- Davis et al. (2018) Davis B. L., Graham A. W., Cameron E., 2018, ApJ, 869, 113
- Di Matteo et al. (1999) Di Matteo T., Esin A., Fabian A. C., Narayan R., 1999, MNRAS, 305, L1
- Diemer (2018) Diemer B., 2018, ApJS, 239, 35
- Emberson et al. (2013) Emberson J. D., Thomas R. M., Alvarez M. A., 2013, ApJ, 763, 146
- Evrard et al. (2008) Evrard A. E., et al., 2008, ApJ, 672, 122
- Field (1958) Field G. B., 1958, Proceedings of the IRE, 46, 240
- Finkelstein et al. (2019) Finkelstein S. L., et al., 2019, ApJ, 879, 36
- Finlator et al. (2012) Finlator K., Oh S. P., Özel F., Davé R., 2012, MNRAS, 427, 2464
- Fragos et al. (2013) Fragos T., Lehmer B. D., Naoz S., Zezas A., Basu-Zych A., 2013, ApJ, 776, L31
- Fukugita & Peebles (2004) Fukugita M., Peebles P. J. E., 2004, ApJ, 616, 643
- Furlanetto et al. (2006) Furlanetto S. R., Oh S. P., Briggs F. H., 2006, Phys. Rep., 433, 181
- Gaskin et al. (2019) Gaskin J. A., et al., 2019, Journal of Astronomical Telescopes, Instruments, and Systems, 5, 021001
- Ghara et al. (2017) Ghara R., Choudhury T. R., Datta K. K., Choudhuri S., 2017, MNRAS, 464, 2234
- Glover & Brand (2003) Glover S. C. O., Brand P. W. J. L., 2003, MNRAS, 340, 210
- Graham & Driver (2007) Graham A. W., Driver S. P., 2007, MNRAS, 380, L15
- Habouzit et al. (2016) Habouzit M., Volonteri M., Latif M., Dubois Y., Peirani S., 2016, MNRAS, 463, 529
- Habouzit et al. (2022) Habouzit M., et al., 2022, MNRAS, 509, 3015
- He et al. (2018) He Z., et al., 2018, MNRAS, 478, 3614
- Helgason et al. (2016) Helgason K., Ricotti M., Kashlinsky A., Bromm V., 2016, MNRAS, 455, 282
- Ichikawa et al. (2015) Ichikawa K., et al., 2015, ApJ, 803, 57
- Inayoshi et al. (2020) Inayoshi K., Visbal E., Haiman Z., 2020, ARA&A, 58, 27
- Jeon et al. (2012) Jeon M., Pawlik A. H., Greif T. H., Glover S. C. O., Bromm V., Milosavljević M., Klessen R. S., 2012, ApJ, 754, 34
- Jeon et al. (2014) Jeon M., Pawlik A. H., Bromm V., Milosavljević M., 2014, Monthly Notices of the Royal Astronomical Society, 440, 3778
- Jiang et al. (2016) Jiang L., et al., 2016, ApJ, 833, 222
- Kashlinsky et al. (2018) Kashlinsky A., Arendt R. G., Atrio-Barandela F., Cappelluti N., Ferrara A., Hasinger G., 2018, Reviews of Modern Physics, 90, 025006
- Kawakatu & Ohsuga (2011) Kawakatu N., Ohsuga K., 2011, MNRAS, 417, 2562
- Kormendy & Ho (2013) Kormendy J., Ho L. C., 2013, ARA&A, 51, 511
- Kulkarni et al. (2019) Kulkarni G., Keating L. C., Haehnelt M. G., Bosman S. E. I., Puchwein E., Chardin J., Aubert D., 2019, MNRAS, 485, L24
- Lehmer et al. (2012) Lehmer B. D., et al., 2012, ApJ, 752, 46
- Liu et al. (2021) Liu B., Meynet G., Bromm V., 2021, MNRAS, 501, 643
- Loeb & Barkana (2001) Loeb A., Barkana R., 2001, ARA&A, 39, 19
- Madau & Haardt (2015) Madau P., Haardt F., 2015, ApJ, 813, L8
- Madau et al. (1999) Madau P., Haardt F., Rees M. J., 1999, ApJ, 514, 648
- Mahmood et al. (2005) Mahmood A., Devriendt J., Silk J., 2005, Monthly Notices of the Royal Astronomical Society, 359, 1363
- Marchesi et al. (2020) Marchesi S., et al., 2020, A&A, 642, A184
- Marconi et al. (2004) Marconi A., Risaliti G., Gilli R., Hunt L. K., Maiolino R., Salvati M., 2004, MNRAS, 351, 169
- Marin et al. (2012) Marin F., Goosmann R. W., Gaskell C. M., Porquet D., Dovčiak M., 2012, A&A, 548, A121
- McQuinn (2012) McQuinn M., 2012, MNRAS, 426, 1349
- McQuinn et al. (2007) McQuinn M., Lidz A., Zahn O., Dutta S., Hernquist L., Zaldarriaga M., 2007, MNRAS, 377, 1043
- Mesinger et al. (2013) Mesinger A., Ferrara A., Spiegel D. S., 2013, MNRAS, 431, 621
- Mirabel et al. (2011) Mirabel I. F., Dijkstra M., Laurent P., Loeb A., Pritchard J. R., 2011, A&A, 528, A149
- Mirocha & Furlanetto (2019) Mirocha J., Furlanetto S. R., 2019, MNRAS, 483, 1980
- Monsalve et al. (2019) Monsalve R. A., Fialkov A., Bowman J. D., Rogers A. E., Mozdzen T. J., Cohen A., Barkana R., Mahesh N., 2019, The Astrophysical Journal, 875, 67
- Moretti et al. (2003) Moretti A., Campana S., Lazzati D., Tagliaferri G., 2003, ApJ, 588, 696
- Mortlock et al. (2011) Mortlock D. J., et al., 2011, Nature, 474, 616
- Mushotzky et al. (2000) Mushotzky R. F., Cowie L. L., Barger A. J., Arnaud K. A., 2000, Nature, 404, 459
- Naidu et al. (2020) Naidu R. P., Tacchella S., Mason C. A., Bose S., Oesch P. A., Conroy C., 2020, ApJ, 892, 109
- Parsa et al. (2018) Parsa S., Dunlop J. S., McLure R. J., 2018, MNRAS, 474, 2904
- Pezzulli et al. (2016) Pezzulli E., Valiante R., Schneider R., 2016, MNRAS, 458, 3047
- Planck Collaboration et al. (2016) Planck Collaboration et al., 2016, A&A, 594, A13
- Power et al. (2009) Power C., Wynn G. A., Combet C., Wilkinson M. I., 2009, MNRAS, 395, 1146
- Press & Schechter (1974) Press W. H., Schechter P., 1974, ApJ, 187, 425
- Pritchard & Furlanetto (2007) Pritchard J. R., Furlanetto S. R., 2007, MNRAS, 376, 1680
- Pritchard & Loeb (2012) Pritchard J. R., Loeb A., 2012, Reports on Progress in Physics, 75, 086901
- Regan et al. (2019) Regan J. A., Downes T. P., Volonteri M., Beckmann R., Lupi A., Trebitsch M., Dubois Y., 2019, MNRAS, 486, 3892
- Reines & Comastri (2016) Reines A. E., Comastri A., 2016, Publ. Astron. Soc. Australia, 33, e054
- Ricarte & Natarajan (2018) Ricarte A., Natarajan P., 2018, MNRAS, 481, 3278
- Robertson et al. (2015) Robertson B. E., Ellis R. S., Furlanetto S. R., Dunlop J. S., 2015, ApJ, 802, L19
- Rybicki & Lightman (1986) Rybicki G. B., Lightman A. P., 1986, Radiative Processes in Astrophysics
- Salvaterra et al. (2012) Salvaterra R., Haardt F., Volonteri M., Moretti A., 2012, A&A, 545, L6
- Santos et al. (2002) Santos M. R., Bromm V., Kamionkowski M., 2002, MNRAS, 336, 1082
- Sazonov et al. (2015) Sazonov S., Churazov E., Krivonos R., 2015, MNRAS, 454, 1202
- Schauer et al. (2019) Schauer A. T. P., Liu B., Bromm V., 2019, ApJ, 877, L5
- Shankar et al. (2006) Shankar F., Lapi A., Salucci P., De Zotti G., Danese L., 2006, ApJ, 643, 14
- Shen et al. (2020) Shen X., Hopkins P. F., Faucher-Giguère C.-A., Alexander D. M., Richards G. T., Ross N. P., Hickox R. C., 2020, MNRAS, 495, 3252
- Singh et al. (2022) Singh S., et al., 2022, Nature Astronomy, 6, 607
- Smith & Bromm (2019) Smith A., Bromm V., 2019, Contemporary Phys., 60, 111
- Soltan (1982) Soltan A., 1982, MNRAS, 200, 115
- Stacy & Bromm (2013) Stacy A., Bromm V., 2013, MNRAS, 433, 1094
- Tucci & Volonteri (2017) Tucci M., Volonteri M., 2017, A&A, 600, A64
- Vito et al. (2016) Vito F., et al., 2016, MNRAS, 463, 348
- Volonteri et al. (2016) Volonteri M., Dubois Y., Pichon C., Devriendt J., 2016, MNRAS, 460, 2979
- Volonteri et al. (2017) Volonteri M., Reines A. E., Atek H., Stark D. P., Trebitsch M., 2017, ApJ, 849, 155
- Weigel et al. (2015) Weigel A. K., Schawinski K., Treister E., Urry C. M., Koss M., Trakhtenbrot B., 2015, MNRAS, 448, 3167
- Weinberger et al. (2017) Weinberger R., et al., 2017, MNRAS, 465, 3291
- Woods et al. (2019) Woods T. E., et al., 2019, Publ. Astron. Soc. Australia, 36, e027
- Wouthuysen (1952) Wouthuysen S., 1952, The Astronomical Journal, 57, 31
- Wu et al. (2015) Wu X.-B., et al., 2015, Nature, 518, 512
- Yang et al. (2019) Yang G., Brandt W. N., Alexander D. M., Chen C. T. J., Ni Q., Vito F., Zhu F. F., 2019, MNRAS, 485, 3721
- Yang et al. (2021) Yang G., Estrada-Carpenter V., Papovich C., Vito F., Walsh J. L., Yao Z., Yuan F., 2021, arXiv e-prints, p. arXiv:2109.00078