Do Not Sleep on Traditional Machine Learning ††thanks: https://idioms.thefreedictionary.com/sleep+on+(someone+or+something)
Abstract
Over the last few years, research in automatic sleep scoring has mainly focused on developing increasingly complex deep learning architectures. However, recently these approaches achieved only marginal improvements, often at the expense of requiring more data and more expensive training procedures. Despite all these efforts and their satisfactory performance, automatic sleep staging solutions are not widely adopted in a clinical context yet. We argue that most deep learning solutions for sleep scoring are limited in their real-world applicability as they are hard to train, deploy, and reproduce. Moreover, these solutions lack interpretability and transparency, which are often key to increase adoption rates. In this work, we revisit the problem of sleep stage classification using classical machine learning. Results show that competitive performance can be achieved with a conventional machine learning pipeline consisting of preprocessing, feature extraction, and a simple machine learning model. In particular, we analyze the performance of a linear model and a non-linear (gradient boosting) model. Our approach surpasses state-of-the-art (that uses the same data) on two public datasets: Sleep-EDF SC-20 (MF1 0.810) and Sleep-EDF ST (MF1 0.795), while achieving competitive results on Sleep-EDF SC-78 (MF1 0.775) and MASS SS3 (MF1 0.817). We show that, for the sleep stage scoring task, the expressiveness of an engineered feature vector is on par with the internally learned representations of deep learning models. This observation opens the door to clinical adoption, as a representative feature vector allows to leverage both the interpretability and successful track record of traditional machine learning models.
Keywords:
Sleep scoring Time series Machine learning Open source1 Introduction
Humans spend around one-third of their lives asleep. Sleep is the single most effective process to reset our brain and body health each day, making it fundamental to human health [5, 6]. At the same time, sleep disorders are a common and increasingly prevalent public health issue [32], e.g., in the U.S. millions of people’s lives are impaired by sleep disorders [49]. This makes objective, quantitative diagnosis of sleep quality and associated disorders a major topic in medicine and research [60].
As part of clinical sleep analysis, physicians collect and analyze polysomnography (PSG) data. PSG is the continuous monitoring of brain activity with electroencephalography (EEG), eye movements with electrooculography (EOG), muscle activity with electromyography (EMG), heart rhythm with electrocardiography (ECG), and respiration. Typically, such a recording is performed during inpatient overnight at the hospital while the patient sleeps. A PSG is the current gold standard for objective assessment of sleep continuity and quantify associated pathologies, including sleep-related breathing disorders, narcolepsy and sleep-related movement disorders [37].
Sleep scoring, also known as “sleep staging” or “sleep stage classification”, consists of the classification of 30-seconds periods of PSG (called “epochs”) in different sleep stages. Sleep stage classification is one of the fundamental technical investigations at the basis of clinical decision-making in sleep medicine diagnostics and treatment efficacy evaluation [47, 60]. This task is done visually by a sleep expert. Sleep experts mostly rely on guidelines (e.g., proposed by the American Academy of Sleep Medicine (AASM) [3]) for the determination of sleep stages. Each epoch is classified into one of the following five sleep stages: wakefulness w, stage n1, stage n2, stage n3, and rapid eye movement (rem). The manual annotation of the recorded data is a complex and time-intensive process which takes a well-trained physician up to two hours to score one whole hypnogram of about 8 hours of sleep [29]. Moreover, sleep stage classification is prone to subjective bias, resulting in lower than desired inter-scorer and intra-scorer agreement (i.e., 83% inter-scorer agreement [44], and 90% intra-scorer agreement [17]). In particular, n1 and n3 have inter-scorer agreements as low as 63 and 67% respectively, which raises questions on their usefulness [51]. This disagreement stems from (i) sleep stages being a discretization of a continuous process [4], (ii) visual scoring inherently being limited by how the human visual and cognitive systems interpret the data (the latter includes individual differences in scoring experience), and (iii) how the PSG data is presented to the annotator [48]. Although numerous solutions have been devised in an effort to automate sleep stage classification, to date, no system has completely replaced humans as the gold standard [16]. Among many reasons, the most prominent ones are (i) the limited adoption rate of machine learning (and in particular deep learning) in the healthcare domain (e.g., aversion to technology, usability or technical limitations) [15], and (ii) security and privacy issues as often powerful resources from the cloud are required to perform deep learning-based scoring [17].
Today, literature on automated sleep scoring research is mainly concerned with deep learning solutions. We observe a general trend of applying increasingly complex deep learning solutions, resulting in only marginal gains. Moreover, these small improvements often require more data and more expensive training procedures. Yet, clinical acceptance of deep learning solutions is often directly hindered by the obstacles that deep learning introduces, such as being hard to train, deploy, and reproduce, while lacking interpretability [17, 2, 15]. As a result, the latest research focuses on bringing data-efficiency or interpretability to deep learning models. However, as opposed to trying to solve the disadvantages associated with deep learning techniques post-hoc, we believe that one should instead use techniques that do not introduce these issues in the first place [45].
Therefore, in this paper, we challenge the concept that deep learning paradigms are necessary to develop performant data driven models for automatic sleep stage classification. To do so, we employ a conventional machine learning pipeline, consisting of three steps: preprocessing, feature extraction, and modeling. We compare the performances of both a linear and a non-linear model.
The contributions of this work are twofold;
-
1.
We propose a novel approach for automatic sleep scoring that performs on par with deep learning solutions and is easy to reproduce. We open source our results and pipelines at https://github.com/predict-idlab/sleep-linear.
-
2.
We discuss the impact of our results and show that traditional machine learning deserves more attention within the automatic sleep stage classification domain. In particular, this work opens the door to clinical acceptance of similar simple pipelines.
The remainder of this paper is as follows. In Section 2 we discuss existing research. Section 3 describes our proposed pipeline. In Section 4, we present the results of our solution of four datasets. Section 5 discusses why we achieve satisfying performance with simple models and what this could imply for future research. Finally, we end with a conclusion in Section 6.
2 Related work
In this section, we will describe related research on automatic sleep scoring. First, we will zoom in on previous work that uses classical machine learning, followed by the more recent advancements that employ deep learning.
2.1 Sleep scoring using classical machine learning
Earlier work in this domain applied conventional machine learning pipelines consisting of preprocessing, feature extraction, and modeling. We observe several similarities among these works. Most approaches used single channel EEG as input [26, 23, 20, 1, 22, 27], and extracted multi-domain (e.g., temporal and spectral) features [26, 23, 24, 20, 22, 28]. In general, non-linear classification models were applied, such as random forests [26, 28] and support vector machines [23, 24, 22, 1].
We believe that in many cases the contributions of the aforementioned research is limited as (i) small datasets were used (less than 30 subjects), (ii) limited features were extracted (less than 40), and (iii) no effort has been made to allow reproduction of the results as either the work was performed on proprietary data, or the code was not made publicly available.
However, there are some exceptions. Li et al. [26] evaluated their proposed approach on an open dataset of 198 subjects, showing that a conventional machine learning pipeline scales to larger datasets. Khalighi et al. [22] indicated (after extensive feature extraction) that multimodal EEG, EOG, and EMG channels as input results in the best performance. The work of Malafeev et al. [28] compared traditional machine learning (random forest on 20 features) to deep neural networks. They concluded that deep neural networks are superior in their generalization ability, however the performance difference was not really pronounced.
Given the limitations of the above contributions, comparing these research efforts on classical machine learning to state-of-the-art deep learning solutions is hard to realize. Only the recent work of Vallat et al. [56] on classical machine learning for sleep scoring is comparable to recent deep learning research. In their paper, the authors aimed at making a broadly applicable sleep scoring algorithm available111RobustSleepNet [19] and U-Sleep [38] are deep learning solutions with the same (highly relevant) goal. These works focussed on developing a solution that is robust to (i) arbitrary PSG montages (and protocols), and (ii) various clinical populations.. The proposed approach employs a tree-based gradient boosting model together with post-processing smoothing. Results indicated that their classical machine learning solution performs 2-4% lower than state-of-the-art deep learning approaches222We cannot facilitate direct comparison with the work of Vallat et al. [56] as their solution is evaluated on other datasets. However, we do compare directly with the deep learning approaches that are referenced in their comparisons.. This work builds further on the above observations, i.e., investigating the performance of conventional pipelines.
2.2 The use of deep learning and clinical acceptance
In recent years, research focus for the sleep scoring task has mainly been concentrated towards deep learning algorithms. Among the utilized deep learning architectures are auto-encoders [54], fully connected neural networks [12], convolutional neural networks (CNNs) [55, 59, 7, 33, 50, 14], recurrent neural networks (RNNs) [30, 61], transformers [42], and combinations thereof [52, 39, 46, 31, 19, 40, 41]. A general trend in the automatic sleep scoring domain is to apply increasingly complex deep learning architectures over time. Along with this trend, we observed that the latest advancements require non-trivial learning procedures to apply their solutions to new (smaller) datasets, for instance, fine-tuning [40, 19, 42, 42] or complex training procedures [41, 53].
In contrast to this general trend, architectures like TinySleepNet [53], SimpleSleepNet [18], and DeepSleepNet-lite [16] focussed on more lightweight deep learning solutions. The satisfactory performance of these approaches indicate that most of the existing deep learning architectures are overly complex, resulting in models that are data-hungry and computationally demanding.
A major drawback to these research efforts on deep learning is that clinical acceptance is directly hindered by the obstacles that deep learning introduces [17]. We argue that employing deep learning models in a medical context is challenging as they are hard to train, deploy, and reproduce, while lacking interpretability [2, 15]. Training a deep learning model is a complex task as, on the one hand, such models require a lot of data, and, on the other hand, training itself typically involves specialized hardware (GPUs), data augmentation, initialization & regularization procedures, special scheduling to update the learning rate, and more. Moreover, the lack of interpretability in deep learning models, categorized as black-box systems, is a common skepticism in healthcare and medicine [2]. As a result, many efforts in literature focussed on solving these challenges with deep learning models by researching data-efficiency [40, 41, 53], interpretability [42, 35], or model uncertainty [16].
3 Approach
Our approach follows, just as the previous work mentioned in Section 2, the traditional flow of conventional machine learning pipelines, i.e., preprocessing, feature extraction, and modeling. Our pipeline takes two EEG, one EOG, and one EMG signal as input333We did not include ECG as this was not available in the public sleep scoring datasets..
3.1 Preprocessing
Preprocessing is concerned with cleaning or transforming the raw data, to retain the relevant signal whilst removing artifacts or noise. To that end, the EEG and EOG signals are filtered to only keep frequencies between 0.40 Hz and 30 Hz. This band-pass range is clinically supported to capture the meaningful frequencies of sleep-wave patterns [29]. The EMG signal is band-pass-filtered between 0.50 Hz and 10 Hz, in line with [18, 56]. Note that these band-pass filters remove the powerline noise, which manifests itself at either 50 Hz or 60 Hz (depending on the local electrical grid specification). No artifact removal was applied to the PSG data. For inter-dataset operability, the EEG signals were resampled to 100 Hz. On average, preprocessing takes less than 2 s for 12 h of PSG data.
3.2 Feature extraction
Feature extraction aims to extract a set of characteristics, i.e., features, with the intention of constructing an expressive (lower-dimensional) representation of the data. We calculate a set of 131 features per window, these features are multi-domain (extracted from time and frequency domain) and multi-resolution (calculated on multiple window sizes). We utilize tsflex to realize this strided-window feature extraction [58]. Table 1 lists the feature functions that are applied to the data. These feature functions originate from the YASA [56] (Yet Another Spindle Algorithm) and tsfresh [9] toolkit, both these packages are integrated in tsflex. In total, these feature functions output 131 values444Remember when calculating the number of features that our pipeline uses two EEG signals..
| Function | EEG | EOG | EMG | # features |
| Time-domain | ||||
| std, iqr, skewness, kurtosis | ✓ | ✓ | ✓ | 16 |
| number of zero-crossings | ✓ | ✓ | ✓ | 4 |
| Hjorth mobility, Hjorth complexity | ✓ | ✓ | ✓ | 8 |
| higuch fractal dimension, petrosian fractal dimension | ✓ | ✓ | ✓ | 8 |
| permutation entropy, binned entropy (4) | ✓ | ✓ | ✓ | 20 |
| Frequency-domain | ||||
| spectral Fourier statistics (4) | ✓ | ✓ | ✓ | 16 |
| binned Fourier entropy (7) | ✓ | ✓ | ✓ | 28 |
| Absolute spectral power in the 0.4-30 Hz band | ✓ | ✓ | 3 | |
| Relative spectral power in the applied frequency bands (6) | ✓ | ✓ | 18 | |
| fast delta + theta spectral power | ✓ | 2 | ||
| alpha / theta spectral power | ✓ | 2 | ||
| delta / beta spectral power | ✓ | 2 | ||
| delta / sigma spectral power | ✓ | 2 | ||
| delta / theta spectral power | ✓ | 2 |
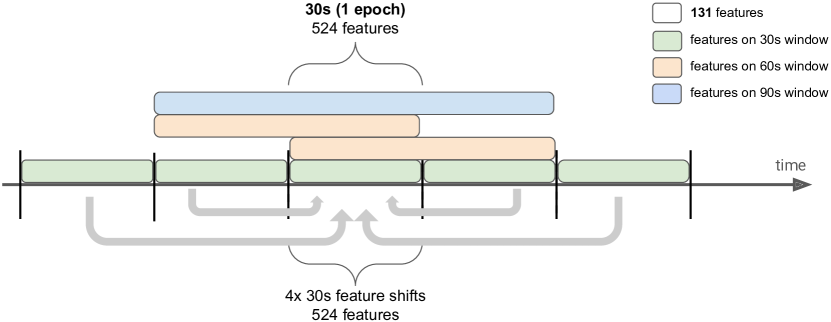
Figure 1 shows the various windows and shifts that are involved in creating the feature vector for an epoch555Note that including data from future epochs does not result in data leakage, as sleep stage classification is performed after the full recording was collected. Thus, at scoring time, the physician also has access to the full data (including future epochs).. The figure depicts how temporal context is included in the feature vector in two different ways. On the one hand, the features are calculated over three different windows; i.e., 30 s, 60 s, and 90 s (each with a stride of 30 s). Such different window sizes result in other feature distributions, capturing a larger temporal range of the time series data. On the other hand, by incorporating the features that were extracted over 30-s windows from past and future windows, the feature vector contains fine-grained temporal context from up to two epochs before and after the current epoch. These shifted features allow differentiating the surrounding epochs from the current epoch, as the shifted features are directly comparable with the 30 s feature from the current epoch. Calculating the features over the various windows, with four different resolutions, results in a feature vector of length 524 (see part above the time axis in Figure 1). Additionally, shifting the features calculated on the 30-s windows two epochs forward and backwards, adds another 524 features to the vector (see part under the time axis in Figure 1). Hence, the resulting feature vector has a dimensionality of 1048 (summarizing 75,000 data points). On average, feature extraction takes less than 20 s for 12 h of PSG data.
3.3 Modeling
We consider two different machine learning models, allowing us to assess the impact of model complexity on performance. In particular, we apply a linear model (logistic regression) and a non-linear model (gradient boosted trees).
The linear modeling is realized with the scikit-learn toolkit [36] and consists of two steps; (1) feature transformation, and (2) a linear machine learning model.
In the first step, non-linear scaling is applied to transform the raw feature vector into a representation that is more suitable for the linear model. To that end, a quantile transformation (with 100 quantiles per feature) performs a monotonic operation to map the features to a uniform distribution, reducing the impact of outliers. This scaling method was selected as a considerable amount of the features distributions were heavily skewed. As the second and final step, a logistic regression model is fitted on the transformed features.
In contrast, the non-linear modeling has no additional feature transformation steps since tree-based models are less susceptible to skewed feature distributions. Thus, the non-linear modeling consists of only one component, i.e., a gradient boosted tree classifier. In this study, we used the CatBoost library [13] as this typically yields good classification results without intensive hyper-parameter tuning. Moreover, it has been shown that gradient boosted trees achieve state-of-the-art performance on many datasets [8].
Remark that we decided to not include feature selection in our proposed pipeline as (1) empirical results only showed marginal gains, (2) both models are rather robust to overfitting, and (3) including feature selection would not change the message of this paper666The first two arguments are supported by the experiments provided in the code repository in the feature_selection.ipynb notebook.. Moreover, no hyperparameter tuning was performed, given the little to no overfitting we observed in the learning curves777The learning curves can be found back in the experiment notebooks in the code repository.
4 Experiments
In this section, we first describe the datasets that will be used in the study. Afterwards, the evaluation setup is detailed. Finally, we discuss the results and investigate the feature vector.
4.1 Datasets
Table 2 shows an overview of the utilized datasets. For each dataset, we provide the distribution of sleep stages, accompanied by some metadata. The size of the employed datasets range from 40 to 153 night recordings. For more details on the collected data (e.g., subject statistics, inclusion and exclusion criteria), we further refer to the dataset description papers [21, 34]
| Dataset | Metadata | Sleep stages (# epochs) | ||||||||
|---|---|---|---|---|---|---|---|---|---|---|
| # p | # r | protocol | age std | W | N1 | N2 | N3 | REM | Total | |
| SC-EDF-20 | 20 | 40 | R & K | 28.7 2.9 | 8207 | 2804 | 17799 | 5703 | 7717 | 42230 |
| SC-EDF-78 | 78 | 153 | R & K | 58.8 22.0 | 65642 | 21520 | 69132 | 13039 | 25835 | 195168 |
| ST-EDF | 22 | 44 | R & K | 40.2 17.7 | 4488 | 3653 | 19851 | 6415 | 8349 | 42756 |
| MASS SS3 | 62 | 62 | AASM | 42.5 18.9 | 6442 | 4839 | 29802 | 7653 | 10581 | 59317 |
4.1.1 Sleep-EDF Database Expanded
The 2018 Sleep-EDF dataset [21] consists of two subsets; Sleep Cassette (SC) and Sleep Telemetry (ST).
The Sleep Cassette subset contains 153 PSG recordings belonging to 78 subjects. For all patients, except three, recordings of the first and the second night are available. Each recording contains the following signals of interest; 2 EEG (Fpz-CZ and Pz-Cz), 1 EOG (horizontal), and 1 EMG (submental chin) signal. The PSGs also contain oro-nasal respiration and rectal body temperature. The EMG and EOG channels were sampled at 100 Hz. The EMG signal was electronically high-pass filtered, rectified and low-pass filtered, after which the RMS value (root-mean-square) was sampled at 1Hz888Note that this preprocessing is conflicting with the band-pass filter that our pipeline applies to the EMG signal. But, since the authors published only the preprocessed dataset, we have no choice but to accept this preprocessing..
We consider two splits, SC-EDF-20 with subjects 0 to 19 from the SC study and SC-EDF-78 with all the subjects from the SC subset999SC-EDF-20 and SC-EDF-78 refer respectively to the 2013 and 2018 version of the SC Sleep-EDF cohort. SC-EDF-20 and SC-EDF-78 are also often referred to as respectively Sleep-EDF-v1 and Sleep-EDF-v2.. As the PSG recordings contain a lot of (wake) data before and after the sleep period, we only consider the PSG data between 30 minutes before and after the sleep period. This is the same protocol as other work [52, 38, 41, 42, 53, 19, 31, 46] allowing a fair comparison, and has no impact on the feature distribution as there is no time information in the features.
The Sleep Telemetry subset contains 44 PSG recordings belonging to 22 patients. The goal of the ST study was to research the effect of temazepam, a drug used to treat insomnia, on sleep. For each patient, two nights were recorded, one of which was after temazepam intake, and the other of which was after placebo intake. The PSGs contain two EEG (Fpz-Cz and Pz-Oz), one EOG (horizontal), and one EMG (submental chin) signals, all sampled at 100 Hz.
Both subsets are scored according to the Rechtschaffen and Kales (R&K) rules [43]. We convert the sleep stage labels to the AASM standard by merging N3 and N4 into a single N3 stage. To facilitate comparison with other work [19, 41, 53, 18, 31, 40, 46, 52, 42, 16], epochs labeled as MOVEMENT or UNKNOWN are excluded.
4.1.2 MASS
The Montreal Archive of Sleep Studies (MASS) dataset [34] consists of five subsets (SS1 - SS5). In this study, we consider the MASS SS3 cohort, which is composed of 62 nights from healthy subjects. Each recording contains 20 scalp-EEG, 2 EOG, 3 EMG, and 1 ECG channels. All EOG and EEG signals have a sampling rate of 256 Hz, whereas the EMG channels were sampled at either 128 Hz (in 43 recordings) or 256 Hz (in 19 recordings). Manual annotation was performed by sleep experts according to the AASM standard [3].
We consider two EEG (F4-EOG (Left) and F8-Cz), one EOG (average of left and right EOG), and one EMG (average of EMG1 and EMG2) signal. This selection was preferred as (i) it results in the same number of utilized EEG, EOG, and EMG channels as for the Sleep-EDF dataset, and (ii) is similar to the selection of other work [18, 53, 52, 46]. All signals are downsampled to 100 Hz, improving the computational efficiency of the feature extraction.
4.2 Evaluation setup
In literature, various works have considered different training procedures. Among these procedures are Learning From Scratch (LFS), and Fine-Tuning (FT), and Direct Transfer (DT) [19]:
-
1.
LFS: The model is trained from scratch on the current dataset and evaluated with a cross-validation procedure on the evaluation dataset.
-
2.
FT: The model is (pre-)trained on another dataset and fine-tuned with a cross-validation procedure on the current dataset.
-
3.
DT: The model is trained on another dataset and is evaluated (without fine-tuning) on the current dataset.
It is essential to use the patient identifier as group in the cross validation procedures (when employing LFS and FT). This ensures that data from each patient was never in both the training and test fold (in the same iteration), preventing data leakage. In this work, our proposed pipelines were evaluated according to the LFS procedure with -fold cross-validation (CV). For SC-EDF-20 and ST-EDF, we evaluated using a of respectively 20 and 22 (in each fold one patient was left out as test set). For SC-EDF-78 and MASS SS3 we considered 10 folds. These configurations allow comparison with many other works [19, 41, 53, 18, 31, 46, 52, 42]. For SC-EDF-20 we also evaluated our pipeline via direct transfer. To that end, we trained our pipeline on the data from the 58 patients of Sleep-EDF-78 that are not part of SC-EDF-20.
4.3 Results
Table 3 presents a comparison of our pipeline to other (deep learning) work101010Note however that we cannot facilitate a statistical comparison as most other works do not provide individual results per subject. The results in the table indicate that we achieve state-of-the-art performance on the two smaller datasets (SC-EDF-20 and ST-EDF-20). Note that for both datasets only RobustSleepNet is able to achieve higher performance, but as that approach uses fine-tuning and thus leverages more data, the results are not really comparable and favoring RobustSleepNet. On the two larger datasets, our simple pipelines are competitive in performance when comparing them to the state-of-the-art deep learning models. Observe that, for our proposed approach, including EMG in addition to EEG+EOG results in a 0.001-0.008 improvement for all three metrics111111Additional experiments investigating the impact of various input (subset) combinations on performance, can be found back in the code repository..
We observe that the non-linear model consistently results in higher performance compared to the linear model. This is an indication that the linear model, due to its high bias, underfits the data (to some minor degree). Furthermore, considerable differences between the ranking of metrics are noticeable; e.g., a higher macro F1 score does not necessarily translate to the best accuracy score and vice versa. Hence, this empirically shows that comparing models with a single metric is not desirable. Remark that none of the metrics include certainty (i.e., the probabilities of the model). We believe that a log loss score might be a fitting way to assess this121212Log loss is not included in the comparison table, as this metric was mostly not reported in other comparable work..
4.4 Feature vector analysis
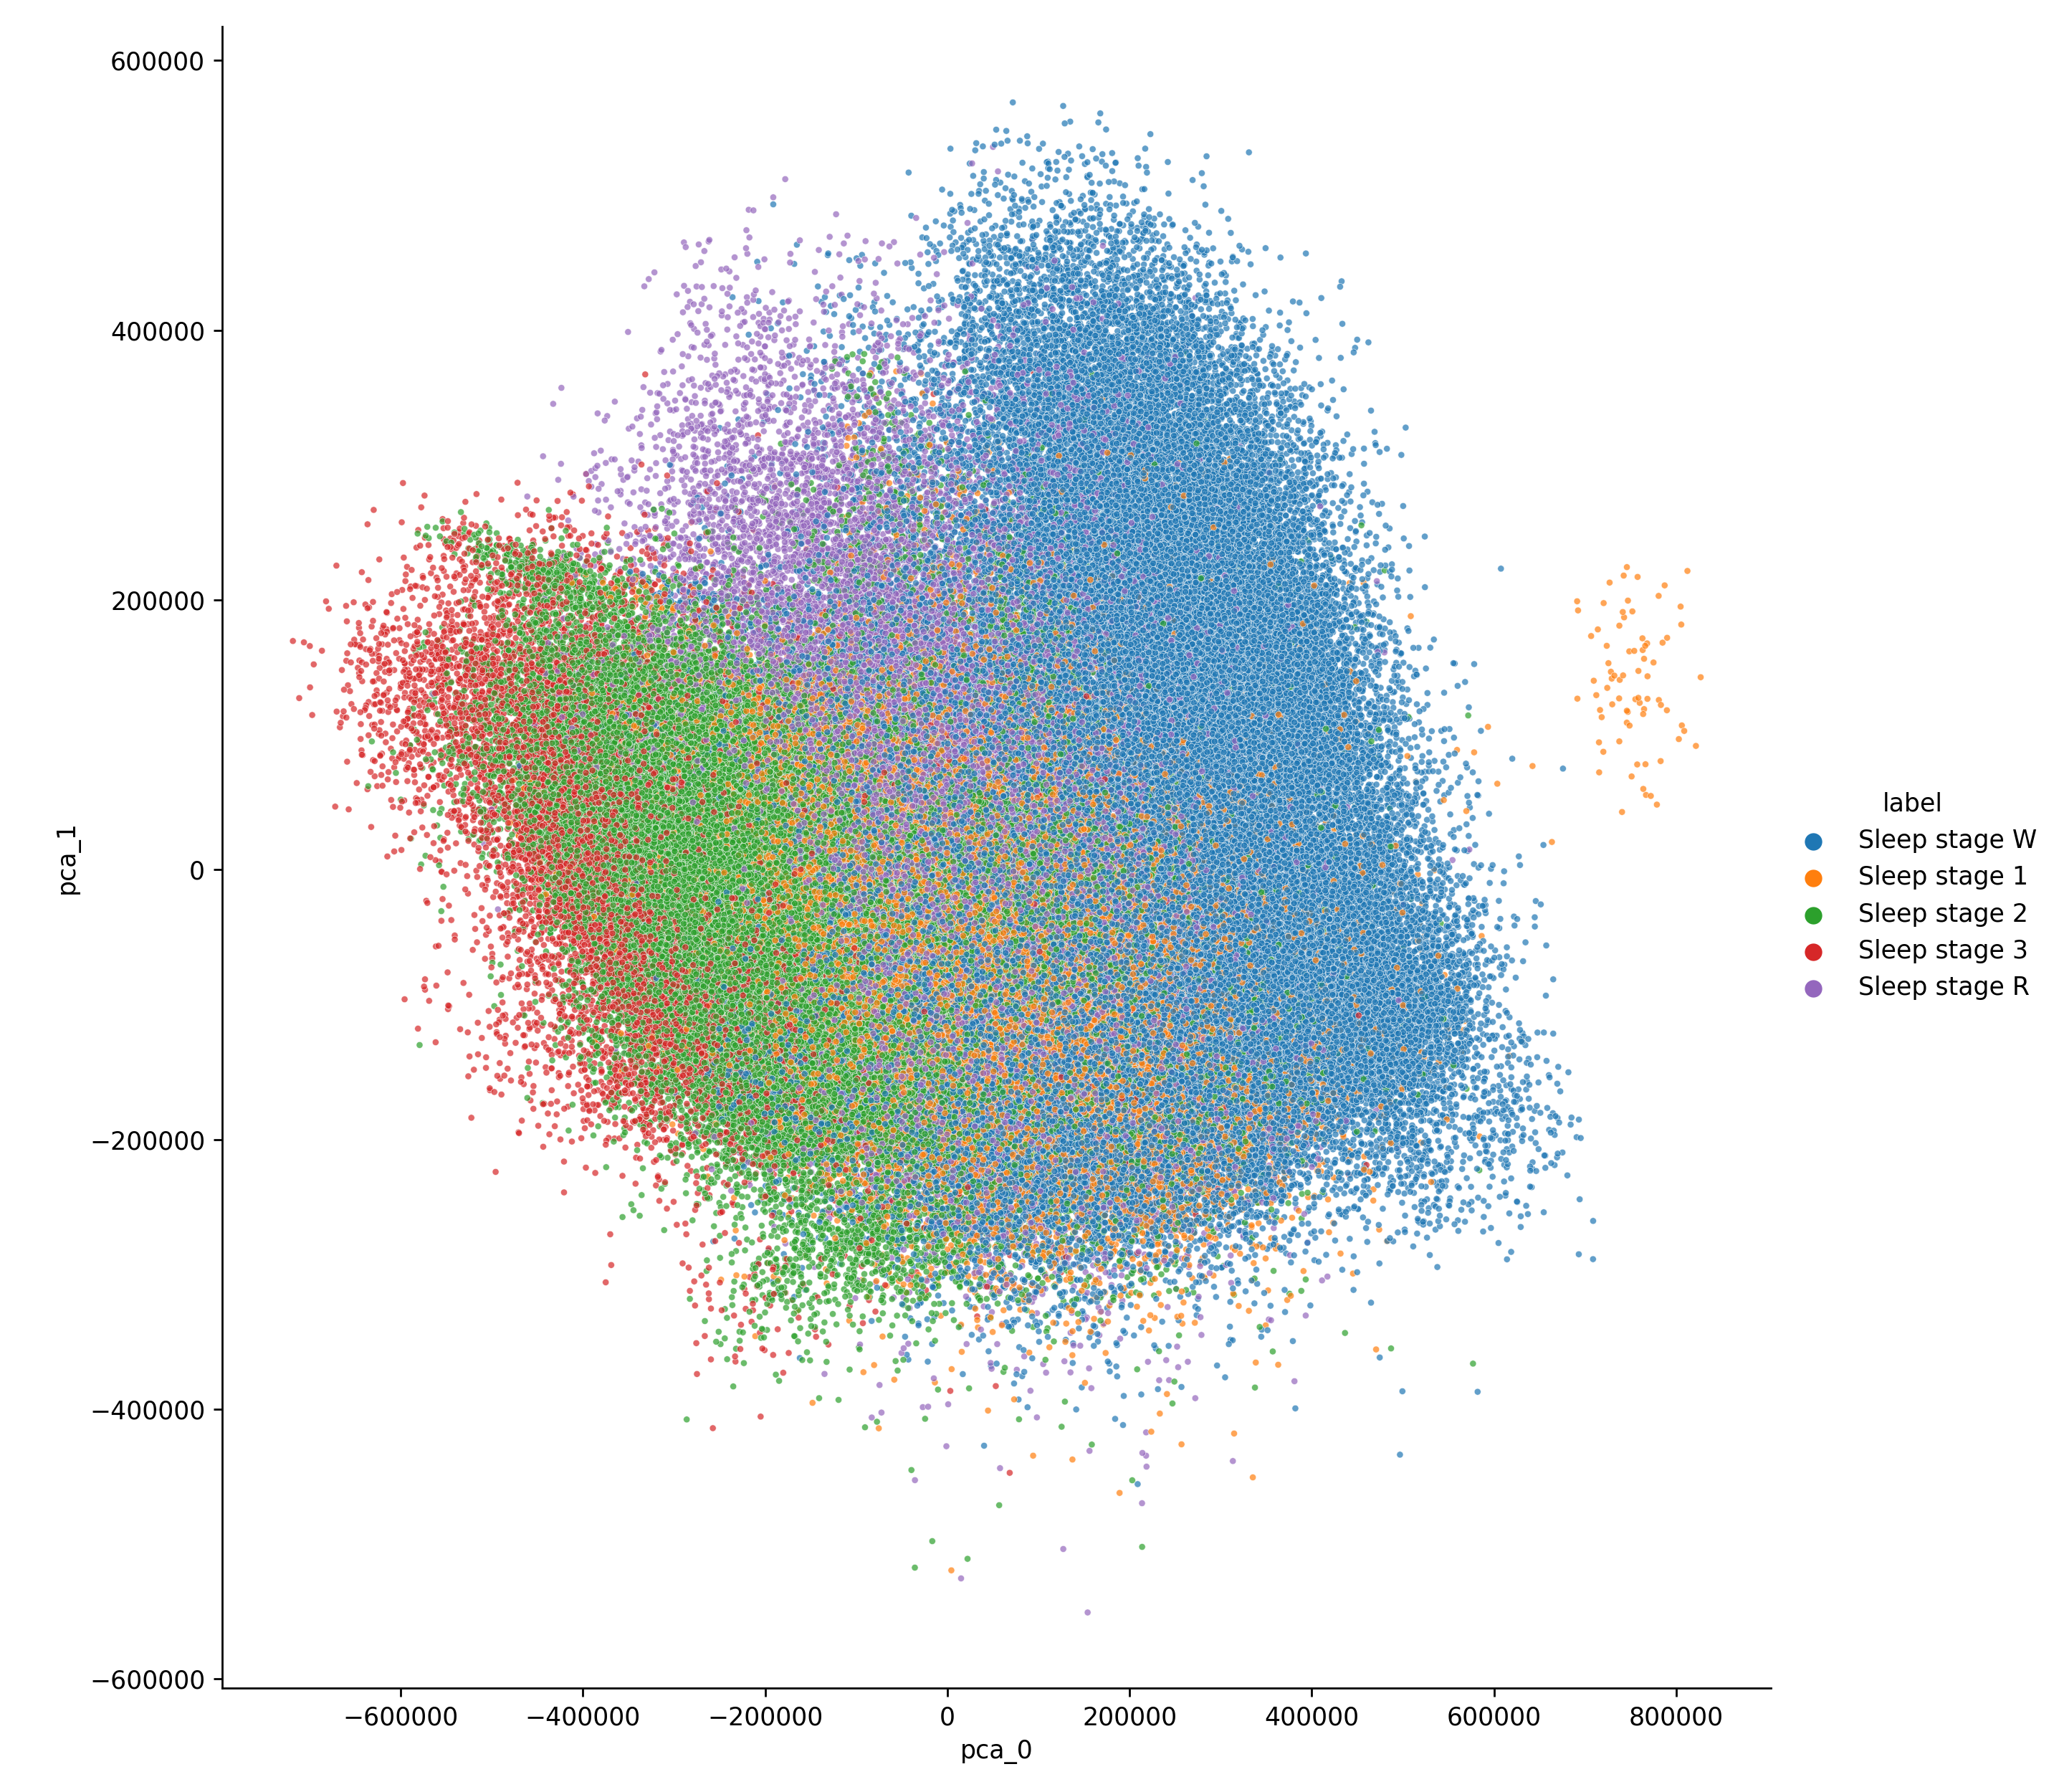
Figure 2 shows a 2D projection of the feature vector when utiluizing the two components with highest explained variance from a principal component analysis (PCA) decomposition131313In the code repository we also include a t-SNE projection of the feature vector. This projection is very similar to the PCA projection.. Remark that PCA performs a linear transformation on the feature vector. It can be observed that this unsupervised dimensionality reduction technique allows a good separation of the sleep stages (except for n1), with just two PCA components that are a linear combination of the feature vector. On top of that, the distance between the clusters of various sleep stages in this projection space is rather intriguing. We observe that rem is closest to wake, as rem EEG frequencies and EOG patterns have close similarity to the wake state. n3 is most distanced from wake, n2 is between n3 and rem, while n1 is scattered all over the place. As such, it appears that the x-axis corresponds to the depth of sleep.
4.5 Code availability & Reproducibility
The code and results from this study are made available on GitHub under an open source license https://github.com/predict-idlab/sleep-linear to enable reproducibility of all results. In this repository you can also find more detailed results, including learning curves, confusion matrices, feature importances, and log loss scores.
| Dataset | Year | System | Technique | LP | MF1 | ACC | Signals | |
|---|---|---|---|---|---|---|---|---|
| Sleep-EDF-SC-20 | 2021 | RobustSleepNet [19] | RNN | FT | 0,817 | - | - | EEG + EOG |
| 2022 | This work | Catboost | DT | 0,810 | 0,866 | 0,816 | EEG + EOG + EMG | |
| 2021 | XSleepnet2 [41] | CNN & RNN | LFS | 0,809 | 0,864 | 0,813 | EEG + EOG | |
| 2022 | This work | Logistic regr. | LFS | 0,809 | 0,857 | 0,806 | EEG + EOG + EMG | |
| 2022 | This work | Logistic regr. | DT | 0,805 | 0,863 | 0,813 | EEG + EOG + EMG | |
| 2020 | TinySleepNet [53] | CNN & RNN | LFS | 0,805 | 0,854 | 0,800 | EEG | |
| 2020 | SimpleSleepNet [18] | RNN | LFS | 0,805 | - | - | EEG + EOG | |
| 2022 | This work | Logistic regr. | LFS | 0,803 | 0,853 | 0,800 | EEG + EOG | |
| 2022 | This work | Catboost | LFS | 0,802 | 0,864 | 0,812 | EEG + EOG + EMG | |
| 2020 | XSleepnet1 [41] | CNN & RNN | LFS | 0,798 | 0,852 | 0,798 | EEG + EOG | |
| 2022 | This work | Catboost | LFS | 0,797 | 0,860 | 0,807 | EEG + EOG | |
| 2019 | SleepEEGNet [31] | CNN & RNN | LFS | 0,797 | 0,843 | 0,790 | EEG | |
| 2020 | SeqSleepNet+ [40] | RNN | FT | 0,796 | 0,852 | 0,789 | EEG | |
| 2021 | RobustSleepNet [19] | RNN | LFS | 0,791 | - | - | EEG + EOG | |
| 2021 | RobustSleepNet [19] | RNN | DT | 0,791 | - | - | EEG + EOG | |
| 2020 | DeepSleepNet+ [40] | CNN | FT | 0,790 | 0,846 | 0,782 | EEG + EOG | |
| 2021 | DeepSleepNet-Lite [16] | CNN | LFS | 0,780 | 0,840 | 0,780 | EEG | |
| 2019 | IITNet [46] | CNN & RNN | LFS | 0,776 | 0,839 | 0,780 | EEG | |
| 2017 | DeepSleepNet [52] | CNN & RNN | FT | 0,769 | 0,820 | 0,760 | EEG | |
| Sleep-EDF-SC-78 | 2022 | SleepTransformer [42] | transformer | FT | 0,788 | 0,849 | 0,789 | EEG |
| 2021 | XSleepnet2 [41] | CNN & RNN | LFS | 0,787 | 0,840 | 0,778 | EEG + EOG | |
| 2020 | XSleepnet1 [41] | CNN & RNN | LFS | 0,784 | 0,840 | 0,777 | EEG | |
| 2020 | TinySleepNet [53] | CNN & RNN | LFS | 0,781 | 0,831 | 0,770 | EEG | |
| 2021 | RobustSleepNet [19] | RNN | FT | 0,779 | - | - | EEG + EOG | |
| 2022 | This work | Catboost | LFS | 0,775 | 0,831 | 0,766 | EEG + EOG + EMG | |
| 2022 | This work | Catboost | LFS | 0,772 | 0,830 | 0,763 | EEG + EOG | |
| 2022 | This work | Logistic regr. | LFS | 0,771 | 0,821 | 0,756 | EEG + EOG + EMG | |
| 2022 | This work | Logistic regr. | LFS | 0,768 | 0,820 | 0,753 | EEG + EOG | |
| 2021 | RobustSleepNet [19] | RNN | LFS | 0,763 | - | - | EEG + EOG | |
| 2021 | DeepSleepNet-Lite [16] | CNN | LFS | 0,752 | 0,803 | 0,730 | EEG | |
| 2022 | SleepTransformer [42] | transformer | LFS | 0,743 | 0,814 | 0,743 | EEG | |
| 2021 | RobustSleepNet [19] | RNN | DT | 0,738 | - | - | EEG + EOG | |
| 2019 | SleepEEGNet [31] | CNN & RNN | LFS | 0,736 | 0,800 | 0,730 | EEG | |
| Sleep-EDF-ST | 2021 | RobustSleepNet [19] | RNN | FT | 0,810 | - | - | EEG + EOG |
| 2022 | This work | Catboost | LFS | 0,795 | 0,836 | 0,765 | EEG + EOG + EMG | |
| 2022 | This work | Logistic regr. | LFS | 0,792 | 0,829 | 0,759 | EEG + EOG + EMG | |
| 2021 | RobustSleepNet [19] | RNN | DT | 0,791 | - | - | EEG + EOG | |
| 2022 | This work | Catboost | LFS | 0,789 | 0,832 | 0,758 | EEG + EOG | |
| 2022 | This work | Logistic regr. | LFS | 0,788 | 0,825 | 0,754 | EEG + EOG | |
| 2021 | RobustSleepNet [19] | RNN | LFS | 0,786 | - | - | EEG + EOG | |
| 2020 | DeepSleepNet+ [40] | CNN | FT | 0,775 | 0,815 | 0,738 | EEG | |
| 2020 | SeqSleepNet+ [40] | RNN | FT | 0,775 | 0,810 | 0,734 | EEG | |
| MASS SS3 | 2020 | SimpleSleepNet [18] | RNN | LFS | 0,847 | - | - | EEG + EOG |
| 2021 | RobustSleepNet [19] | RNN | FT | 0,840 | - | - | EEG + EOG | |
| 2020 | TinySleepNet [53] | CNN & RNN | LFS | 0,832 | 0,875 | 0,820 | EEG | |
| 2021 | RobustSleepNet [19] | RNN | LFS | 0,822 | - | - | EEG + EOG | |
| 2022 | This work | Catboost | LFS | 0,817 | 0,867 | 0,803 | EEG + EOG + EMG | |
| 2017 | DeepSleepNet [52] | CNN & RNN | FT | 0,817 | 0,862 | 0,800 | EEG | |
| 2022 | This work | Catboost | LFS | 0,809 | 0,863 | 0,797 | EEG + EOG | |
| 2021 | RobustSleepNet [19] | RNN | DT | 0,808 | - | - | EEG + EOG | |
| 2022 | This work | Logistic regr. | LFS | 0,807 | 0,853 | 0,786 | EEG + EOG + EMG | |
| 2019 | IITNet [46] | CNN & RNN | LFS | 0,805 | 0,863 | 0,790 | EEG | |
| 2021 | U-Sleep [38] | CNN | DT | 0,800 | - | - | EEG + EOG | |
| 2022 | This work | Logistic regr. | LFS | 0,794 | 0,845 | 0,775 | EEG + EOG |
5 Discussion
In this section, we will discuss why our simple models match state-of-the-art predictive performances and what these results could imply for future research.
5.1 A good feature vector is all you need
Machine learning often boils down to transforming your data in a representation that is more suitable for prediction [11]. In particular, for classification tasks (such as sleep scoring), inference translates to separating the classes on the basis of a representation, i.e., creating decision boundaries within your data-representation space.
Deep learning is a popular machine learning approach nowadays as the task of transforming your data into a representation is learned by the model (the hidden layers of the model perform this transformation) instead of being constructed in a prior step. As a result, raw (scaled) data can be fed directly. In contrast, most classical machine learning models, such as linear models and tree-based models, do not learn internal representations on your raw data. Such models rely on learning relations on the supplied representations of the data that is fed to the model, e.g, linear relations when using a linear model or splitting thresholds when using decision trees. As a result, such models require an expressive feature vector as model input to work well.
We argue that classical machine learning is capable of achieving (near) state-of-the-art performance when using a feature vector that is highly representative for the sleep scoring task. This statement is confirmed by the impressive results when using a logistic regression classifier (see Table 3), as a linear model has limited expressiveness by learning linear relations on the input feature vector.
We believe that our feature vector exhibits several interesting properties, making it representative for sleep scoring as it is a (1) multi-resolution and (2) multi-domain summary of the multimodal PSG data, that (3) includes temporal context of the surrounding 2 epochs. The first two aspects are in line with the work of Nguyen et al. [25], where the authors showed that a multi-resolution multi-domain linear classifier achieves similar accuracy as state-of-the-art (deep learning) methods. However, the authors focus on sequence classifiers, whereas our work focuses on more simple and interpretable classical machine learning models. The second aspect is also in line with Phan et al. their XSleepNet paper [41], as the proposed architecture’s multi-view concept (using both raw signal data and time-frequency data) translates to multi-domain features in classical machine learning. The third aspect, i.e., shifting the 30s-window features, adds more temporal context in the feature vector. As a result, the model itself does not need to handle the temporal relationship that is present in sleep stages as we embed this in the features. This is in contrast to the many works that employ sequence-to-sequence deep learning models [40]. Furthermore, time series feature extraction conveniently handles multimodal data, as the features from various modalities are simply concatenated in one feature vector.
As mentioned above, the PCA projection further illustrates the representativity of our feature vector. These observations are in line with the results of Decat et al. where a feature-based cluster analysis was performed [10], highlighting that the clusters substantially overlap with visual sleep scoring.
Finally, we want to stress that no new features were invented, nor were specific optimizations applied to the feature vector. All features were imported from existing libraries containing field-tested features (tsfresh [9] and YASA [56]) and the strided-window feature extraction was conveniently realized with tsflex [58]141414We believe that recent advancements in the open source Python landscape enabled convenient and efficient creation of this feature vector. Especially the multi-window feature-extraction from tsflex [58] allowed efficient creation of multi-resolution features, and plotly-resampler [57] enabled effective visual analysis of the data.. As such, we can argue that limited effort was required in constructing the feature vector. Thus, we believe that this work is first to provide a counterexample to the claims of several works stating that feature extraction is a cumbersome and time-intensive process [31, 52, 46]. Therefore, we hope that this work will serve as a strong feature-based baseline in future research with deep learning.
5.2 Do not sleep on traditional machine learning
Given the main focus in the automatic sleep scoring domain on deep learning today, we believe that a lot of researchers have been sleeping on traditional machine learning. In other words, the impact of a representative feature vector and a simple machine learning model has been underestimated in this domain. Especially given the many advantages that this approach has over deep learning for clinical acceptance.
Section 2.2 highlights drawbacks of deep learning that are not or less prevalent in classical machine learning. To summarize, deep learning models (i) are hard to train, deploy and reproduce, and (ii) lack interpretability which results in black-box skepticism. In contrast, although classical machine learning models are not fully white-box, they are arguably more interpretable than deep learning models. Moreover, the first limitation, i.e., deep learning models requiring a lot of data to properly generalize, is observable in our results, as for the smaller datasets we outperform all deep learning approaches (when learning from scratch). Furthermore, contrasting to deep learning models being both resource and time expensive to train, our linear models contain 1,000 to 10,000x less parameters and inference (including processing and feature extraction) takes under 25 sec for a typical night in MASS SS3. The linear model fits in under a minute on the largest dataset in this study (on a low-end CPU - Intel Xeon E5-2650 v2)151515This training time does not include the time to preprocess and extract features, which is 20 sec for a typical night in MASS SS3. Note however that these steps should only happen once, as the extracted features from the processed data can be stored..
Our final remark is concerned with the minimal performance gains of the latest, complex (deep learning) solutions. Visual sleep scoring is inherently limited by a significant inter-scorer and intra-scorer disagreement [44], raising questions on the added value of those marginal improvements.
Considering all factors above, we believe that there is a strong case for paying more attention to conventional machine learning pipelines, consisting of simple models. Especially, the presented results show that using a more classical approach should not always come at the cost of performance.
6 Conclusion
In contrast to the numerous deep learning approaches in literature, this work investigates a more classical approach for automatic sleep scoring. In particular, we employ a conventional machine learning pipeline consisting of preprocessing, feature extraction, and a simple machine learning model. Results show that our approach outperforms current state-of-the-art on two small datasets, while scoring competitively on two larger datasets. We argue that the strength of our pipeline lies in having a highly representative feature vector, which we demonstrate through a PCA projection and the performance of our linear model. Our feature vectors are a multi-resolution and multi-domain summary of the PSG data and include temporal context of surrounding epochs. Such an expressive feature vector enables more simple and widely accepted machine learning models. On top of that, our training times are merely a fraction of those of deep learning solutions. Moreover, classical machine learning pipelines do not suffer from the challenges that are prevalent in deep learning, i.e., deep learning models being black-box models that are hard to train, deploy, reproduce, while lacking interpretability. These challenges themselves are directly hindering the broad clinical acceptance of deep learning models.
Given the strong performance of our simple pipeline together with the interpretability and successful track record in medicine of classical models, this work paves the path to adoption of classical sleep scoring algorithms in a clinical context. We further question if current research is targeting the right challenges by focusing on marginal improvements, certainly in the light of rather high inter-annotator disagreement.
With this work, we hope to raise a new perspective on automatic sleep scoring, where researchers are no longer sleeping on the performance of traditional machine learning.
Acknowledgements
The authors thank Vic Degraeve and Jarne Verhaeghe for providing feedback on the manuscript.
References
- [1] Alickovic, E., Subasi, A.: Ensemble svm method for automatic sleep stage classification. IEEE Transactions on Instrumentation and Measurement 67(6), 1258–1265 (2018)
- [2] Amann, J., Blasimme, A., Vayena, E., Frey, D., Madai, V.I.: Explainability for artificial intelligence in healthcare: a multidisciplinary perspective. BMC Medical Informatics and Decision Making 20(1), 1–9 (2020)
- [3] Berry, R.B., Budhiraja, R., Gottlieb, D.J., Gozal, D., Iber, C., Kapur, V.K., Marcus, C.L., Mehra, R., Parthasarathy, S., Quan, S.F., et al.: Rules for scoring respiratory events in sleep: update of the 2007 aasm manual for the scoring of sleep and associated events: deliberations of the sleep apnea definitions task force of the american academy of sleep medicine. Journal of clinical sleep medicine 8(5), 597–619 (2012)
- [4] Berthomier, C., Muto, V., Schmidt, C., Vandewalle, G., Jaspar, M., Devillers, J., Gaggioni, G., Chellappa, S.L., Meyer, C., Phillips, C., et al.: Exploring scoring methods for research studies: Accuracy and variability of visual and automated sleep scoring. Journal of sleep research 29(5), e12994 (2020)
- [5] Besedovsky, L., Lange, T., Haack, M.: The sleep-immune crosstalk in health and disease. Physiological reviews (2019)
- [6] Cappuccio, F.P., Miller, M.A.: Sleep and cardio-metabolic disease. Current cardiology reports 19(11), 1–9 (2017)
- [7] Chambon, S., Galtier, M.N., Arnal, P.J., Wainrib, G., Gramfort, A.: A deep learning architecture for temporal sleep stage classification using multivariate and multimodal time series. IEEE Transactions on Neural Systems and Rehabilitation Engineering 26(4), 758–769 (2018)
- [8] Chen, T., Guestrin, C.: Xgboost: A scalable tree boosting system. In: Proceedings of the 22nd acm sigkdd international conference on knowledge discovery and data mining. pp. 785–794 (2016)
- [9] Christ, M., Braun, N., Neuffer, J., Kempa-Liehr, A.W.: Time series feature extraction on basis of scalable hypothesis tests (tsfresh–a python package). Neurocomputing 307, 72–77 (2018)
- [10] Decat, N., Walter, J., Koh, Z.H., Sribanditmongkol, P., Fulcher, B.D., Windt, J.M., Andrillon, T., Tsuchiya, N.: Beyond traditional sleep scoring: Massive feature extraction and data-driven clustering of sleep time series. Sleep Medicine (2022)
- [11] Domingos, P.: A few useful things to know about machine learning. Communications of the ACM 55(10), 78–87 (2012)
- [12] Dong, H., Supratak, A., Pan, W., Wu, C., Matthews, P.M., Guo, Y.: Mixed neural network approach for temporal sleep stage classification. IEEE Transactions on Neural Systems and Rehabilitation Engineering 26(2), 324–333 (2017)
- [13] Dorogush, A.V., Ershov, V., Gulin, A.: Catboost: gradient boosting with categorical features support. arXiv preprint arXiv:1810.11363 (2018)
- [14] Eldele, E., Chen, Z., Liu, C., Wu, M., Kwoh, C.K., Li, X., Guan, C.: An attention-based deep learning approach for sleep stage classification with single-channel eeg. IEEE Transactions on Neural Systems and Rehabilitation Engineering 29, 809–818 (2021)
- [15] Fichman, R.G., Kohli, R., Krishnan, R.: Editorial overview—the role of information systems in healthcare: current research and future trends. Information systems research 22(3), 419–428 (2011)
- [16] Fiorillo, L., Favaro, P., Faraci, F.D.: Deepsleepnet-lite: A simplified automatic sleep stage scoring model with uncertainty estimates. IEEE Transactions on Neural Systems and Rehabilitation Engineering 29, 2076–2085 (2021)
- [17] Fiorillo, L., Puiatti, A., Papandrea, M., Ratti, P.L., Favaro, P., Roth, C., Bargiotas, P., Bassetti, C.L., Faraci, F.D.: Automated sleep scoring: A review of the latest approaches. Sleep medicine reviews 48, 101204 (2019)
- [18] Guillot, A., Sauvet, F., During, E.H., Thorey, V.: Dreem open datasets: multi-scored sleep datasets to compare human and automated sleep staging. IEEE Transactions on Neural Systems and Rehabilitation Engineering 28(9), 1955–1965 (2020)
- [19] Guillot, A., Thorey, V.: Robustsleepnet: Transfer learning for automated sleep staging at scale. arXiv preprint arXiv:2101.02452 (2021)
- [20] Hassan, A.R., Subasi, A.: A decision support system for automated identification of sleep stages from single-channel eeg signals. Knowledge-Based Systems 128, 115–124 (2017)
- [21] Kemp, B., Zwinderman, A., Tuk, B., Kamphuisen, H., Oberye, J.: Analysis of a sleep-dependent neuronal feedback loop: the slow-wave microcontinuity of the eeg. IEEE Transactions on Biomedical Engineering 47(9), 1185–1194 (2000). https://doi.org/10.1109/10.867928
- [22] Khalighi, S., Sousa, T., Pires, G., Nunes, U.: Automatic sleep staging: A computer assisted approach for optimal combination of features and polysomnographic channels. Expert Systems with Applications 40(17), 7046–7059 (2013)
- [23] Koley, B., Dey, D.: An ensemble system for automatic sleep stage classification using single channel eeg signal. Computers in biology and medicine 42(12), 1186–1195 (2012)
- [24] Lajnef, T., Chaibi, S., Ruby, P., Aguera, P.E., Eichenlaub, J.B., Samet, M., Kachouri, A., Jerbi, K.: Learning machines and sleeping brains: automatic sleep stage classification using decision-tree multi-class support vector machines. Journal of neuroscience methods 250, 94–105 (2015)
- [25] Le Nguyen, T., Gsponer, S., Ilie, I., O’Reilly, M., Ifrim, G.: Interpretable time series classification using linear models and multi-resolution multi-domain symbolic representations. Data mining and knowledge discovery 33(4), 1183–1222 (2019)
- [26] Li, X., Cui, L., Tao, S., Chen, J., Zhang, X., Zhang, G.Q.: Hyclasss: a hybrid classifier for automatic sleep stage scoring. IEEE journal of biomedical and health informatics 22(2), 375–385 (2017)
- [27] Liang, S.F., Kuo, C.E., Hu, Y.H., Pan, Y.H., Wang, Y.H.: Automatic stage scoring of single-channel sleep eeg by using multiscale entropy and autoregressive models. IEEE Transactions on Instrumentation and Measurement 61(6), 1649–1657 (2012)
- [28] Malafeev, A., Laptev, D., Bauer, S., Omlin, X., Wierzbicka, A., Wichniak, A., Jernajczyk, W., Riener, R., Buhmann, J., Achermann, P.: Automatic human sleep stage scoring using deep neural networks. Frontiers in neuroscience p. 781 (2018)
- [29] Malhotra, A., Younes, M., Kuna, S.T., Benca, R., Kushida, C.A., Walsh, J., Hanlon, A., Staley, B., Pack, A.I., Pien, G.W.: Performance of an automated polysomnography scoring system versus computer-assisted manual scoring. Sleep 36(4), 573–582 (2013)
- [30] Michielli, N., Acharya, U.R., Molinari, F.: Cascaded lstm recurrent neural network for automated sleep stage classification using single-channel eeg signals. Computers in biology and medicine 106, 71–81 (2019)
- [31] Mousavi, S., Afghah, F., Acharya, U.R.: Sleepeegnet: Automated sleep stage scoring with sequence to sequence deep learning approach. PloS one 14(5), e0216456 (2019)
- [32] Ohayon, M.M.: Epidemiological overview of sleep disorders in the general population. Sleep Medicine Research 2(1), 1–9 (2011)
- [33] Olesen, A.N., Jennum, P., Peppard, P., Mignot, E., Sorensen, H.B.: Deep residual networks for automatic sleep stage classification of raw polysomnographic waveforms. In: 2018 40th Annual International Conference of the IEEE Engineering in Medicine and Biology Society (EMBC). pp. 1–4. IEEE (2018)
- [34] O’reilly, C., Gosselin, N., Carrier, J., Nielsen, T.: Montreal archive of sleep studies: an open-access resource for instrument benchmarking and exploratory research. Journal of sleep research 23(6), 628–635 (2014)
- [35] Pathak, S., Lu, C., Nagaraj, S.B., van Putten, M., Seifert, C.: Stqs: Interpretable multi-modal spatial-temporal-sequential model for automatic sleep scoring. Artificial intelligence in medicine 114, 102038 (2021)
- [36] Pedregosa, F., Varoquaux, G., Gramfort, A., Michel, V., Thirion, B., Grisel, O., Blondel, M., Prettenhofer, P., Weiss, R., Dubourg, V., et al.: Scikit-learn: Machine learning in python. the Journal of machine Learning research 12, 2825–2830 (2011)
- [37] Penzel, T., Conradt, R.: Computer based sleep recording and analysis. Sleep medicine reviews 4(2), 131–148 (2000)
- [38] Perslev, M., Darkner, S., Kempfner, L., Nikolic, M., Jennum, P.J., Igel, C.: U-sleep: resilient high-frequency sleep staging. NPJ digital medicine 4(1), 1–12 (2021)
- [39] Phan, H., Andreotti, F., Cooray, N., Chén, O.Y., De Vos, M.: Joint classification and prediction cnn framework for automatic sleep stage classification. IEEE Transactions on Biomedical Engineering 66(5), 1285–1296 (2018)
- [40] Phan, H., Chén, O.Y., Koch, P., Lu, Z., McLoughlin, I., Mertins, A., De Vos, M.: Towards more accurate automatic sleep staging via deep transfer learning. IEEE Transactions on Biomedical Engineering 68(6), 1787–1798 (2020)
- [41] Phan, H., Chén, O.Y., Tran, M.C., Koch, P., Mertins, A., De Vos, M.: Xsleepnet: Multi-view sequential model for automatic sleep staging. IEEE Transactions on Pattern Analysis and Machine Intelligence (2021)
- [42] Phan, H., Mikkelsen, K.B., Chen, O., Koch, P., Mertins, A., De Vos, M.: Sleeptransformer: Automatic sleep staging with interpretability and uncertainty quantification. IEEE Transactions on Biomedical Engineering (2022)
- [43] Rechtschaffen, A.: A manual for standardized terminology, techniques and scoring system for sleep stages in human subjects. Brain information service (1968)
- [44] Rosenberg, R.S., Van Hout, S.: The american academy of sleep medicine inter-scorer reliability program: sleep stage scoring. Journal of clinical sleep medicine 9(1), 81–87 (2013)
- [45] Rudin, C.: Stop explaining black box machine learning models for high stakes decisions and use interpretable models instead. Nature Machine Intelligence 1(5), 206–215 (2019)
- [46] Seo, H., Back, S., Lee, S., Park, D., Kim, T., Lee, K.: Intra-and inter-epoch temporal context network (iitnet) using sub-epoch features for automatic sleep scoring on raw single-channel eeg. Biomedical Signal Processing and Control 61, 102037 (2020)
- [47] Shrivastava, D., Jung, S., Saadat, M., Sirohi, R., Crewson, K.: How to interpret the results of a sleep study. Journal of community hospital internal medicine perspectives 4(5), 24983 (2014)
- [48] Silber, M.H., Ancoli-Israel, S., Bonnet, M.H., Chokroverty, S., Grigg-Damberger, M.M., Hirshkowitz, M., Kapen, S., Keenan, S.A., Kryger, M.H., Penzel, T., et al.: The visual scoring of sleep in adults. Journal of clinical sleep medicine 3(02), 121–131 (2007)
- [49] on Sleep Disorders Research, N.C., et al.: National institutes of health sleep disorders research plan. Bethesda, MD: National Institutes of Health (2011)
- [50] Sors, A., Bonnet, S., Mirek, S., Vercueil, L., Payen, J.F.: A convolutional neural network for sleep stage scoring from raw single-channel eeg. Biomedical Signal Processing and Control 42, 107–114 (2018)
- [51] Stephansen, J.B., Olesen, A.N., Olsen, M., Ambati, A., Leary, E.B., Moore, H.E., Carrillo, O., Lin, L., Han, F., Yan, H., et al.: Neural network analysis of sleep stages enables efficient diagnosis of narcolepsy. Nature communications 9(1), 1–15 (2018)
- [52] Supratak, A., Dong, H., Wu, C., Guo, Y.: Deepsleepnet: A model for automatic sleep stage scoring based on raw single-channel eeg. IEEE Transactions on Neural Systems and Rehabilitation Engineering 25(11), 1998–2008 (2017)
- [53] Supratak, A., Guo, Y.: Tinysleepnet: An efficient deep learning model for sleep stage scoring based on raw single-channel eeg. In: 2020 42nd Annual International Conference of the IEEE Engineering in Medicine & Biology Society (EMBC). pp. 641–644. IEEE (2020)
- [54] Tsinalis, O., Matthews, P.M., Guo, Y.: Automatic sleep stage scoring using time-frequency analysis and stacked sparse autoencoders. Annals of biomedical engineering 44(5), 1587–1597 (2016)
- [55] Tsinalis, O., Matthews, P.M., Guo, Y., Zafeiriou, S.: Automatic sleep stage scoring with single-channel eeg using convolutional neural networks. arXiv preprint arXiv:1610.01683 (2016)
- [56] Vallat, R., Walker, M.P.: An open-source, high-performance tool for automated sleep staging. Elife 10, e70092 (2021)
- [57] Van Der Donckt, J., Van Der Donckt, J., Deprost, E., Van Hoecke, S.: Plotly-resampler: Effective visual analytics for large time series. arXiv preprint arXiv:2206.08703 (2022)
- [58] Van Der Donckt, J., Van Der Donckt, J., Deprost, E., Van Hoecke, S.: tsflex: Flexible time series processing & feature extraction. SoftwareX 17, 100971 (2022). https://doi.org/https://doi.org/10.1016/j.softx.2021.100971, https://www.sciencedirect.com/science/article/pii/S2352711021001904
- [59] Vilamala, A., Madsen, K.H., Hansen, L.K.: Deep convolutional neural networks for interpretable analysis of eeg sleep stage scoring. In: 2017 IEEE 27th international workshop on machine learning for signal processing (MLSP). pp. 1–6. IEEE (2017)
- [60] Wulff, K., Gatti, S., Wettstein, J.G., Foster, R.G.: Sleep and circadian rhythm disruption in psychiatric and neurodegenerative disease. Nature Reviews Neuroscience 11(8), 589–599 (2010)
- [61] You, Y., Zhong, X., Liu, G., Yang, Z.: Automatic sleep stage classification: A light and efficient deep neural network model based on time, frequency and fractional fourier transform domain features. Artificial Intelligence in Medicine 127, 102279 (2022)