SDSS-IV MaNGA: Global Properties of Kinematically Misaligned Galaxies
Abstract
We select 456 gas-star kinematically misaligned galaxies from the internal Product Launch-10 of MaNGA survey, including 74 star-forming (SF), 136 green-valley (GV) and 206 quiescent (QS) galaxies. We find that the distributions of difference between gas and star position angles for galaxies have three local peaks at , , . The fraction of misaligned galaxies peaks at and declines to both low and high mass end. This fraction decreases monotonically with increasing SFR and sSFR. We compare the global parameters including gas kinematic asymmetry , H i detection rate and mass fraction of molecular gas, effective radius , Sérsic index as well as spin parameter between misaligned galaxies and their control samples. We find that the misaligned galaxies have lower H i detection rate and molecular gas mass fraction, smaller size, higher Sérsic index and lower spin parameters than their control samples. The SF and GV misaligned galaxies are more asymmetric in gas velocity fields than their controls. These observational evidences point to the gas accretion scenario followed by angular momentum redistribution from gas-gas collision, leading to gas inflow and central star formation for the SF and GV misaligned galaxies. We propose three possible origins of the misaligned QS galaxies: (1) external gas accretion; (2) merger; (3) GV misaligned galaxies evolve into QS galaxies.
keywords:
galaxies: evolution – galaxies: kinematics and dynamics1 Introduction
In standard cold dark matter (CDM) cosmological model, galaxies form from primordial density fluctuations and grow through a series of internal and external process. The internal process, or known as the secular evolution, includes stellar winds, supernova explosion, active galactic nucleus (AGN) feedback. The external process includes major/minor mergers and external gas accretion. All these processes are related to gas loss or acquisition, which is the key to regulate the evolution of a galaxy.
Galaxies can return gas to interstellar space through stellar mass loss and AGN feedback. From conservation law of angular momentum, these returned gas should kinematically aligned with stellar components. Furthermore, if the evolution of galaxies is primarily controlled by the internal process, we would expect kinematic alignment between the stellar and gaseous components. However, about two decades ago, long-slit spectroscopic observations have revealed that phenomenon of gas-star counter-rotation (Galletta, 1987) is ubiquitous (2024%) in elliptical and lenticular galaxies (Bertola et al., 1992; Kuijken et al., 1996; Kannappan & Fabricant, 2001). Due to the development of integral-field spectroscopic (IFS) surveys, on the one hand, they confirm the universality of gas-star misalignment (2050%) in early type galaxies (Sarzi et al., 2006; Davis et al., 2011; Barrera-Ballesteros et al., 2015; Chen et al., 2016; Jin et al., 2016; Bryant et al., 2019). On the other hand, they find a fraction of 25% gas-star misalignment in blue star forming galaxies (Chen et al., 2016; Jin et al., 2016; Bryant et al., 2019). The misaligned gaseous components in these kinds of galaxies are believed to originate from external processes. They provide an ideal laboratory to investigate the influences of external processes on galaxy evolution. Whether the newly acquired gas triggers/enhances star formation or AGN activities? Whether the structure of the host galaxies is completely reshaped or merely perturbed?
In the last decade, series of work based on the IFS surveys are devoted to study the spatially resolved properties of gas-star kinematically misaligned galaxies, trying to understand their formation mechanisms. Galactic scale gas-star misalignment is believed to originate externally. Galaxy interaction, merger and gas accretion from dwarf companion or cosmic web are all proposed to be its possible origin. Based on survey, Davis et al. (2011) discover of early-type galaxies in field showing kinematic misalignments while almost all the galaxies in Virgo cluster have gas-star alignment, which suggest a strong dependence on the environment. Barrera-Ballesteros et al. (2014, 2015) compare the (, where is position angle of stellar velocity field and is PA for gas) distribution between interacting galaxies (different stage of merger) and non-interacting galaxies in CALIFA survey, finding that galaxies with large () are dominated by early-type interacting galaxies, compared to small () in late-type interacting galaxies and non-interacting control samples, indicating merger is the main formation pathway for kinematic misalignment in early-type galaxies. Combining MaNGA survey with optical images from DESI Legacy survey, Li et al. (2021) find out that the merging remnant fraction is 10% higher in quiescent misaligned galaxies with than their co-rotating counterparts, while the fraction is nearly identical between star-forming misaligned galaxies (10%) and co-rotators (7%). Based on the MaNGA survey, the existence of blue counter-rotators has been discovered and they show younger stellar populations with more intense ongoing star formation in the central region (Chen et al., 2016; Jin et al., 2016), suggesting gas accretion in blue star-forming galaxies as an origin of kinematic misalignment. Chen et al. (2016) and Jin et al. (2016) propose the interaction between pre-existing and accreted gas as an angular momentum loss mechanism. Bryant et al. (2019) discover a similar environment dependence of misaligned fraction using SAMI survey, and point out that mergers are not the primary driver of gas-star misalignment in disc galaxies, while in clusters the misalignment is mainly driven by inner cluster process such as ram pressure stripping. As a summary, the literatures suggest different types of kinematically misaligned galaxies possess different formation mechanisms.
Following the development of observations, kinematically misaligned galaxies are also found and investigated based on cosmological simulations. Taylor et al. (2018) examine 3 gas-star counter-rotating galaxies among 82 galaxies with and all of them experience gas accretion from cosmological filaments followed by gas inflow to the galaxy center. Starkenburg et al. (2019) find that 73% of counter-rotating galaxies with experience AGN feedback/flyby through group or cluster before the phenomenon of counter-rotation (). Duckworth et al. (2020a); Duckworth et al. (2020b) find that misaligned galaxies with have enhanced black hole (BH) luminosity and BH growth in IllustrisTNG. Both Starkenburg et al. (2019) and Duckworth et al. (2020a); Duckworth et al. (2020b) suggest gas removal followed by misaligned gas accretion is a key step to form low mass misaligned galaxies. However, Khoperskov et al. (2021) discover 25 star-star counter-rotating galaxies with , finding that they all display gas-star misalignments and experience gas accretion but without sudden gas removal by AGN feedback. Bassett et al. (2017) study gas-star counter-rotating S0 galaxies formed through minor merger finding that the key requirement for counter-rotation is the companion galaxy lying in the retrograde orbit with respect to the primary. From IllustrisTNG, Lu et al. (2021) concentrate on the dynamically hot star-forming disc galaxies with and find out that the counter-rotating galaxies experience less mergers compared to normal disc galaxies. Using Horizon-AGN simulation, Khim et al. (2021) estimate relative contribution of different formation mechanisms to the emergence of gas-star misalignment in galaxies with finding that mergers contribute 35%, galaxy interactions (gas accretion from nearby galaxies) contribute 23%, environmental interactions such as ram pressure stripping contribute 21% and secular evolution (containing smooth gas accretion from filaments) contributes 21%.
In this paper, we select 456 gas-star kinematically misaligned galaxies from the internal Product Launch-10 (MPL-10) in Mapping Nearby Galaxies at Apache Point Observatory (MaNGA, Bundy et al., 2015), a new fibre-optic integral field unit (IFU) survey. This is the largest gas-star kinematically misaligned sample so far. As a complementary work of Xu et al. (2022), we study the global properties of the misaligned galaxies. The paper is organized as follows. In Section 2 we give a short introduction on MaNGA survey and describe our data selection process. In Section 3 the global properties for kinematically misaligned galaxies are studied, including: the distribution of ; the fraction of misaligned galaxies as a function of galaxy properties; gas kinematic asymmetry; H i-detection rate and molecular gas mass; size, morphology, the spin paramters of stars, and the environment. The flat CDM cosmological model is applied with parameters , , and throughout this paper.
2 data
2.1 The MaNGA survey
MaNGA is a core program in the fourth-generation Sloan Digital Sky Survey (SDSS-IV, Blanton et al., 2017) started on July 1, 2014. The program uses the 2.5 m Sloan Foundation Telescope at the Apache Point Observatory (Gunn et al., 2006). Unlike previous SDSS surveys which obtain single fiber spectra at the centers of target galaxies, MaNGA applies 17 simultaneous hexagonal IFUs (Law et al., 2015) with the diameter ranging from (19 fibers) to (127 fibers) to explore detailed internal structure of nearby galaxies (Drory et al., 2015), while the mini-bundles with seven fibers are used for flux calibration (Yan et al., 2016a). It has finished the survey of an unprecedented sample of about 10,000 galaxies in early 2021 with a redshift coverage of (Wake et al., 2017). The galaxies are selected to span a stellar mass interval of nearly 3 orders of magnitude with a flat distribution in between . The target selection procedure divides galaxies into "Primary" and "Secondary" which extend the radial coverage out to effective radius (, Petrosian 50% light radius) and respectively (Yan et al., 2016b). Two dual-channel BOSS spectrographs provide a wavelength coverage of 3600-10,300Å with a spectral resolution (Smee et al., 2013). Typical 3-hour dithered exposures ensure a per-fiber -band continuum signal-to-noise ratio (S/N) per angstrom of at , with much higher S/N towards the center. The fiber diameter corresponds to a spatial sampling of .
The Data Reduction Pipeline (DRP, Law et al., 2016) of MaNGA provides sky subtracted and flux calibrated 3D spectra for each galaxy. The Data Analysis Pipeline (DAP) is a survey-led software package for analyzing the spectra produced by the DRP to estimate physical properties. The DAP (Westfall et al., 2019) has been developed since 2014 and gone through several versions. In this work, we use the MaNGA sample and DAP products drawn from the MPL-10. The DAP heavily relies on penalized pixel-fitting (pPXF, Cappellari & Emsellem, 2004) and a subset of stellar templates from MaSTar library (Yan et al., 2019) to fit the stellar continuum and absorptions in each spaxel. The data products include the measurements of stellar kinematics, nebular emission-line properties (e.g., fluxes, equivalent widths, kinematics), spectral indices of absorption-line (e.g., H) and bandhead/color (e.g., TiO, 4000).
2.2 Sample selection
From the 9,456 unique galaxies in MPL-10, we first select 9,291 galaxies without faults and critical failure in DRP or DAP marked by DAPDONE and DAPQUAL keywords. To get the robust measurement of gas velocity field, we first discard 2,333 "lineless" galaxies. The "lineless" galaxies are defined as objects with H S/N lower than 3 for more than 90% spaxels within 1.5. The remaining 6,958 sources are referred as emission-line galaxies. We then use PaFit package in Python (Krajnović et al., 2006) to fit the position angle (PA) for stellar and gaseous velocity fields of each galaxy. Spaxels within with median spectral S/N>3 per spaxel are used for fitting, where bad spaxels are removed based on the MaNGA DAP flag.
With the measurements of PA of stellar component () and gaseous component (), the position angle offset is calculated for each emission-line galaxy. We then select 723 candidates of misaligned galaxies defined as with robust PA measurements (, where is the error of PAs).
Finally, we visually check the 723 sources and select 456 misaligned galaxies. On-going mergers, galaxies with irregular morphologies, groups within a single MaNGA bundle are removed through this process since it is hard to assign a major axis. In summary we obtain 456 misaligned galaxies from 6,958 emission-line galaxies in MPL-10.
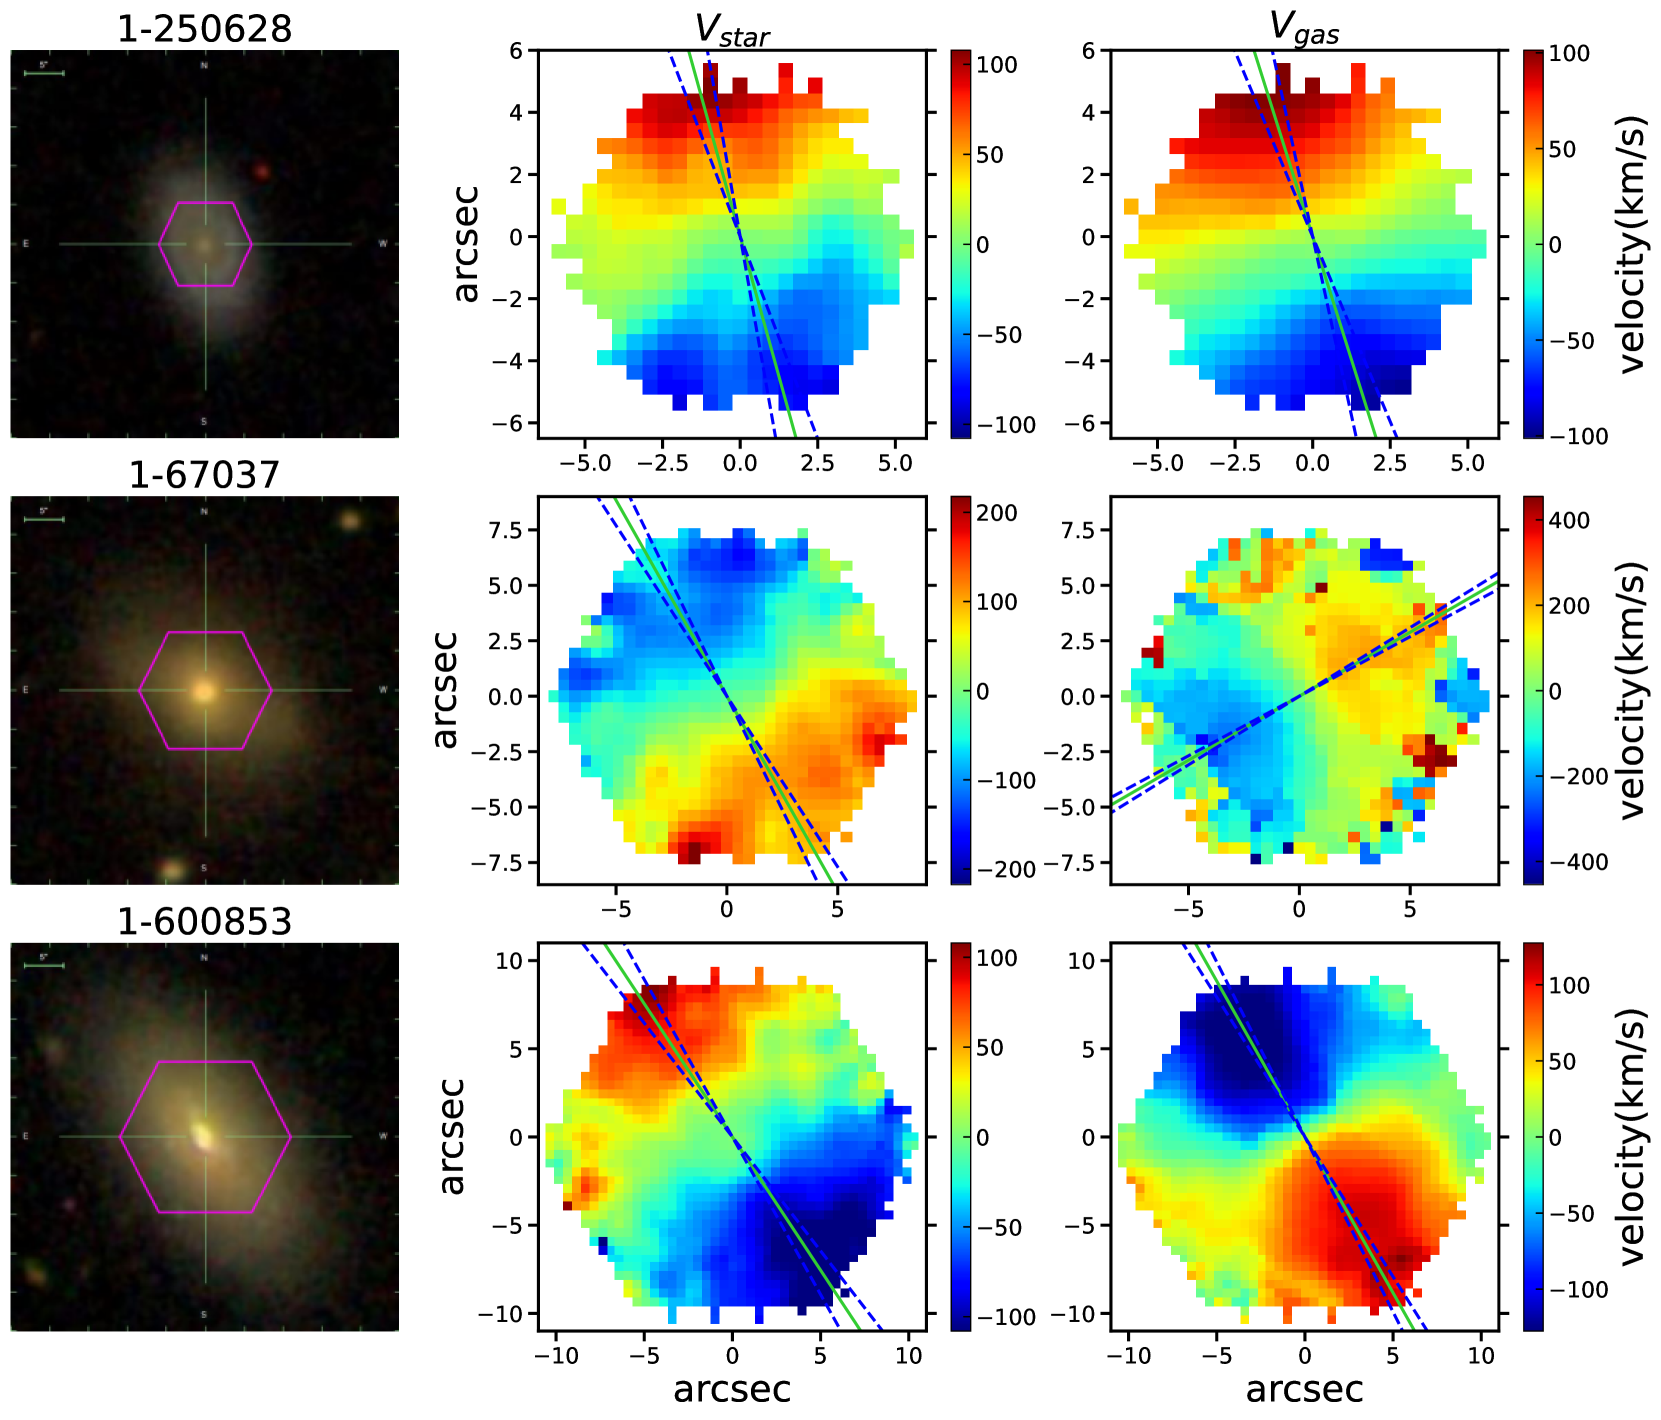
Fig. 1 shows three examples of MaNGA galaxies. The left column gives the false color image. The middle and right column display the stellar and H velocity field respectively. The solid green lines mark the position angle (PA) of each component while the blue dashed lines mark the error of PAs. The top row shows clear kinematic alignment and the middle row displays perpendicular gas-star misalignment. The bottom row shows an example of counter-rotator.
We cross match the MaNGA galaxies with catalog from Chang et al. (2015) and obtain the global stellar mass (), star formation rate (SFR) for 6,217 emission-line galaxies and 416 out of 456 misaligned galaxies. The and SFR are estimated through photometric spectrum energy distribution (SED) fitting based on data from SDSS and WISE photometry with Chabrier initial mass function (IMF, Chabrier, 2003). Fig. 2 shows the SFR vs. diagram with grey dots representing MaNGA galaxies and the red squares being the misaligned sample. The black contours depict galaxies from Chang et al. (2015). It is clear that there are two density peaks of these contours. The two black dashed lines (Jin et al., 2016) separate galaxies into three populations, where the upper line is the scatter of the star-forming main sequence and the lower line is (Chen et al., 2016). The top density peak with high SFR is defined as the star forming main sequence (SF), while the bottom peak with little star formation is the red quiescent sequence (QS). The population in between these two extremes is defined as green valley (GV). These 416 misaligned galaxies are divided into 74 SF, 136 GV and 206 QS galaxies. And the fractions of misaligned galaxies in emission-line galaxies with different galaxy types are 2.4% (SF), 7.3% (GV) and 15.6% (QS) respectively.
2.3 Control Samples
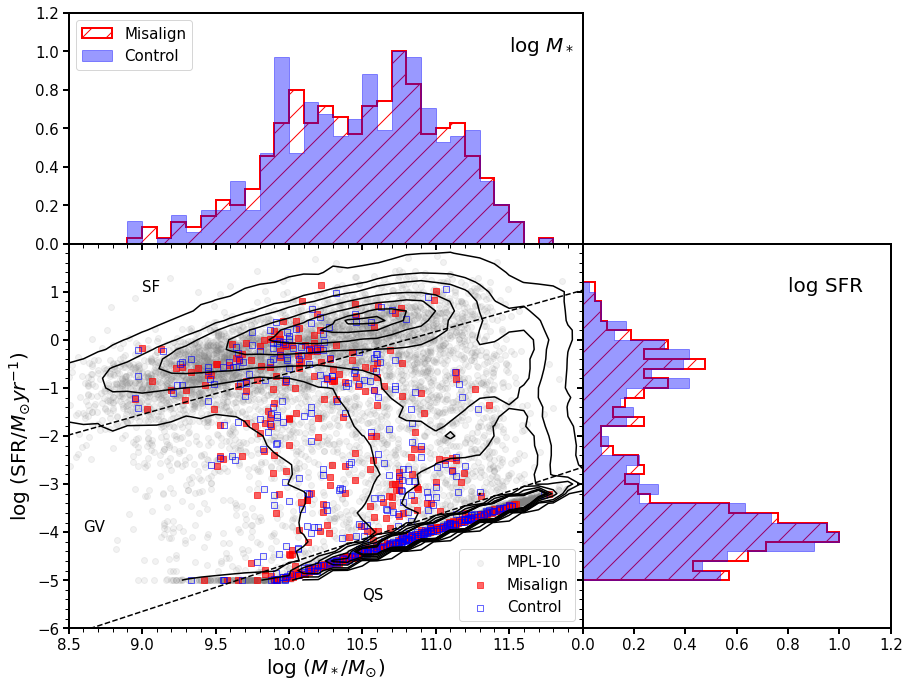
It is believed that the gas of the kinematically misaligned galaxies has an external origin like mergers and gas accretion. In order to quantify the influence of external gas acquisition on the following evolution of progenitor galaxies, we build ten non-misaligned control samples with for comparison. For each misaligned galaxy, we randomly select ten non-misaligned galaxies which are closely matched in the global and SFR, with and . The motivation of choosing and SFR as matching parameters includes: i) stellar mass is the most fundamental property of a galaxy and tightly correlates with many other physical parameters; (ii) requiring the control galaxies to have similar SFR is extremely important since the fraction of kinematically misaligned galaxies strongly depends on star formation activity (see Section 3.2). We show one of the control samples in Fig. 2 as blue squares. The right-hand panel gives the distribution of SFR for misaligned (blue) galaxies and control (red) samples while the top panel gives the distribution of . The peak of each distribution is set to 1. It is clear that the sample and controls have similar distributions in and SFR.
3 Results
3.1 PA Distribution
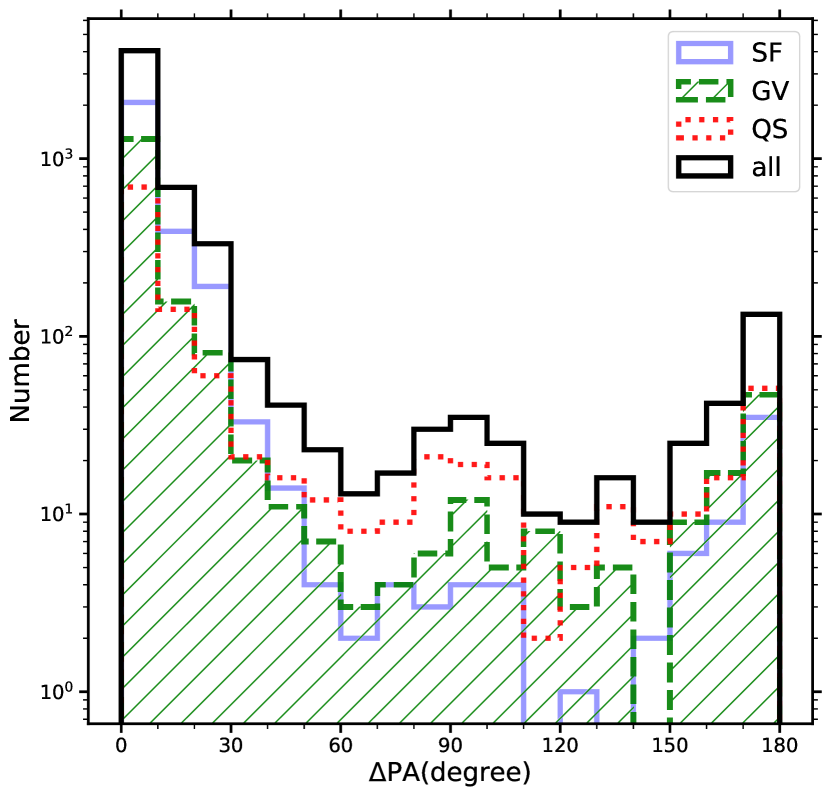
Fig. 3 shows the distribution for galaxies with robust gaseous and stellar PA measurements (black solid). The blue solid, green dashed and red dotted histograms represent the SF, GV and QS samples respectively. There are three local peaks at , and . To quantify the statistical significance of the peak at , we perform the one-sample KS test with respect to a normal distribution which has a mean value of with standard deviation of . The -value for SF, GV, QS and all galaxies are , , and respectively. The -value larger than suggests that we cannot reject the hypothesis that they are drawn from the normal distribution at the peak of . This triple peak distribution can be easily understood that the gas disks will feel a torque from stellar disks in case of , , , which will pull the gas disk to co-rotating or counter-rotating with respect to stellar disks.
3.2 The fraction of misaligned galaxies
It is well known that the misaligned galaxies are ubiquitous in S0 and elliptical galaxies, but much fewer in blue star forming galaxies. This could be due to the large cross section between gaseous components. If misaligned galaxies accrete external gas, the newly acquired gas will collide with the pre-existing gas in the progenitors, leading to the redistribution of angular momentum (Chen et al., 2016). Thus, in the gas-poor early type galaxies, the accreted misaligned gas would be easier to survive since the interaction with pre-existing gas is less important and the collisional cross-section between gas and star is too small to influence the angular momentum of the accreted gas, while in the gas-rich star forming galaxies, the misaligned phenomenon would only appear when the angular momentum of the accreted gas is larger than the pre-existing gas.
In the MaNGA target selection strategy (Wake et al., 2017), there is no cuts on size, inclination, morphology or environment. It provides an unprecedented IFU sample which is fully representative of the local galaxy population and the selection is well understood. Based on the largest misaligned sample from MaNGA, we analyze the dependence of kinematic misalignment fraction on galaxy physical parameters (, SFR, ) over all the galaxy populations.
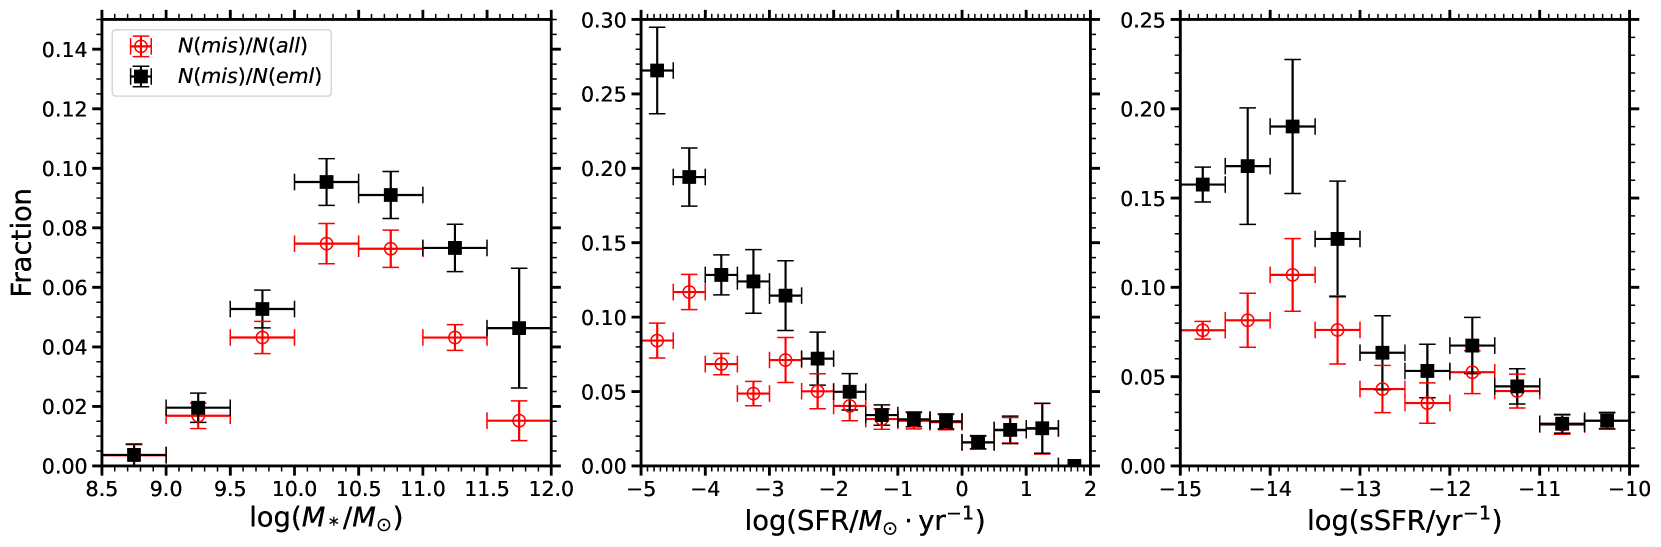
Fig. 4 shows how the fraction of misaligned galaxies varies with (left), SFR (middle) and sSFR (right). We estimate the errorbar by bootstrap method. The red circles are fractions of misaligned galaxies with respect to all galaxies (including emission-line and "lineless" galaxies) in a certain parameter bin, while black squares are fractions with respect to only emission-line galaxies. We find that the misaligned fraction peaks at and declines to both low and high mass end. This fraction also decreases monotonically with increasing SFR and sSFR. In essence, this is the dependence on the amount of pre-existing gas. Galaxies with higher star formation activity are expected to contain larger amount of pre-existing gas, which makes it difficult for the newly accreted gas to maintain misaligned angular momentum. The decline of this fraction at the low mass end is primarily due to the fact that the low mass galaxies with in the local universe are dominated by star-forming galaxies with higher sSFR. At the high mass end, the decrease of this fraction is consistent with Davis et al. (2011) and Jin et al. (2016). The low fraction of misalignment in the massive galaxies is suggested to be caused by galactic scale processes which suppress the accretion of external cold gas onto the galaxy, such as AGN feedback, existence of a hot X-ray gas halo, or a halo mass threshold.
3.3 Global properties of misaligned galaxies
3.3.1 Kinematic asymmetry
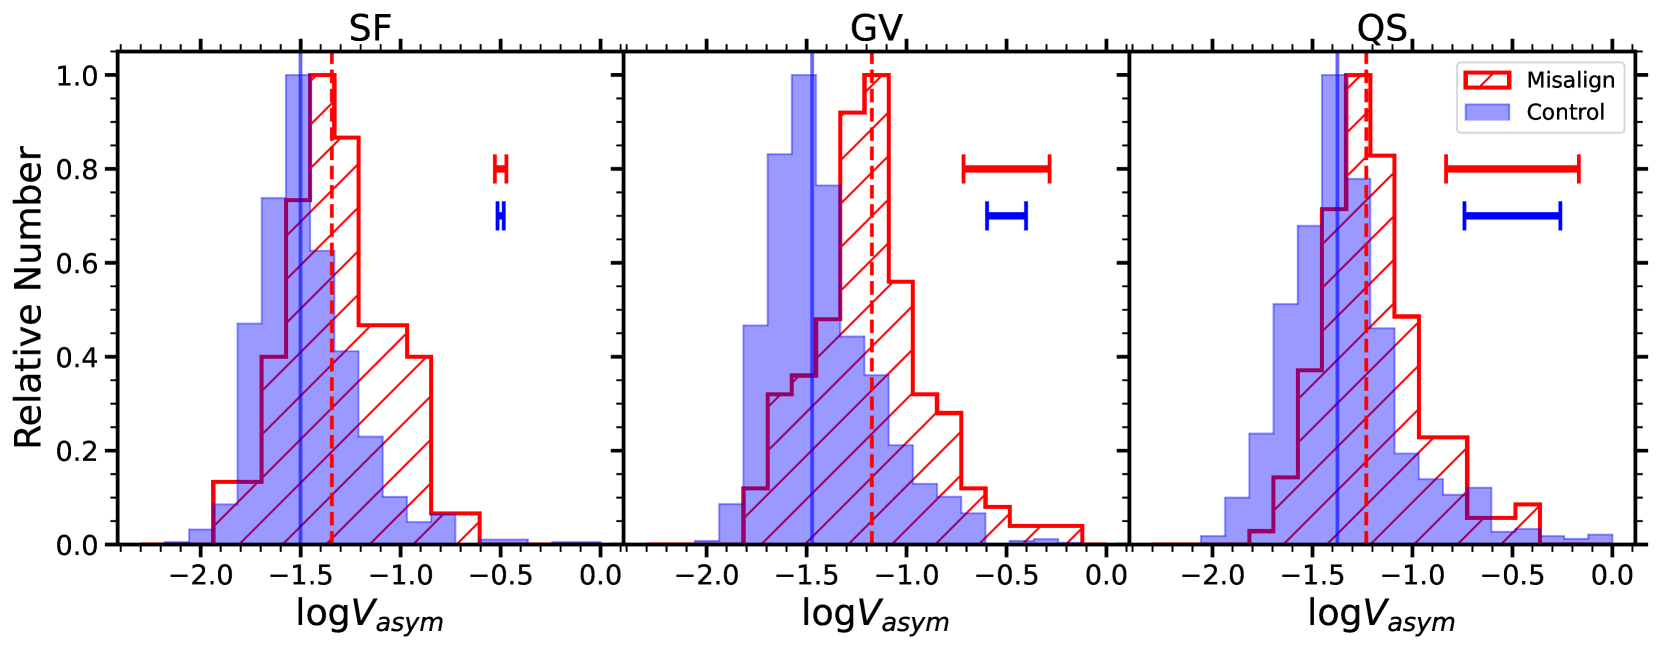
Considering that the misaligned galaxies have gone through gas accretion, external interaction or merging process, we would expect to find evidence of disturbance of gas velocity fields. In this section, we compare the asymmetry parameters () of gas velocity fields between misaligned galaxies and their control samples.
used in this work is defined exactly the same as Equation (2) in Feng et al. (2020) and basically calculates higher-order coefficients of Fourier components normalized by the first-order coefficient, where the higher-order coefficients describe the asymmetric pattern of the velocity fields and the first-order represents symmetric patterns of the velocity fields. Therefore higher value of means higher asymmetry. We refer readers to Feng et al. (2020) for more details of asymmetry parameter estimation.
Fig. 5 shows the distribution of kinematic asymmetry of gaseous component for the three galaxy types: SF (left), GV (middle) and QS (right). The red and blue histograms represent kinematically misaligned galaxies and their control samples, respectively. The peak of each distribution is set to 1. The dashed red and solid blue lines mark the median value of each distribution for misaligned galaxies and their controls, while the red and blue lines shown in top-right represent the median error of for misaligned galaxies and control samples respectively. The diagram shows that in SF and GV galaxies, the asymmetry of gas velocity fields is higher in misaligned galaxies than their control samples, which is totally consistent with our expectation that the acquisition of external gas would cause larger asymmetry in gaseous components of misaligned galaxies. For QS misaligned galaxies, we do not have definite conclusion due to the larger error, which can be attributed to the S/N of H flux.
3.3.2 Gaseous content
It is suggested that misaligned galaxies acquire gas from external environments, which would lead to higher amount of gas in misaligned galaxies. On the other hand, the interaction between the pre-existing and accreted gas will cause redistribution of angular momentum and gas inflow, resulting in a rapid transformation of gas into stars. This process is especially important in the SF misaligned galaxies, in which their star-formation activity within central 1kpc is several times higher than the average of local star-forming galaxies (Chen et al., 2016). From this point of view, the cold gas fraction could be lower in the misaligned galaxies since they are transformed into stars efficiently. We do not have cold gas observations for the sample. However, HI-MaNGA program provide GBT H i observation for a subsample. In this section, we compare the H i detection rate and molecular gas mass fraction estimated from dust extinction (Barrera-Ballesteros et al., 2018) between misaligned galaxies and their control samples.
HI-MaNGA is a follow-up program to detect H i for MaNGA galaxies using the Green Bank Telescope (GBT). The third data release of HI-MaNGA value-added catalogue contains 6,632 galaxies, where 3,358 of them are observed by GBT and the remaining galaxies are within ALFALFA catalogue (Haynes et al., 2018). The observation depth for GBT is about and velocity resolution is . We refer readers to Masters et al. (2019) & Stark et al. (2021) for more details about the HI-MaNGA project.
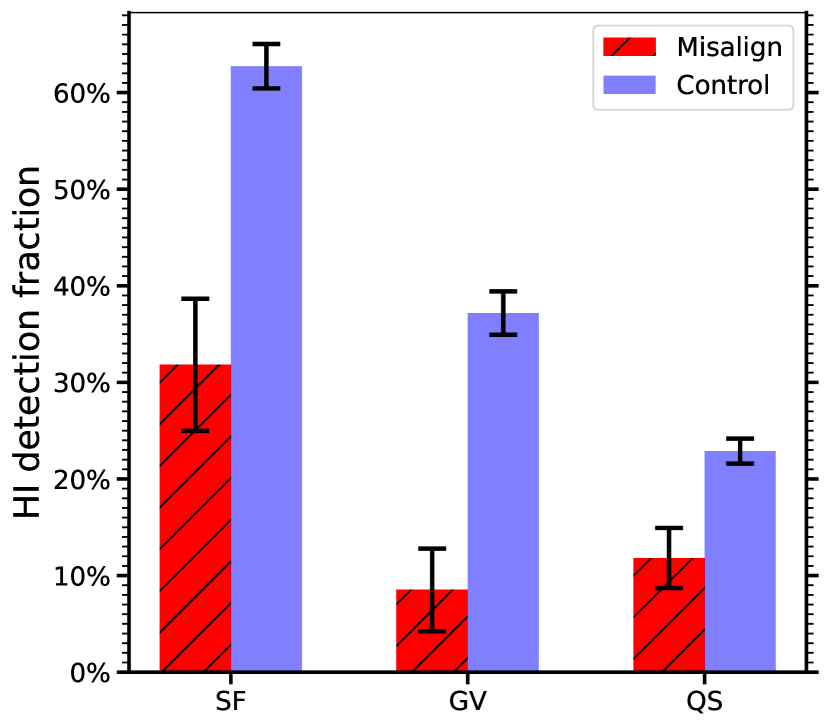
We cross-match the misaligned galaxies with HI-MaNGA value-added catalogue, finding 302 out of 416 matches and 90 of them are detected. Considering the beam size of GBT and ALFALFA is in the order of arcmin, the H i detection could be contaminated by nearby galaxies. Stark et al. (2021) flag potential confused sources which are located within 1.5 times the half-power beam width (HPBW) and at similar redshift of the primary target. They also estimate the probability where represents the fraction of contribution to the total measured flux from the companions. In this work, we remove 44 sources in which H i flux is contaminated by limiting confusion flag and (Stark et al., 2021). We build 10 control samples from H i-observed galaxies for the 258 () misaligned galaxies. The control samples are selected in a similar way as described in Section 2.3 but with an additional requirement: . Fig. 6 shows the H i-detection rate () for the misaligned galaxies and control samples, where is the number of galaxies matched in HI-MaNGA catalogue and is the number of galaxies detected in H i. Red histograms in Fig. 6 are for the misaligned sample and blue for their controls. It is clear that the H i-detection rate is significantly lower in misaligned galaxies than their controls for SF, GV and QS.
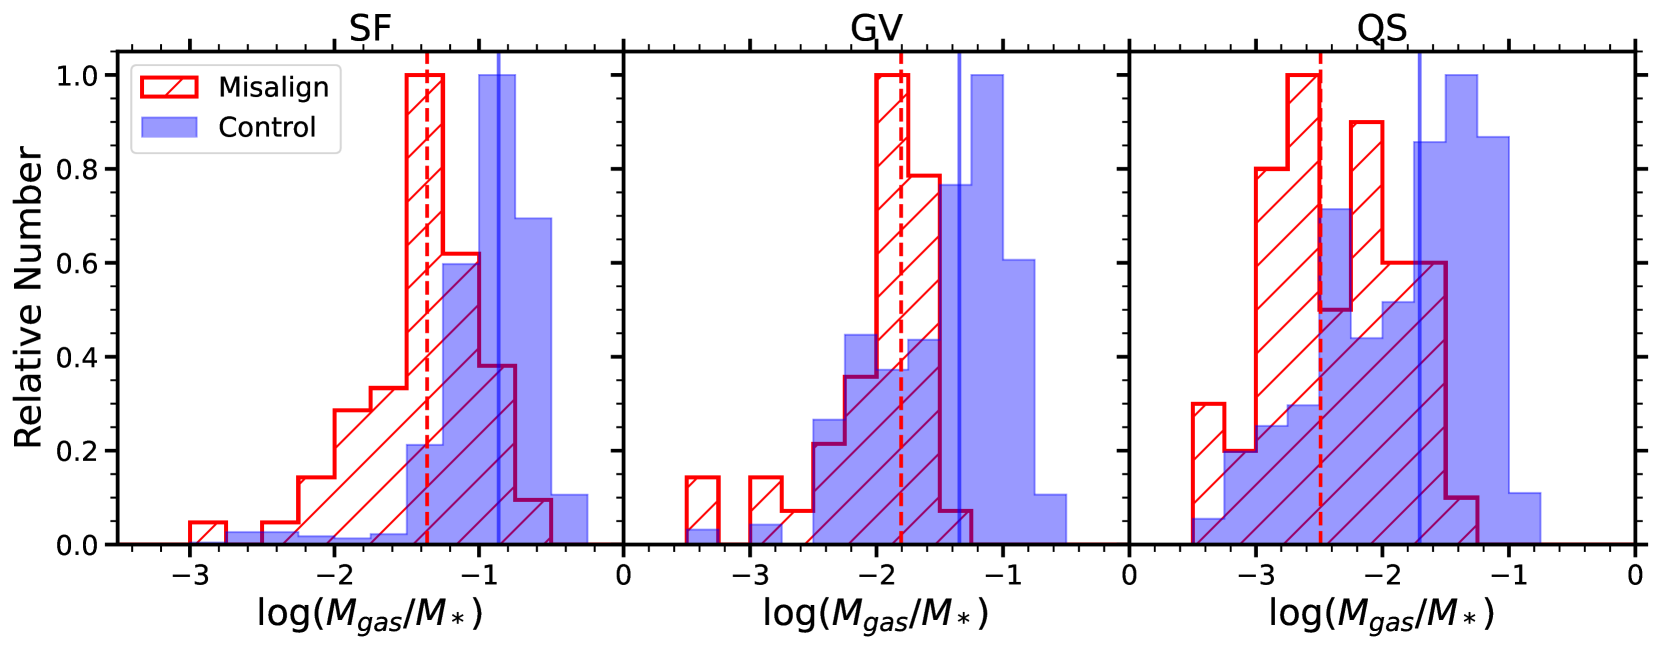
Considering that there are only 46 () H i-detected misaligned galaxies, this sample is hardly to give a robust statistics on H i mass distribution. We estimate the molecular gas mass based on the method described in Barrera-Ballesteros et al. (2018). The molecular gas mass is estimated as , where optical extinction is from the Balmer decrement. We construct 10 control samples with the same criteria as we construct control samples for H i-observed misaligned galaxies. Fig. 7 shows the distribution of molecular gas mass fraction defined as between misaligned galaxies (red) and control samples (blue). It is clear that misaligned galaxies have lower molecular gas mass fraction than the control samples.
A similar result is reported in Duckworth et al. (2020a) based on a sample of 4500 galaxies in MaNGA MPL-8, where the gas mass is estimated in exactly the same way. Based on IllustrisTNG simulation, Lu et al. (2021) show that low mass counter-rotating disc galaxies possess smaller H i mass fraction within twice the half stellar mass radius . The evidence of lower H i detection rate and molecular gas mass fraction in the SF and GV misaligned sample could be the consequence of high star-formation effieciency (). Based on the MaNGA survey, Chen et al. (2016) compare the star-formation activity parameter between SF counter-rotators and the average of local SF galaxies, where is the Hubble time at redshift and compares the current SFR and the past average. They show that the central star-formation activity of SF misaligned galaxies is several times higher than the average of local SF galaxies within central 1kpc. Based on a larger sample, Xu et al. (2022) discover that the central region of misaligned SF galaxies have higher sSFR in comparison with their control samples, and the misaligned galaxies shows smaller central indicating younger stellar populations in SF and GV misaligned galaxies. For the QS misaligned galaxies, the H i and molecular gas deficiency could be due to a selection bias that progenitors with lower gaseous contents are easier to show kinematic misalignments, since the lack of interaction between accreted and pre-existing gas.
3.3.3 Size
As suggested by Chen et al. (2016), gas-gas collision leads to fast gas inflow, triggering the central star formation. These newly formed stars may lead to the change of stellar light/mass distribution, especially for the gas-rich SF galaxies. In this section, we compare -band effective radius , which is defined as a radius containing 50% emission of a galaxy, between misaligned galaxies and their control samples.
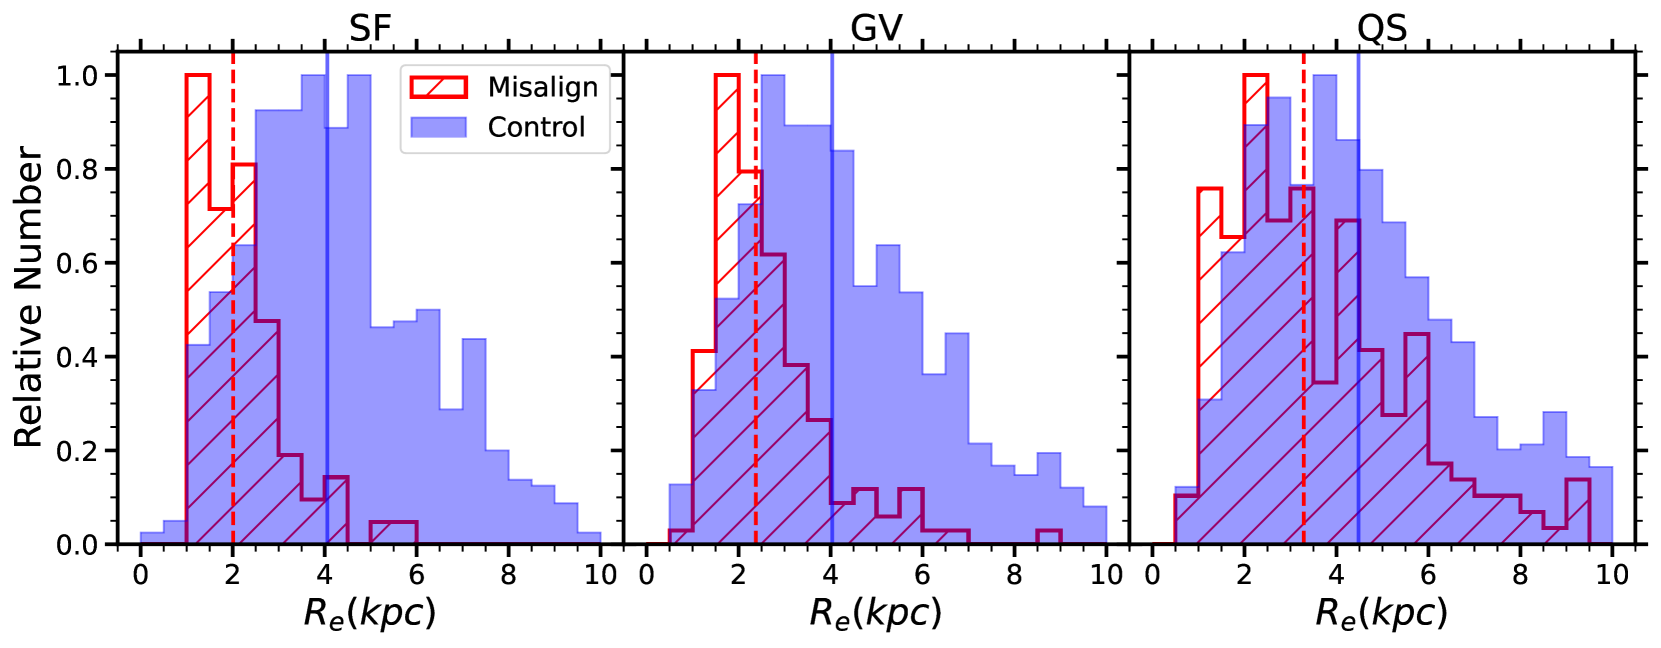
In this work, we take from NASA-Sloan Atlas (NSA)111http://nsatlas.org/ (Blanton et al., 2011) and convert it to physical scale in unit of kpc. Fig. 8 shows the distribution of for the misaligned galaxies (red) and control samples (blue). The red and blue vertical lines mark the median value of each distribution. There is a clear trend that misaligned galaxies have smaller than the control samples for all the three types of galaxies. It is about smaller for SF and GV misaligned galaxies than their controls and smaller for QS misaligned galaxies.
This result is within our expectation under the picture of angular momentum loss due to gas-gas collision for the SF galaxies, and then the in-falling gas gathers in the central region triggering star formation, which increases the brightness at the galaxy center. Since quantifies the radius at which half of light is emitted, the central star formation would be manifested as the decline of . Similar results are also found in simulation. Starkenburg et al. (2019) find that counter-rotating galaxies with have smaller half stellar mass radius compared to the whole sample with . Lu et al. (2021) discover the star-forming counter-rotators with also have smaller half stellar mass radius compared to normal disc galaxies. The difference in between GV misaligned galaxies and their controls indicates that similar process happen in GV galaxies. The difference in between QS misaligned galaxies and their controls is smaller, we will discuss this difference in Section 4.1.
3.3.4 Morphology
Galaxy morphology can be characterized by the Sérsic index. The surface brightness profile can be described as:
| (1) |
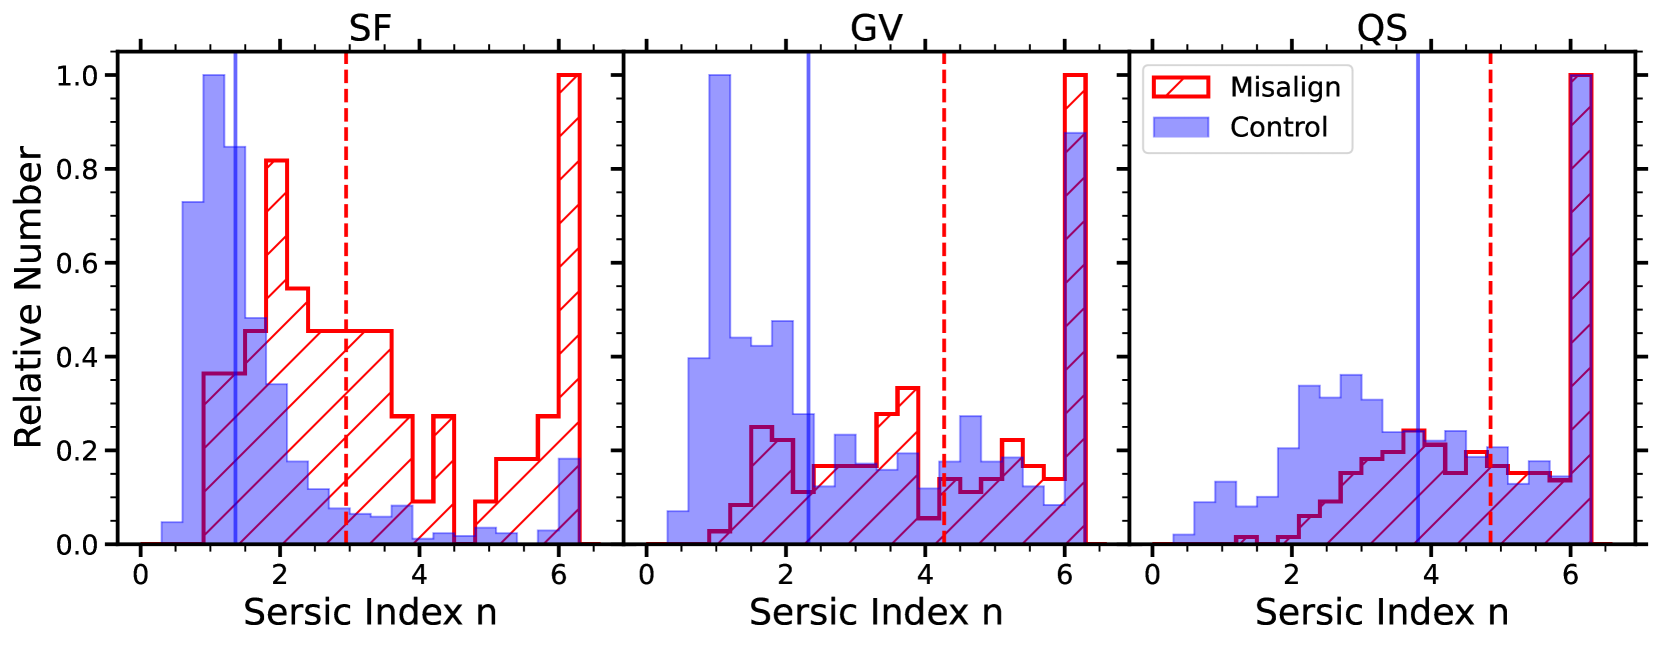
where is surface brightness at radius , is central surface brightness and is called Sérsic index. The case of is used as the demarcation for disc dominated versus bulge dominated galaxies. The value of Sérsic index for MaNGA galaxies is taken from the NASA-Sloan Atlas catalogue. Fig. 9 shows the distribution of Sérsic index for the misaligned galaxies (red) and their control samples (blue). The red and blue vertical lines mark the median value of each distribution.
For all the three types of galaxies, the misaligned galaxies show larger Sésic index than their control samples, with smallest difference in for QS galaxies. The median value for SF misaligned galaxies is , while the median value for control sample is less than 2, implying SF misaligned galaxies are more bulge dominated compared to the disc nature of their controls. The GV misaligned galaxies (median ) also show a more bulge dominated feature than controls (close to disc dominated, with median ). Both QS misaligned galaxies and their controls display bulge dominated feature with median of for misaligned galaxies is a little bit higher than controls. As suggested by Chen et al. (2016), for SF misaligned galaxies, the redistribution of angular momentum happens during the interaction between accreted and pre-existing gas, leading to gas inflow and central star formation. The central star-formation will alter the light distribution, leading to higher Sérsic index of SF misaligned galaxies. The higher Sérsic index of GV galaxies could be attributed to a similar process.
3.3.5 Spin parameter
Based on the picture described in the previous sections, the interaction between accreted and pre-existing gas will lead to the loss of angular momentum. The newly formed stellar components from the gas will have lower angular momentum. To explore the kinematic state of stellar component of a galaxy, we calculate the spin parameter as a proxy for the specific angular momentum of stars in the galaxy (Emsellem et al., 2007). This parameter is similar to but incorporates spatial information, which is defined as
| (2) |
where is the radius within which the summation has been taken place. , , are the -band flux, stellar velocity and stellar velocity dispersion of the th spaxel. is the distance between the th spaxel and the galaxy center.
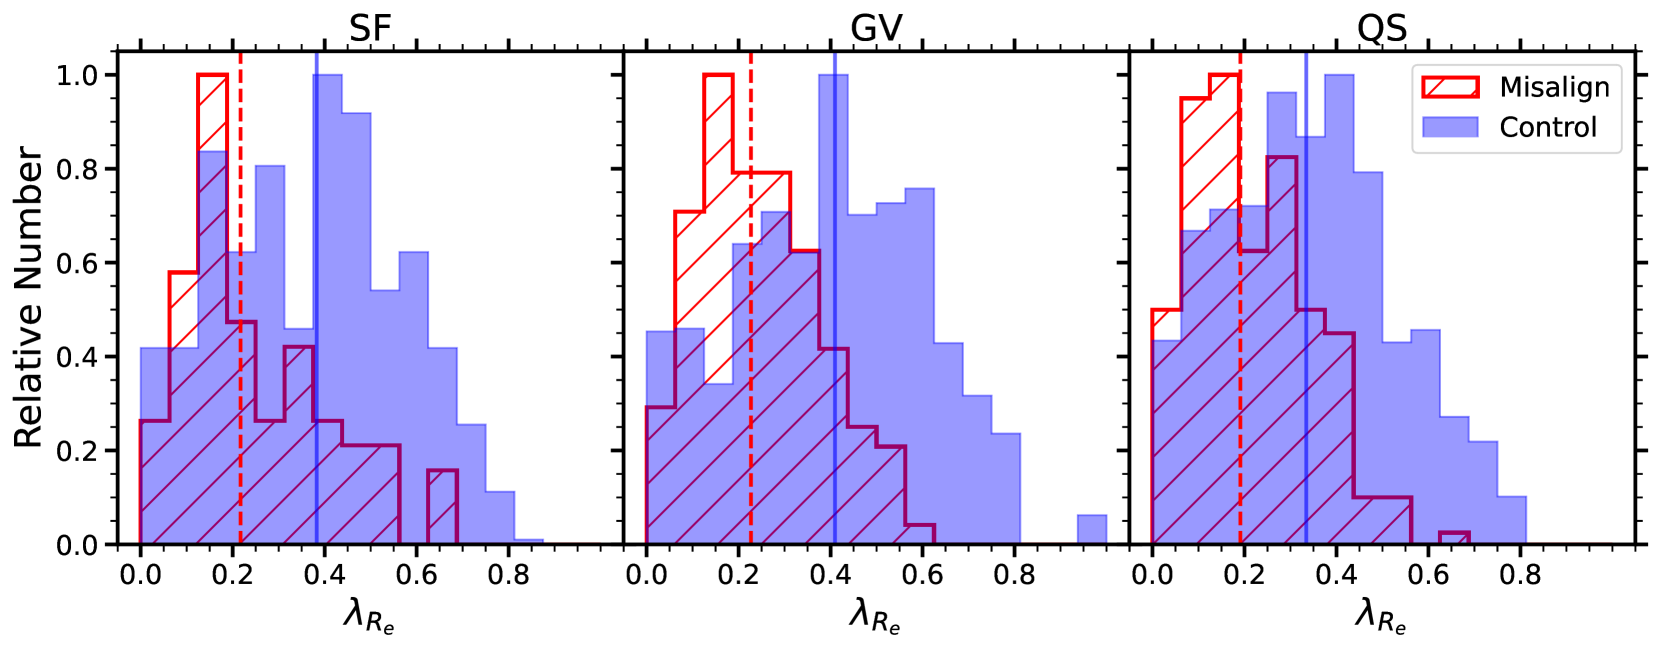
Fig. 10 show the distribution of for the stellar components between misaligned galaxies (red) and control samples (blue). The two vertical lines mark the median value of each distribution. As is a projected quantity, we add an additional control parameter inclination with . Clearly, all the three types of misaligned galaxies tend to rotate slower than the control samples. Similar results are reported in both observations and simulations. Duckworth et al. (2020a) find that misaligned galaxies with different morphological types in MaNGA survey are all have lower angular momentum in stellar components compared to their aligned counterparts, consistent with their results from IllustrisTNG simulation. Starkenburg et al. (2019) show that gas-star counter-rotating galaxies display smaller stellar spin compared to a whole sample with . For SF misaligned galaxies, the lower in misaligned galaxies is due to the loss of angular momentum during the interaction between accreted and pre-existing gas, leading to the newly formed stellar components with lower angular momentum. For GV misaligned galaxies, similar formation can be applied.
3.3.6 Environment
In the gas accretion scenario, we would expect the misaligned galaxies reside in environments which could provide the convenience for cold gas accretion. In dense environment, the gas stripping or halo heating mechanism may inhibit such process. From survey, Davis et al. (2011) show early-type galaxies in dense group and cluster are more likely displaying kinematic alignments between gas and stars, while misalignments tend to exist in field galaxies. Based on 66 misaligned galaxies with different star-formation types in MaNGA survey, Jin et al. (2016) show that they all reside in more isolated environment. With a 10 times larger sample size, we revisit the environmental dependence of different types of misaligned galaxies in this section. We compare the environmental parameters between misaligned galaxies and their control samples.
We use two parameters to characterize the environment of misaligned galaxies, the neighbour count (Nneigh) and the tidal strength parameter (). Nneigh is defined as the number of neighbours with -band absolute magnitude brighter than within line-of-sight velocity and projected distance in a volume limited sample with . The tidal strength parameter is a description of the total gravitational interaction strength by all the neighbours within a fixed volume. The estimation method is described in Argudo-Fernández et al. (2015) and the result is released in the GEMA-VAC catalogue. It is defined as:
| (3) |
where and are the stellar mass of the th galaxy and the primary galaxy. is the projected distance between the primary galaxy and the th neighbour with being the diameter of the primary galaxy.
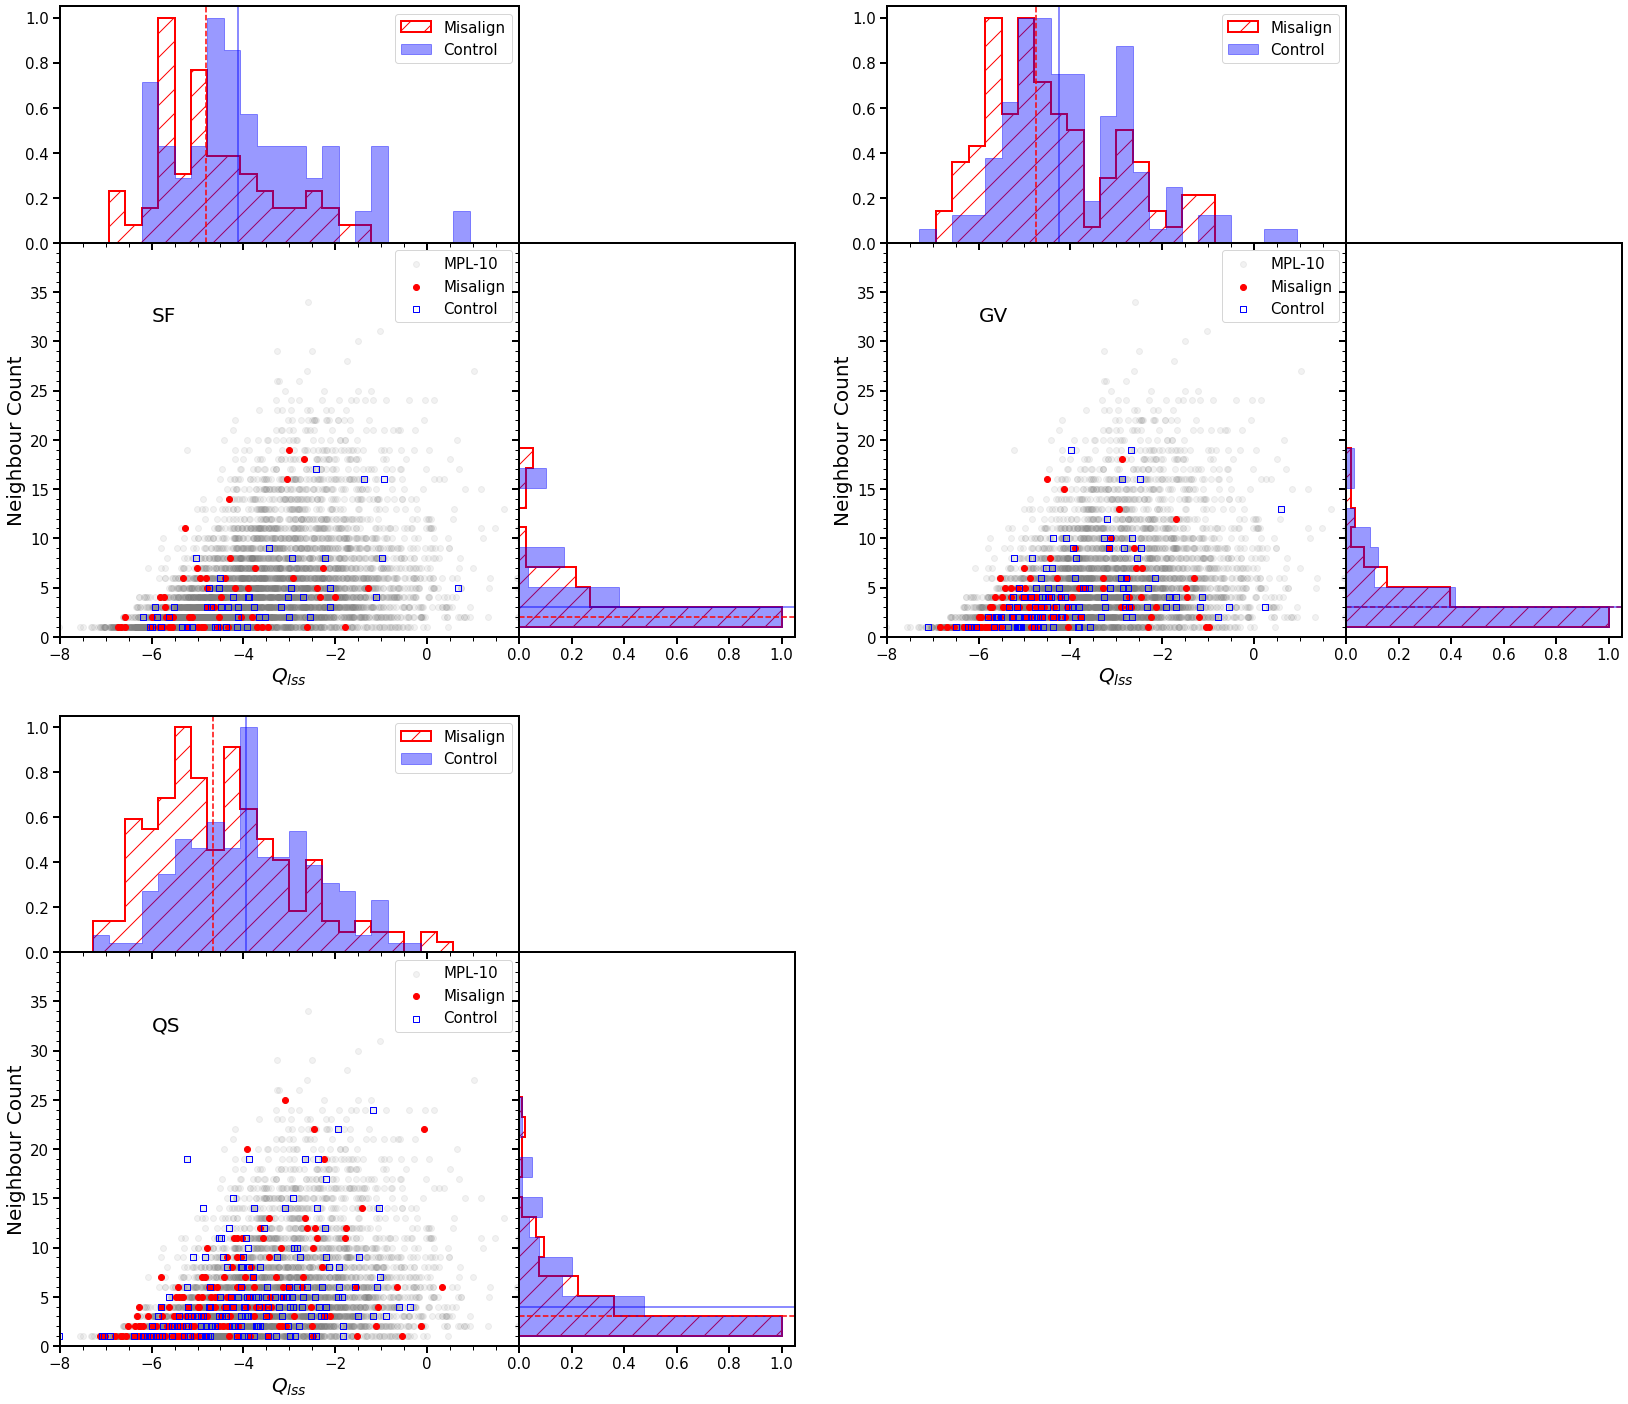
Fig. 11 shows Nneigh versus diagram for SF (top-left), GV (top-right) and QS (bottom-left) misaligned galaxies (red) and their control samples (blue). The top left and bottom right insets of each panel are the distribution of and Nneigh respectively. The two vertical lines mark the median value of each distribution.
As we can see from all the three types of galaxies, misaligned galaxies tend to reside in more isolated environment with lower value of than their control samples. Similar trend is also found in Nneigh, but with much less significance.
4 Discussion
4.1 Formation mechanisms of misaligned galaxies
It is believed that misaligned galaxies mainly form through external process, but the origin of external gas is still under debate. Galaxy interaction (Casanueva et al., 2021), major/minor merger (Khim et al., 2021) and gas accretion (Taylor et al., 2018; Starkenburg et al., 2019; Duckworth et al., 2020a; Duckworth et al., 2020b; Khoperskov et al., 2021) are all suggested to be the driver of kinematic misalignments.
In this work, we suggest different types of misaligned galaxies have undergone different formation mechanisms. For SF and GV misaligned galaxies, we propose a scenario that the progenitor galaxy accretes gas from gas-rich dwarf or cosmic web, followed by angular momentum redistribution through gas-gas interactions, leading to the star-formation in the central region. This toy model can naturally explain all of our observation results in section 3. On the one hand, a large amount of SF and GV misaligned galaxies show S0-like morphologies. Numerical simulation from Barnes (1992) suggest that merger, especially major merger could hardly keep the disk structure in spiral or S0 galaxies thus merger could not be a primary formation pathway for SF and GV misaligned galaxies. Casanueva et al. (2021) study galaxies with in EAGLE simulation, finding that contribution from mergers, including minor mergers, for the formation of misaligned galaxies is less than 5%. Therefore, gas accretion is a more preferred mechanism in the formation of kinematic misalignments in SF and GV galaxies. On the other hand, both SF and GV misaligned galaxies show lower (younger stellar population) and higher specific SFR in the central regions (Chen et al., 2016; Xu et al., 2022), indicating enhanced central star-formation activities.
We propose three possibilities to explain the origin of QS misaligned galaxies: (i) the QS misaligned galaxy is an evolutionary result of the GV misaligned galaxy. But this should not be the dominated formation mechanism because the number of GV misaligned galaxies is much less than their QS counterparts; (ii) mergers. Li et al. (2021) find that the fraction of galaxies with the merging remnant features is 18% in quiescent misaligned galaxies and 8% in their co-rotating counterparts, while the remnant fractions for misaligned star-forming galaxies and their co-rotating counterpart are almost identical. Khim et al. (2021) study galaxies with in Horizon-AGN simulation and point out the 35% misaligned galaxies form through major and minor mergers; (iii) misaligned gas accretion. The observed differences in Section 3 between misaligned QS galaxies and their controls could be due to selection bias. An old progenitor galaxy tends to have higher possibility to be more bulge dominated and contain less cold gas fraction. It is easier for them to be observed as misaligned galaxies because the interaction between accreted and pre-existing gas can be neglected.
If we assume every galaxy has the same chance to accrete external gas, a misaligned fraction of suggests that the kinematic misaligned phenomenon can last for Gyr timescale (). Based on the FIRE simulation, van de Voort et al. (2015) show that successive gas accretion can make the phenomenon of gas-star kinematic misalignments to last Gyr, which is totally consistent with our observations.
4.2 Lower gaseous content in misaligned galaxies
The misaligned galaxies show lower H i detection rate and molecular gas mass fraction. Similar results have been found for galaxies with different morphological types (ETGs, S0-Sas, Sb-Sd) in MaNGA survey (Duckworth et al., 2020a), also in simulations for galaxies with (Starkenburg et al., 2019), dynamically hot disc galaxies with (Lu et al., 2021).
One explanation for the lower gaseous content in SF and GV misaligned galaxies is that the cold gas is transformed into stars through higher star formation efficiency (). Using star-formation activity parameter , Chen et al. (2016) show SF counter-rotators have several times higher star-formation activity in the central region compared to the average of local SF galaxies. Based on a larger sample, Xu et al. (2022) show that the SF misaligned galaxies have higher sSFR and lower (younger stellar population) in the central region than the control samples. Both Chen et al. (2016) and Xu et al. (2022) describe a picture that the interaction between the pre-existing gas and the accreted gas leads to the angular momentum loss of gas. Thus the gas falls to the central region and triggers the star-burst/star-formation. The observed global properties in Section 3, such as higher Sérsic index, smaller , lower spin parameter , can naturally fit into this picture for the SF and GV misaligned galaxies.
Based on the Illustris simulation, Starkenburg et al. (2019) and Duckworth et al. (2020a); Duckworth et al. (2020b) propose the low gaseous content for misaligned galaxies is due to gas loss from AGN feedback and flyby through group or cluster. Starkenburg et al. (2019) discover 73% galaxies show BH activity or flyby through a massive system like group or cluster within 1 Gyr before emergence of counter-rotation (). Duckworth et al. (2020a) find that no gas rotation galaxies (NGR galaxies, which cannot fit position angle for H velocity fields due to gas depletion or dispersion dominated feature) and misaligned galaxies have similar stellar spin parameter (), which is lower than aligned galaxies, suggesting the progenitor galaxies experience gas removal (stage of no gas) and then re-accretion (stage of misalignment). Duckworth et al. (2020b) show misaligned galaxies with have boosted AGN luminosity, which leads to outflows and gas removal.
However, the gas removal scenario faces difficulties in explaining the enhanced central star formation and the global properties like smaller , lower spin parameter, higher Sérsic index observed in this work. On the other hand, Khoperskov et al. (2021) study 25 star-star counter-rotating galaxies with in IllustrisTNG, finding that they all display gas-star misalignments due to gas accretion but without sudden gas loss by AGN feedback. We prefer the scenario that interaction between pre-existing and accreted gas triggers gas inflow, leading to enhanced central star formation and also fuelling the black hole, therefore displaying higher incidence of AGNs and boosted BH luminosity in misaligned galaxies than their controls. Both the activities of central BH and star-formation consume the cold gas, leading to lower cold gas content compared to their aligned counterparts.
For QS misaligned galaxies, the lower gaseous contents can be due to a selection bias, since progenitors with lower gas fraction would be easier to show kinematic misalignments.
4.3 Beam smearing and inclination correction of
Fig. 10 shows a large amount of SF misaligned galaxies with , indicating that they could be slow rotators. This result is totally out of our expectation. On the one hand, galaxies with higher Sérsic index and smaller suffer larger beam smearing effect (Harborne et al., 2020), leading to a lower estimation. On the other hand, as is a projected identity, the inclination will affect our measurement to a lower value. In this section, we check how the beam smearing and inclination effect influence our results on .
We correct the beam smearing effect based on Eqn. (16) and Eqn. (18) in Harborne et al. (2020). They provide the corrections of for galaxies with different and Sérsic index using a series of mock observations, where is the point spread function (PSF) of the observation. For SF galaxies, we adopt the inclination correction method described in Fraser-McKelvie et al. (2021). The inclination correction assumes that the intrinsic axial ratio is and the anisotropy parameter is for an edge-on disc galaxy, since SF galaxies are dominated by disc galaxies. The deprojected satisfies
| (4) |
where , and is the observed axial ratio.
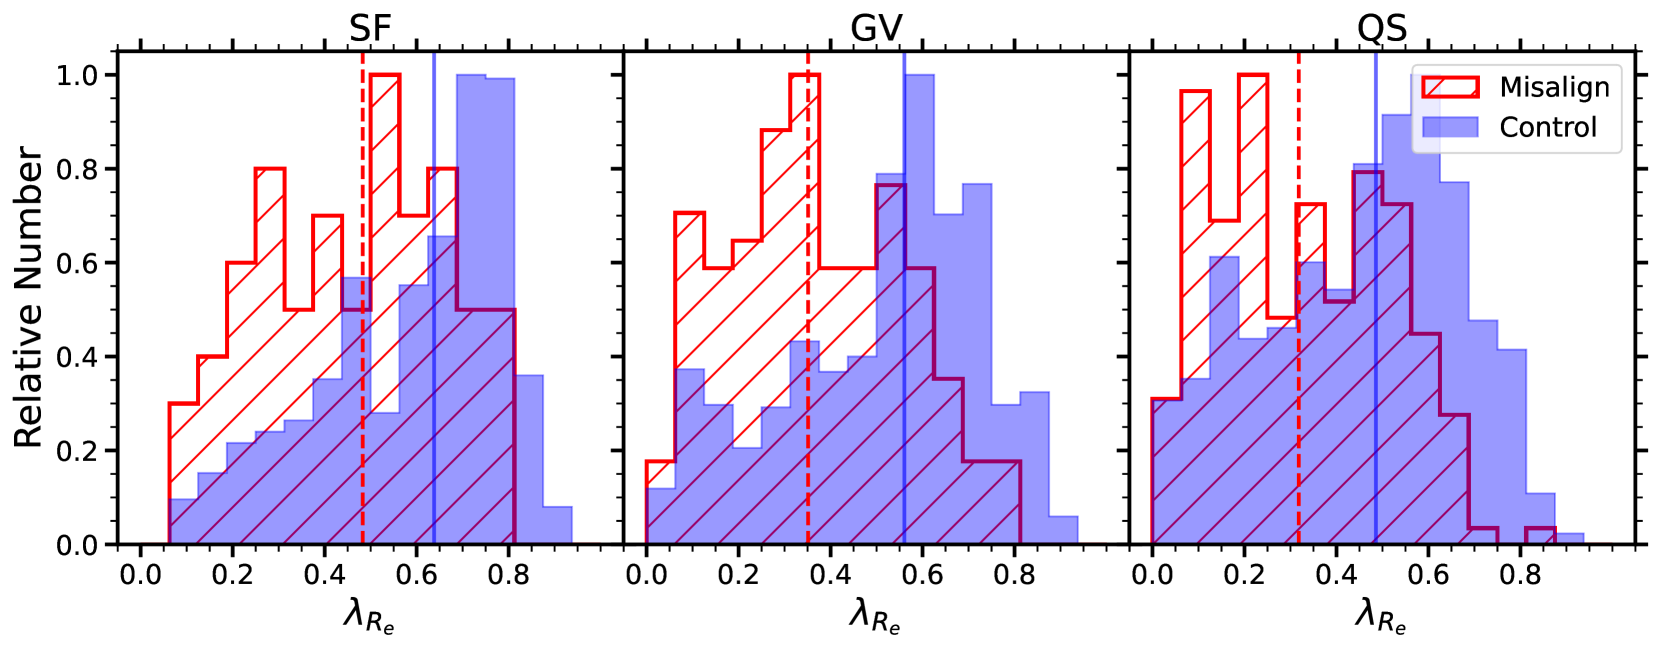
Before any correction is applied, Fig. 3 of Fraser-McKelvie et al. (2021) shows the of SF galaxies ranges from 0.3 to 0.5 depending on their locations on the SF main-sequence. A median value of for our SF control samples is consistent with Fraser-McKelvie’s result. Once the beam smearing and inclination corrections are applied, the median value of in SF control sample increases to 0.6 as shown in Fig. 12, which is totally consistent with Fraser-McKelvie’s result. The of misaligned galaxies are smaller than their control samples in all the three galaxy types (SF, GV and QS), suggesting our conclusions remain unchanged.
5 Conclusions
We identify 456 gas-star kinematically misaligned galaxies from MPL-10 of MaNGA survey. We cross-match them with Chang’s catalogue to obtain the global and SFR measurements, identifying 74 star-forming, 136 green-valley and 206 quiescent galaxies. We find that distribution has three local peaks around , and . The misaligned fraction peaks at and declines to both low and high mass end. This fraction decreases monotonically with increasing SFR and sSFR. Through comparing the physical properties between misaligned galaxies and their control samples, we find that:
i) For SF and GV galaxies, the asymmetry of gas velocity fields is higher in misaligned galaxies than their control samples.
ii) The H i-detection rate is lower in misaligned galaxies than their control samples in all the three types. The estimated molecular gas fraction based on the optical extinction is also lower for misaligned galaxies.
iii) Misaligned galaxies are smaller in effective radius for all the three types of galaxies. It is about smaller for SF and GV misaligned galaxies than their controls, while it is smaller for QS misaligned galaxies.
iv) Misaligned galaxies in all the three types show larger Sérsic index than their control samples, with the smallest difference in for QS galaxies. The median for SF misaligned galaxies is , while the median value for control sample is less than 2. The GV misaligned galaxies (median ) also show a more bulge dominated feature than controls (close to disc dominated, with median ). Both QS misaligned galaxies and their controls display bulge dominated feature with the smallest difference in Sérsic index.
v) All the three types of misaligned galaxies have lower spin parameters of stellar components compared to the control samples.
vi) Misaligned galaxies in all the three types have lower tidal strength parameter () and similar trend is also found in neighbour count (Nneigh) with much less significance, suggesting that they tend to reside in more isolated environment.
Combining those observational results, we suggest that misaligned SF and GV galaxies form through gas accretion. The angular momentum experiences redistribution during the interaction between pre-existing and misaligned accreted gas, leading to gas inflow to the center which triggers central star formation. We propose three possible origins of the misaligned QS galaxies: (1) external gas accretion; (2) merger; (3) GV galaxies evolve into QS galaxies.
Acknowledgements
We thank the anonymous referee for the valuable comments which greatly improve the paper. Y.M.C. acknowledges support from the National Key R&D Program of China (No. 2017YFA0402700), the National Natural Science Foundation of China (NSFC grants 11573013, 11733002, 11922302), the China Manned Space Project with NO.CMS-CSST-2021-A05. DB is partly support by grant RSCF 22-12-00080.
Funding for the Sloan Digital Sky Survey IV has been provided by the Alfred P. Sloan Foundation, the U.S. Department of Energy Office of Science, and the Participating Institutions.
SDSS-IV acknowledges support and resources from the Center for High Performance Computing at the University of Utah. The SDSS website is www.sdss.org.
SDSS-IV is managed by the Astrophysical Research Consortium for the Participating Institutions of the SDSS Collaboration including the Brazilian Participation Group, the Carnegie Institution for Science, Carnegie Mellon University, Center for Astrophysics | Harvard & Smithsonian, the Chilean Participation Group, the French Participation Group, Instituto de Astrofísica de Canarias, The Johns Hopkins University, Kavli Institute for the Physics and Mathematics of the Universe (IPMU) / University of Tokyo, the Korean Participation Group, Lawrence Berkeley National Laboratory, Leibniz Institut für Astrophysik Potsdam (AIP), Max-Planck-Institut für Astronomie (MPIA Heidelberg), Max-Planck-Institut für Astrophysik (MPA Garching), Max-Planck-Institut für Extraterrestrische Physik (MPE), National Astronomical Observatories of China, New Mexico State University, New York University, University of Notre Dame, Observatário Nacional / MCTI, The Ohio State University, Pennsylvania State University, Shanghai Astronomical Observatory, United Kingdom Participation Group, Universidad Nacional Autónoma de México, University of Arizona, University of Colorado Boulder, University of Oxford, University of Portsmouth, University of Utah, University of Virginia, University of Washington, University of Wisconsin, Vanderbilt University, and Yale University.
Data Availability
The data underlying this article will be shared on reasonable request to the corresponding author.
References
- Argudo-Fernández et al. (2015) Argudo-Fernández M., et al., 2015, A&A, 578, A110
- Barnes (1992) Barnes J. E., 1992, ApJ, 393, 484
- Barrera-Ballesteros et al. (2014) Barrera-Ballesteros J. K., et al., 2014, A&A, 568, A70
- Barrera-Ballesteros et al. (2015) Barrera-Ballesteros J. K., et al., 2015, A&A, 582, A21
- Barrera-Ballesteros et al. (2018) Barrera-Ballesteros J. K., et al., 2018, ApJ, 852, 74
- Bassett et al. (2017) Bassett R., Bekki K., Cortese L., Couch W., 2017, MNRAS, 471, 1892
- Bertola et al. (1992) Bertola F., Buson L. M., Zeilinger W. W., 1992, ApJ, 401, L79
- Blanton et al. (2011) Blanton M. R., Kazin E., Muna D., Weaver B. A., Price-Whelan A., 2011, AJ, 142, 31
- Blanton et al. (2017) Blanton M. R., et al., 2017, AJ, 154, 28
- Bryant et al. (2019) Bryant J. J., et al., 2019, MNRAS, 483, 458
- Bundy et al. (2015) Bundy K., et al., 2015, ApJ, 798, 7
- Cappellari & Emsellem (2004) Cappellari M., Emsellem E., 2004, PASP, 116, 138
- Casanueva et al. (2021) Casanueva C. I., Lagos C. d. P., Padilla N. D., Davison T. A., 2021, arXiv e-prints, p. arXiv:2110.00408
- Chabrier (2003) Chabrier G., 2003, PASP, 115, 763
- Chang et al. (2015) Chang Y.-Y., van der Wel A., da Cunha E., Rix H.-W., 2015, ApJS, 219, 8
- Chen et al. (2016) Chen Y.-M., et al., 2016, Nature Communications, 7, 13269
- Davis et al. (2011) Davis T. A., et al., 2011, MNRAS, 417, 882
- Drory et al. (2015) Drory N., et al., 2015, AJ, 149, 77
- Duckworth et al. (2020a) Duckworth C., Tojeiro R., Kraljic K., 2020a, MNRAS, 492, 1869
- Duckworth et al. (2020b) Duckworth C., Starkenburg T. K., Genel S., Davis T. A., Habouzit M., Kraljic K., Tojeiro R., 2020b, MNRAS, 495, 4542
- Emsellem et al. (2007) Emsellem E., et al., 2007, MNRAS, 379, 401
- Feng et al. (2020) Feng S., Shen S.-Y., Yuan F.-T., Riffel R. A., Pan K., 2020, ApJ, 892, L20
- Fraser-McKelvie et al. (2021) Fraser-McKelvie A., et al., 2021, MNRAS, 503, 4992
- Galletta (1987) Galletta G., 1987, ApJ, 318, 531
- Gunn et al. (2006) Gunn J. E., et al., 2006, AJ, 131, 2332
- Harborne et al. (2020) Harborne K. E., van de Sande J., Cortese L., Power C., Robotham A. S. G., Lagos C. D. P., Croom S., 2020, MNRAS, 497, 2018
- Haynes et al. (2018) Haynes M. P., et al., 2018, ApJ, 861, 49
- Jin et al. (2016) Jin Y., et al., 2016, MNRAS, 463, 913
- Kannappan & Fabricant (2001) Kannappan S. J., Fabricant D. G., 2001, AJ, 121, 140
- Khim et al. (2021) Khim D. J., Yi S. K., Pichon C., Dubois Y., Devriendt J., Choi H., Bryant J. J., Croom S. M., 2021, ApJS, 254, 27
- Khoperskov et al. (2021) Khoperskov S., et al., 2021, MNRAS, 500, 3870
- Krajnović et al. (2006) Krajnović D., Cappellari M., de Zeeuw P. T., Copin Y., 2006, MNRAS, 366, 787
- Kuijken et al. (1996) Kuijken K., Fisher D., Merrifield M. R., 1996, MNRAS, 283, 543
- Law et al. (2015) Law D. R., et al., 2015, AJ, 150, 19
- Law et al. (2016) Law D. R., et al., 2016, AJ, 152, 83
- Li et al. (2021) Li S.-l., et al., 2021, MNRAS, 501, 14
- Lu et al. (2021) Lu S., et al., 2021, MNRAS, 503, 726
- Masters et al. (2019) Masters K. L., et al., 2019, MNRAS, 488, 3396
- Sarzi et al. (2006) Sarzi M., et al., 2006, MNRAS, 366, 1151
- Smee et al. (2013) Smee S. A., et al., 2013, AJ, 146, 32
- Stark et al. (2021) Stark D. V., et al., 2021, MNRAS, 503, 1345
- Starkenburg et al. (2019) Starkenburg T. K., Sales L. V., Genel S., Manzano-King C., Canalizo G., Hernquist L., 2019, ApJ, 878, 143
- Taylor et al. (2018) Taylor P., Federrath C., Kobayashi C., 2018, MNRAS, 479, 141
- Wake et al. (2017) Wake D. A., et al., 2017, AJ, 154, 86
- Westfall et al. (2019) Westfall K. B., et al., 2019, AJ, 158, 231
- Xu et al. (2022) Xu H., et al., 2022, MNRAS, 511, 4685
- Yan et al. (2016a) Yan R., et al., 2016a, AJ, 151, 8
- Yan et al. (2016b) Yan R., et al., 2016b, AJ, 152, 197
- Yan et al. (2019) Yan R., et al., 2019, ApJ, 883, 175
- van de Voort et al. (2015) van de Voort F., Davis T. A., Kereš D., Quataert E., Faucher-Giguère C.-A., Hopkins P. F., 2015, MNRAS, 451, 3269