Behavioral changes during the pandemic worsened income diversity of urban encounters
Abstract
Diversity of physical encounters and social interactions in urban environments are known to spur economic productivity and innovation in cities, while also to foster social capital and resilience of communities. However, mobility restrictions during the pandemic have forced people to substantially reduce urban physical encounters, raising questions on the social implications of such behavioral changes. In this paper, we study how the income diversity of urban encounters have changed during different periods throughout the pandemic, using a large-scale, privacy-enhanced mobility dataset of more than one million anonymized mobile phone users in four large US cities, collected across three years spanning before and during the pandemic. We find that the diversity of urban encounters have substantially decreased (by % to %) during the pandemic and has persisted through late 2021, even though aggregated mobility metrics have recovered to pre-pandemic levels. Counterfactual analyses show that while the reduction of outside activities (higher rates of staying at home) was a major factor that contributed to decreased diversity in the early stages of the pandemic, behavioral changes including lower willingness to explore new places and changes in visitation preferences further worsened the long-term diversity of encounters. Our findings suggest that the pandemic could have long-lasting negative effects on urban income diversity, and provide implications for managing the trade-off between the stringency of COVID-19 policies and the diversity of urban encounters as we move beyond the pandemic.
Introduction
Cities are the central drivers of economic productivity and innovation owing to its capacity to foster dense social connections through physical encounters [1, 2, 3]. Among the various characteristics of social connections and network structures, empirical studies have shown that the diversity of networks are significant predictors of economic growth and recovery [4, 5]. Moreover, integrated community networks and the inherent social capital have been shown to be crucial for resilience to shocks such as natural hazards [6, 7]. The lack of community support could lead to inequitable access to urban amenities and services, ultimately affecting social, economic, and health outcomes of people living in urban areas [8]. However, in addition to rising inequality and segregation [9], the COVID-19 pandemic and the consequential countermeasures including mobility restrictions have posed significant challenges for maintaining both the quantity and quality of such physical encounters in cities.
Large scale location data (e.g., CDRs[10, 11], credit card data [12], and social media [13]) have been used to understand the nature of physical encounters of people in cities [14, 15]. Recently, such mobility datasets have been used to measure and understand the diversity of encounters in cities, by measuring the homophily of co-locations at points-of-interest (POIs) during daily routines. A study using mobile phone data in 10 American cites revealed that peoples’ mobility behavior, as opposed to their residential locations, account for % of urban segregation (which is an inverse metric of diversity) [16]. Another study using Foursquare data revealed that people mostly visit places in their own socioeconomic class, occasionally visiting venues from higher classes [17]. Compared to analysis limited to quantifying static residential segregation measures using census data [18], such studies based on mobility data have provided a more comprehensive understanding of income segregation in urban environments.
Various non-pharmaceutical interventions imposed by governments and agencies have enforced people to substantially change their lifestyles and reduce daily activity patterns, reducing trips to urban amenities such as restaurants, bars, and entertainment establishments [19]. While such behavior changes have had significant impacts on our physical health and activities [20, 21] and mental wellbeing [22], studies have also suggested their impact on social encounters in urban environments, affecting the social fabric of cities we live in [23]. The aftermath of the pandemic has brought also significant changes in behavior in our cities, including less use of public transportation [24], more hours working from home [25], and higher usage of online food and goods delivery services [26]. Despite the rich literature on the mobility dynamics and its impact on disease spread using location data collected via mobile phones [27, 28], little is understood on how much longitudinal effects the pandemic has had on the quantity and quality of our encounters in urban environments. Measuring the dynamics and potential causes of fluctuations in the diversity of urban encounters across different periods of the pandemic could be valuable in understanding the long-term impacts of the pandemic on cities, and for developing resilient policies to better prepare for future outbreaks.
Results
Using a large and longitudinal dataset of individual GPS location records in four major metropolitan areas in the US across more than three years, we analyze how experienced income diversity of urban encounters have changed during different periods of the COVID-19 pandemic. Specifically, we analyze the dynamics of income diversity of encounters at the level of individual places (points-of-interest; POIs) and individual users in cities. We seek to identify behavioral changes that were at the cause of such long-term changes, and we further unravel the sociodemographic, economic, and behavioral characteristics that explain the spatial heterogeneity in decreased diversity. Mobility data was provided by Spectus, who supplied anonymized, privacy-enhanced, and high-resolution mobile location pings for more than 1 million devices across four U.S. census core-based statistical areas (CBSAs) (Supplementary Table S2). All devices within the study opted-in to anonymized data collection for research purposes under a GDPR and CCPA compliant framework. Post-stratification techniques were implemented to ensure the representativeness of the data across regions and income levels (Supplementary Note 2 and Supplementary Figure S6). Our second data source is a collection of 433K verified places across four CBSAs, obtained via the Foursquare API (Supplementary Table S1). Robustness of the results on income diversity against the choice of places dataset was checked using the ReferenceUSA Business Historical Data [29] (Supplementary Note 1.3 and Supplementary Figure S2).
To analyze the income diversity of urban encounters, each anonymized individual user in the dataset was assigned a socio-economic status (SES) proxy, estimated from their home census block group (CBG) (Supplementary Note 1.4 and Supplementary Figure S3). The approximate home area of each individual user was estimated by Spectus at the granularity of CBGs using their most common location during the nighttime, between 10 p.m. and 6 a.m. every week. Individuals were then categorized into four equally sized SES quantiles according to the median household income of their home CBG. The results on decreased income diversity were robust against the number of quantile categories used (Supplementary Note 1.4 and Supplementary Figure S4). Only users who were observed more than 300 minutes each day were used for the analysis to remove users with substantial missing data. Stays (stops) longer than 10 minutes and shorter than 4 hours were then extracted from the dataset, and each stay was spatially matched with the closest place locations within 100 meters to infer stays at specific POIs. The results on income diversity were robust against the choice of data filtering parameters (Supplementary Note 1.5 and Supplementary Figure S5) and spatial threshold parameters for visit attribution (Supplementary Note 1.2 and Supplementary Figure S1).
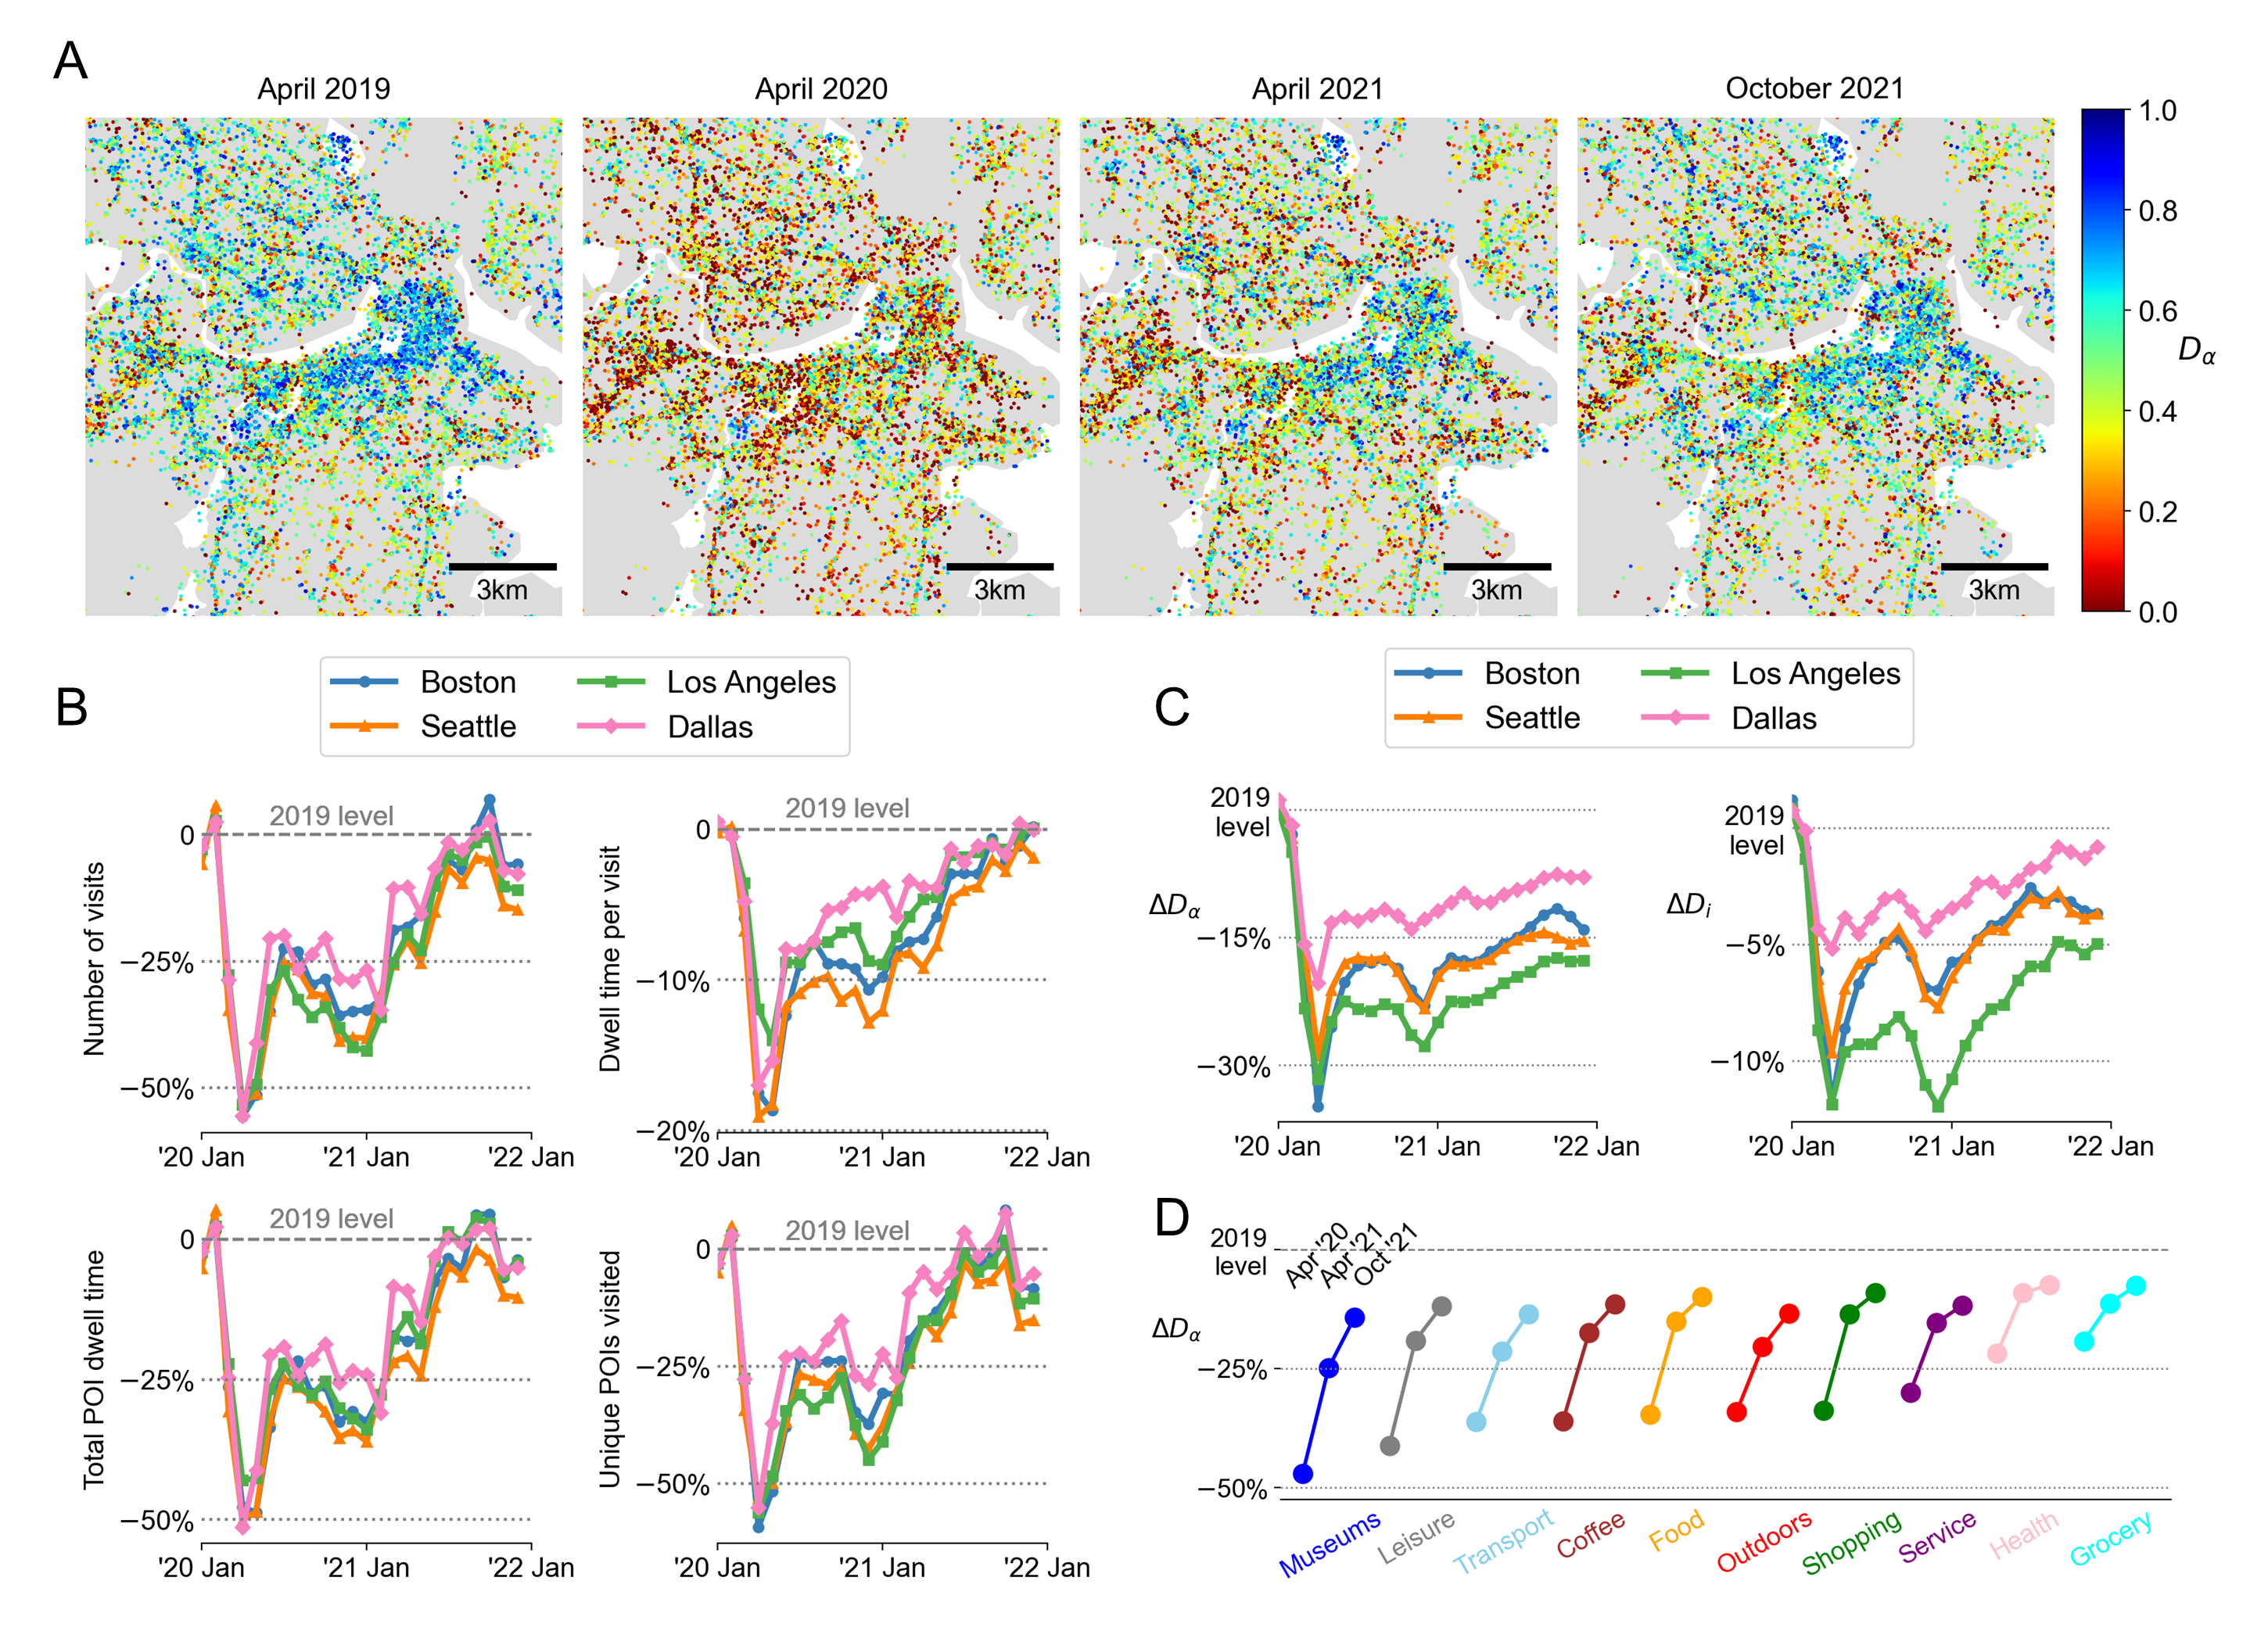
Given the estimated SES quantiles of individual users and the visited POIs, we measured the income diversity at each place (denoted as ) and experienced by each individual (denoted as ). measures the evenness of the time spent by people from different income quantiles at each place, and measures the evenness of time spent with people from different income quantiles for each individual (see Methods and Supplementary Notes 3.1 and 3.2). For places, when the place is fully diverse, with 25% of time spent by people from each of the four income quantiles, and when the place is visited by members of only a single income quantile. Similarly, to calculate the diversity of individuals , we measure the exposure of the individual to each income quantile across all the places the individual has visited. The robustness of the results to the choice of diversity metric was tested (Supplementary Note 3.3 and Figure S12). The diversity measures were computed for each 2-month moving window to ensure sufficient number of visits to POIs, and were de-seasonalized using monthly trends observed in 2019. The panels in Figure 1A show how income diversity at places around the Boston and Cambridge area substantially decreased during the first wave of the pandemic. The diversity of encounters gradually recovers, however, not fully even after more than 1 and a half years from the lockdown, in October 2021. Similar patterns can be observed in all three other cities in the study (Supplementary Figure S7). The maps highlight the significant spatial heterogeneity of income diversity (e.g., Back Bay area is more diverse compared to the suburban areas), which is further investigated in the later sections.
Diversity of urban encounters have decreased during the pandemic
The pandemic substantially changed people’s mobility patterns in the early waves, as documented in previous studies using mobility data (e.g., [30]). However, several individual mobility metrics indicate that individual based mobility patterns have returned back to pre-pandemic levels by late 2021. Figure 1B shows monthly average values of several individual mobility metrics across the two years in 2020 and 2021. Mobility metrics, more specifically the daily number of visits per individual, daily amount of time spent at POIs per individual, average dwell time spent per visit, and number of visited unique POIs per individual, have all returned back to pre-pandemic levels (annotated by horizontal dashed lines) by late 2021 in all four CBSAs. The drop in the rate of visits to POIs as well as the duration of visits to POIs during the earlier stages of the pandemic agree with the findings in previous studies [31], however our analysis extends the analysis to two years into the pandemic and confirms how activity patterns have recovered back to pre-pandemic levels by October 2021. The mobility data confirms that people have resumed spending time outside their homes and visiting different POIs, similar to before the pandemic.
Given the recovery of aggregate mobility metrics, one could expect the income diversity of encounters to also return back to pre-pandemic levels by late 2021. However, as shown in Figure 1C, income diversity experienced at places and by individuals are consistently lower than the pre-pandemic levels for all four cities even after 2 years into the pandemic. Absolute values of and are shown in the Supplementary Figure S10. Cities experience the most decrease of diversity in April 2020, % lower than pre-pandemic levels during the lockdown. A second peak in the loss of diversity is observed in late 2020, which corresponds to the increase in cases due to the first SARS-CoV-2 variant. Despite the recovery of individual mobility metrics, income diversity of encounters is still around % less than pre-pandemic levels even by late 2021. The decrease in income diversity was robust to the choice of diversity metrics, such as the entropy of income quantiles for encounters at places and for individuals (Supplementary Note 3.3 and Supplementary Figures S11 and S12).
Dissecting the place-based diversity results into POI categories, we further observe that diversity in places in Boston decreased in all POI categories both on the short-term (e.g., April 2020) and long-term (e.g., October 2021) in Figure 1D and Supplementary Figure S9. Especially, ‘Museums’, ‘Leisure’, ‘Transportation’, and ‘Coffee’ places had the largest decrease in diversity, while ‘Grocery’ places consistently experienced the least effects of the pandemic. This agrees with the fact that we observe the number of visits to follow similar patterns in Supplementary Figure S8, where we see a decrease during the early stages of the pandemic and gradual recovery by late 2021 for all POI categories, with the exception of grocery stores, which experienced no reduction in the number of visits even during the first waves. This suggests that the reduction in the number of visits indeed is one of the factors that cause the decrease in diversity of encounters. In the following section, we employ a counterfactual analysis approach to further understand why the diversity of encounters have consistently decreased during the pandemic.
Behavioral changes worsened income diversity in cities
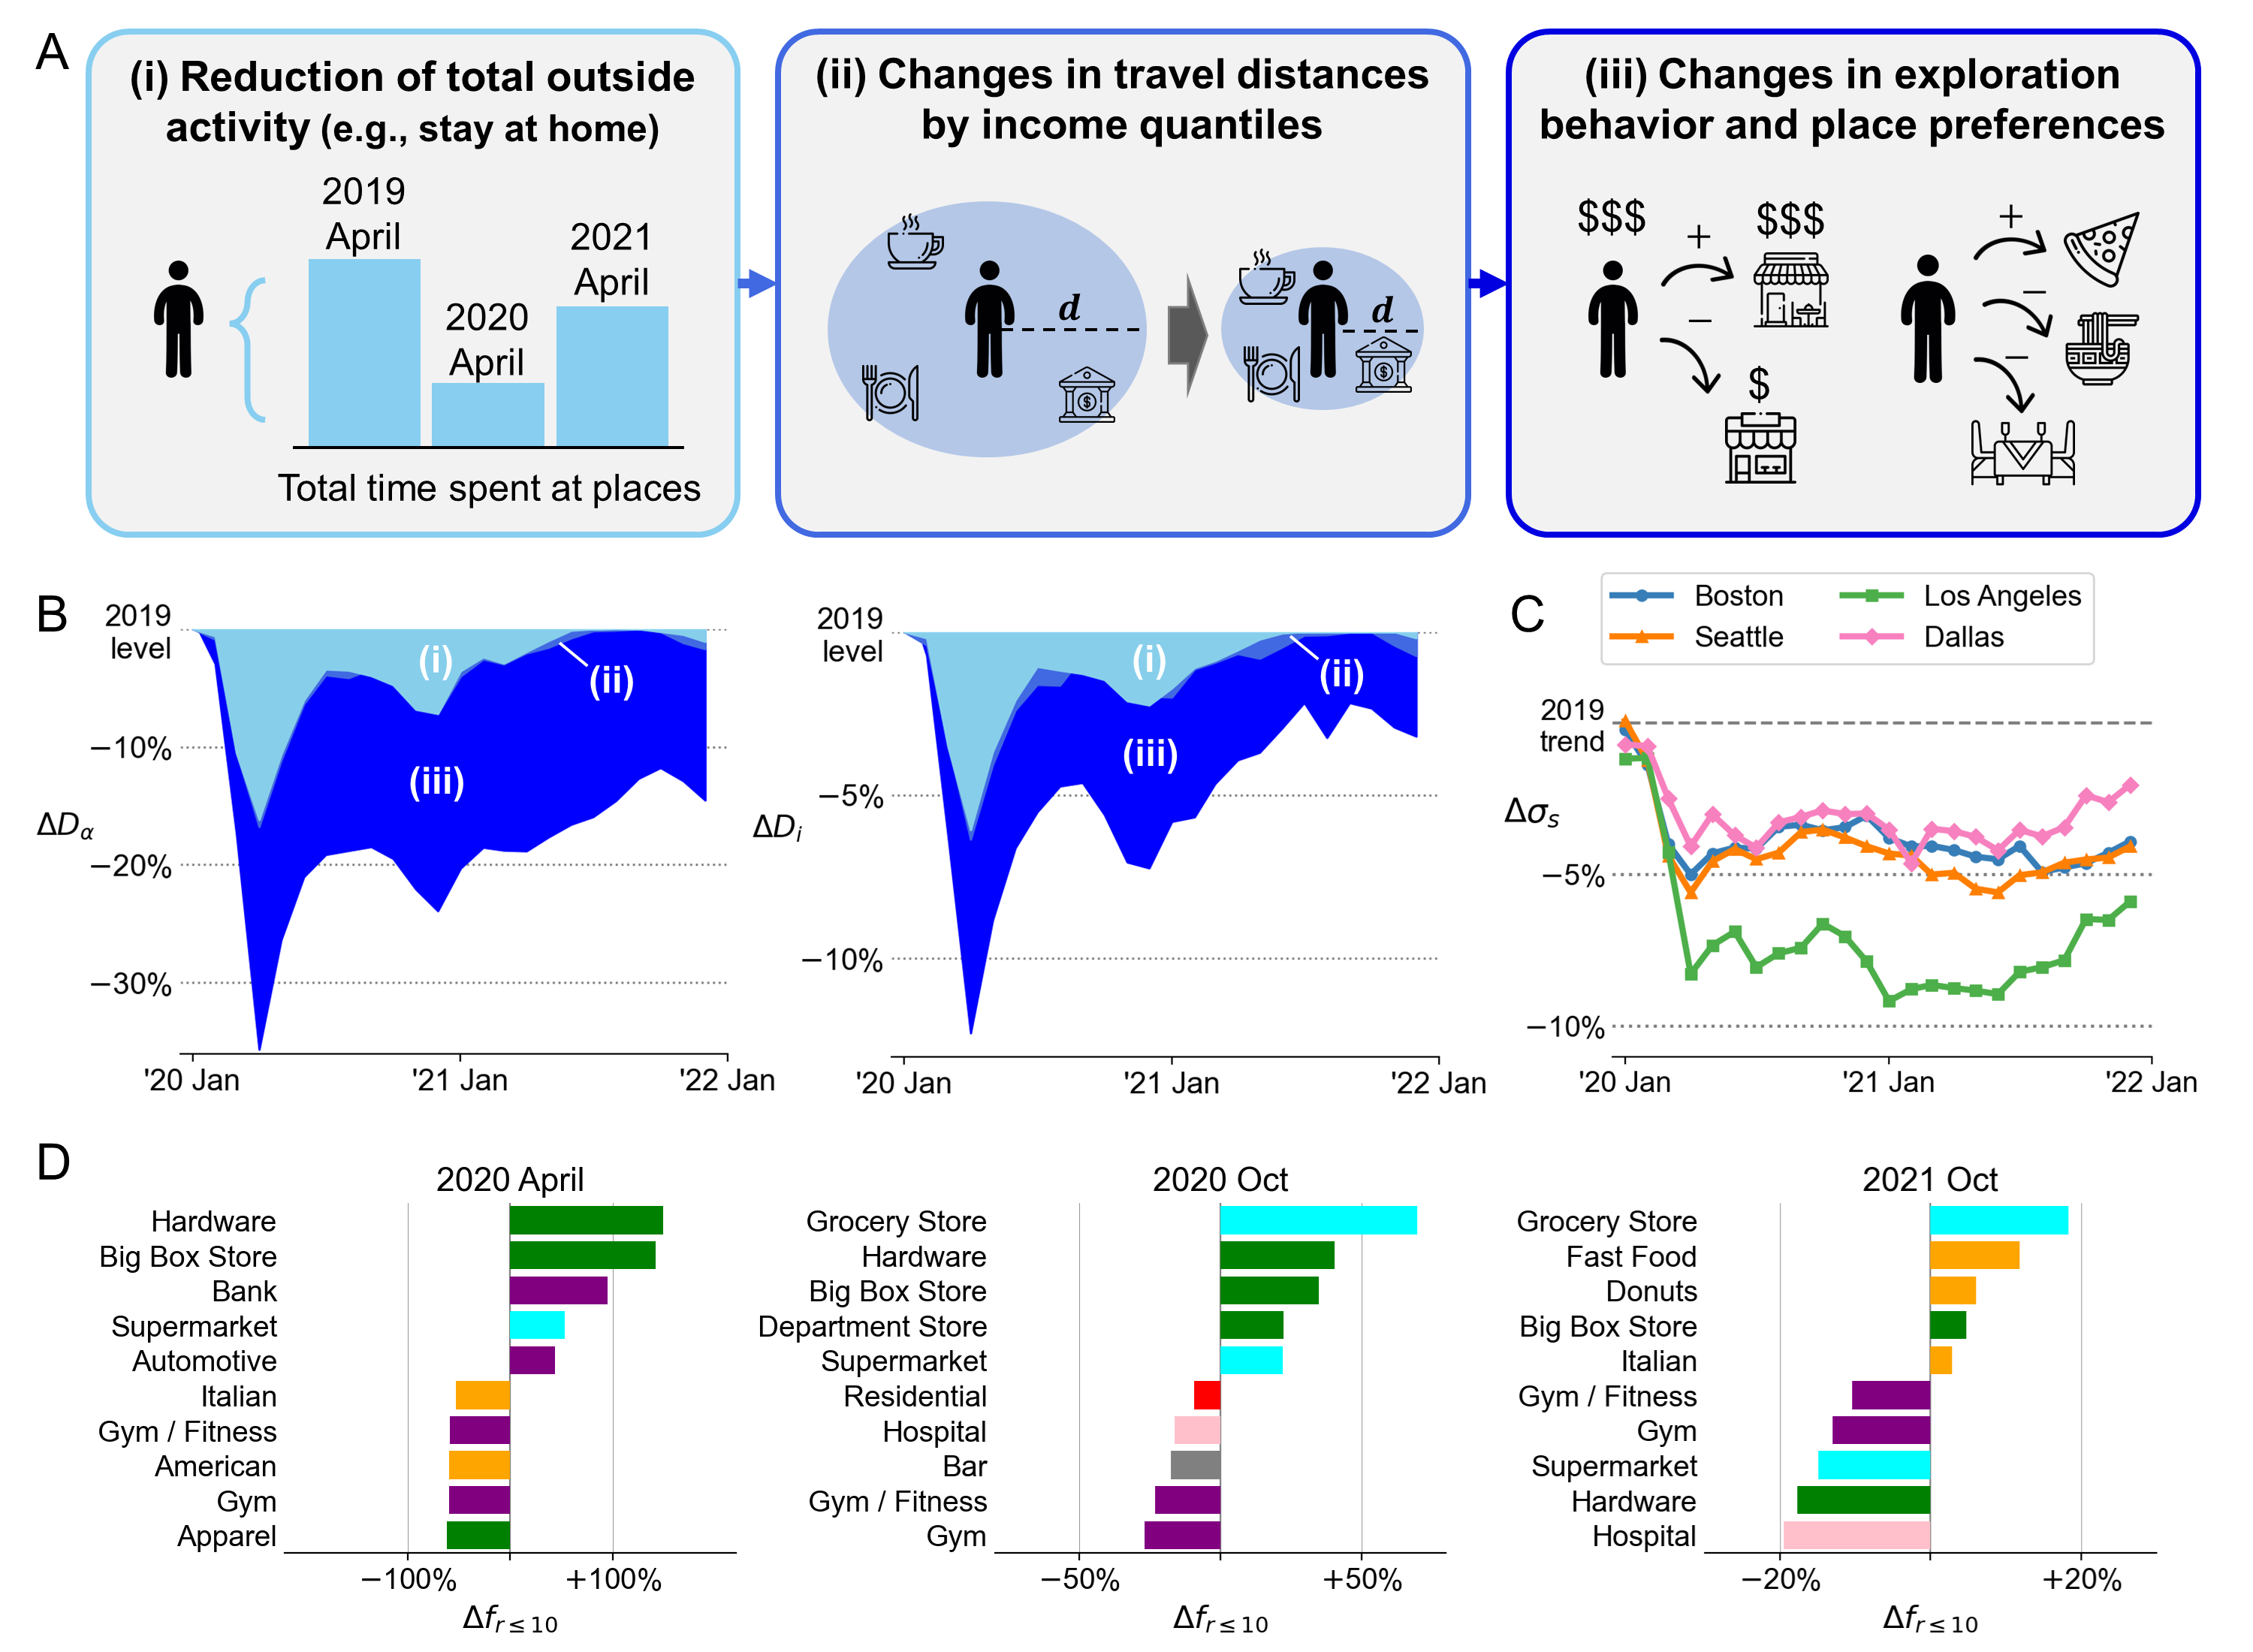
To investigate the behavioral factors that led to the consistent decrease in income diversity experienced at places and by individuals, we consider three possible hierarchical levels of changes in the behavior of individuals due to the pandemic. As illustrated in 2A, the pandemic led, especially during the beginning of the pandemic, to a (i) reduction in the total amount of time spent at places outside homes and workplaces. Moreover, due to stay-at-home orders and also reluctance towards long-distance trips compared to before, we also consider (ii) changes in travel distances for each income quantile. In addition, since some type of activity categories were particularly affected by social-distancing policies, we also consider changes in visits to major activity categories and traveled distances for each income quantile, shown in the Supplementary Note 4.2 and Supplementary Figure S16. Finally, we also consider the possibility of (iii) microscopic changes in place preferences, including changes in exploration behavior and visitation patterns across place sub-categories.
To disentangle the relative weights of these behavioral changes, we created different counterfactual mobility datasets. For example, to estimate the effects of reduction of total activity time on the loss of diversity, we created a counterfactual mobility dataset that contains the same total visit duration at places during the pandemic (e.g., 2020 April), by randomly down-sampling visits from pre-pandemic data observed on the same month (e.g., 2019 April) (see Methods and Supplementary Note 4.1). The resulting generated counterfactual data retains the behavioral mobility patterns observed in 2019, but includes the effects of reduced activity during the pandemic. By comparing the place and individual-based diversity measures computed from the actual and the counterfactual mobility datasets, we are able to delineate the effects of activity reduction on the decrease in diversity. Similarly to measure the effects of (ii) changes in traveled distances by income quantiles, we extended the previous counterfactual to have the same total visit duration by distance ranges for each income quantile (see Methods and Supplementary Note 4).
Figure 2B shows the decreased diversity experienced at places and by individuals decomposed into the three behavioral factors (full results shown in Supplementary Figure S17). The counterfactual simulations show that (i) reduction in total activities caused around 50% of the decrease in diversity during the first pandemic wave, however, decreases to almost 2% by late 2021 when mobility metrics have recovered back to normal, as shown in Figure 1B. Although we observe different rates of dwell time decrease and recovery across income quantiles where the richer populations disproportionately reduce dwell times at places than poorer populations (Supplementary Figure S14b), the overall diversity measures are not affected since the relative mixing of population groups across income groups are consistent (Supplementary Note 4.2 and Supplementary Figure S15). Changes in distance distributions, where people prefer trips to closer places during the pandemic (Supplementary Figure S14c) has slight negative effects on the income diversity of encounters (Supplementary Note 4.2). Surprisingly, changes in dwell time duration at major activity categories had no effects on the income diversity metrics (Supplementary Note 4.2 and Supplementary Figure S16).
Heterogeneity in activity reduction rates across income quantiles and changes in traveled distances explain around % of the decreased diversity during the first wave of the pandemic, however, the remaining % is due to more microscopic, place-based preference changes. These effects become the single dominant factor in the later stages of the pandemic. To identify the changes in the mobility behavior during the pandemic, we fit the social exploration and preferential return (Social-EPR) model [16, 32] to the data for each time period and assess the model parameters (see Supplementary Note 4.3). Among the parameters of the social-EPR model, the parameter which changed the most between before and during the pandemic was the social exploration parameter , as shown in Figure 2C and Supplementary Figure S18. Social exploration measures the probability of an individual to visit a place where their income group is not the majority income quantile group when they decide to explore a new place. During the pandemic, people’s willingness to socially explore substantially decreased compared to the 2019 levels (horizontal dashed line) in all four cities, leading to less experienced diversity.
Furthermore, we observe changes in place level preferences across POI sub-categories. Sub-category popularity is measured by computing the probability that a POI sub-category is included in an individual’s top most frequently visited places. Figure 2D and Supplementary Figure S19 shows the POI sub-categories which were more (and less) visited in different periods during the pandemic compared to 2019 levels. Hardware stores, big box stores, grocery stores were POI sub-categories which gained popularity during the pandemic, and gyms, movie theaters, American food places were subcategories which were less visited frequently. Taken together with the results that controlling by major activity categories did not explain additional decreased diversity to scenario (ii) as shown in Supplementary Note 4.2 and Supplementary Figure S13, this result shows that people have not changed their proportion of time spent for major activity categories, but have changed which specific types of places they visit within each major activity (e.g., less time at American restaurants, but more time at fast food and donut stores). To summarize, not only reduction in activity, but also microscopic behavioral changes especially during the later stages of the pandemic, including less exploration and shift in preferences, led to decreased diversity in urban encounters.
Spatial and socioeconomic heterogeneity in decreased diversity
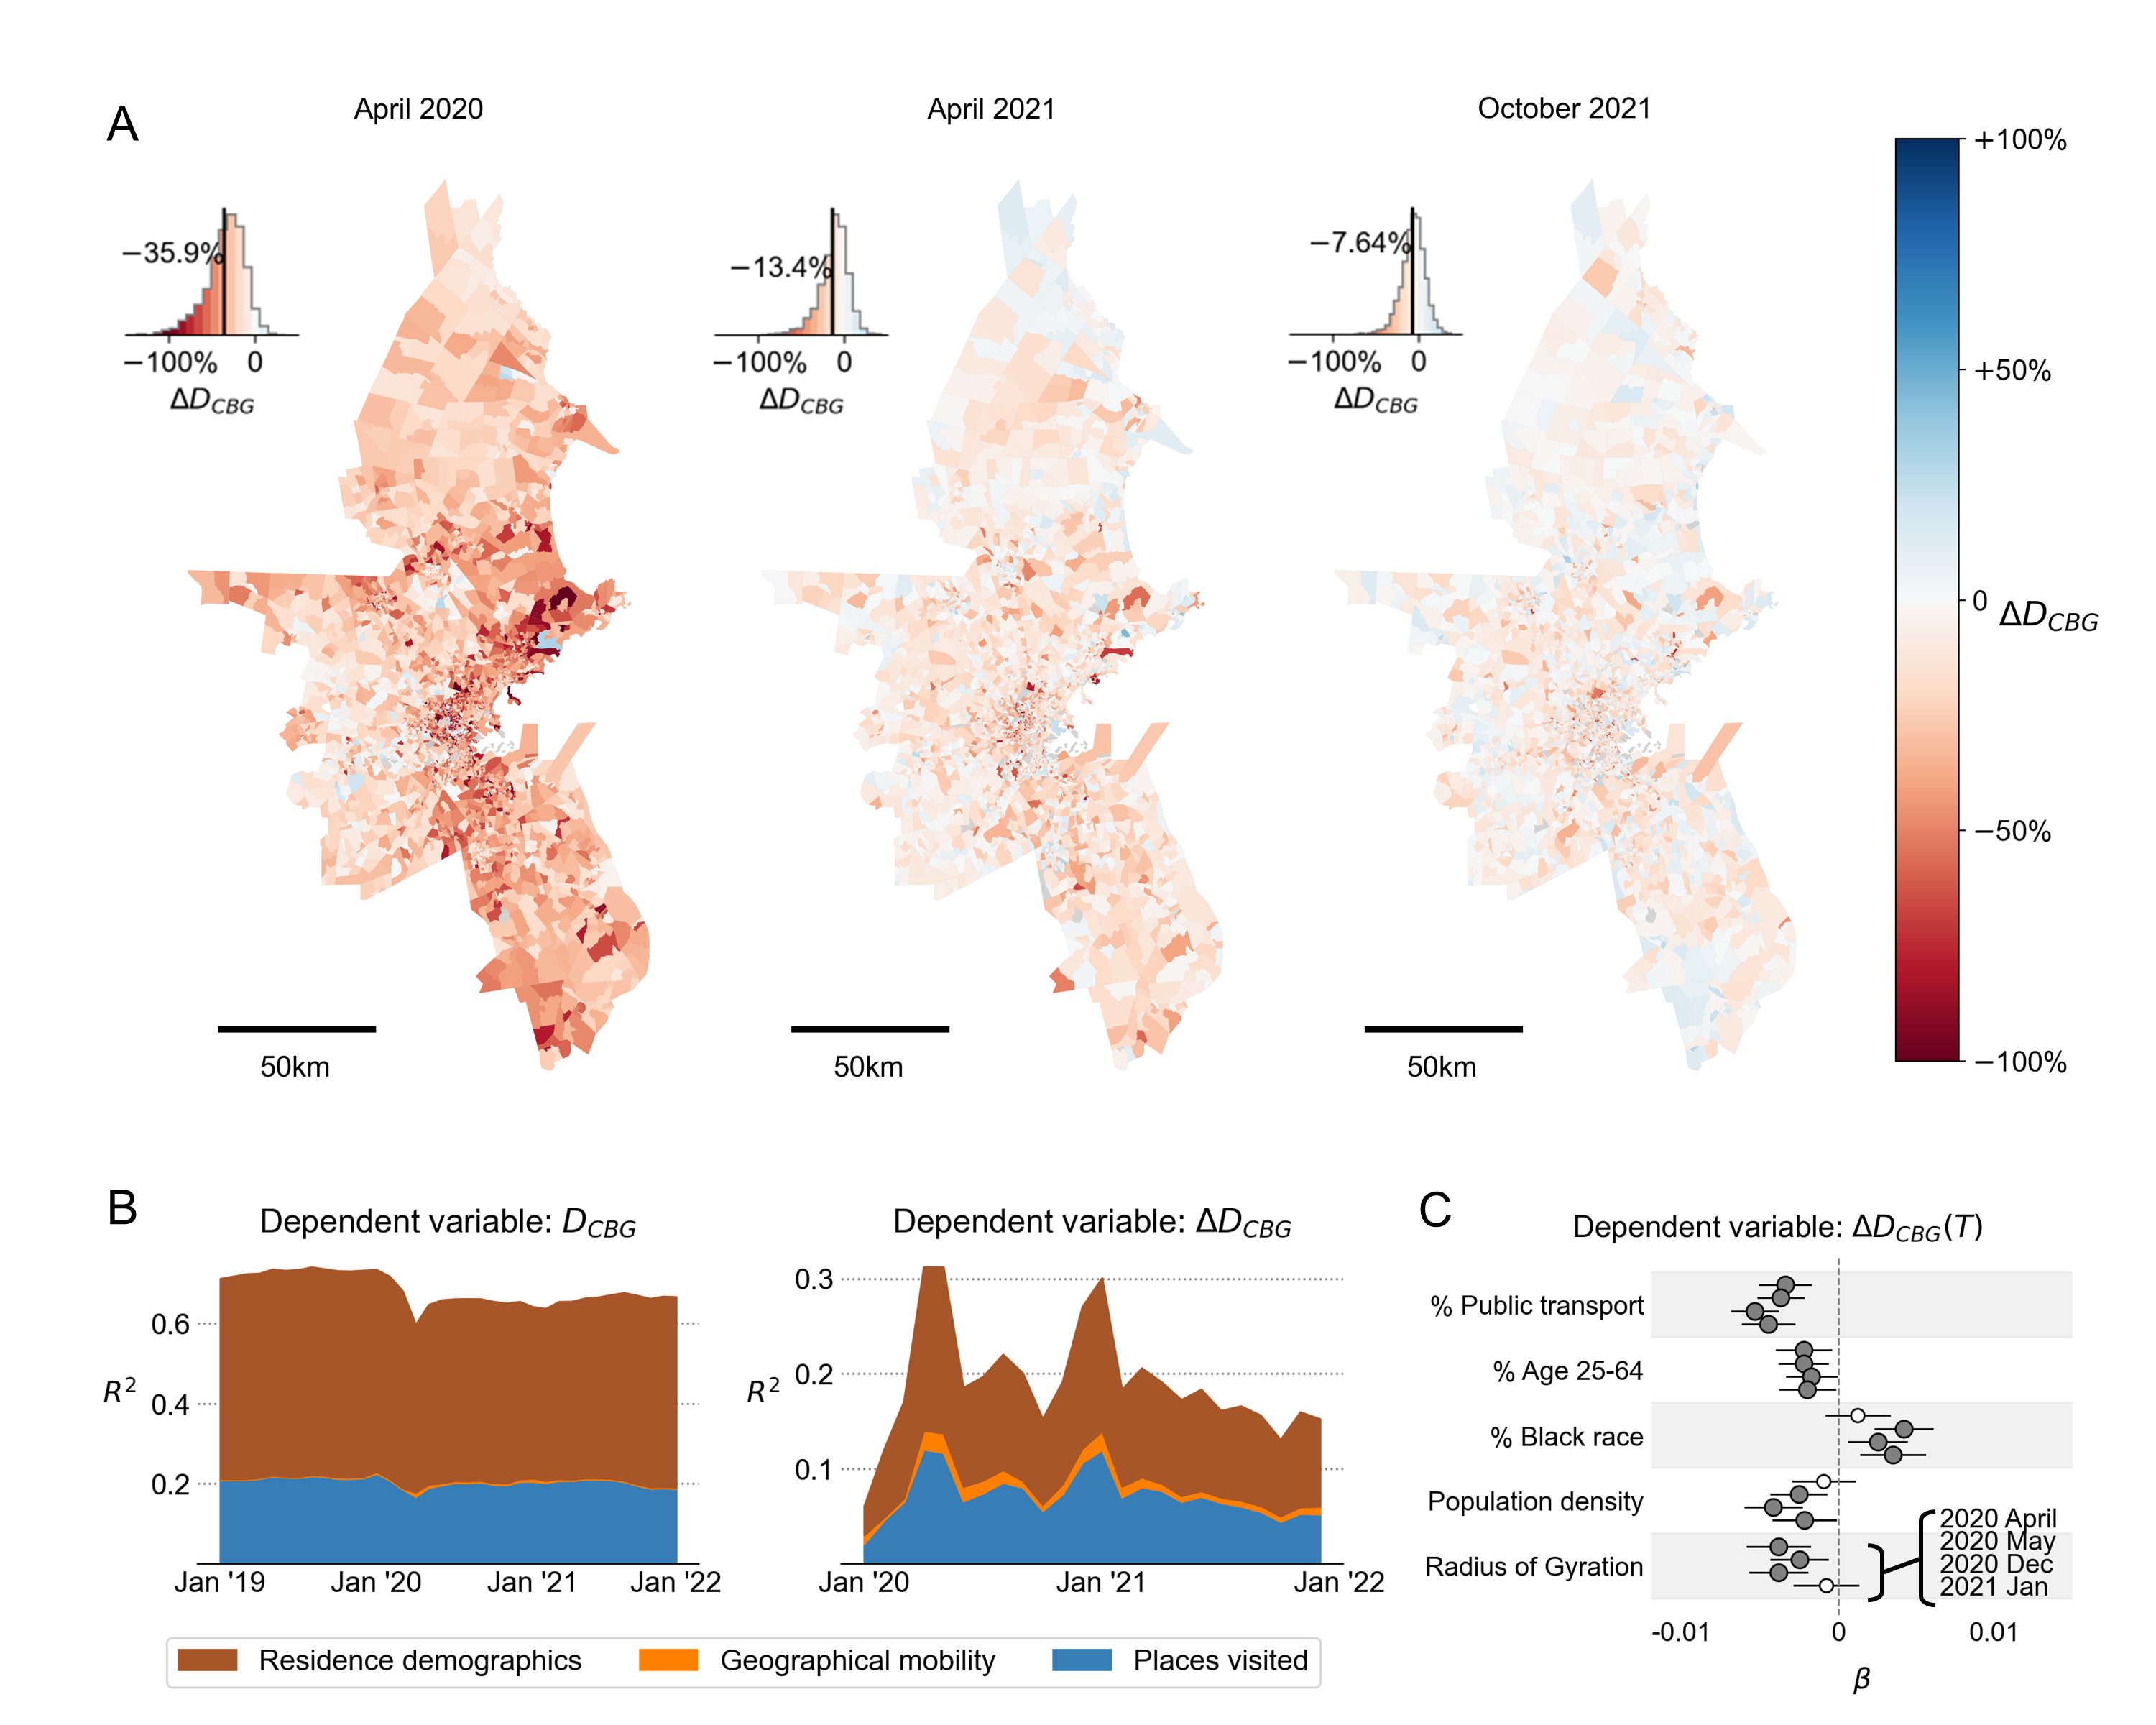
Which sociodemographic groups and areas were more affected by the decrease in income diversity? To understand the heterogeneity in decreased diversity, the mean CBG-level income diversity of all individuals living in the CBG were computed for each CBG in the four CBSAs, thus , where denotes the set of individuals living in the corresponding CBG. By visualizing in the Boston-Cambridge-Newton CBSA in Figure 3A (and other CBSAs in Supplementary Figure S20), we observe spatial heterogeneity in the changes in diversity in the early stages of the pandemic, however more homogeneity in the long-term. The insets also show the magnitude of decreasing as cities recovery from the pandemic. The correlation between in April 2020 and in April 2019 is much smaller () than for October 2021 and October 2019 (), indicating the larger heterogeneity in during the earlier stages of the pandemic (Supplementary Figure S21).
To understand the spatial and sociodemographic heterogeneity in the decreased diversity of encounters during the pandemic compared to 2019, we model and its difference , using a simple regression model (see Methods and Supplementary Note 5). We include variables describing the places visited by the residents in the CBG (in 2019), mobility metrics including the average total traveled distance and radius of gyration (in 2019), and sociodemographic and economic characteristics of the CBG, including its population density, median income, age and race composition, and transportation behavior (e.g., public transportation usage), all of which were standardized (Supplementary Table S3). Regression analysis was conducted for each month, including all four cities. To control for the difference between areas across and within the metropolitan areas, we include geographical fixed effects at the level of Public Use Microdata Areas (PUMAs), which typically span around 20km and contain a residential population of 150 thousand people. Detailed summary statistics (Supplementary Table S3), collinearity and correlations between variables (Supplementary Figure S22), variance inflation factor analysis, and full regression results can be found in Supplementary Note 5.
Figure 3B shows the adjusted of regression models for and , respectively, across different time periods. The three groups of variables (places visited, geographical mobility, residence and demographics) explain around % to % of the variance of income diversity (), which agrees with previous findings [16] (Supplementary Tables S4 – S6). However, the difference in diversity with respect to 2019 levels () has lower explained variance (at most ), and also decreases where there is no pandemic outbreak. In the long-term (October 2021), the regression model has low explained variance (), indicating that regions homogeneously became less diverse, irrespective of sociodemographic or behavioral characteristics of the areas. Figure 3C shows the factors that were most important in explaining the variance of in the months where was relatively high (April, May, December 2020 and January 2021) (Supplementary Tables S7 – S10). The highlighted regression coefficients suggest that whenever there is an outbreak, areas with higher population density and higher proportion of working age populations (age 25 – 64), higher reliance on public transport, and larger movement range (radius of gyration) experience the largest decrease in income diversity of encounters.
Trade-off between income diversity of encounters and stringency of policy measures
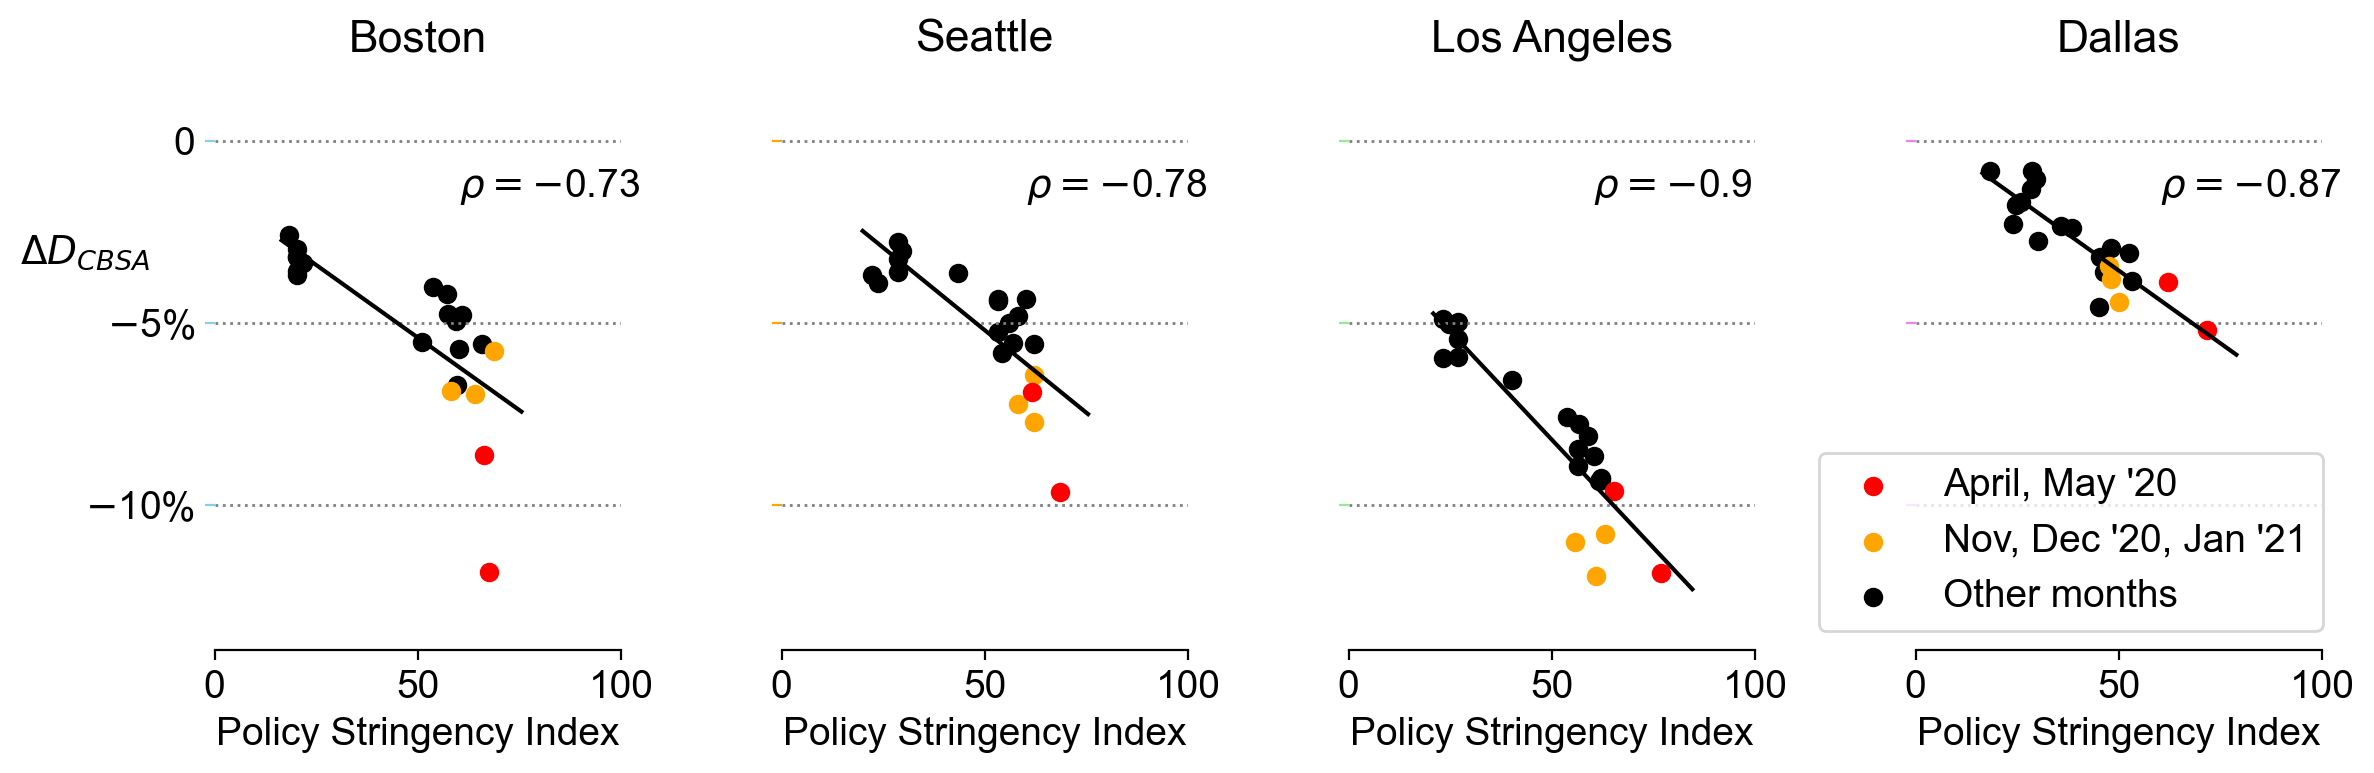
From a public policy perspective, an important and interesting question is to understand how COVID-19 containment measures, including lockdowns, school and workplace closures, and restrictions on public gatherings, have affected resulted in the loss of diversity in urban encounters. To measure the relationship between the stringency of COVID-19 measures and experienced income diversity, we utilize the COVID-19 Stringency Index [33] (Supplementary Figure S23), which is a composite measure of nine response metrics, including school and workplace closures, restrictions and cancellation of public events and gatherings, and restrictions on movement and travel (See Supplementary Note 6).
Figure 4 shows the relationship between the stringency of COVID-19 policies and the decrease in diversity of urban encounters. In all four cities we observe statistically significant () and strong negative correlation (). The robust negative correlations suggest a strong trade-off relationship between income diversity and COVID-19 policy and outbreak intensity in all cities. The decrease in diversity become pronounced during COVID-19 outbreaks, especially during the first pandemic wave (red plots) in Boston and Seattle, and during the second pandemic wave (orange plots) in Los Angeles, where the number of cases and deaths were substantial in the respective cities. Moreover, for Boston, Seattle, and Los Angeles, even though the Stringency Index has decreased to around 20 in late 2021 (which indicate already less strict policies in place), the decrease in income diversity is positive, suggesting that the COVID-19 pandemic may have had a long-lasting decreasing effect on the income diversity of urban encounters. Regression results using additional exogenous variables such as the number of COVID-19 cases and deaths on the federal and local (CBSA) levels are shown in Supplementary Note 6.1 and Supplementary Figure S24. Since is a temporal data with autocorrelation, we tested ARIMA type models as well, however the regression results and especially the estimated coefficients were found to be robust (see Supplementary Note 6.2, Supplementary Tables S13 and S14, and Supplementary Figure S25).
Discussion
Cities around the world currently face a wide array of challenges, ranging from combating inequality in wealth and economic opportunities [34], to avoiding catastrophic outcomes caused by climate change induced disasters [35]. Improving the inherent social capital of local communities and neighborhood networks, which are the fundamental units of collective decision making and support, is crucial for tackling these complex and global-scale societal challenges. With many cities expanding and urban inhabitants increasing at an unprecedented pace, the importance of promoting diverse encounters has never been higher [36]. Previous literature show that physical co-location and encounters are known to be significant factors [37] and predictors [38] for real world friendship formation, accounting for around 30% of new friendship additions [39]. Therefore, decrease in income diversity over the long-term could have substantial cumulative effects on the number and diversity of friendship ties, leading to more income segregation and polarization.
In this study, we make three important contributions towards understanding the dynamics of urban income diversity during and beyond the COVID-19 pandemic. First, we empirically revealed that physical encounters in US cities have indeed become less diverse than pre-pandemic levels even two years after the first case in the US, despite almost full recovery in aggregate mobility statics (e.g., number of visits per day). Second, we identified key behavioral changes that resulted in lower income diversity of encounters during the pandemic, including the consistent decrease in the exploration of socially diverse places and shifts in visitation preferences. Third, comparative analysis with COVID-19 policies suggested a strong trade-off relationship between COVID-19 policy stringency and income diversity. Thus, although social-distancing policies helped to mitigate the propagation of the epidemic, they also had negative effects on the social fabric of our cities. These insights, which are extremely difficult to quantify using traditional residence-based measures, collectively allow us to understand how and why urban encounters have become less diverse due to the pandemic.
Studies have suggested that while the development of effective vaccines have successfully suppressed the mortality rates of COVID-19, the new behavioral habits and social norms that we have acquired during the pandemic, such as higher rates of work from home, and dramatic changes in physical activity, sleep, time use, and mental health [40], could have long-lasting impact on society [25]. Behavioral changes that were observed in this study, such as less social exploration when visiting new places and changes in place preferences, may also remain for a long period due to persistent fear of infections. Our results suggest that policy interventions on urban mobility, such as the introduction of fare-free transit systems and development of public spaces, should target and evaluate the recovery of social exploration to potentially improve income diversity after the pandemic. Increasing the quantity and diversity of our social encounters [37] could help communities to acquire social capital, which could improve the resilience to natural hazards [6] and foster economic growth [41].
The results of our study should be interpreted in light of its limitations. Regarding the limitations of the mobility data, we are not able to identify the purpose of visits or the types of the encounters, for example, whether it is a co-visitation at a cafe where no conversations take place, or a cocktail party where strangers meet and have a conversation over a common topic. Therefore, the metrics computed in our study should be interpreted as a proxy for all meaningful encounters, and as a bound for urban income diversity. Regarding the study design, we focus on income diversity and not other socioeconomic and demographic dimensions, including racial diversity [42, 13]. The methods and approaches may be applied to other sociodemographic data available in the American Community Survey to understand the dynamics of these other types of social diversity experienced in cities.
Methods
Mobility data
We utilize an anonymized location dataset of mobile phones and smartphone devices provided by Spectus Inc., a location data intelligence company which collects anonymous, privacy-compliant location data of mobile devices using their software development kit (SDK) technology in mobile applications and ironclad privacy framework. Spectus processes data collected from mobile devices whose owners have actively opted in to share their location, and require all application partners to disclose their relationship with Spectus, directly or by category, in the privacy policy. With this commitment to privacy, the dataset contains location data for roughly 15 million daily active users in the United States. Through Spectus’ Social Impact program, Spectus provides mobility insights for academic research and humanitarian initiatives. All data analyzed in this study are aggregated to preserve privacy. The home locations of individual users are estimated at the CBG level using different variables including the number of days spent in a given location in the last month, the daily average number of hours spent in that location, and the time of the day spent in the location during nighttime. See Supplementary Note 1.1 for more details. The representativeness of this data has been tested and corrected in Supplementary Note 2 using post-stratification techniques.
Estimation of stays at places
Stops, which are location clusters where individual users stay for a given duration, are estimated using the Sequence Oriented Clustering approach [43]. The stops are attributed to places (or points-of interest; POIs) by simply searching for the closest place from the stops within a 100 meter radius. The robustness of the estimated income diversity to this spatial parameter was tested in Supplementary Note 1.2. Stays between 10 minutes and four hours, of individuals who were observed more than 300 minutes each day were used for the analysis. The results were shown to be robust against the choice of these temporal parameters in Supplementary Note 1.5. Moreover, the robustness of the results on income diversity against the choice of place datasets were tested using the ReferenceUSA dataset [29] in Supplementary Note 1.3.
Income diversity of encounters
To measure the income diversity of encounters experienced at each place in each city, we compute the proportion of total time spent at place by each income quantile , . Income thresholds for the quantiles are chosen based on the income distributions in each city. We checked that the results on income diversity are independent of the choice of the number of income quantiles in Supplementary Note 1.4. We define full diversity of encounters at a place when people from all income quantiles spend the same amount of time, for all . Using the metric used to compute income segregation in urban encounters in previous studies [16], we define the income diversity experienced at each place , as a measure of evenness of time spend by different income quantiles . The diversity measure is bounded between 0 and 1, where means there is no diversity (the place is visited by people from only one income quantile), and indicates that all income quantiles spent equal amount of time at the place. Similarly for individuals, given the proportion of time individual spent at place , , the individual’s relative exposure to income quantile , can be computed by . Then, the income diversity experienced by individual can be measured using the same equation used for places . Most of the results in the main manuscript are shown by percentage differences, which is computed by , where is the income diversity of encounters observed on the same month as in 2019, before the pandemic. Results in Supplementary Note 3.3 show that using different popular measures of diversity such as entropy does not affect the results on income diversity of encounters.
Counterfactual simulation of mobility
To understand the underlying behavioral changes that contributed to the decrease of income diversity in urban encounters, we design a simulation framework that leverages the pre-pandemic data to create synthetic, counterfactual mobility patterns. The synthetic, counterfactual mobility dataset is designed so that while the fundamental behavioral patterns observed in 2019 are kept consistent, the number of users and stays at different place categories by different income quantiles are reduced to post-pandemic levels. This way, we are able to delineate the effects of different levels of behavioral changes to the total decrease in income diversity.
The following steps are performed to simulate the synthetic mobility datasets. To create the synthetic counterfactual data for year and month , denoted as , we use the mobility data observed in the year 2019 on the same month as input data , for example, to create a synthetic mobility dataset for April 2020, we use the mobility data observed in April 2019. Several different synthetic datasets, and (and their variants), are created based on different levels of detail (see Supplementary Note 4). More specifically, the first synthetic dataset is created by randomly removing visits from to adjust the total amount of dwell time spent at visits to places to match . The second synthetic dataset employs a more granular removal process, where we randomly remove visits to places from by income quantiles and traveled distance (binned into 7 distance ranges: , , , , , , ) to adjust the amount of dwell time spent at visits to places. We also tested removing visits by income quantiles , traveled distance , and place taxonomy , however the results were similar to scenario (ii), as shown in Supplementary Note 4.2. More details on creating the counterfactual synthetic datasets can be found in Supplementary Note 4. After creating the synthetic counterfactual datasets, we compute the income diversity of encounters and compare with the income diversity measured using the actual observed data to delineate the effects of reduction in active users and visits to place categories on the decrease in income diversity.
Modeling the heterogeneity in income diversity
To further understand how the income diversity of encounters decreased heterogeneously across sociodemographic groups during throughout the pandemic, we build simple linear regression models of the form:
| (1) |
where and denote the differences in diversity at time compared to the same month in the year 2019. is the set of all residential variables from the census that describe the demographic, transportation, education, race, employment, wealth, etc. of the Census Block Group. is a vector of variables that indicate the places where individuals living in the CBG spent most of their time in 2019, out of the place subcategories which have at least 100 venues. For each individual, we identify the subcategories where the individual stays more than 0.3% of their time and obtain a binary vector with the length of 564, which is the number of place subcategories. is a set of variables that describe the geographical mobility behavior of people living in the corresponding CBG. We use two variables: (i) the radius of gyration of all the places visited by each user, and (ii) the average distance traveled to all places from each individual’s home. Details of the regression covariates, including their summary statistics and correlations, are studied in Supplementary Note 5.
To further understand the differences in decreased income diversity across CBSAs, the correlation between the stringency of COVID-19 policies and the decrease in diversity was analyzed. The stringency index is a composite metric that measures the strictness of COVID-19 policies calculated using data collected in OxCGRT [33], and are provided at the state levels for the United States. The stringency index takes into account policies including the closings of schools and universities, closings of workplaces, cancelling of public events and gatherings, closing of public transport, orders to shelter-in-place, restrictions on internal movement between cities/regions and international travel, and presence of public info campaigns. More details are provided in the codebook in the github webpage 111https://github.com/OxCGRT/covid-policy-tracker/blob/master/documentation/codebook.md.
Acknowledgements
We would like to thank Spectus who kindly provided us with the mobility dataset for this research through their Data for Good program.
Author contributions statement
T.Y. designed the algorithms, performed the analysis, developed models and simulations. B.G.B.B. and E.M. performed part of the analysis, partially developed models and simulations. A.P., X.D. and E.M. supervised the research. All authors wrote the paper. Company data were processed by T.Y. and partially by B.G.B.B. and E. M. All authors had access to aggregated (nonindividual) processed data. All authors reviewed the manuscript.
Data Availability
The data that support the findings of this study are available from Spectus through their Social Impact program, but restrictions apply to the availability of these data, which were used under the licence for the current study and are therefore not publicly available. Information about how to request access to the data and its conditions and limitations can be found in https://spectus.ai/social-impact/.
Code Availability
The analysis was conducted using Python. Code to reproduce the main results in the figures from the aggregated data is public available on github https://github.com/takayabe0505/IncomeDiversity.
Competing Interests
The authors declare no competing interests.
References
- [1] Pierre-Alexandre Balland, Cristian Jara-Figueroa, Sergio G Petralia, Mathieu PA Steijn, David L Rigby, and César A Hidalgo. Complex economic activities concentrate in large cities. Nature Human Behaviour, 4(3):248–254, 2020.
- [2] Nathan Eagle, Alex Sandy Pentland, and David Lazer. Inferring friendship network structure by using mobile phone data. Proceedings of the National Academy of Sciences, 106(36):15274–15278, 2009.
- [3] Wei Pan, Gourab Ghoshal, Coco Krumme, Manuel Cebrian, and Alex Pentland. Urban characteristics attributable to density-driven tie formation. Nature Communications, 4(1):1–7, 2013.
- [4] Nathan Eagle, Michael Macy, and Rob Claxton. Network diversity and economic development. Science, 328(5981):1029–1031, 2010.
- [5] Xiangfei Yuan, Haijing Hao, Chenghua Guan, and Alex Pentland. Which factors affect the performance of technology business incubators in china? an entrepreneurial ecosystem perspective. PLoS ONE, 17(1):e0261922, 2022.
- [6] Daniel P Aldrich and Michelle A Meyer. Social capital and community resilience. American Behavioral Scientist, 59(2):254–269, 2015.
- [7] Takahiro Yabe, Satish V Ukkusuri, and P Suresh C Rao. Mobile phone data reveals the importance of pre-disaster inter-city social ties for recovery after hurricane maria. Applied Network Science, 4(1):98, 2019.
- [8] Alan J Abramson, Mitchell S Tobin, and Matthew R VanderGoot. The changing geography of metropolitan opportunity: The segregation of the poor in us metropolitan areas, 1970 to 1990. Housing Policy Debate, 6(1):45–72, 1995.
- [9] Maarten Van Ham, Szymon Marcińczak, Tiit Tammaru, and Sako Musterd. Inequality and rising levels of socio-economic segregation: Lessons from a pan-european comparative study. In Socio-economic segregation in European capital cities: East meets West. Taylor & Francis, 2015.
- [10] Vincent D Blondel, Adeline Decuyper, and Gautier Krings. A survey of results on mobile phone datasets analysis. EPJ Data Science, 4(1):10, 2015.
- [11] Marta C Gonzalez, Cesar A Hidalgo, and Albert-Laszlo Barabasi. Understanding individual human mobility patterns. Nature, 453(7196):779, 2008.
- [12] Xiaowen Dong, Alfredo J Morales, Eaman Jahani, Esteban Moro, Bruno Lepri, Burcin Bozkaya, Carlos Sarraute, Yaneer Bar-Yam, and Alex Pentland. Segregated interactions in urban and online space. EPJ Data Science, 9(1):20, 2020.
- [13] Qi Wang, Nolan Edward Phillips, Mario L Small, and Robert J Sampson. Urban mobility and neighborhood isolation in america’s 50 largest cities. Proceedings of the National Academy of Sciences, 115(30):7735–7740, 2018.
- [14] Arkadiusz Stopczynski, Alex‘Sandy’ Pentland, and Sune Lehmann. How physical proximity shapes complex social networks. Scientific Reports, 8(1):1–10, 2018.
- [15] Lijun Sun, Kay W Axhausen, Der-Horng Lee, and Xianfeng Huang. Understanding metropolitan patterns of daily encounters. Proceedings of the National Academy of Sciences, 110(34):13774–13779, 2013.
- [16] Esteban Moro, Dan Calacci, Xiaowen Dong, and Alex Pentland. Mobility patterns are associated with experienced income segregation in large us cities. Nature Communications, 12(1):1–10, 2021.
- [17] Rafiazka Millanida Hilman, Gerardo Iñiguez, and Márton Karsai. Socioeconomic biases in urban mixing patterns of us metropolitan areas. EPJ Data Science, 11(1):32, 2022.
- [18] Christopher R Browning, Catherine A Calder, Lauren J Krivo, Anna L Smith, and Bethany Boettner. Socioeconomic segregation of activity spaces in urban neighborhoods: Does shared residence mean shared routines? RSF: The Russell Sage Foundation Journal of the Social Sciences, 3(2):210–231, 2017.
- [19] Andres Sevtsuk, Annie Hudson, Dylan Halpern, Rounaq Basu, Kloe Ng, and Jorrit de Jong. The impact of covid-19 on trips to urban amenities: Examining travel behavior changes in somerville, ma. PLoS ONE, 16(9):e0252794, 2021.
- [20] Geoffrey H Tison, Robert Avram, Peter Kuhar, Sean Abreau, Greg M Marcus, Mark J Pletcher, and Jeffrey E Olgin. Worldwide effect of covid-19 on physical activity: a descriptive study. Annals of Internal Medicine, 173(9):767–770, 2020.
- [21] Ruth F Hunter, Leandro Garcia, Thiago Herick de Sa, Belen Zapata-Diomedi, Christopher Millett, James Woodcock, Esteban Moro, et al. Effect of covid-19 response policies on walking behavior in us cities. Nature Communications, 12(1):1–9, 2021.
- [22] Jonathan Campion, Afzal Javed, Norman Sartorius, and Michael Marmot. Addressing the public mental health challenge of covid-19. The Lancet Psychiatry, 7(8):657–659, 2020.
- [23] Jisung Yoon, Woo-Sung Jung, and Hyunuk Kim. Covid-19 confines social gathering to familiar, less crowded, and neighboring urban areas. arXiv preprint arXiv:2109.00902, 2021.
- [24] André de Palma, Shaghayegh Vosough, and Feixiong Liao. An overview of effects of covid-19 on mobility and lifestyle: 18 months since the outbreak. Transportation Research Part A: Policy and Practice, 2022.
- [25] Pew Research Center. Covid-19 pandemic continues to reshape work in america. https://www.pewresearch.org/social-trends/2022/02/16/covid-19-pandemic-continues-to-reshape-work-in-america/, 2022. Accessed: 2022-05-19.
- [26] Meike Janssen, Betty PI Chang, Hristo Hristov, Igor Pravst, Adriano Profeta, and Jeremy Millard. Changes in food consumption during the covid-19 pandemic: analysis of consumer survey data from the first lockdown period in denmark, germany, and slovenia. Frontiers in Nutrition, page 60, 2021.
- [27] Nuria Oliver, Bruno Lepri, Harald Sterly, Renaud Lambiotte, Sébastien Deletaille, Marco De Nadai, Emmanuel Letouzé, Albert Ali Salah, Richard Benjamins, Ciro Cattuto, Vittoria Colizza, Nicolas de Cordes, Samuel P. Fraiberger, Till Koebe, Sune Lehmann, Juan Murillo, Alex Pentland, Phuong N Pham, Frédéric Pivetta, Jari Saramäki, Samuel V. Scarpino, Michele Tizzoni, Stefaan Verhulst, and Patrick Vinck. Mobile phone data for informing public health actions across the covid-19 pandemic life cycle. Science Advances, 6(23), 2020.
- [28] Alberto Aleta, David Martin-Corral, Ana Pastore y Piontti, Marco Ajelli, Maria Litvinova, Matteo Chinazzi, Natalie E Dean, M Elizabeth Halloran, Ira M Longini Jr, Stefano Merler, Alex Pentland, Alessandro Vespignani, Esteban Moro, and Yamir Moreno. Modelling the impact of testing, contact tracing and household quarantine on second waves of covid-19. Nature Human Behaviour, 4(9):964–971, 2020.
- [29] Infogroup. ReferenceUSA Business Historical Data Files, 2014.
- [30] Serina Chang, Emma Pierson, Pang Wei Koh, Jaline Gerardin, Beth Redbird, David Grusky, and Jure Leskovec. Mobility network models of covid-19 explain inequities and inform reopening. Nature, 589(7840):82–87, 2021.
- [31] Lorenzo Lucchini, Simone Centellegher, Luca Pappalardo, Riccardo Gallotti, Filippo Privitera, Bruno Lepri, and Marco De Nadai. Living in a pandemic: changes in mobility routines, social activity and adherence to covid-19 protective measures. Scientific Reports, 11(1):1–12, 2021.
- [32] Chaoming Song, Tal Koren, Pu Wang, and Albert-László Barabási. Modelling the scaling properties of human mobility. Nature Physics, 6(10):818–823, 2010.
- [33] Thomas Hale, Noam Angrist, Rafael Goldszmidt, Beatriz Kira, Anna Petherick, Toby Phillips, Samuel Webster, Emily Cameron-Blake, Laura Hallas, Saptarshi Majumdar, et al. A global panel database of pandemic policies (oxford covid-19 government response tracker). Nature Human Behaviour, 5(4):529–538, 2021.
- [34] Shi Kai Chong, Mohsen Bahrami, Hao Chen, Selim Balcisoy, Burcin Bozkaya, et al. Economic outcomes predicted by diversity in cities. EPJ Data Science, 9(1):17, 2020.
- [35] Daniel P Aldrich. Building resilience: Social capital in post-disaster recovery. University of Chicago Press, 2012.
- [36] Robert J Sampson. Urban sustainability in an age of enduring inequalities: Advancing theory and ecometrics for the 21st-century city. Proceedings of the National Academy of Sciences, 114(34):8957–8962, 2017.
- [37] Mario L Small and Laura Adler. The role of space in the formation of social ties. Annual Review of Sociology, 45:111–132, 2019.
- [38] Eunjoon Cho, Seth A Myers, and Jure Leskovec. Friendship and mobility: user movement in location-based social networks. In Proceedings of the 17th ACM SIGKDD international conference on Knowledge discovery and data mining, pages 1082–1090. ACM, 2011.
- [39] Salvatore Scellato, Anastasios Noulas, and Cecilia Mascolo. Exploiting place features in link prediction on location-based social networks. In Proceedings of the 17th ACM SIGKDD international conference on Knowledge discovery and data mining, pages 1046–1054, 2011.
- [40] Osea Giuntella, Kelly Hyde, Silvia Saccardo, and Sally Sadoff. Lifestyle and mental health disruptions during covid-19. Proceedings of the National Academy of Sciences, 118(9), 2021.
- [41] Paul F Whiteley. Economic growth and social capital. Political Studies, 48(3):443–466, 2000.
- [42] Susan Athey, Billy Ferguson, Matthew Gentzkow, and Tobias Schmidt. Estimating experienced racial segregation in us cities using large-scale gps data. Proceedings of the National Academy of Sciences, 118(46), 2021.
- [43] Longgang Xiang, Meng Gao, and Tao Wu. Extracting stops from noisy trajectories: A sequence oriented clustering approach. ISPRS International Journal of Geo-Information, 5(3):29, 2016.