Estimating sizes of Type 2 AGN narrow-line regions from multiple survey spectra - a demonstration
Abstract
In the Letter, an interesting method is proposed to estimate size of narrow emission lines regions (NLRs) of a Type-2 AGN SDSS J083823.91+490241.1 (=SDSS J0838) at a redshift of 0.101, by comparing spectroscopic properties through the SDSS fiber (MJD=51873) (diameter of 3 arcseconds) and through the eBOSS fiber (MJD=55277) (diameter of 2 arcseconds). After subtractions of pPXF method determined host galaxy contributions, the narrow emission lines of SDSS J0838 in the SDSS spectrum and in the eBOSS spectrum can be well measured by Gaussian functions, leading more than 90% of [O iii] emissions to be covered by the eBOSS fiber with diameter of 2 arcseconds. Meanwhile, both none broad emission components and none-variabilities of ZTF 3years-long g/r-band light curves can be applied to confirm SDSS J0838 as a Type-2 AGN, indicating few orientation effects on the projected NLRs size in SDSS J0838. Therefore, upper limit about 1arcsecond (2250pc) of the NLRs size can be reasonably accepted in SDSS J0838. Combining with the intrinsic reddening corrected [O iii] line luminosity, the upper limit of NLRs size in SDSS J0838 well lies within the 99.9999% confidence bands of the R-L empirical relation for NLRs in AGN.
keywords:
galaxies:active - galaxies:nuclei - quasars:emission lines - galaxies:Seyfert1 Introduction
Apparent narrow emission lines from narrow emission line regions (NLRs) are fundamental characteristics of Active Galactic Nuclei (AGN). Basic physical NLRs sizes (distance between NLRs and central power source) in AGN (especially in Type-2 narrow line AGN) have been well known, through properties of spatially resolved [O iii] emission images. Bennert et al. (2006a, b) have measured NLRs sizes in Seyfert 2 galaxy NGC1386 and the other several Seyfert-2 galaxies. Greene et al. (2011) have measured NLRs sizes of 15 obscured QSOs. Liu et al. (2013a, b) have measured NLRs sizes in a sample of radio quiet type-2 QSOs with extended emission-line regions. Hainline et al. (2016) have measured NLR sizes in a nearby merging galaxy, to explore the dependence of NLR sizes on [O iii] luminosity in progenitors of dual AGN. Fischer et al. (2018) have reported NLRs sizes in a sample of obscured QSOs. Based on the reported NLRs sizes in AGN, there is a strong dependence of NLRs size () on [O iii]Å line luminosity () (the R-L empirical relation for NLRs) discussed in Liu et al. (2013a); Hainline et al. (2013, 2014, 2016); Fischer et al. (2018); Dempsey & Zakamska (2018),
| (1) |
, especially for AGN with 8m luminosity smaller than as discussed in Hainline et al. (2013); Dempsey & Zakamska (2018).
Until now, there are only around 50 AGN with NLRs sizes well measured by spatially resolved [O iii] emission images, more AGN with NLRs size being measured and/or estimated could provide further clues on intrinsic physical properties of NLRs of AGN. There are two probable sources of emission clouds in NLRs of AGN, local gas clouds related to star-formations (such as the emission regions in HII galaxies) and/or the ionized gas clouds related to central galactic outflows (as discussed in Wada et al. (2018)). Whether are there distinct locations for the two gas cloud sources is still unclear in AGN. In order to answer the question, it is necessary to find more AGN and HII galaxies of which NLRs sizes should be estimated. However, for AGN with weak [O iii] emissions and for HII galaxies with intrinsic weak [O iii] emissions, it would be difficult to determine NLRs ([O iii] emission regions) sizes through spatially resolved high quality [O iii] emission images. Therefore, in the Letter, an interesting method proposed in Section 2 is applied to simply but conveniently check NLRs sizes properties of narrow emission line objects, based on the different fiber diameters of SDSS (Sloan Digital Sky Survey) and eBOSS (Extended Baryon Oscillation Spectroscopic Survey). Main results and discussions are shown in Section 3 on SDSS J083823.91+490241.1 (=SDSS J0838) observed by both SDSS and eBOSS. Section 4 shows the final summaries and conclusions. And in the Letter, we have adopted the cosmological parameters of , and .
2 Method
As the detailed descriptions in https://www.sdss.org/dr16/spectro/spectro_basics/, a spectrum in SDSS is observed by a fiber with diameter of 3 arcseconds, however, a spectrum in eBOSS is observed by a fiber with diameter of 2 arcseconds. If one object is observed by SDSS, and repeated by eBOSS, leading the multi-epoch spectra including different emission regions to have different expected properties of NLRs of the object.
On the one hand, if emission lines in spectrum observed by eBOSS fiber have similar line intensities as the lines in spectrum by SDSS fiber, we would expect that the projected NLRs size of the object should be smaller than the eBOSS fiber radius (1 arcsecond). On the other hand, if emission lines in spectrum observed by eBOSS fiber have quite smaller line intensities than the lines in spectrum by SDSS fiber, we would expect that the projected size of NLRs of the object should be larger than the eBOSS fiber radius (1arcsecond).
| in the SDSS spectrum with MJD=51873 | in the SDSS spectrum with MJD=51959 | in the eBOSS spectrum with MJD=55277 | |||||||
| flux | flux | flux | |||||||
| H | 4861.630.11 | 3.090.11 | 26.23.9 | 4861.720.09 | 3.010.09 | 36.53.2 | 4861.210.08 | 3.220.09 | 19.62.3 |
| O3 | 5005.860.34 | 3.520.35 | 61.15.8 | 5005.750.78 | 4.750.78 | 64.83.6 | 5006.260.71 | 4.150.43 | 58.94.2 |
| N2 | 6583.090.14 | 4.030.14 | 214.66.9 | 6583.020.12 | 4.280.12 | 184.14.8 | 6582.720.09 | 4.260.09 | 192.53.5 |
| H | 6563.190.14 | 4.180.14 | 191.46.1 | 6563.310.12 | 4.060.12 | 154.74.2 | 6562.610.11 | 4.340.12 | 148.23.6 |
| S16 | 6716.850.35 | 4.650.37 | 114.27.6 | 6717.460.37 | 4.730.37 | 92.46.4 | 6716.350.25 | 4.610.26 | 88.64.4 |
| S31 | 6731.550.38 | 3.540.39 | 65.96.5 | 6730.740.41 | 3.690.39 | 54.75.7 | 6730.620.28 | 3.810.28 | 58.13.9 |
Notice: , and flux represent central wavelength in unit of Å, second moment in unit of Å, and line intensity in unit of . "O3" means the [O iii]Å emission line. "N2" means the [N ii]Å emission line. "S16" and "S31" mean the [S ii]Å emission line and the [S ii]Å emission line. are calculated by the summed squared residuals divided by the degree of freedom.
3 Main Results
3.1 spectroscopic results
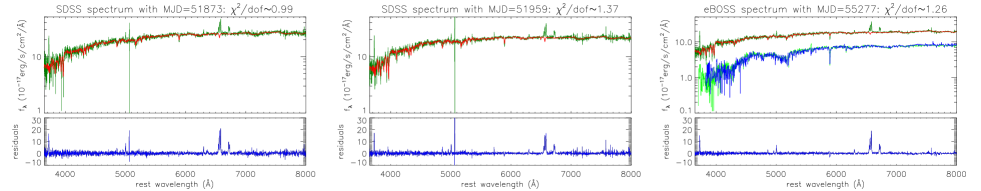
Fig. 1 shows the spectra of SDSS J0838 at a redshift 0.101 with plate-mjd-fiberid=0445-51873-0124 and with plate-mjd-fiberid=0550-51959-0411 (the SDSS spectra, with drilled fiber position of plug_ra=129.59965 and plug_dec=49.044810) and with plate-mjd-fiberid=3696-55277-0030 (the eBOSS spectrum, with drilled fiber position of plug_ra=129.59963 and plug_dec= 49.044865), collected from SDSS DR16 (data release 16, Ahumada et al. (2020)). It is clear that the SDSS fiber and the eBOSS fiber have been positioned to the same central position with a difference of about 0.2arcseconds, and the SDSS spectrum and the eBOSS spectrum are quite different, due to different peak intensities.
Actually, among low redshift () AGN in SDSS DR16, hundreds of AGN have been collected to have both SDSS spectra and eBOSS spectra. However, among the objects discussed in detail in our manuscripts in preparation, SDSS J0838 is selected as the main target in the Letter by the following three main reasons. First, SDSS J0838 is a well classified Type-2 AGN discussed in the following sections, indicating few orientation effects on estimated NLRs sizes in SDSS 0838. Second, SDSS 0838 has its SDSS spectrum and eBOSS spectrum with almost totally the same drilled fiber positions, leading to few effects of pointing error on estimated NLRs sizes in SDSS 0838. Third, SDSS J0838 has its single-Gaussian described [O iii] emissions almost totally covered by the eBOSS fiber leading to clear upper limits of NLRs sizes.
Before proceeding further, the spectroscopic features of the SDSS spectra and the eBOSS spectrum are carefully checked in SDSS J0838, in order to measure the emission lines after subtractions of starlight. In the Letter, the pPXF (Penalized Pixel-Fitting) code (Cappellari, 2017), one commonly applied SSP (Simple Stellar Population) method (Bruzual & Charlot, 1993; Kauffmann et al., 2003b; Cid Fernandes et al., 2013; Werle, 2019; Zhang et al., 2019), is accepted to determine contributions of starlight, applied with 224 SSP templates collected from the MILES (Medium resolution INT Library of Empirical Spectra) stellar library (Falcon-Barroso et al., 2011; Knowles et al., 2021) with 32 stellar ages from 0.06Gyrs to 17.78Gyrs and with 7 metallicities from -2.32 to 0.22. After considering the popular regularization method, the pPXF method can give reliable and smoother star-formation histories. Fig. 1 shows the pPXF method determined starlight in the spectra of SDSS J0838.
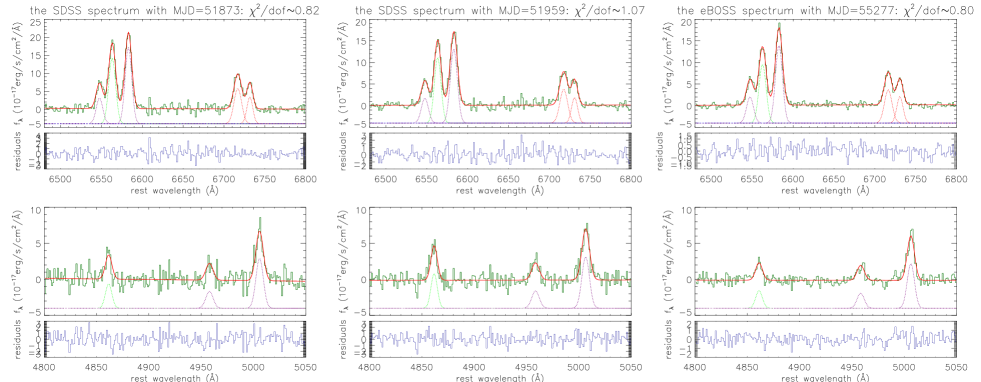
After subtractions of the pPXF method determined starlight, emission lines can be well measured. Here, the narrow emission lines of H, H, [O iii]Å doublet, [N ii]Å doublet and [S ii]Å doublet are mainly considered. One Gaussian component is accepted to describe each narrow emission line. Due to few effects of broad emission lines, there are no server restrictions on the model parameters, besides the following four simple restrictions. First, the flux ratio of [O iii] ([N ii]) doublet is fixed to the theoretical value of 2.99 (Storey & Zeippen, 2000; Dimitrijevic et al., 2007) (3.05 (Dimitrijevic et al., 2022)). Second, the components of H and H have the same redshift and the same line width (in velocity space). Third, the components of each forbidden line doublet have the same redshift and the same line width. Fourth, emission intensity of each Gaussian component is not smaller than zero. Through the Levenberg-Marquardt least-squares minimization technique (the MPFIT package), the best fitting results and the corresponding residuals (line spectrum minus the best fitting results) to the emission lines are shown in Fig. 2. The measured line parameters are listed in Table 1. Here, as the shown besting fitting results to the [O iii] doublets in bottom panels of Fig. 2, it is not necessary to consider extended components in [O iii] doublets as discussed in Greene & Ho (2005); Shen et al. (2011); Zhang (2021) for [O iii] doublet in SDSS J0838.
Based on the measured line parameters, the following three points can be confirmed. First and foremost, more than 90% of the [O iii] emissions are coming from the eBOSS fiber covered emission regions. Considering the SDSS fiber covered area about 2.25 times larger than the area covered by the eBOSS fiber, we can safely accept that the projected distance of [O iii] emission regions should be smaller than the eBOSS fiber radius 1arcsecond (about 2250pc) in SDSS J0838.
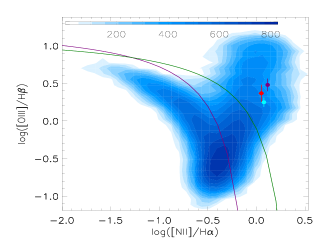
Besides, flux ratios of O3HB ([O iii]Å to narrow H) and N2HA ([N ii]Å to narrow H) are about and for the lines in the SDSS spectrum with MJD=51873, about and for the lines in the SDSS spectrum with MJD=51959, about and for the lines in the eBOSS spectrum with MJD=55277, leading SDSS J0838 to be classified as an AGN based on the dividing lines in the BPT diagram (Baldwin et al., 1981; Kauffmann et al., 2003a; Kewley et al., 2006, 2013, 2019; Kauffmann et al., 2003; Zhang et al., 2020; Zhang, 2022) shown in Fig. 3. Moreover, based on the best fitting results to the emission lines shown in Fig. 2, there are no clues for broad emission lines, indicating SDSS J0838 is a Type-2 AGN. Moreover, from inner region covered in the eBOSS fiber to outer region covered in the SDSS fiber of the [O iii] emissions, the lower O3HB at longer distance is similar as the trends of O3HB on radius shown in Fig. 6 in Liu et al. (2013a) for obscured radio quiet quasars.
Last but not the least, Balmer decrements (flux ratio of narrow H to narrow H) are about , about , about , based on the Balmer lines in the SDSS spectrum with MJD=51873, in the SDSS spectrum with MJD=51959, and in the eBOSS spectrum with MJD=55277, respectively. It is strange that there are different Balmer decrements in narrow emission line regions, between the double observations by the SDSS fiber with MJD=51873 and with MJD=51959, unless there were moving dust clouds. However, if considering corrections of reddening effects on the [O iii] emissions after accepted the intrinsic flux ratio of narrow H to narrow H to be 3.1, intrinsic [O iii] emissions in the SDSS spectrum with MJD=51959 (fiber radius 1.5arcseconds) with would be , apparently smaller than the expected intrinsic [O iii] emissions about in the eBOSS spectrum with MJD=55277 (fiber radius 1arcsecond) with . The unreasonable result indicates the results from the SDSS spectrum with MJD=51959 cannot be accepted. Therefore, the measured line parameters in the SDSS spectrum with MJD=51959 are not considered nor discussed further in the Letter, besides listed in Table 1. Unfortunately, we do not have a reasonable explanation to the strange Balmer decrements in NLRs in the SDSS spectrum with MJD=51959.
Before the end of the subsection, some further descriptions are given on flux calibrations in SDSS spectra which does affect both spectral slope and ratios of well-separated features (such as the Balmer decrement). More detailed descriptions on flux calibrations can be found in https://www.sdss.org/dr16/algorithms/spectrophotometry/. In SDSS DR16, flux calibration processes have been greatly improved, with a new set of stellar templates applied to fit absorption lines of standard stars, leading flux calibration residuals to be reduced by a factor of 2 in the blue spectrograph (3600 to 6000Å). While, expected scatter for stars between fluxes from the images and fluxes synthesized from the calibrated spectra is 4% for the original SDSS and rises to 6% with the smaller BOSS fibers, strongly indicating the flux calibration uncertainties have few effects on our final results. Moreover, by an amount depending on airmass and position on plates, spectra of classified quasars in eBOSS are biased blue with a typical spectral-index offset of 0.4, leading to about 12% change in Balmer decrement in quasars in eBOSS. However, SDSS J0838 is classified as GALAXY, indicating the airmass and position on plates have few effects on our results. Furthermore, as well discussed in Filippenko (1982), atmospheric differential refractions have important effects on flux calibrations. However, near to SDSS J0838, there is a K-5 star (SDSS J083626.48+491230.9) collected with both SDSS spectrum (plate-mjd-fiberid=0443-51873-0609) and eBOSS spectrum (plate-mjd-fiberid=3697-55290-0284) shown in top right panel of Fig. 1 with continuum intensity difference about 5% at 5000Å. Therefore, effects of atmospheric differential refractions have been totally considered in flux calibrations.
3.2 Photometric Variabilities
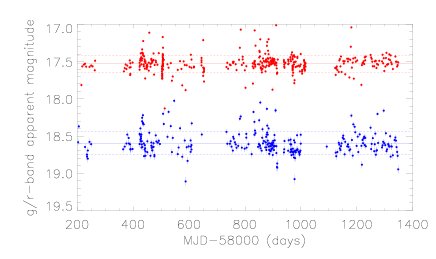
Based on the spectroscopic properties, there are apparent narrow emission lines but no broad Balmer lines. The SDSS J0838 can be identified as a Type-2 AGN. In the subsection, long-term photometric variabilities are applied to re-confirm SDSS J0838 as a Type-2 AGN. The 3years-long g/r-band light curves can be collected from the ZTF (Zwicky Transient Facility) (Bellm et al., 2019; Graham et al., 2019; Dekany et al., 2020) from Mar. 2018 to Aug. 2021, and shown in Fig. 4, well applied to re-confirm that the SDSS J0838 is a Type-2 AGN, not a true Type-2 AGN without hidden central broad emission line regions. More discussions on properties of true type-2 AGN with apparent variabilities can be found in Barth et al. (2014); Li et al. (2015); Pons & Watson (2016); Zhang et al. (2021c).
3.3 NLRs size of SDSS J0838
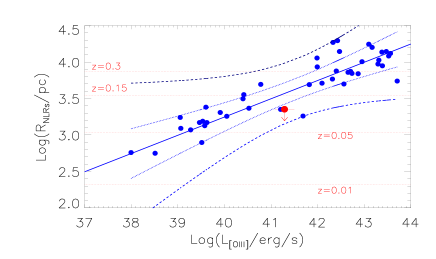
Once SDSS J0838 is well identified as a Type-2 AGN, there are few orientation effects on the NLRs size (the distance between [O iii] emission regions and central black hole) in SDSS J0838. Therefore, the 2250pc (1arcsecond) can be well accepted as the upper limit of NLRs size in SDSS J0838. Considering the reddening corrections with applied, the intrinsic [O iii]Å line luminosity can be estimated as , with the uncertainty of estimated by uncertainty of the applied E(B-V). Then, we can check the properties of NLRs size of SDSS J0838 through the R-L empirical relation for NLRs in AGN, shown in Fig. 5. Considering the 90% and 99.9999% confidence bands to the R-L empirical relation for the NLRs in AGN shown in Fig. 5, we can safely conclude the upper limits of NLRs size in SDSS J0838 is within the 99.9999% confidence interval of the expected results from the empirical R-L relation for NLRs in type-2 AGN.
In the near future, samples of Type-2 AGN and HII galaxies with redshift smaller than 0.35 will be discussed in detailed in our manuscripts in preparation, through the spectra observed by both the SDSS fibers and the eBOSS fibers. As the shown projected distances in Fig. 5 for the 1arcsecond (eBOSS fiber radius) relative to different redshifts, at least three interesting results will be mainly focused on. First, there would probably be some special Type-2 AGN with redshift around 0.3 (with redshift around 0.05) but lower [O iii] line luminosity (stronger [O iii] line luminosity), lying outside of the 99.9999% confidence interval of the empirical R-L relation for NLRs in the type-2 AGN, to provide unique candidates of Type-2 AGN with probably special NLRs properties not consistent with the R-L empirical relation expected results. Second, for common Type-2 AGN and HII galaxies, it will be interesting to check are there different properties in the space of NLRs size versus [O iii] line luminosity, to provide further clues on origin of gas clouds in NLRs of AGN. Third, it will lead to more detected luminous extended narrow emission line regions (sizes larger 10kpcs) which are so rare that any systematic ways to identify them are useful even if many false positives remain.
4 Summaries and Conclusions
The final summaries and conclusions are as follows.
-
•
Due to different fiber diameters between the SDSS fibers and the eBOSS fibers, upper limits of NLRs (especially the [O iii] emission regions) sizes of Type-2 AGN with few effects of orientations could be simply estimated, once the [O iii] emissions are totally covered into the eBOSS fiber, based on similar [O iii] emission intensities in the SDSS spectrum and in the eBOSS spectrum.
-
•
Based on the besting-fitting results to the emission lines after subtractions of pPXF method determined host galaxy contributions in SDSS J0838, there are no apparent broad Balmer emission lines in SDSS J0838, indicating SDSS J0838 is a Type-2 AGN.
-
•
Emission lines can be well measured in the Type-2 AGN SDSS J0838 with spectra observed through both the SDSS fiber and the eBOSS fiber. And more than 90% of [O iii] emissions are covered into the eBOSS fiber, indicating the eBOSS fiber radius can be accepted as the upper limit of NLRs size in SDSS J0838.
-
•
Based on the ZTF 3years-long g/r-band light curves, there are none variabilities in SDSS J0838, to re-confirm SDSS J0838 as a Type-2 AGN, indicating few effects of orientation on the projected NLRs size in SDSS J0838.
-
•
Based on the intrinsic reddening corrected [O iii] line luminosity and the upper limit of NLRs size of SDSS J0838, the upper limit of NLRs size in SDSS J0838 is within the 99.9999% confidence interval of the expected results from the empirical R-L relation for NLRs in type-2 AGN.
Acknowledgements
Zhang gratefully acknowledge the anonymous referee for giving us constructive comments and suggestions to greatly improve the paper. Zhang gratefully thanks the kind grant support from NSFC-12173020. This manuscript has made use of the data from the SDSS projects, http://www.sdss3.org/, managed by the Astrophysical Research Consortium for the Participating Institutions of the SDSS-III Collaborations. This manuscript has made use of the data from the ZTF https://www.ztf.caltech.edu, and made use of the MPFIT package https://pages.physics.wisc.edu/~craigm/idl/cmpfit.html, and of the pPXF code http://www-astro.physics.ox.ac.uk/~mxc/software/#ppxf.
Data Availability
The data underlying this article will be shared on reasonable request to the corresponding author (xgzhang@njnu.edu.cn).
References
- Ahumada et al. (2020) Ahumada, Romina; Prieto, Carlos Allende; Almeida, A, et al., 2020, ApJS, 249, 3
- Baldwin et al. (1981) Baldwin, J. A.; Phillips, M. M.; Terlevich, R., 1981, PASP, 93, 5
- Barth et al. (2014) Barth, A. J.; Voevodkin, A.; Carson, D. J.; Wozniak, P., 2014, ApJ, 147, 12
- Bennert et al. (2006a) Bennert, N.; Jungwiert, B.; Komossa, S.; Haas, M.; Chini, R., 2006a, A&A, 446, 919
- Bennert et al. (2006b) Bennert, N.; Jungwiert, B.; Komossa, S.; Haas, M.; Chini, R., 2006b, A&A, 456, 953
- Bellm et al. (2019) Bellm, E. C.; Kulkarni, S. R.; Barlow, T., et al., 2019, PASP, 131, 068003
- Bruzual & Charlot (1993) Bruzual, A. G.; Charlot, S., 1993, ApJ, 405, 538
- Cappellari (2017) Cappellari, M., 2017, MNRAS, 466, 798
- Cid Fernandes et al. (2013) Cid Fernandes, R.; Perez, E.; García Benito, R.; et al., 2013, A&A, 557, 86
- Dempsey & Zakamska (2018) Dempsey, R.; Zakamska, N. L., 2018, MNRAS, 477, 4615
- Dekany et al. (2020) Dekany, R.; Smith, R. M.; Riddle, R., et al., 2020, PASP, 132, 038001
- Dimitrijevic et al. (2007) Dimitrijevic, M. S.; Popovic, L. C.; Kovacevic, J.; Dacic, M.; Ilic, D., 2007, MNRAS, 374, 1184
- Dimitrijevic et al. (2022) Dojcinovic, I., Kovacevic-Dojcinovic, J., Popovic. L. C., 2022, Accepted in Advances in Space Research, arXiv:2204.10036
- Falcon-Barroso et al. (2011) Falcon-Barroso, J.; Sanchez-Blazquez, P.; Vazdekis, A.; et al., 2001, A&A, 535, 95
- Filippenko (1982) Filippenko, A. V., 1982, PASP, 94, 715
- Fischer et al. (2018) Fischer, T., Kraemer, S., Schmitt, H., et al., 2018, ApJ, 856, 102
- Graham et al. (2019) Graham, M. J.; Kulkarni, S. R.; Bellm, E. C., et al., 2019, PASP, 131, 078001
- Greene & Ho (2005) Greene, J. E.; Ho, L. C., 2005, ApJ, 627, 721
- Greene et al. (2011) Greene, J. E.; Zakamska, N. L.; Ho, L. C.; Barth, A. J., 2011, ApJ, 732, 9
- Hainline et al. (2013) Hainline, K., Hickox, R., Greene, J., et al., 2013, ApJ, 774, 145
- Hainline et al. (2014) Hainline, K., Hickox, R., Greene, J., et al., 2014, ApJ, 787, 65
- Hainline et al. (2016) Hainline, K. N.; Hickox, R. C.; Chen, Chien-Ting, et al., 2016, ApJ, 823, 42
- Kauffmann et al. (2003a) Kauffmann, G.; Heckman, T. M. ; White, S. D. M.; et al., 2003a, MNRAS, 341, 33
- Kauffmann et al. (2003b) Kauffmann, G.; Heckman, T. M.; White, S. D. M.; Charlot, S.; Tremonti, C.; et al., 2003b, MNRAS, 341, 54
- Kauffmann et al. (2003) Kauffmann, G.; Heckman, T. M.; Tremonti, C., et al., 2003, MNRAS, 346, 1055
- Kewley et al. (2006) Kewley, L. J.; Groves, B.; Kauffmann, G.; Heckman, T., 2006, MNRAS, 372, 961 - 976
- Kewley et al. (2013) Kewley, L. J.; Maier, C.; Yabe, K.; Ohta, K.; Akiyama, M.; Dopita, M. A.; Yuan, T., 2013, ApJL, 774, 10 - 15
- Kewley et al. (2019) Kewley, L. J.; Nicholls, D. C.; Sutherland, R. S., 2019, ARA&A, 57, 511
- Knowles et al. (2021) Knowles, A. T.; Sansom, A. E.; Allende Prieto, C.; Vazdekis, A., 2021, MNRAS, 504, 2286
- Li et al. (2015) Li, Y.; Yuan, W.; Zhou, H. Y.; Komossa, S.; Ai, Y. L.; Liu, W. J.; Boisvert, J. H., 2015, ApJ, 149, 75
- Liu et al. (2013a) Liu G., Zakamska, N., Greene, J., et al., 2013a, MNRAS, 430, 2327
- Liu et al. (2013b) Liu G., Zakamska, N., Greene, J., et al., 2013b, MNRAS, 436, 2576
- Pons & Watson (2016) Pons, E.; Watson, M. G., 2016, A&A, 594, 72
- Shen et al. (2011) Shen, Y.; Richards, G. T.; Strauss, M. A.; et al., 2011, ApJS, 194, 45
- Storey & Zeippen (2000) Storey, P. J.; Zeippen, C. J., 2000, MNRAS, 312, 813
- Wada et al. (2018) Wada, K.; Yonekura, K.; Nagao, T., 2018, ApJ, 867, 49
- Werle (2019) Werle, A.; Cid Fernandes, R.; Vale Asari, N.; Bruzual, G.; Charlot, S.; Gonzalez Delgado, R.; Herpich, F. R., 2019, MNRAS, 483, 2382
- Zhang et al. (2019) Zhang, XueGuang; Bao, M., Yuan, Q. R., 2019, MNRAS Letter, 490, 81
- Zhang et al. (2020) Zhang, XueGuang; Feng, Y. Q.; Chen, H.; Yuan, Q. R., 2020, ApJ, 905, 97
- Zhang (2021) Zhang, XueGuang, 2021, ApJ, 909, 16
- Zhang et al. (2021c) Zhang, X. G., Zhang, Y. F., Cheng, P. Z., Wang, B. H., Lv, Y. L., Yu, H. C., 2021c, ApJ accepted, ArXiv:2109.02189
- Zhang (2022) Zhang, XueGuang, 2022, to be published in MNRAS, arXiv: 2111.07688