Perception-Oriented Stereo Image Super-Resolution
Abstract.
Recent studies of deep learning based stereo image super-resolution (StereoSR) have promoted the development of StereoSR. However, existing StereoSR models mainly concentrate on improving quantitative evaluation metrics and neglect the visual quality of super-resolved stereo images. To improve the perceptual performance, this paper proposes the first perception-oriented stereo image super-resolution approach by exploiting the feedback, provided by the evaluation on the perceptual quality of StereoSR results. To provide accurate guidance for the StereoSR model, we develop the first special stereo image super-resolution quality assessment (StereoSRQA) model, and further construct a StereoSRQA database. Extensive experiments demonstrate that our StereoSR approach significantly improves the perceptual quality and enhances the reliability of stereo images for disparity estimation.
1. Introduction
Stereo image super-resolution (StereoSR), aiming to increase the spatial resolution of stereo image pairs, becomes a growing research direction and benefits a lot from the deep-learning. Though remarkable advances have been achieved, convolutional neural network (CNN) based StereoSR methods (Jeon et al., 2018a; Wang et al., 2019; Duan and Xiao, 2019; Yan et al., 2020) are mainly designed to improve the common objective evaluation metrics (peak signal to noise ratio PSNR, structural similarity index SSIM (Zhou Wang et al., 2004)). These StereoSR models are trained with the pixel-level mean square error (MSE) or mean absolute error (MAE) loss. It is well known that MSE/MAE loss forces the restored pixels to be the average of all possible solutions, which leads to high PSNR/SSIM accompanied by poor perceptual performance.
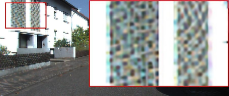
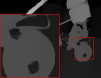
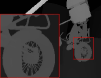
MSE-based SISR (DRN)
StereoSR (PASSR)
GAN-based SISR (SPSR)
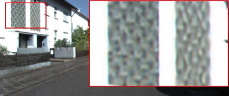
DASSR-GAN
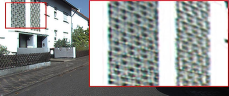
DASSR-IQP
GroundTruth
In single image super-resolution (SISR), perceptual loss (Johnson et al., 2016) and generative adversarial network (GAN) based loss (Ledig et al., 2017; Wang et al., 2018) are proposed to restore better visual effect. Due to the characteristic of GAN, some visual artifacts are generated. As shown in Figure 1, the StereoSR (PASSR (Wang et al., 2019)), MSE-based SISR (DRN (Guo et al., 2020)), and GAN-based SISR (SPSR (Ma et al., 2020)) methods output non-ideal visual effect with over-smooth or unrealistic texture of the wall.
To restore stereo images with better visual experience, we propose to achieve better perceptual StereoSR results by utilizing the feedback from the evaluation of the perceptual quality. Therefore, how to effectively assess the subjective quality of the super-resolved stereo images becomes the key issue for StereoSR, and is still an unsolved problem.
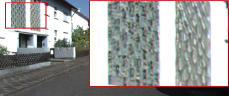
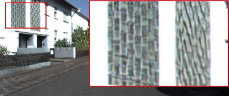
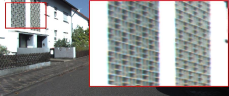
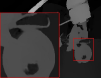
As the most common evaluation metrics, PSNR and SSIM measure the distortion degree of images rather than human visual perception. Figure 2 shows the inconsistency between PSNR/SSIM and subjective quality of two stereo images, super-resolved by a generative adversarial network (GAN) based SR method (middle) and a MSE-based SR method (right). Traditional image quality assessment (IQA) (Kang et al., 2014a; Li et al., 2019b; Yan et al., 2019) and stereo image quality assessment (StereoQA) (Wei et al., 2019) methods focus on distortion types, including JPEG compression, noise, Gaussian blur. These distortions are different from artifacts produced by different super-resolution methods. Therefore, we first propose a special stereo image super-resolution quality assessment (StereoSRQA) model, which focuses on degradation of both image structure, texture, and stereo effect.

PSNR/SSIM
rankMOS

23.336/0.7063
8.5584

24.690/0.7436
5.1142

PSNR/SSIM
rankMOS

20.279/0.6063
9.4014

24.479/0.7678
5.4229
This paper develops a universal perception-oriented StereoSR framework (PSSR), which learns the LR-to-HR mapping by utilizing the feedback information from the proposed quality assessment model. In specific, the proposed PSSR introduces a novel perception-oriented training constraint based on the prior knowledge from the StereoSRQA to enhance the visual quality and the stereo effect of the super-resolved stereo images. Note that, the proposed PSSR can be applied to different StereoSR networks. The main contributions of this paper are summarized as follows:
-
•
We propose a perception-oriented StereoSR framework to restore stereo image with better subjective quality and stereo effect by employing the feedback from the quality assessment of the StereoSR results.
-
•
We develop the first quality assessment model for StereoSR, which not only provides an unified method for assessing subjective StereoSR results, but also accurately constrains the optimization of StereoSR model.
-
•
We construct the first StereoSRQA database (Mid3D_QA), covering a wide range of super-resolved stereo images. The quality score (rankMOS) of each stereo image pair can fairly reflect the comprehensive visual quality and stereo performance.
Extensive experiments demonstrate the proposed PSSR can significantly improve the subjective quality and practicability of the StereoSR results.
2. Related Work
2.1. Super-Resolution
CNN-based Single Image Super-Resolution. Deep learning based methods have dominated the development of SISR. SRCNN (Dong et al., 2014) first introduces convolution neural network (CNN) in SISR to learn LR-to-HR mapping. Based on this work, following deep learning based SISR methods achieve continuous breakthroughs by proposing deeper, wider networks and other novel structures (VDSR (Kim et al., 2016), EDSR (Lim et al., 2017), SRFBN (Li et al., 2019c), DRN (Guo et al., 2020)).
To generate visually pleasing results, Johnson et al. (Johnson et al., 2016) proposed a perceptual loss for SISR, which calculates the feature similarity between SR and HR images based on the VGG network (Simonyan and Zisserman, 2014). SRGAN (Ledig et al., 2017) exploits the generative adversarial network (GAN) to reconstruct more high-frequency details. SPSR (Ma et al., 2020) introduces gradient loss into GAN-based SR method to guide the restoration of image by employing structure prior of gradient map.
Stereo Image Super-Resolution. StereoSR (Jeon et al., 2018a), the first CNN-based StereoSR methods, achieves impressive results by taking the parallax prior of stereo image into consideration. In order to deal with various parallax, PASSRnet (Wang et al., 2019) and PSCASSRnet (Duan and Xiao, 2019) present parallax-based spatial and spatial-channel attention mechanisms, which can extract the correspondence between two views of a stereo pair. To increase the correspondence between two views in a stereo image pair, DASSR (Yan et al., 2020) first proposes to align these two views based on the disparity map before restoring the degraded images.
2.2. CNN-based Image Quality Assessment
Mean Opinion Score (MOS), the common image quality assessment (IQA) score, is obtained by manually scoring to evaluate the image quality from the perspective of the human sense. Many IQA metrics (PSNR, SSIM (Zhou Wang et al., 2004), BRISQUE (Tao et al., 2015), NIQE (Mittal et al., 2013)) use a mathematical model to evaluate the image quality. Deep learning has also promoted the development of IQA. Kang et al. (Kang et al., 2014b) first constructed a no reference (NR) IQA CNN, which does not require the clean image as reference. Li et al. (Li et al., 2019a) exploited ensemble learning and saliency map for stereo image quality assessment. StereoQA-Net (Wei et al., 2019) presents an end-to-end dual-stream interactive network for no-reference stereo image quality assessment.
To evaluate the image quality of SISR methods instead of traditional distortion types (blur, compression, noise, spatial warping), Yan et al. (Yan et al., 2019) proposed a FR SISR quality assessment (SISRQA) CNN for assessing the visual perception of the super-resolved images.
Since generating subjective scores (MOS) requires many human judgement, the size of IQA database is limited. Wu et al. (Wu et al., 2020) built a large-scale IQA database, and synthesized pseudo-MOS to represent the subjective quality of the distorted image by combining several classical IQA methods. RankIQA (Liu et al., 2017) also constructs a large IQA database without human annotation by generating distorted images with image processing transformation of different levels and types.
3. Perception-Oriented StereoSR
This section mainly introduces the proposed perception-oriented StereoSR (PSSR) approach. Note that our goal is not proposing a novel StereoSR network structure but an effective framework, which can constrain the StereoSR network to generate promising visual quality. Therefore, our StereoSR network can adopt any structure, and we choose the DASSR (Yan et al., 2020) in this paper.
Traditional StereoSR methods treat pixel-wise mean square error (MSE) or mean absolute error (MAE) as their optimization objective, which forces the model output images with higher PSNR but over-smooth textures. To have a better understanding of the artifacts in StereoSR problem, we first propose a special quality assessment network for StereoSR, which will be introduced in detail latter. Given a well-trained StereoSRQA model, which is able to predict the perceptual quality of StereoSR results, we consider that an ideal StereoSR network can generate visually promising results with high StereoSRQA scores.
Different from the MSE or MAS loss, which constrains the pixel similarity between the SR and HR images, we aim to constrain the perceptual similarity between the SR and HR images by utilizing the guidance of the StereoSRQA model. In this way, the StereoSR results enjoy promising visual effect, that is close to groundtruth and satisfies the human perception.
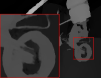
As shown in Figure 3, we propose the image quality perceptual (IQP) constraint to measure the feature similarity between groundtruth and super-resolved stereo images based on the StereoSRQA network. In specific, we design two IQP losses, an image-level IQP loss (), and a feature-level IQP loss (). The two IQP losses calculate the similarity at image and feature levels respectively by feeding the output image and the middle feature from the StereoSR network to the StereoSRQA network.
To obtain the image-level IQP loss (), the super-resolved stereo image and the ground-truth stereo image are passed to the StereoSRQA network. Therefore, two features from the first convolution layers in StereoSRQA network (, ) are obtained. Then, we adopt L2 norm function to calculate the feature similarity between and . In this way, the is able to constrain the StereoSRQA feature of super-resolved stereo image to be similar to that of the groundtruth.
| (1) |
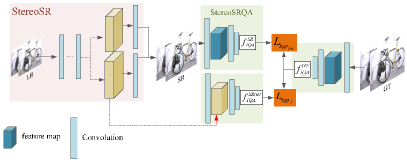
The feature-level IQP loss () constrains features in StereoSR network to be able to reconstruct visually promising image. Specifically, as shown in Figure 3, we replace the first layer feature of StereoSRQA network with the last layer feature of StereoSR network to output middle feature . Then, we also calculate the L2 norm between and .
| (2) |
The feature-level IQP loss is proposed based on following considerations: First, feature extraction of the first layer in StereoSRQA shares same information with the image reconstruction feature of the last convolution layer in StereoSR network, and the feature-level IQP loss enhances the constraint strength of the feature similarity; Second, compared with the three-channel image, the feature map in convolutional neural network generally has more channels and consequently covers more information for image reconstruction. Therefore, optimizing the accuracy based on feature instead of image may enable stronger constraint; Third, since the IQP loss is calculated on the features of CNN, we believe that directly putting the output feature rather than the output image of the StereoSR network to the StereoSRQA network can effectively bridges the gap between image and feature.
In this way, the proposed IQP constraints make sure the feature similarity related to the quality assessment, and further enforce the super-resolved stereo image share similar spatial details with the groundtruth, especially the details that are sensitive for StereoSRQA network to evaluate the visual quality of stereo images. In other words, the super-resolved stereo image has similar visual nature with the groundtruth image. The StereoSR network is trained on the combination of L2 and IQP losses.
| (3) |
where are the weights to balance different losses. We set = 1 and = = 0.1.
By optimizing the StereoSR network with the IQP constraint in training stage, the knowledge from the StereoSRQA network can be back-propagated to the StereoSR network.
4. StereoSR Quality Assessment
Our perceptual-oriented StereoSR method requires a well-performing StereoSRQA model. To our best knowledge, such a model has never been proposed before. This section constructs a model and a database for StereoSRQA.
4.1. StereoSRQA Network
First, we train a StereoSRQA network, which simultaneously considers spatial distortion inside each view and disparity-related quality degradation cross different views, to predict the perceptual quality of different SR results. Different from IQA methods only considering spatial content of image, assessing a stereo image should additionally refer to the correlation between two views. Zhou et al. (Wei et al., 2019) indicated that integrating left and right views by summation and subtraction is consistent with the fusion and disparity information in human visual system (HVS). Inspired by their work, our StereoSRQA network takes the left view, the right view, and their difference map as input. Note that the main purpose of this paper is not proposing a novel QA network, but a suitable QA model that can provide helpful guidance for the StereoSR model. Therefore, our StereoSRQA model can flexibly adopt the structure of different StereoQA models.
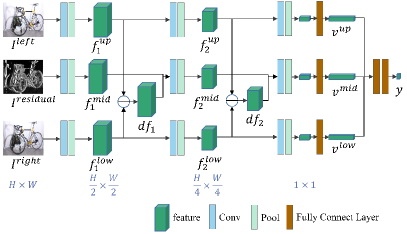
As shown in Figure 4, the proposed StereoSRQA model is composed of three branches with similar structure. The upper and lower branches learn spatial features of two views by taking the left and the right views as input respectively.
The only difference between the middle and the upper/lower branches is the input at the beginning and middle convolution layers. The middle branch extracts the cross-view correlation by working on the difference map of image and the difference map of feature. In specific, we get the residual image of the left and right views, and feed it to the middle branch. Similarly, the difference map can be obtained from the middle features (, ) of all convolution layers in upper and lower branches. The concatenation of and feature of previous convolution layer is regarded as the input of following convolution layer in the middle branch.
After obtaining the vectors (, , ) of three branches, two fully connected layers are processed on the concatenation of , , to predict the final score . Following most IQA methods, our StereoSRQA network is trained with MSE loss between the predicted score and the groundtruth score .
| (4) |
Note that, to calculate the IQP loss, the feature similarity is calculated based on the concatenation of features from the first convolution layers of the three branches.
4.2. StereoSRQA Database with RankMOS
Existing stereo image quality assessment databases (e.g., LIVE Phase I (Moorthy et al., 2013), LIVE Phase II (Chen et al., 2013), NBU (Shao et al., 2013), MCL_3D (Song et al., 2014) etc.) focus on distortion types, including white noise, Gaussian blur, JPEG compressing, which differ from artifacts in SR. Toward this end, we build the first database, named Mid3D_QA, specifically for assessing the quality of StereoSR. The Mid3D_QA database contains 66 HR stereo image pairs from Middlebury stereo database (Jeon et al., 2018b) as reference, and each HR stereo pairs are degraded by 51 distortion types (including 13 SR methods under different scales, blur and noise levels) to generate 3366 (6651) super-resolved versions served as the distorted stereo image pairs. Then, we split 3009 (5951) stereo pairs for training and 357 (751) stereo pairs for testing.
As stated by Wu et al. (Wu et al., 2020), collecting MOS for images by subjective experiment is laborious and needs highly controlled conditions. Therefore, inspired by them, we generate quality scores of distorted images by measuring the quality of the SR results in three aspects to simulate the MOS. Consequently, the labeled data can be leveraged to train a stable StereoSRQA network.
Distorted Images. First, 66 high quality stereo image pairs from Middlebury stereo database (Jeon et al., 2018b) are used as reference. To generate diverse LR stereo images, we downsample the HR stereo images with scale factors (2, 3, 4, 5, 6, 8) by bicubic interpolation, convolve them with Gaussian blur (), add noise with noise level sampled from [0, 30]. Then, a wide range of super-resolved stereo images with diverse visual effects are generated by applying different SR algorithms, including interpolation-based SISR (bicubic, lanczos, nearest neighbor, bilinear), CNN-based SISR (SRCNN (Dong et al., 2014), EDSR (Lim et al., 2017), IDN (Hui et al., 2018), SRMD (Zhang et al., 2018)), GAN-based SISR (SRGAN (Ledig et al., 2017), ESRGAN (Wang et al., 2018)) and StereoSR (StereoSR (Jeon et al., 2018a), PASSRnet (Wang et al., 2019), DASSR (Yan et al., 2020)) methods. There are 51 public SR models for all scales in total. That is, each stereo image pair have 51 SR versions corresponding to 51 distortion levels.
Generation of Subjective Score. Inspired by the generation of the quality assessment data in (Wu et al., 2020) and RankIQA (Liu et al., 2017), we propose to synthesize the quality scores for distorted stereo image pairs by combining existing quality assessment metrics. In order to obtain a comprehensive evaluation score, we measure the quality of the super-resolved stereo image pairs from three aspects: the spatial quality inside single view, the 3D effect, and the practicality.
Supposing denotes the results of -th SR method for -th stereo image pair, where , its quality score is generated by voting, ordering, and merging operations, as specified in Algorithm 1:
1. Voting First, we treat the SISRQA model (Yan et al., 2019) and the StereoQA model (Wei et al., 2019) as two voters to evaluate the spatial and stereo effect respectively. Since the disparity estimation is a significant application of stereo image, we also measure the disparity estimation accuracy to represent the practicality of the super-resolved stereo image pair . The disparity, estimated by the StereoNet (Khamis et al., 2018), is measured with endpoint-error (EPE), which serves as the third voter. Thus, each distorted stereo image pair has three values from three voters, which measure the image quality from different perspectives. The -th voter gives a score value for .
![[Uncaptioned image]](/html/2207.06617/assets/x15.png)
2. Ordering Since quality values from different voters have disparate scales and variation. The quality values need to be normalized into a unified range and re-scaled to the same distribution. Therefore, we adopt relative ranking value instead of the absolute output value as the new score, . In specific, for -th stereo image pair and -th voter, we order scores of all SR versions (51 in total) from worst to best and get rank 1 to rank 51. Rank 1 denotes the worst and rank 51 denotes the best. Then, the rank value of -th distorted stereo image () is assigned to the new score from -th voter.
3. Merging The single ranking score () for current SR stereo image is obtained by averaging the three scores (). We further normalize the and multiply it by 10 to generate the final quality score, .
| (5) |
Note that we do not adopt more CNN-based IQA models. Since existing CNN-based IQA methods are trained on same databases, their predicted scores are similar for same image, especially the rank of the images. Therefore, adopting more CNN-based IQA models makes our rankMOS be closer to results of existing IQA databases and lack concentration to SR features. We consider that a good score should merge more IQAs, that pay attention to different image distortion types.
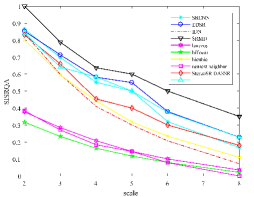
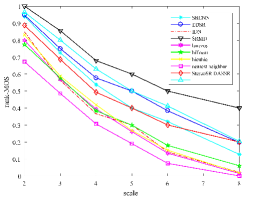
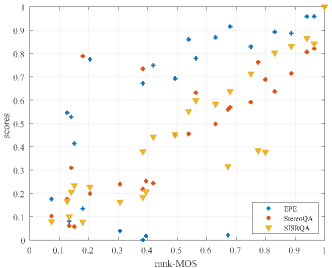
Figure 5 demonstrates distributions of three voters and our generated score (rankMOS) cross different scales. Different lines denote results of different SR methods. As shown in Figure 5, the rankMOS can effectively incorporate three voters with different value ranges and clearly distinguish artifacts among different SR results under different scales. Furthermore, the rankMOS is able to reduce interference of metrics that do not match the subjective quality and better represent the subjective quality.
To more intuitively show the distribution of different voters (StereoQA (Wei et al., 2019), SISRQA (Yan et al., 2019), disparity accuracy (EPE)) relative to the synthetic rankMOS, we normalize these scores and demonstrate relations in Figure 6, where different colors represent different voters. Points with same color correspond to results of different super-resolved stereo image pairs. We see that scores of different quality assessment methods are linearly related to our rankMOS, indicating the synthetic rankMOS is consistent with existing QA methods in terms of reflecting the super-resolution performance of stereo image. In particular, some outliers can be effectively weakened by ranking and averaging operations.
By adopting relative ranking score rather than absolute score, we can extract the preference of different QA methods from different aspects, and unify the scoring standards. The variance of same voter to different images and the standard difference among all voters can also be suppressed.
5. Experiments and Analysis
This section first introduces the databases, evaluation metrics, and other experimental details. Next, ablation experiments are conducted to investigate the contributions of each design in our Perception-oriented StereoSR (PSSR) approaches. Then, our PSSR is compared with state-of-the-arts in terms of quantitative, qualitative, practicability, and running efficiency. Finally, we also report the performance of our proposed StereoSRQA.
5.1. Database and Protocols
By following the StereoSR works (Jeon et al., 2018a; Yan et al., 2020), our PSSR model is trained on 59 stereo image pairs from the Middlebury. Training images are augmented by randomly down-scaling, flipping and rotating. Each mini-batch contains 32 HR stereo image patches of size 120. The StereoSR models are evaluated on the same test sets in (Yan et al., 2020) (Middlebury (Jeon et al., 2018b), Tsukuba (Peris et al., 2012), KITTI2012 (Geiger et al., 2012), KITTI2015 (Mayer et al., 2016), and SceneFlow (Mayer et al., 2016)). All SR models are evaluated with various quality evaluation methods and the StereoSRQA model.
The StereoSRQA models are trained and tested on the Mid3D_QA database, and work on stereo image patches of size 120. In test, suppose a stereo image pair is cropped into patch pairs, the final score is obtained by averaging output scores of all patches. All StereoSRQA models are measured with common correlation criterions, including Pearson linear correlation (PLCC), Spearman rank order correlation coefficient (SROCC), Kendall rank-order correlation coefficient (KROCC), and Root mean square error (RMSE). The higher SROCC, PLCC, KROCC, and lower RMSE denote the better performance.
All models are based on the TensorFlow (Martín et al., 2015) implementation and optimized by Adam (Kingma and Ba, 2014) with 1 = 0.9, 2 = 0.999. The learning rate is 1e-4. We conduct experiments on the machine with Nvidia GTX1080Ti GPU (128G RAM).


+

+

+

+

GT
| PSNR | SSIM | CNNIQA | SFA | StereoQA | StereoSRQA | |
|---|---|---|---|---|---|---|
| 29.830 | 0.9090 | 41.7167 | 36.4495 | 21.0190 | 6.7488 | |
| + | 28.588 | 0.889 | 30.2386 | 29.1817 | 18.3689 | 6.7600 |
| + | 28.993 | 0.8994 | 31.2568 | 30.8602 | 19.6349 | 8.2891 |
| + | 28.855 | 0.8936 | 32.3324 | 27.3597 | 18.7177 | 6.6930 |
| + | 29.099 | 0.9010 | 32.2135 | 28.4532 | 19.6183 | 8.3420 |
| + | 29.270 | 0.9015 | 28.3073 | 27.8893 | 18.2394 | 8.7343 |
| NIQE/PI/StereoSRQA | MSE-based SISR | GAN-based SISR | Stereo SR | Our | HR | ||||||
|---|---|---|---|---|---|---|---|---|---|---|---|
| Database | Scale | Bicubic | EDSR* (Lim et al., 2017) | SRFBN (Li et al., 2019c) | DRN (Guo et al., 2020) | SPSR (Ma et al., 2020) | StereoSR (Jeon et al., 2018a) | PASSRnet (Wang et al., 2019) | DASSR (Yan et al., 2020) | PSSR | |
| Middlebury | 4 | 7.62/7.04/4.89 | 5.32/5.38/7.26 | 5.96/5.76/7.43 | 5.51/3.96/8.16 | 3.37/2.83/8.55 | 5.38/5.24/6.69 | 5.97/5.72/7.22 | 6.35/5.99/6.75 | 4.31/3.88/8.73 | 3.38/2.84/9.20 |
| 3 | 6.74/6.41/6.49 | 5.32/5.38/8.44 | 5.22/4.70/8.65 | - | - | 4.57/3.91/8.09 | - | 5.28/4.78/7.77 | 5.52/3.82/9.31 | ||
| 2 | 5.13/5.21/8.55 | 4.17/3.57/9.17 | 4.59/3.55/9.18 | - | - | 4.38/3.49/9.08 | - | 4.43/3.51/9.16 | 5.97/3.86/9.60 | ||
| KITTI 2012 | 4 | 7.49/6.87/5.10 | 5.84/5.72/7.17 | 5.97/5.73/6.42 | 5.55/4.22/8.11 | 2.49/2.32/8.18 | 4.67/4.09/7.14 | 5.49/5.16/7.55 | 5.54/5.11/7.64 | 3.70/3.44/8.53 | 3.42/2.78/9.43 |
| 3 | 6.67/6.32/6.90 | 5.86/5.72/8.75 | 5.16/4.46/7.97 | - | - | 4.21/3.62/8.64 | - | 5.33/4.59/8.75 | 4.72/3.52/9.38 | - | |
| 2 | 5.04/4.88/8.98 | 4.12/3.17/9.52 | 4.18/3.21/8.71 | - | - | 4.199/3.54/9.22 | - | 4.20/3.22/9.50 | 4.95/3.61/9.78 | - | |
| KITTI 2015 | 4 | 7.42/6.86/5.34 | 5.70/5.88/7.38 | 6.00/5.96/6.55 | 5.55/4.22/8.11 | 2.42/2.47/8.44 | 4.59/4.18/7.31 | 5.39/5.32/7.82 | 5.51/5.31/7.64 | 4.03/3.79/8.69 | 3.239/3.04/9.52 |
| 3 | 7.35/6.75/7.08 | 5.70/5.88/8.98 | 5.24/4.72/8.16 | - | - | 4.10/3.65/8.81 | - | 5.35/4.82/8.96 | 4.84/3.80/9.52 | - | |
| 2 | 5.09/5.10/9.15 | 4.21/3.57/9.66 | 4.31/3.71/8.79 | - | - | 4.11/3.59/9.35 | - | 4.18/3.65/9.64 | 4.56/3.56/9.90 | - | |
| Tsukuba | 4 | 7.58/7.24/4.38 | 6.04/5.68/7.17 | 5.96/5.62/6.40 | 5.65/4.44/8.39 | 4.17/3.89/7.26 | 5.67/5.32/5.64 | 5.73/5.47/7.34 | 5.62/5.28/7.64 | 4.19/3.65/7.76 | 4.87/4.59/8.04 |
| 3 | 6.94/6.54/5.84 | 6.04/5.68/8.00 | 5.54/5.10/7.21 | - | - | 4.61/3.67/6.83 | - | 5.61/5.20/8.10 | 5.20/3.69/8.58 | - | |
| 2 | 5.83/5.58/7.62 | 5.05/4.80/8.34 | 5.06/4.81/7.51 | - | - | 4.35/3.00/7.59 | - | 5.18/4.85/8.27 | 6.01/3.82/8.73 | - | |
| SceneFlow | 4 | 6.99/6.70/4.53 | 5.39/5.05/6.77 | 5.59/5.04/6.94 | 5.26/4.24/7.23 | 2.96/2.14/7.24 | 4.71/3.99/6.38 | 5.36/4.60/6.95 | 5.42/4.80/7.02 | 4.30/3.24/7.76 | 3.10/2.30/8.41 |
| 3 | 7.05/6.23/6.05 | 5.39/5.05/7.86 | 4.99/3.95/7.23 | - | - | 3.96/2.77/6.87 | - | 5.04/4.13/8.16 | 4.93/3.04/8.57 | - | |
| 2 | 5.08/4.90/7.81 | 4.28/3.05/8.50 | 4.15/2.93/7.71 | - | - | 4.10/2.85/7.56 | - | 4.27/2.99/8.44 | 4.49/2.77/8.88 | - | |
5.2. Ablation Study
The ablation study is conducted for 4 SR on the Middlebury database. Table 1 and Figure 7 compare different constraints, used to optimize the StereoSR model. We first train a baseline model (‘’) with the MSE loss only, and then train other models with different combinations of losses. The ‘+ ’ denotes that the model is trained with the MSE and loss.
From Figure 7, the perceptual loss (Johnson et al., 2016) makes the model ‘+ ’ generate some visual artifacts, such as checkerboard textures. We replace our StereoSRQA model with SISRQA model (Yan et al., 2019) to compute the feature similarity for the model ‘+ ’, which has better result on SFA. This is mainly because that enforces the SR results to have better subjective quality on single view, and the NR IQA method (SFA) pays more attention on quality of single view and prefers results of ‘+ ’. In comparison, our ‘+ ’ gets better visual results and StereoSRQA score.


5.3. Comparison with state-of-the-arts
Bicubic Degradation (BI). Existing StereoSR methods work for bicubic degradation (BI), and suppose LR image is generated by bicubic downscaling. Following their steps, we compare our PSSR with MSE-based SISR (EDSR (Lim et al., 2017), SRFBN (Li et al., 2019c), DRN (Guo et al., 2020)), GAN-based SISR (ESRGAN (Wang et al., 2018), SPSR (Ma et al., 2020)), and StereoSR (StereoSR (Jeon et al., 2018a), PASSRnet (Wang et al., 2019), DASSR (Yan et al., 2020)) methods on BI degradation in Table 2. Some methods only public 4 SR models.
Table 2 demonstrates several NR-IQA scores (including NIQE (Mittal et al., 2013), Perceptual Index (PI), the combination of Ma et al. (Ma et al., 2017) and NIQE, and our StereoSRQA model) to evaluate the perceptual performance of different SR results. Lower NIQE/PI and higher StereoSRQA scores denote better subjective quality.
We can observe that some GAN-based SISR methods have lower NIQE/PI than groundtruth, which goes against the common sense. As stated in (Jinjin et al., 2020), though NIQE and PI are relevant to human judgment, they cannot distinguish GAN generated noises and real details and prefer images with obvious unrealistic artifacts produced by GAN-based image restoration methods. Therefore, these perceptual evaluation metrics cannot fairly reflect the subjective SR performance. Even so, our PSSR achieves best NIQE/PI except the GAN-based SPSR, and makes significant progress on StereoSRQA. In Figure 1 and 8, the PSSR remarkably improves the subjective quality and restores clearer textures.
We further adopt more CNN-based quality assessment models, such as two NR-IQA (SFA (Li et al., 2019b), CNNIQA (Kang et al., 2014a)), a NR-StereoQA (Wei et al., 2019), and a FR-SISRQA ((Yan et al., 2019)) models, to evaluate the StereoSR results on Middlebury in Table 3.
To demonstrate the generalization ability of the PSSR, we deploy our perception-oriented training strategy on different SR networks (EDSR, StereoSR). Table 4 compares the results of the SR models trained with their original method and our method respectively.
| EDSR (Lim et al., 2017) | StereoSR (Jeon et al., 2018a) | |||
|---|---|---|---|---|
| w/o | w/ | w/o | w/ | |
| Middlebury | 5.318/5.381/7.26 | 4.322/4.270/8.61 | 5.383/5.229/6.69 | 4.398/4.177/7.71 |
| KITTI 2012 | 5.835/5.723/7.17 | 4.525/4.332/8.38 | 4.669/4.088/7.14 | 3.745/3.100/7.47 |
| KITTI 2015 | 5.700/5.882/7.38 | 4.826/4.783/8.05 | 4.594/4.179/7.31 | 3.968/3.211/8.01 |
| Tsukuba | 6.039/5.681/7.17 | 4.973/4.325/7.46 | 5.666/5.322/5.64 | 4.354/4.261/6.67 |
| SceneFlow | 5.385/5.046/6.77 | 4.767/4.561/7.49 | 4.705/3.994/6.38 | 4.001/3.141/6.78 |
| Bicubic | Our | ||
|---|---|---|---|
| 1.0 | 26.225/0.8461/4.460 | 28.598/0.8946/6.957 | 27.277/0.8726/7.286 |
| 1.6 | 25.633/0.8298/3.934 | 28.783/0.8938/6.360 | 27.344/0.8724/7.105 |
| 2.6 | 24.442/0.7950/2.624 | 26.189/0.8428/4.694 | 27.022/0.8675/6.676 |
| 3.6 | 23.526/0.7661/1.852 | 24.221/0.7876/3.324 | 26.856/0.8491/5.053 |
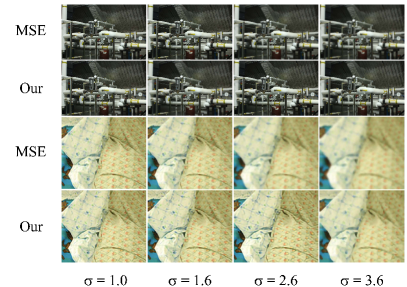
Blur-downscale Degradation (BD) To further illustrate the robustness of our PSSR, we retrain StereoSR models with MSE loss and our training method respectively on a more difficult blur downscale (BD) degradation. The LR image is blurred with 15 15 Gaussian kernel, kernel width . Table 5 and Figure 9 demonstrate the StereoSR results under BD degradation. Both StereoSR models work well for small blur kernel, and the MSE loss can maximize PSNR/SSIM, as we stated. However, the StereoSR model, trained with MSE loss, suffers from significant performance drop facing severe blur. In comparison, our PSSR keeps better subjective performance and even higher PSNR/SSIM for larger blur kernels, demonstrating the is robust to more difficult degradation.
| Database | HR | Bicubic | EDSR* | StereoSR | PASSRnet | DASSR | PSSR |
|---|---|---|---|---|---|---|---|
| A | 2.238 | 3.173 | 2.681 | 2.801 | 2.724 | 2.498 | 2.428 |
| B | 1.098 | 2.075 | 1.585 | 1.516 | 1.588 | 1.432 | 1.477 |
| C | 2.624 | 3.429 | 3.000 | 3.225 | 2.983 | 2.889 | 2.885 |
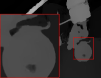
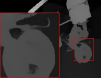
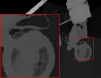
Disparity Estimation Since disparity estimation is a non-negligible application of stereo image, we evaluate the quality of the super-resolved stereo images on disparity estimation task by following (Yan et al., 2020). Table 6 and Figure 10 compare the accuracy of disparity, estimated by StereoNet (Khamis et al., 2018). The PSSR can generate more textures and spatial details, which are valuable for predicting precise disparity.
5.4. Performance of StereoSRQA model
By inputting the degraded stereo image pair or the difference map between the degraded and groundtruth stereo image pair to the StereoSRQA model, we can construct a no-reference and a full-reference StereoSRQA models (‘NRStereoSRQA’, ‘FRStereoSRQA’). Table 7 compares FRStereoSRQA and NRStereoSRQA with both full-reference IQA (PSNR, SSIM (Zhou Wang et al., 2004), IFC (Sheikh et al., 2006), VIF (Sheikh and Bovik, 2006), SISRQA (Yan et al., 2019)) and no-reference IQA (BRISQUE (Tao et al., 2015), SSEQ (Liu et al., 2014), NIQE (Mittal et al., 2013), CNNIQA (Kang et al., 2014a), SFA (Li et al., 2019b), StereoQA (Wei et al., 2019)) methods, including CNN-based or non CNN-based, single image or stereo image based methods. Our FR-StereoSRQA achieves the best performance and is more consistent with human perception.
| RMSE | SROCC | PLCC | KROCC | ||
| FR | PSNR | 1.8865 | 0.7180 | 0.7275 | 0.5385 |
| SSIM (Zhou Wang et al., 2004) | 1.7363 | 0.7610 | 0.7754 | 0.5646 | |
| IFC (Sheikh et al., 2006) | 0.4982 | 0.9820 | 0.9834 | 0.8807 | |
| VIF (Sheikh and Bovik, 2006) | 0.6081 | 0.9738 | 0.9752 | 0.8567 | |
| SISRQA (Yan et al., 2019) | 1.1208 | 0.9146 | 0.9131 | 0.7573 | |
| FRStereoSRQA | 0.3505 | 0.9910 | 0.9918 | 0.9170 | |
| NR | BRISQUE (Tao et al., 2015) | 1.2705 | 0.8881 | 0.8868 | 0.7082 |
| SSEQ (Liu et al., 2014) | 1.4099 | 0.8495 | 0.8585 | 0.6872 | |
| NIQE (Mittal et al., 2013) | 1.3157 | 0.8632 | 0.8781 | 0.6725 | |
| CNNIQA (Kang et al., 2014a) | 1.6205 | 0.8066 | 0.8079 | 0.6078 | |
| SFA (Li et al., 2019b) | 1.6296 | 0.6519 | 0.8054 | 0.5217 | |
| StereoQA (Wei et al., 2019) | 1.8930 | 0.7007 | 0.7252 | 0.5403 | |
| NRStereoSRQA | 0.6249 | 0.9743 | 0.9738 | 0.8624 |
To further illustrate the contribution of our Mid3D_QA, Table 8 compares two SISRQA models and two StereoQA models, which are trained on their original database and our database respectively.
| models | train set | RMSE | SROCC | PLCC | KROCC |
|---|---|---|---|---|---|
| SISRQA (Yan et al., 2019) | Ma et al. (Ma et al., 2017) | 1.1208 | 0.9146 | 0.9131 | 0.7573 |
| SISRQA_mid | Mid3D_QA | 0.7656 | 0.9602 | 0.9598 | 0.8287 |
| StereoQA (Wei et al., 2019) | LIVE Phase I (Moorthy et al., 2013) | 1.8930 | 0.7007 | 0.7252 | 0.5403 |
| StereoQA_mid(our) | Mid3D_QA | 0.6249 | 0.9743 | 0.9738 | 0.8624 |
6. Conclusion
This paper proposes a perception-oriented stereo image super-resolution framework (PSSR). The proposed PSSR improves the visual quality for StereoSR by using the feedback guidance from the assessment of the StereoSR results. To provide accurate guidance, we construct the first quality assessment model (StereoSRQA) for StereoSR, and a special StereoSRQA database (Mid3D_QA). In specific, we propose a image quality perceptual constraint to calculate the feature similarity, used to evaluate the perceptual quality of StereoSR results, between the groundtruth and the super-resolved stereo images. Extensive experiments demonstrate our PSSR achieves state-of-the-art performance in terms of the quality, practicality, and flexibly.
References
- (1)
- Chen et al. (2013) Ming Jun Chen, Che Chun Su, Do Kyoung Kwon, Lawrence K. Cormack, and Alan C. Bovik. 2013. Full-reference quality assessment of stereopairs accounting for rivalry. Image Communication (2013).
- Dong et al. (2014) Chao Dong, Change Loy Chen, Kaiming He, and Xiaoou Tang. 2014. Image Super-Resolution Using Deep Convolutional Networks. IEEE Trans Pattern Anal Mach Intell 38, 2 (2014), 295–307.
- Duan and Xiao (2019) C. Duan and N. Xiao. 2019. Parallax-Based Spatial and Channel Attention for Stereo Image Super-Resolution. IEEE Access 7 (2019), 183672–183679.
- Geiger et al. (2012) A. Geiger, P. Lenz, and R. Urtasun. 2012. Are we ready for autonomous driving? The KITTI vision benchmark suite. In 2012 IEEE Conference on Computer Vision and Pattern Recognition. 3354–3361.
- Guo et al. (2020) Yong Guo, Jian Chen, Jingdong Wang, Qi Chen, Jiezhang Cao, Zeshuai Deng, Yanwu Xu, and Mingkui Tan. 2020. Closed-loop Matters: Dual Regression Networks for Single Image Super-Resolution. In IEEE Conference on Computer Vision and Pattern Recognition.
- Hui et al. (2018) Zheng Hui, Xiumei Wang, and Xinbo Gao. 2018. Fast and Accurate Single Image Super-Resolution via Information Distillation Network. In Proceedings of the IEEE Conference on Computer Vision and Pattern Recognition. 723–731.
- Jeon et al. (2018a) D. S. Jeon, S. Baek, I. Choi, and M. H. Kim. 2018a. Enhancing the Spatial Resolution of Stereo Images Using a Parallax Prior. In 2018 IEEE/CVF Conference on Computer Vision and Pattern Recognition. 1721–1730.
- Jeon et al. (2018b) D. S. Jeon, S. Baek, I. Choi, and M. H. Kim. 2018b. Enhancing the Spatial Resolution of Stereo Images Using a Parallax Prior. In 2018 IEEE/CVF Conference on Computer Vision and Pattern Recognition. 1721–1730.
- Jinjin et al. (2020) Gu Jinjin, Cai Haoming, Chen Haoyu, Ye Xiaoxing, Jimmy S. Ren, and Dong Chao. 2020. PIPAL: A Large-Scale Image Quality Assessment Dataset for Perceptual Image Restoration. In European Conference on Computer Vision.
- Johnson et al. (2016) Justin Johnson, Alexandre Alahi, and Fei Fei Li. 2016. Perceptual Losses for Real-Time Style Transfer and Super-Resolution. In European Conference on Computer Vision.
- Kang et al. (2014a) Le Kang, Peng Ye, Yi Li, and David Doermann. 2014a. Convolutional Neural Networks for No-Reference Image Quality Assessment. In IEEE Conference on Computer Vision and Pattern Recognition.
- Kang et al. (2014b) Le Kang, Peng Ye, Yi Li, and David Doermann. 2014b. Convolutional Neural Networks for No-Reference Image Quality Assessment. In IEEE Conference on Computer Vision and Pattern Recognition.
- Khamis et al. (2018) Sameh Khamis, Sean Fanello, Christoph Rhemann, Adarsh Kowdle, Julien Valentin, and Shahram Izadi. 2018. Stereonet: Guided hierarchical refinement for real-time edge-aware depth prediction. In Proceedings of the European Conference on Computer Vision. 573–590.
- Kim et al. (2016) Jiwon Kim, Jung Kwon Lee, and Kyoung Mu Lee. 2016. Accurate Image Super-Resolution Using Very Deep Convolutional Networks. In Computer Vision and Pattern Recognition. 1646–1654.
- Kingma and Ba (2014) Diederik P Kingma and Jimmy Ba. 2014. Adam: A Method for Stochastic Optimization. arXiv: Learning (2014).
- Ledig et al. (2017) C. Ledig, L. Theis, F. Huszár, J. Caballero, A. Cunningham, A. Acosta, A. Aitken, A. Tejani, J. Totz, Z. Wang, and W. Shi. 2017. Photo-Realistic Single Image Super-Resolution Using a Generative Adversarial Network. In 2017 IEEE Conference on Computer Vision and Pattern Recognition. 105–114.
- Li et al. (2019b) D. Li, T. Jiang, W. Lin, and M. Jiang. 2019b. Which Has Better Visual Quality: The Clear Blue Sky or a Blurry Animal? IEEE Transactions on Multimedia 21, 5 (2019), 1221–1234.
- Li et al. (2019a) S. Li, X. Han, and Y. Chang. 2019a. Adaptive Cyclopean Image-Based Stereoscopic Image-Quality Assessment Using Ensemble Learning. IEEE Transactions on Multimedia 21, 10 (2019), 2616–2624.
- Li et al. (2019c) Z. Li, J. Yang, Z. Liu, X. Yang, G. Jeon, and W. Wu. 2019c. Feedback Network for Image Super-Resolution. In 2019 IEEE/CVF Conference on Computer Vision and Pattern Recognition. 3862–3871.
- Lim et al. (2017) Bee Lim, Sanghyun Son, Heewon Kim, Seungjun Nah, and Kyoung Mu Lee. 2017. Enhanced deep residual networks for single image super-resolution. In The IEEE conference on computer vision and pattern recognition workshops, Vol. 1. 4.
- Liu et al. (2014) Lixiong Liu, Bao Liu, Hua Huang, and Alan Conrad Bovik. 2014. No-reference image quality assessment based on spatial and spectral entropies. Signal Processing: Image Communication (2014).
- Liu et al. (2017) X. Liu, J. Van De Weijer, and A. D. Bagdanov. 2017. RankIQA: Learning from Rankings for No-Reference Image Quality Assessment. In IEEE International Conference on Computer Vision. 1040–1049.
- Ma et al. (2020) Cheng Ma, Yongming Rao, Yean Cheng, Ce Chen, Jiwen Lu, and Jie Zhou. 2020. Structure-Preserving Super Resolution with Gradient Guidance. In Proceedings of the IEEE Conference on Computer Vision and Pattern Recognition.
- Ma et al. (2017) Chao Ma, Chih Yuan Yang, Xiaokang Yang, and Ming Hsuan Yang. 2017. Learning a No-Reference Quality Metric for Single-Image Super-Resolution. Computer Vision & Image Understanding 158 (2017), 1–16.
- Martín et al. (2015) Abadi Martín, Agarwal Ashish, Barham Paul, Brevdo Eugene, Chen Zhifeng, Citro Craig, S. Corrado Greg, Davis Andy, Dean Jeffrey, Devin Matthieu, Ghemawat Sanjay, Goodfellow Ian, Harp Andrew, Irving Geoffrey, Isard Michael, Jia Yangqing, Jozefowicz Rafal, Kaiser Lukasz, Kudlur Manjunath, Levenberg Josh, Mané Dandelion, Monga Rajat, Moore Sherry, Murray Derek, Olah Chris, Schuster Mike, Shlens Jonathon, Steiner Benoit, Sutskever Ilya, Talwar Kunal, Tucker Paul, Vanhoucke Vincent, Vasudevan Vijay, Viégas Fernanda, Vinyals Oriol, Warden Pete, Wattenberg Martin, Wicke Martin, Yu Yuan, and Zheng Xiaoqiang. 2015. TensorFlow: Large-Scale Machine Learning on Heterogeneous Systems.
- Mayer et al. (2016) N. Mayer, E. Ilg, P. Häusser, P. Fischer, D. Cremers, A. Dosovitskiy, and T. Brox. 2016. A Large Dataset to Train Convolutional Networks for Disparity, Optical Flow, and Scene Flow Estimation. In IEEE International Conference on Computer Vision and Pattern Recognition. http://lmb.informatik.uni-freiburg.de/Publications/2016/MIFDB16 arXiv:1512.02134.
- Mayer et al. (2016) N. Mayer, E. Ilg, P. Husser, P. Fischer, D. Cremers, A. Dosovitskiy, and T. Brox. 2016. A Large Dataset to Train Convolutional Networks for Disparity, Optical Flow, and Scene Flow Estimation. In 2016 IEEE Conference on Computer Vision and Pattern Recognition. 4040–4048.
- Mittal et al. (2013) A. Mittal, R. Soundararajan, and A. C. Bovik. 2013. Making a “Completely Blind” Image Quality Analyzer. IEEE Signal Processing Letters 20, 3 (2013), 209–212.
- Moorthy et al. (2013) Anush Krishna Moorthy, Che Chun Su, Anish Mittal, and Alan Conrad Bovik. 2013. Subjective evaluation of stereoscopic image quality. Signal Processing Image Communication 28, 8 (2013), 870–883.
- Peris et al. (2012) M. Peris, S. Martull, A. Maki, Y. Ohkawa, and K. Fukui. 2012. Towards a simulation driven stereo vision system. In Proceedings of the 21st International Conference on Pattern Recognition. 1038–1042.
- Shao et al. (2013) Feng Shao, Weisi Lin, Shanbo Gu, Gangyi Jiang, and Thambipillai Srikanthan. 2013. Perceptual Full-Reference Quality Assessment of Stereoscopic Images by Considering Binocular Visual Characteristics. IEEE Transactions on Image Processing A Publication of the IEEE Signal Processing Society 22, 5 (2013), 1940–1953.
- Sheikh and Bovik (2006) H. R. Sheikh and A. C. Bovik. 2006. Image information and visual quality. IEEE Transactions on Image Processing 15, 2 (2006), 430–444.
- Sheikh et al. (2006) Hamid Rahim Sheikh, Member, IEEE, Alan Conrad Bovik, and Fellow. 2006. An Information Fidelity Criterion for Image Quality Assessment Using Natural Scene Statistics. IEEE Transactions on Image Processing 14, 12 (2006), 2117–2128.
- Simonyan and Zisserman (2014) Karen Simonyan and Andrew Zisserman. 2014. Very Deep Convolutional Networks for Large-Scale Image Recognition. Computer Science (2014).
- Song et al. (2014) Rui Song, Hyunsuk Ko, and C. C. Jay Kuo. 2014. MCL-3D: a database for stereoscopic image quality assessment using 2D-image-plus-depth source. Journal of Information ence & Engineering 31, 5 (2014), 1593–1611.
- Tao et al. (2015) Sun Tao, Xingjie Zhu, J. S. Pan, Jiajun Wen, and Fanqiang Meng. 2015. No-Reference Image Quality Assessment in Spatial Domain. Advances in Intelligent Systems & Computing 329 (2015), 381–388.
- Wang et al. (2019) Longguang Wang, Yingqian Wang, Zhengfa Liang, Zaiping Lin, Jungang Yang, Wei An, and Yulan Guo. 2019. Learning parallax attention for stereo image super-resolution. In Proceedings of the IEEE Conference on Computer Vision and Pattern Recognition. 12250–12259.
- Wang et al. (2018) Xintao Wang, Ke Yu, Shixiang Wu, Jinjin Gu, Yihao Liu, Chao Dong, Chen Change Loy, Yu Qiao, and Xiaoou Tang. 2018. ESRGAN: Enhanced Super-Resolution Generative Adversarial Networks. CoRR abs/1809.00219 (2018).
- Wei et al. (2019) Wei, Zhou, Zhibo, Chen, and Weiping. 2019. Dual-Stream Interactive Networks for No-Reference Stereoscopic Image Quality Assessment. IEEE transactions on image processing : a publication of the IEEE Signal Processing Society (2019).
- Wu et al. (2020) J. Wu, J. Ma, F. Liang, W. Dong, G. Shi, and W. Lin. 2020. End-to-End Blind Image Quality Prediction With Cascaded Deep Neural Network. IEEE Transactions on Image Processing 29 (2020), 7414–7426.
- Yan et al. (2019) B. Yan, B. Bare, C. Ma, K. Li, and W. Tan. 2019. Deep Objective Quality Assessment Driven Single Image Super-Resolution. IEEE Transactions on Multimedia 21, 11 (2019), 2957–2971.
- Yan et al. (2020) B. Yan, C. Ma, B. Bare, W. Tan, and S. C. H. Hoi. 2020. Disparity-Aware Domain Adaptation in Stereo Image Restoration. In IEEE/CVF Conference on Computer Vision and Pattern Recognition. 13176–13184.
- Zhang et al. (2018) Kai Zhang, Wangmeng Zuo, and Lei Zhang. 2018. Learning a single convolutional super-resolution network for multiple degradations. IEEE Conference on Computer Vision and Pattern Recognition, 3262–3271.
- Zhou Wang et al. (2004) Zhou Wang, A. C. Bovik, H. R. Sheikh, and E. P. Simoncelli. 2004. Image quality assessment: from error visibility to structural similarity. IEEE Transactions on Image Processing 13, 4 (2004), 600–612.