[orcid=0000-0003-4401-5506] \cormark[1] url]https://www.wkiri.com/ \creditConcept, Data labeling, Candidate review infrastructure, Writing
Initial impact catalog, Candidate review, HiRISE follow-up imaging, Measurements, Data analysis, Writing
Globally scalable classifier deployment, Candidate database design and implementation, Experimental results, Writing
Machine learning classifier training, Experimental results
Candidate review, Analysis
Candidate review, HiWish HiRISE follow-up requests, Measurements, Analysis
Candidate review, Analysis, Writing
Candidate review, HiWish HiRISE follow-up requests, Measurements
1]organization=Jet Propulsion Laboratory, California Institute of Technology, addressline=4800 Oak Grove Drive, city=Pasadena, state=CA, postcode=91109, country=USA
2]organization=Brown University, addressline=Earth, Environmental, and Planetary Science, city=Providence, state=RI, postcode=02912, country=USA
3]organization=ETH Zurich, addressline=Engineering Geology, city=Zurich, postcode=8092, country=CH
[1]Corresponding author
Using Machine Learning to Reduce Observational Biases When Detecting New Impacts on Mars
Abstract
The current inventory of recent (fresh) impacts on Mars shows a strong bias towards areas of low thermal inertia. These areas are generally visually bright, and impacts create dark scours and rays that make them easier to detect. It is expected that impacts occur at a similar rate in areas of higher thermal inertia, but those impacts are under-detected. This study investigates the use of a trained machine learning classifier to increase the detection of fresh impacts on Mars using CTX data. This approach discovered new fresh impacts that have been confirmed with follow-up HiRISE images. We found that examining candidates partitioned by thermal inertia (TI) values, which is only possible due to the large number of machine learning candidates, helps reduce the observational bias and increase the number of known high-TI impacts.
keywords:
Mars, surface \sepImpact processes \sepCratering \sepImage processing \sepExperimental techniquesMachine learning classifiers can help increase the detection of rare fresh impacts on Mars.
The most-confident machine learning candidates preserve observational biases in the manually identified training examples.
Analyzing candidates partitioned by thermal inertia bins reduces observational bias.
1 Introduction
New impact craters continue to appear on the surface of Mars. The steadily growing body of observational data acquired by orbital instruments has enabled the confident identification of more than a thousand dated recent (“fresh”) impacts, which are defined as craters that are constrained by images of the same area before and after the impact occurred. Newly forming craters were first discovered on Mars by Malin et al. (2006), who performed an imaging campaign with the Mars Global Surveyor Mars Orbiter Camera (MOC) to find twenty new impacts by manually comparing repeat images of the same areas. These techniques have continued with the Context Camera (CTX) (Malin et al., 2007) on the Mars Reconnaissance Orbiter for the last years (Daubar et al., 2013, 2022). Newly acquired CTX images are manually searched for distinctive features resembling past discoveries of new impacts, and then previous imagery from various orbiters is compared to find the most recent image in which the feature was absent. If one is found, a follow-up high-resolution image is requested from the High Resolution Imaging Science Experiment (HiRISE) on MRO (McEwen et al., 2007). These new craters have been rich sources of new information about Mars, for example studies of subsurface ice exposures (Byrne et al., 2009; Dundas et al., 2014, 2021) and mineralogy (Viviano et al., 2019), statistics (Daubar et al., 2013; Williams et al., 2014; Hartmann and Daubar, 2017; Daubar et al., 2019) and morphology (Daubar et al., 2014) of current martian cratering, and investigations of the dust-related albedo features around the new craters (Burleigh et al., 2012; Daubar et al., 2016; Bart et al., 2019).

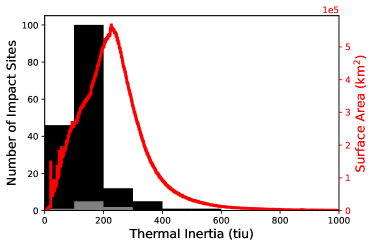
One perplexing aspect of the current inventory of known fresh impacts on Mars (Daubar et al., 2022) is that their properties are not consistent with the global properties of Mars. For example, Figure 1 compares the distribution of thermal inertia values for known fresh impacts versus the rest of Mars. Thermal inertia characterizes the ability of a material to store and retain heat. High thermal inertia on Mars corresponds to rocky terrain, while low thermal inertia corresponds to dusty areas. In this figure, known impact craters within 60 degrees of the equator are binned by thermal inertia values derived from the Thermal Emission Imaging System (THEMIS) (Christensen et al., 2004) thermal inertia map (Edwards et al., 2011), using the Thermal Emission Spectrometer (TES) (Christensen et al., 2001) thermal inertia values (Putzig and Mellon, 2007) for regions where the THEMIS values are unavailable. Stacked bars show a breakdown of the impacts by appearance in comparison to the overall distribution of surface area by thermal inertia, similarly derived from the TES and THEMIS maps. The known population of fresh impacts shows a decided bias towards areas of lower thermal inertia. These regions are often visually bright due to sandy or dusty composition, and fresh impacts often create dark scour marks and rays that stand out to the human eye. It is expected that impacts are also occurring at the same rate in darker areas with higher thermal inertia, but to date they are under-represented in the inventory of known impacts. Effectively, rather than cataloguing all fresh impacts on Mars, existing detection efforts have dominantly identified dark-on-bright impacts that occur in areas of relatively low thermal inertia. This unintentional observational bias limits knowledge of the true impact cratering rate and affects analyses that rely on crater activity, such as estimating surface age (Hartmann and Neukum, 2001; Ivanov, 2001; Hartmann, 2005). As one possible adverse result, under-counting impacts in high thermal inertia areas could lead to a cratering chronology that over-estimates surface ages.
The goal of this work is to explore methods for correcting or reducing this bias to provide a more complete inventory of fresh impacts on Mars. There are many reasons why impacts in high thermal inertia (TI) areas could be overlooked, including their different appearance (often bright-on-dark instead of dark-on-bright), smaller or missing blast rays, or human oversight or fatigue. We hypothesize that training a machine learning classifier on known examples of low-TI and high-TI impacts could help improve consistency in detection and coverage of all impacts.
The contributions of this paper are (1) the addition of impacts to the current inventory of confirmed fresh impacts on Mars, with five more waiting for HiRISE imaging, (2) characterization of key differences in detections found by humans versus those found by a machine learning algorithm, (3) reduction in observational bias achieved by separately analyzing detections from different thermal inertia settings, and (4) discussion of the implications of these findings for the use of machine learning to aid efforts to catalog features of interest on Mars and other planetary surfaces. Section 2 describes related work and the methods used in this study, Section 3 presents and analyzes the results, and conclusions are summarized in Section 4. An important lesson from this study is that the highest-confidence candidates found via machine learning exhibited the same observational bias inherent in the existing catalog, but the large number of candidates found globally enabled an analysis by thermal inertia value that reduced this bias.
2 Methods: Detecting fresh impacts with machine learning
Machine learning methods are increasingly employed to assist in the analysis of remote sensing data for planetary science and exploration. Examples include the classification of lunar soils using reflectance spectra (Kodikara and McHenry, 2020), the classification of terrain types in Mars orbital images to inform landing site selection (Ono et al., 2016; Barrett et al., 2022), the classification of rover and orbital images to enable content-based search of the Planetary Data System image archives (Wagstaff et al., 2018, 2021) or map features such as volcanic rootless cones and transverse aeolian ridges (Palafox et al., 2017) and rockfalls on Mars (Bickel et al., 2020b) and the Moon (Bickel et al., 2020a), and the identification of novel features in rover images to accelerate discovery (Kerner et al., 2020).
The current study investigates whether machine learning can also be effective in detecting fresh impacts in CTX images with the goal of increasing coverage and reducing observational bias in the catalog. Several previous investigations have employed machine learning methods to identify large craters; see DeLatte et al. (2019) for a historical overview and discussion of key issues. Silburt et al. (2019) trained a U-Net convolutional neural network (CNN) to detect craters in lunar digital elevation map images at a resolution of 118 m/pixel, and Jia et al. (2021) improved the U-Net’s performance with an attention-aware model. Wilhelm et al. (2020) labeled over CTX image cutouts into geomorphic surface classes, including “crater,” then compared the classification performance of six convolutional neural networks. Lagain et al. (2021) adapted a CNN that was trained on large craters in THEMIS data to apply to smaller craters in CTX images and used it to determine crater populations and infer the age of the ejecta blankets of ten large craters on Mars. However, none of these classifiers were trained to detect fresh impacts, which differ visually from the “crater” class in that fresh impacts often have scour marks and rays and may be so small that the crater itself is not resolved.
2.1 Training and evaluation of the machine learning classifier
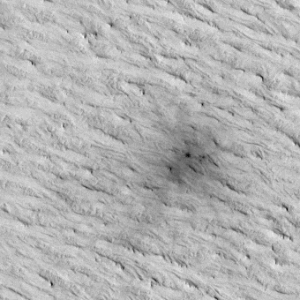
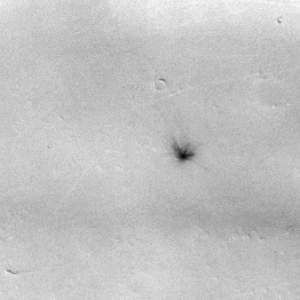
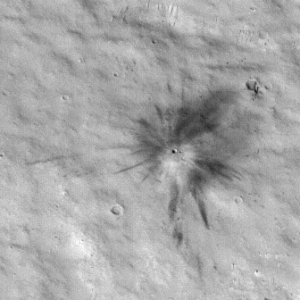
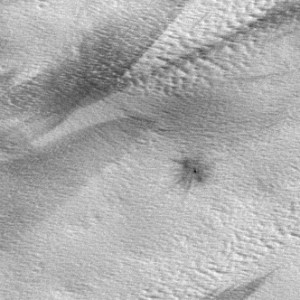
We trained a convolutional neural network to classify CTX sub-images (windows) as containing a fresh impact or not. The windows are small sections of CTX source images that span pixels ( km). This size was chosen to allow the detection of fresh impacts on the scale of a few hundred meters while including some surrounding context. We constructed a training set using an existing catalog of date-constrained fresh impacts that have confirmation from a HiRISE follow-up image (Daubar et al., 2013, 2020, 2022). We did not use examples from crater databases such as that of (Robbins and Hynek, 2012) to train the fresh impact classifier due to (1) the enormous difference in scale (e.g., the Robbins database contains craters larger than 1 km in diameter, but most fresh impacts are only a few meters in diameter) and (2) fresh impacts are primarily visible due to the surrounding albedo pattern; the craters themselves are not generally resolved. For these reasons, training on larger craters, which have a very different visual appearance, would likely be detrimental to the search for fresh impacts. Positive examples were centered on the location of a known fresh impact. We manually reviewed each such CTX image to exclude those that pre-dated the impact’s appearance or did not include the impact due to fading over time or poor localization. Negative examples were obtained from a spatially uniform random sampling of CTX images across the surface of Mars. In all, we obtained positive and negative images (total ); examples are shown in Figure 2, and the full data set can be downloaded at https://zenodo.org/record/5523886.
We randomly separated the CTX images into 90% training ( ) and 10% held-out data ( ). We increased the number of training examples by applying standard image augmentation techniques to modify the image without changing its class. Each training image was flipped horizontally and vertically; rotated by a random choice of 90, 180, or 270 degrees; adjusted by a minor (random) change to brightness, contrast, saturation, and hue; and blurred with a Gaussian filter with radius 2. In total, we employed images ( positive and negative) images to train the classifier.
We used the state-of-the-art Inception-V3 image classifier (Szegedy et al., 2015), which was originally trained on million images from the ImageNet data set (Russakovsky et al., 2015). CNN classifiers do not require the pre-specification of relevant features and instead automatically identify image properties that correlate with the classes of interest. We adapted Inception-V3 to classify fresh impacts in CTX images by performing additional training (“fine-tuning”) using the positive and negative CTX examples. The fine-tuning approach is generally more effective than training a randomly initialized neural network from scratch, since the pre-trained network has already learned general image properties from the much larger original data set. Inception-V3 employs processing layers that include efficiency improvements to reduce the number of weights required and therefore the training time. To fine-tune this model for fresh impact detection, we used the PyTorch library (Paszke et al., 2019) with the Adam optimizer and cross entropy loss function. Other parameters include a starting learning rate of with a decay of every steps, batch size of , and epochs of training. The held-out set was used to calibrate the classifier’s predictions (posterior probability of a fresh impact) using bias-corrected temperature scaling (Alexandari et al., 2020). Calibration compensates for classifier over- or under-confidence by adjusting (rescaling) the output class probabilities so that they correspond to true occurrence rates in the held-out data set. The calculated scaling parameter (temperature) was with class bias terms of (negative, non-impact) and (positive, fresh impact). The calibration process reduced the Expected Calibration Error (Naeini et al., 2015) from to in the posterior probability values. The classifier achieved an accuracy of % (with precision , recall , and F1-score ) on the held-out data set.
2.2 Deployment of machine learning classifier to the CTX archive
We deployed the trained classifier on the entire CTX archive, excluding images from the Mars Orbit Insertion and Cruise phases of the mission, as well as a few observations that caused issues because they were lacked valid geolocation information (e.g., calibration images). The resulting set contained observations acquired between September 27, 2006 and December 1, 2019. We used the Gattaca supercomputer at JPL to process the observations in parallel using between and CPU cores over a period of about one week. Each observation was split into overlapping square windows 300 pixels in size, sliding 75 pixels at a time in each direction. The classifier was evaluated on each window, for a total of approximately 2 billion individual classifications. The total computation time across all cores was roughly 12 CPU-years.
After generating classification posterior probabilities with the classifier for each window, the full set of classifications was ranked in descending order of the probability that a fresh impact was present. Within the CTX archive, there may be multiple observations of the same location obtained at different times. Therefore, for each classification in the descending list, we grouped other windows that were found within 600 m of the classified window into a single “candidate” for manual inspection. Each window is associated with only a single candidate to avoid duplication.
The list of candidates was filtered for further analysis. First, informed by previous studies (Dundas et al., 2014; Daubar et al., 2016), we only considered candidates within the latitude range from to 60 degrees. High-latitude impact craters disappear quickly due to seasonal processes, and there is a lack of reliable training examples due to their rarity, seasonally poor illumination conditions, and seasonal changes in surface appearance due to ice and frost. Furthermore, we filtered out high-probability candidates for which there was not a least one non-detection (an overlapping window with a classification score below 0.5) within the candidate set that was acquired earlier. This excludes candidates for which the CTX data likely does not contain sufficient temporal coverage of the impact location to constrain its date of formation (i.e., an image the pre-dates the impact). After the filters were applied, a list of the highest-confidence candidates was generated for review.
2.3 Manual review of machine learning candidates
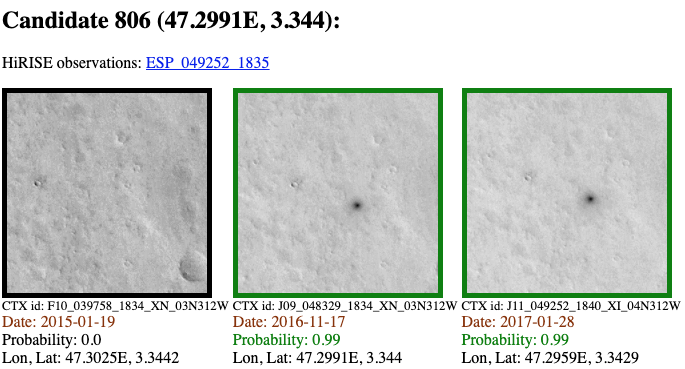
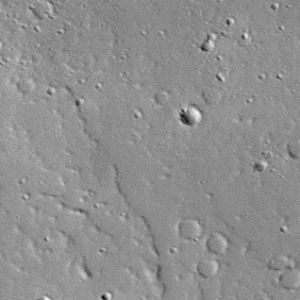
We performed a manual review of the top candidates identified by the classifier. The candidates were ranked in descending order of posterior probability as reported by the classifier; more than one million candidates had probability . To facilitate this process, we generated a web page that provided information for each candidate, including all images of the candidate site (including repeat CTX observations, if available). We included only candidates whose first CTX observation was a non-detection (negative) to allow us to constrain the time of formation. Reviewing the complete time series of the location helps determine whether it is a valid fresh impact. Figure 3 shows an example candidate that consists of three CTX observations of the same location. Observations in which the classifier predicts a fresh impact probability of at least are automatically outlined in green. The first observation does not contain an impact and was given a probability of , indicating that this impact occurred between January 19, 2015 and November 17, 2016. The review page also includes a link to any overlapping HiRISE observation(s) that may already exist, enabling the reviewer to easily check for the presence of the impact at the time the HiRISE observation was collected.
The review process for each candidate proceeded as follows. Reviewers first examined the set of detection images for any newly appearing albedo features. In some cases, the classifier mistakenly assigned high probability to features that are not impacts, such as shadows from surface topography, dust devil tracks, wind or slope streaks, or other surface changes. Reviewers classified any such incorrect detections as “non-impact.” Impacts that appeared to be old and could not be date-constrained with a CTX image of the same location lacking the feature were designed “old impact.” Otherwise, reviewers checked for the earliest non-detection to constrain the date of formation. This enables us to determine with confidence that the feature is a “fresh” impact (occurred within the CTX operational period). If no preceding non-detection was available, but the albedo feature resembled a fresh impact blast zone, reviewers classified the candidate as an “undateable fresh impact.” Dateable fresh impacts were further divided into “known fresh impact” (already in the catalog) or “new fresh impact” (not previously known). In some cases, the classifier generated duplicate candidates from different observation dates that were not grouped due to localization errors. Reviewers marked these as “duplicate.” Reviewers also added other notes to aid interpretation where useful. Four reviewers contributed to the assessment of the top candidates to split up the work. At the beginning of the review process, all reviewers examined the same set of roughly candidates, and any disagreements were discussed and resolved to ensure consistent evaluation of the remaining candidates.
For each candidate that was marked as “new fresh impact” (not previously known), we entered HiWish requests (https://www.uahirise.org/hiwish/; Chojnacki et al. (2020)) to obtain a high-resolution view of the same location for confirmation of the presence of an impact and measurements of crater characteristics. These targets were acquired by HiRISE between October 2020 and December 2021, resulting in 0.25 m/px images of each site.
2.4 Measurements of fresh impact features
To examine the ML-detected new impacts in the context of the broader human-detected catalog presented by Daubar et al. (2022), the same characteristics were measured for each ML-detected impact site. Specifically, we examined the follow-up HiRISE images of promising impact sites to catalog their features, including whether they contained a single crater or cluster of craters. We also characterized the albedo pattern around the impact site (diffuse halo, linear or arcuate rays, dark-, light- or dual-toned blast zone in comparison to the surroundings). Crater diameters were measured following the methodology of Daubar et al. (2013, 2019, 2022), using the CraterTools add-in for the Java Mission-planning and Analysis for Remote Sensing, JMARS (Christensen et al., 2009). For impacts that consisted of crater clusters, the individual diameters of the craters in the cluster were combined into an effective diameter that approximates the diameter that would have occurred had the impactor not fragmented in the atmosphere. The effective diameter was calculated as
| (1) |
where is the diameter of each individual crater (Malin et al., 2006; Daubar et al., 2013).
Regional characteristics were obtained from quantitative maps in JMARS using map sampling of the relevant basemap to calculate the average value within the footprint of the HiRISE image. This provides a representative value of the region, because the impacts themselves are orders of magnitude smaller than the basemap resolutions. Elevations were sampled from the MOLA 128 ppd basemap (Smith et al., 2001). Dust Cover was sampled from the TES Dust Cover Index (Ruff and Christensen, 2002). Thermal inertia was sampled from the THEMIS quantitative 100 m per pixel global mosaic (Edwards et al., 2011). Where the THEMIS data were not available, we used the average of day and night TES thermal inertia (Putzig and Mellon, 2007).
2.5 Review of candidates by thermal inertia
We also performed a manual review using a stratified sampling procedure that partitioned candidates by their thermal inertia values. To perform the stratified sampling of candidates, we first computed a thermal inertia value for every candidate within the detection database using the THEMIS thermal inertia map (100 m/pixel) as a primary source of measurements and using the TES map (7.5 km/pixel) as a backup as described above for manually detected candidates. In this case, we used the value of thermal inertia pixel closest to the center of the CTX window in which the candidate was found. Then, a set of candidates was obtained by selecting the top candidates (by confidence) within each of ten thermal inertia bins evenly spaced between and tiu. The review process followed the same procedure as described above.
3 Results and discussion
We first report on the top most-confident machine learning candidates and characterize the new discoveries, then discuss differences in candidates found by manual search versus machine learning. Finally, we report on an analysis by thermal inertia bins that helps reduce the observational bias in the catalog.
3.1 Highest-confidence machine learning candidates
The manual review of the top 1000 machine learning candidates, ranked in descending order of posterior probability, yielded dateable fresh impacts. Of these, were already recorded in the catalog of known fresh impacts, providing confirmation of human and machine agreement. The remaining dateable fresh impacts constitute the discovery of fresh impacts not previously known. An additional set of candidates visually resemble fresh impacts, but the CTX archive does not contain a “before” image that pre-dates the impact’s occurrence, so the date of formation cannot be constrained. An additional candidates were old or degraded impacts (not “fresh”), and candidates were not impact features (e.g., mistaken with shadows due to terrain or other dark features on the surface). Because there is some imprecision in determining the location of each candidate on the surface, of the top 1000 candidates were duplicates with other candidates and not automatically filtered using a distance-based threshold of .
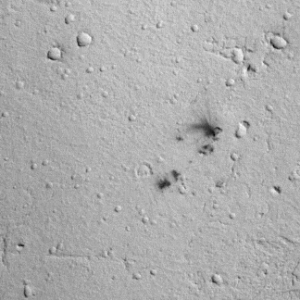
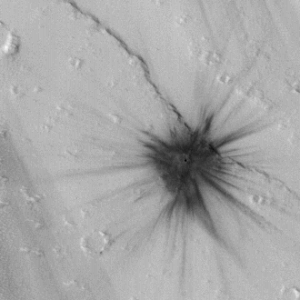
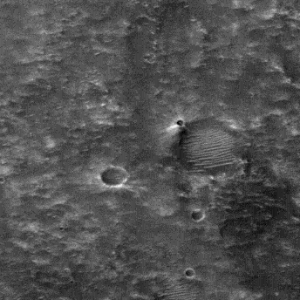
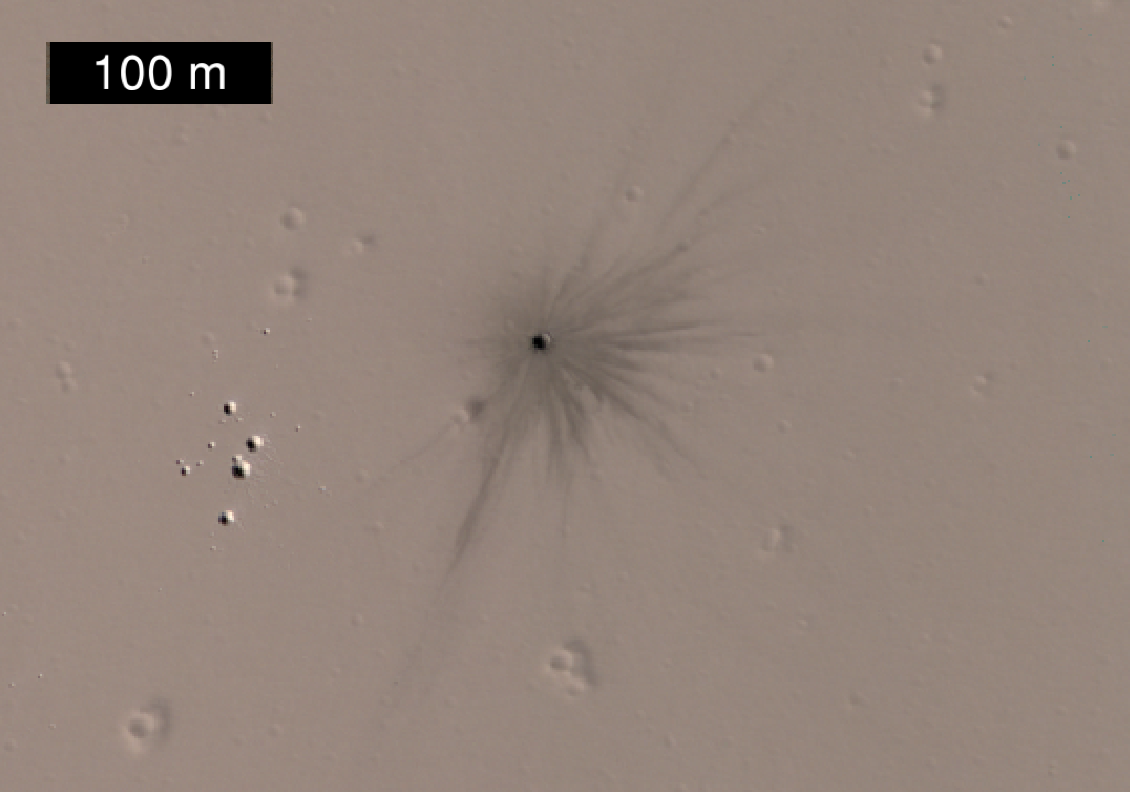
Two examples of the fresh impacts discovered by the machine learning classifier are shown in Figure 4. The latest CTX image pre-impact and the earliest CTX image post-impact are accompanied by the follow-up image we requested from HiRISE. The first example was revealed to be a cluster of smaller impacts, while the second one is a single impact with extensive rays.
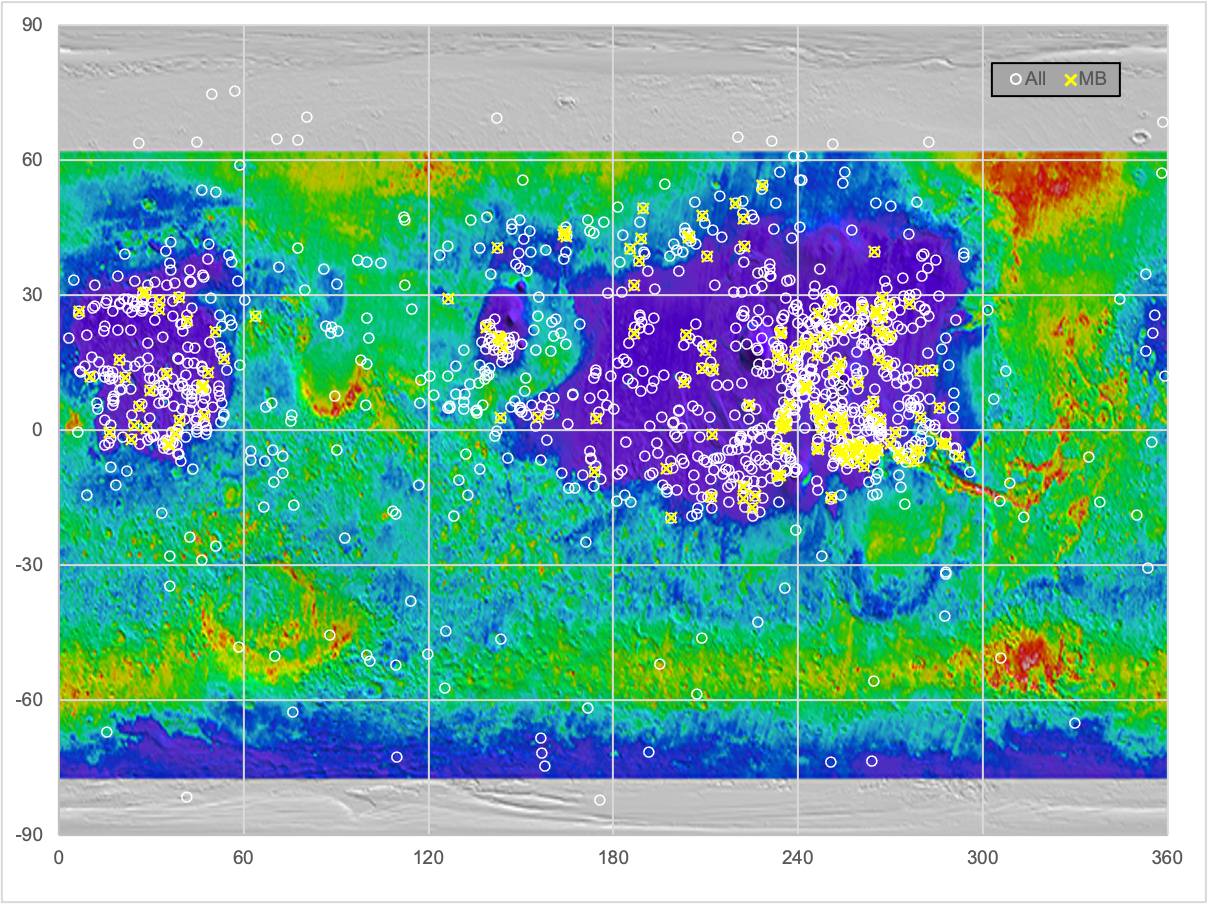
One of the primary questions driving this work was whether the machine learning candidates would exhibit the same observational bias as those identified by humans. Indeed, the most-confident machine learning candidates appear to replicate this bias and are concentrated towards areas of low thermal inertia (see Figure 5). This bias is also evident when the known impacts are plotted on a map of Mars (Figure 6). This is not surprising, since the machine learning classifier was trained on examples identified by humans; the classifier is most confident about the same kinds of impacts that it was trained on. Its ability to exhaustively search in a consistent fashion for the same kinds of features enabled the discovery of new fresh impacts that are similar to those already in the catalog. However, there are some interesting differences in the properties of the impacts that were found via machine learning compared to the pre-existing catalog.
3.2 Differences in machine learning versus manually detected candidates
Why were fresh impact sites detected via machine learning but not by prior review of the CTX images? If there were no distinguishing features for these impacts, they could have been missed by random chance or due to reviewer fatigue. However, we found that there are some factors that characterize this subpopulation and could help explain how they were overlooked. These factors point to advantages of employing semi-automated search techniques.
| Id | Latitude (N) | Longitude (E) | Type | Halo? | Rays? | Effective diameter | Dust cover index | Thermal inertia |
| 1 | 9.1990 | 242.6790 | cluster | y | y | 7.41 | 0.9369 | 44.91 |
| 2 | 39.6142 | 264.8912 | cluster | y | n | 6.29 | 0.9218 | 45.14 |
| 3 | -6.1622 | 274.1629 | cluster | y | n | 2.64 | 0.9348 | 60.66 |
| 4 | -3.0650 | 287.9550 | single | n | n | 4.50 | 0.9448 | 63.82 |
| 5 | -14.5268 | 225.9985 | cluster | y | y | 7.88 | 0.9382 | 74.78 |
| 6 | 29.5490 | 39.0180 | single | y | n | 3.26 | 0.9260 | 75.56 |
| 7 | 30.3690 | 27.3720 | cluster | y | n | 3.17 | 0.9254 | 79.27 |
| 8 | 23.3190 | 257.0400 | cluster | y | y | 4.97 | 0.9260 | 80.80 |
| 9 | -4.8700 | 253.9290 | cluster | y | n | 9.06 | 0.9384 | 83.49 |
| 10 | 11.8900 | 10.0560 | single | y | y | 2.88 | 0.9322 | 84.97 |
| 11 | -5.8643 | 292.3527 | cluster | y | n | 3.33 | 0.9441 | 87.10 |
| 12 | 1.7600 | 254.4290 | single | y | y | 5.67 | 0.9315 | 88.62 |
| 13 | 0.6796 | 255.0087 | cluster | y | n | 5.85 | 0.9317 | 90.05 |
| 14 | 8.9010 | 29.6060 | cluster | y | y | 4.34 | 0.9385 | 91.43 |
| 15 | -4.3845 | 279.6718 | single | y | n | 2.75 | 0.9446 | 92.94 |
| 16 | -4.2270 | 256.5710 | cluster | y | n | 9.72 | 0.9349 | 96.07 |
| 17 | 22.55271 | 253.8839 | cluster | y | y | 5.66 | 0.9354 | 99.41 |
| 18 | -0.4373 | 16.4684 | cluster | y | n | 4.64 | 0.9467 | 100.37 |
| 19 | -2.859 | 259.977 | cluster | n | y | 9.17 | 0.9406 | 100.67 |
| 20 | 12.7930 | 48.4590 | single | y | y | 3.83 | 0.9346 | 101.01 |
| 21 | -4.4959 | 264.2976 | cluster | y | y | 4.99 | 0.9372 | 102.31 |
| 22 | -5.8110 | 263.4880 | cluster | n | n | 7.08 | 0.9484 | 104.50 |
| 23 | 29.0800 | 251.0380 | cluster | n | y | 4.81 | 0.9274 | 108.49 |
| 24 | -1.9970 | 23.5660 | single | y | y | 4.11 | 0.9456 | 109.37 |
| 25 | 21.3150 | 249.4010 | cluster | y | y | 5.31 | 0.9319 | 110.57 |
| 26 | 2.6430 | 174.4250 | single | y | n | 1.26 | 0.9312 | 114.37 |
| 27 | 2.8903 | 254.1615 | cluster | y | y | 11.36 | 0.9301 | 116.43 |
| 28 | 16.6122 | 246.3148 | cluster | n | y | 10.31 | 0.9342 | 125.21 |
| 29 | 40.4860 | 142.3931 | single | y | n | 4.90 | 0.9405 | 126.44 |
| 30 | -3.9690 | 235.9680 | single | y | y | 5.00 | 0.9358 | 129.60 |
| 31 | 43.5112 | 163.9189 | single | n | n | 2.30 | 0.9435 | 129.78 |
| 32 | 12.762 | 251.467 | single | n | y | 3.63 | 0.9379 | 131.16 |
| 33 | -0.4776 | 271.6420 | cluster | y | y | 4.05 | 0.9327 | 131.25 |
| 34 | 2.9980 | 247.4600 | single | y | n | 4.98 | 0.9428 | 131.59 |
| 35 | -4.1960 | 262.5030 | cluster | y | y | 5.67 | 0.9389 | 132.86 |
| 36 | -8.0650 | 261.4580 | single | y | y | 2.37 | 0.9432 | 133.25 |
| 37 | 20.8956 | 142.5618 | cluster | y | n | 6.64 | 0.9356 | 133.86 |
| 38 | -14.8476 | 250.9032 | cluster | n | n | 3.74 | 0.9552 | 136.46 |
| 39 | -4.6036 | 264.0991 | cluster | y | y | 5.75 | 0.9364 | 137.27 |
| 40 | 0.3060 | 28.4810 | cluster | y | n | 4.42 | 0.9473 | 139.08 |
| 41 | -2.9244 | 270.0695 | single | y | n | 2.25 | 0.9423 | 140.54 |
| 42 | 20.6012 | 142.8866 | single | y | y | 3.70 | 0.9278 | 142.74 |
| 43 | 21.5430 | 267.2350 | cluster | y | n | 7.25 | 0.9283 | 143.87 |
| 44 | -4.9936 | 259.1517 | cluster | y | y | 5.19 | 0.9433 | 148.18 |
| 45 | -0.6070 | 254.0170 | cluster | n | n | 8.51 | 0.9341 | 148.48 |
| 46 | 2.7460 | 279.8160 | single | y | y | 2.84 | 0.9409 | 148.97 |
| 47 | -6.8390 | 277.7210 | cluster | y | n | 5.38 | 0.9480 | 150.71 |
| 48 | -4.4870 | 258.6750 | cluster | y | y | 6.34 | 0.9319 | 151.02 |
| 49 | 47.6020 | 209.0360 | cluster | y | n | 4.73 | 0.9337 | 151.63 |
| 50 | -6.7113 | 255.7250 | cluster | n | n | 9.07 | 0.9519 | 154.55 |
| 51 | 27.0131 | 260.7333 | cluster | y | n | 4.91 | 0.9262 | 161.00 |
| 52 | 26.8140 | 32.5150 | cluster | y | y | 1.94 | 0.9237 | 163.99 |
| 53 | -4.4250 | 254.3330 | cluster | y | n | 7.15 | 0.9353 | 164.55 |
| 54 | 2.8290 | 155.6070 | single | y | n | 1.50 | 0.9319 | 167.59 |
| 55 | 13.20978 | 279.55647 | cluster | y | y | 3.76 | 0.9454 | 167.65 |
| 56 | -0.9353 | 212.0407 | cluster | y | n | 6.28 | 0.9369 | 175.90 |
| 57 | 25.9570 | 246.6694 | cluster | y | y | 6.81 | 0.9320 | 176.46 |
| 58 | 18.8686 | 211.5511 | cluster | y | n | 4.90 | 0.9305 | 177.76 |
| 59 | 10.6180 | 259.5470 | cluster | y | y | 5.64 | 0.9384 | 183.64 |
| 60 | 11.7909 | 21.4820 | cluster | n | y | 4.08 | 0.9346 | 201.62 |
| 61 | -10.0940 | 233.1460 | cluster | y | y | 4.37 | 0.9335 | 213.04 |
| 62 | 24.2920 | 41.5100 | cluster | y | y | 4.11 | 0.9309 | 215.12 |
| 63 | 15.84881 | 53.525 | cluster | y | n | 2.45 | 0.9362 | 217.94 |
| 64 | -3.2060 | 35.4300 | cluster | y | y | 3.27 | 0.9440 | 227.34 |
| 65 | 13.646 | 252.922 | single | n | n | 3.67 | 0.9367 | 228.22 |
| 66 | 28.4210 | 250.4310 | cluster | y | y | 5.55 | 0.9190 | 315.92 |
| 67 | 21.8120 | 50.8230 | single | y | n | 2.27 | 0.9374 | 324.99 |
| 68 | 26.3710 | 6.5540 | cluster | y | y | 3.41 | 0.9263 | 346.44 |
| 69 | 25.8970 | 265.3760 | cluster | y | y | 7.96 | 0.9325 | 394.27 |
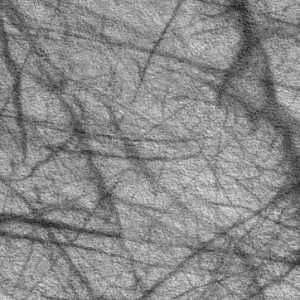
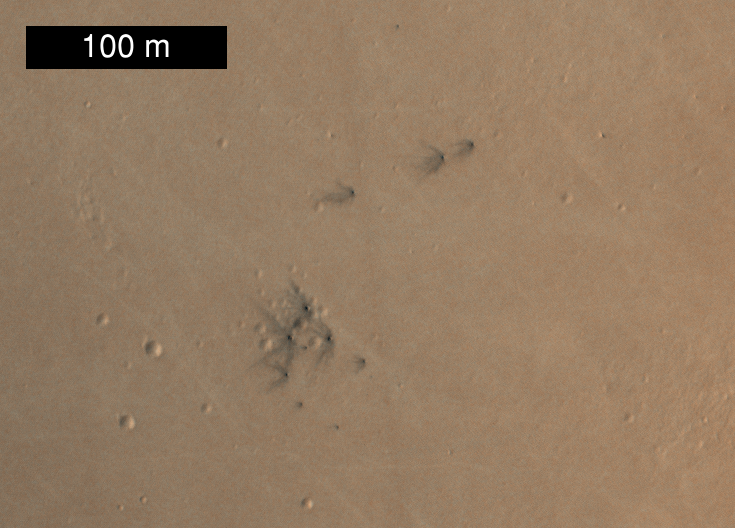
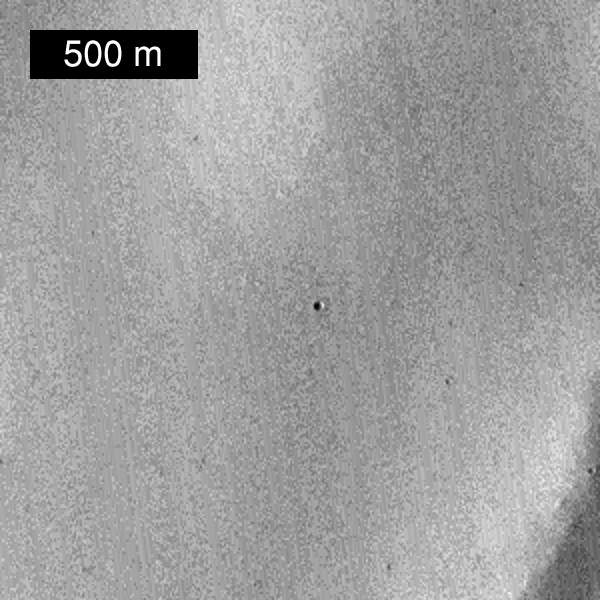
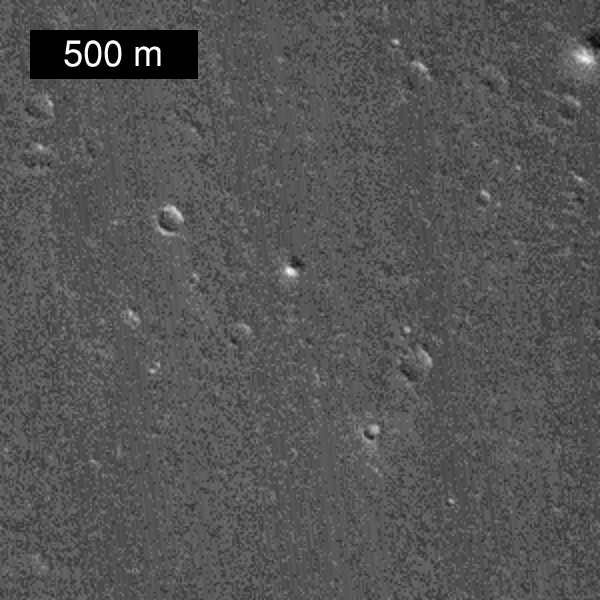
HiRISE follow-up high-resolution images of the newly discovered impact sites were used to produce the measurements described in Section 2.4. An examination of the HiRISE images revealed that one of the new fresh impacts found in CTX images did not correspond to an impact site. Features identified in low-resolution imagery are sometimes revealed to be transient or have other causes, which underscores the value of following up with HiRISE for confirmation. This site is shown in Figure 7. The dark blotches were first observed in May 2017 and persisted for at least nine Earth months (February 2018), but they are not evident in CTX or HiRISE imagery from April 2019 onward. We suspect this feature is the result of aeolian redistribution of bright dust, but cannot be certain of that explanation for this feature. As a result, we excluded this candidate and compiled measurements for sites uniquely identified by the machine learning classifier and confirmed by manual review.
We compiled information about each of the new discoveries, including the location (latitude, longitude) and impact properties and measurements (Table 3.2) and the before and after CTX images and HiRISE confirmation image (Table 3.2). Three of these sites were independently discovered by human review during this study. We compared the characteristics of ML impacts (uniquely found by the machine learning classifier) to those of the entire catalog (including the ML impacts, additional impacts that were found by both ML and humans, and previously identified impacts).
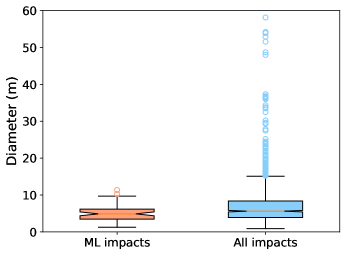
Impact size.
The diameters of the ML impact sites averaged m, while the full catalog averaged m. The difference in distribution of diameter values is shown in Figure 8. The full catalog has quite a few large outliers that exceed times the inter-quartile range. This difference in distribution could indicate that ML is more effective than humans at finding the smaller impact sites (DeLatte et al., 2019; Lagain et al., 2021). It could also partially explain the previously observed difference in size-frequency distribution slope between dated martian impacts and those found on the Moon. Mars has been characterized as having relatively fewer small new impacts than the Moon, but under-counting of these small impacts was identified as a possible reason (Daubar et al., 2022). We also find that ML detects clusters more readily than they are found in the full catalog (% of ML sites are clusters versus % of the full catalog). Clustered impacts may have albedo patterns that are less symmetric and more spatially dispersed, which could be easier for humans to overlook.
Impact albedo features.
The albedo features around new impact sites are what allow us to find them in lower-resolution orbital images, so their nature is directly connected to detectability and the resulting completeness of the dataset. The most common features, halos (widespread diffuse areas of differing albedo) are similarly common among both the full catalog (%) and the ML subset (%). Rays (linear streaks emanating from the impact site) also have similar rates of occurrence among both groups (% of the full catalog vs. % of the ML subset). The disturbed area around the impact site could be darker or lighter than the surroundings, or have some areas of dark and some areas of light. The ML sites have similar distributions between these types as the full catalog, except that dual-toned blast zones are less common among the ML sites (% vs. %). This could be explained by a scarcity of dual- and light-toned impact sites in the training set, or the small numbers of these types of sites in general. (Light-toned sites are so rare, only % of the full catalog, that finding none in this subset is not surprising.)
Surface characteristics.
We also explored the surface characteristics that enable detection of these new impacts to evaluate the effectiveness of ML in improving the completeness of the data. The Dust Cover Index (DCI) around the ML sites (average ) matches closely that of the catalog as a whole (), and thermal inertia of the surroundings were also similar ( Jm-2K-1s-0.5 for the ML sites vs. for the whole catalog). This demonstrates that the training set was effective at training the classifier to find impacts on the same types of terrains.
Overall, the primary distinguishing features of the ML sites were that the impacts tended to be smaller and were more likely to be composed of a cluster of impacts and therefore exhibited more variability in their spatial appearance. These impacts are likely more difficult to find using solely human review of the CTX images.
3.3 Fresh impacts and thermal inertia
The preceding analysis focused on the most-confident candidates identified by the machine learning classifier. Since most of the positive training examples came from areas of low thermal inertia, it is unsurprising that the most confident candidates also come from low thermal inertia areas. Our expectation is that impacts are occurring independently of the terrain type. However, impacts in high thermal inertia areas may be harder to visually detect, so if detected by the classifier, they might not be evident in the set of most confidently classified candidates.
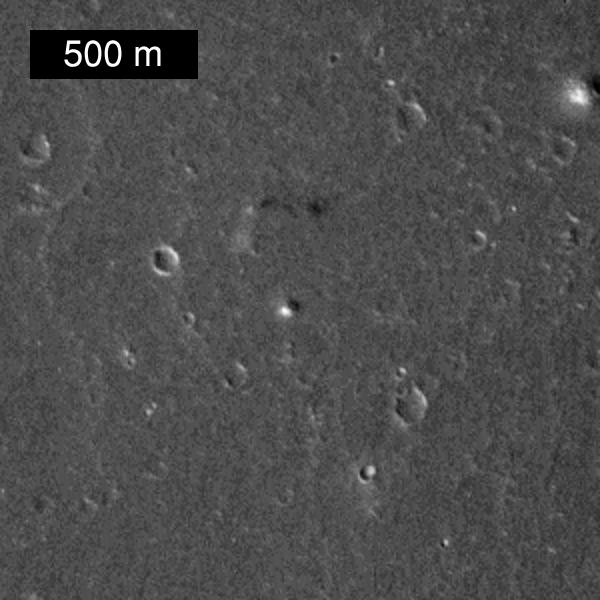
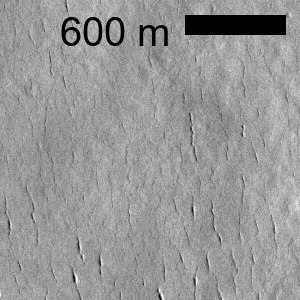
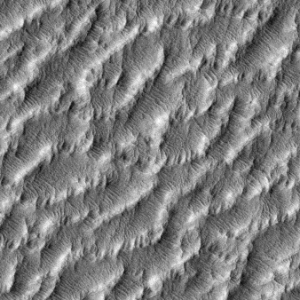
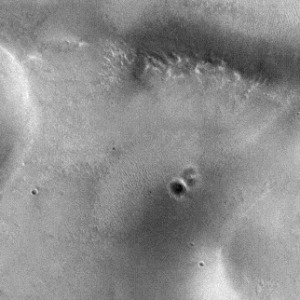
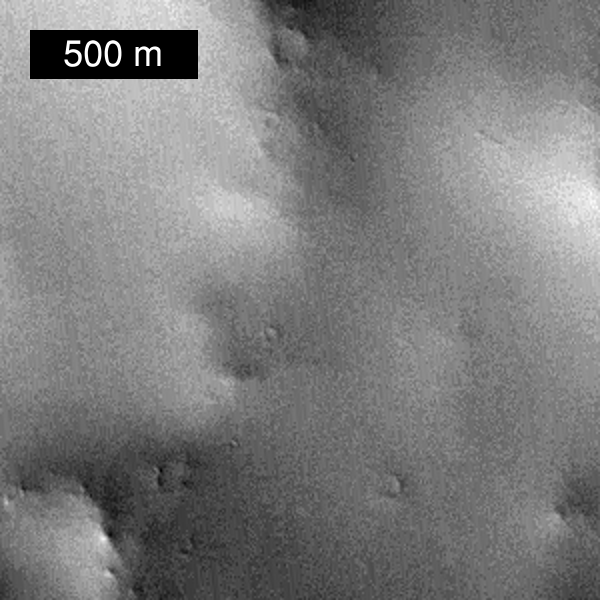
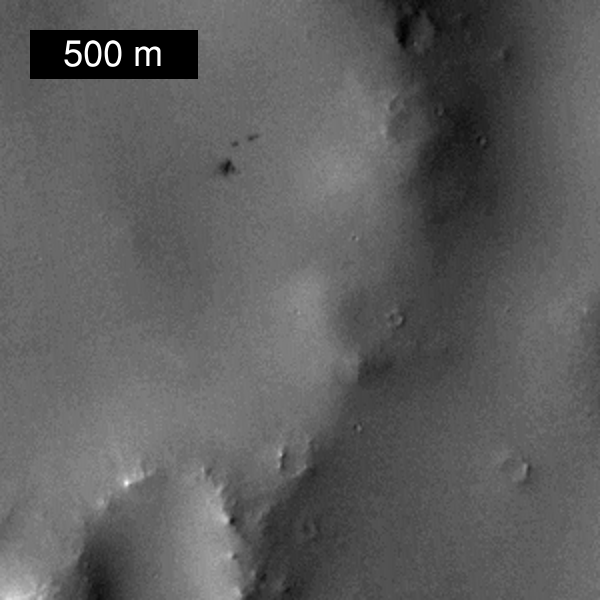
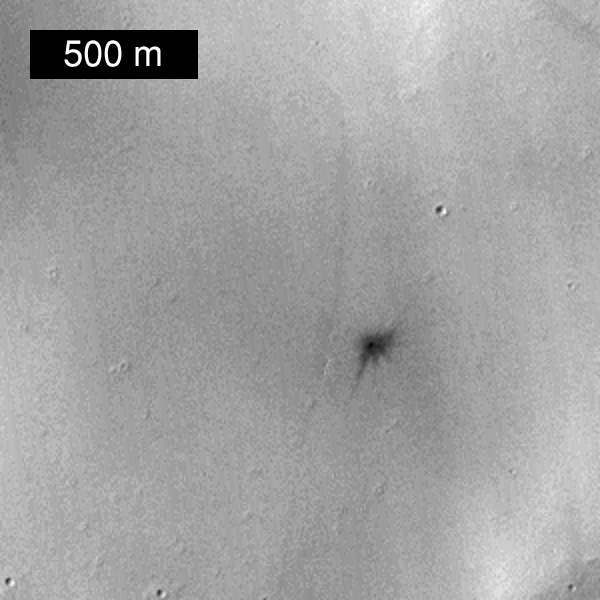
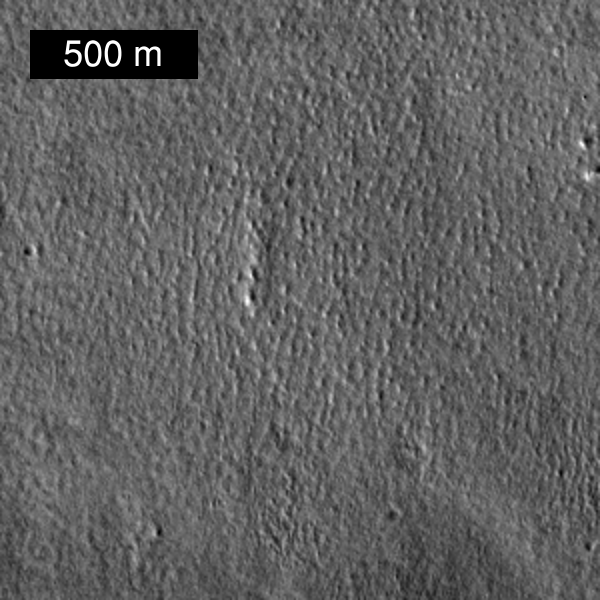
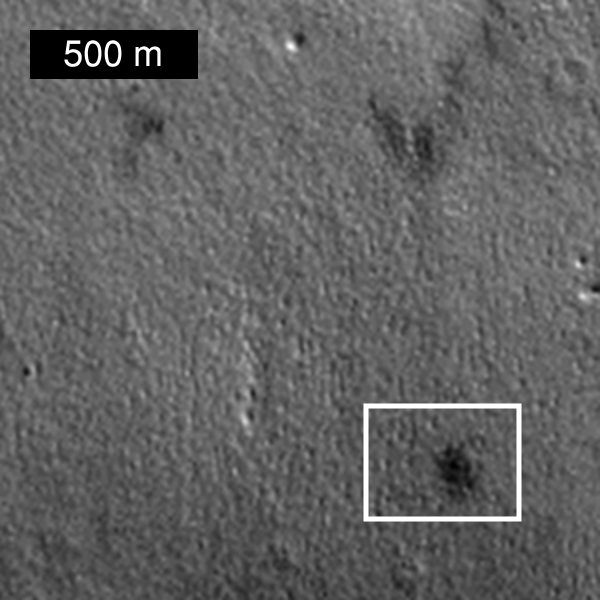
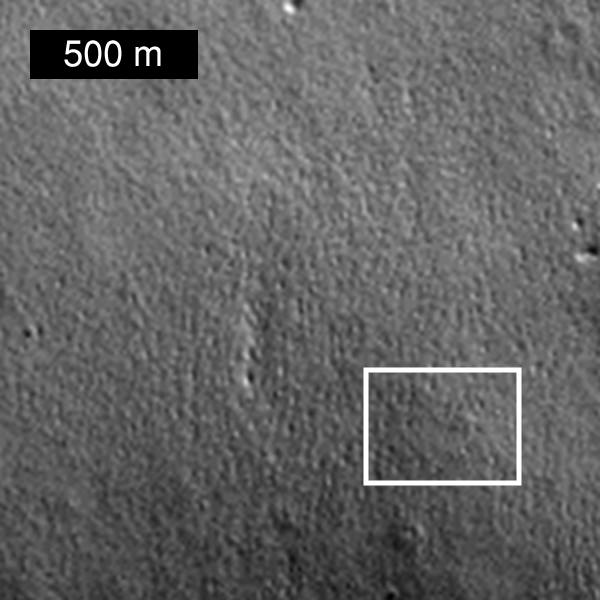
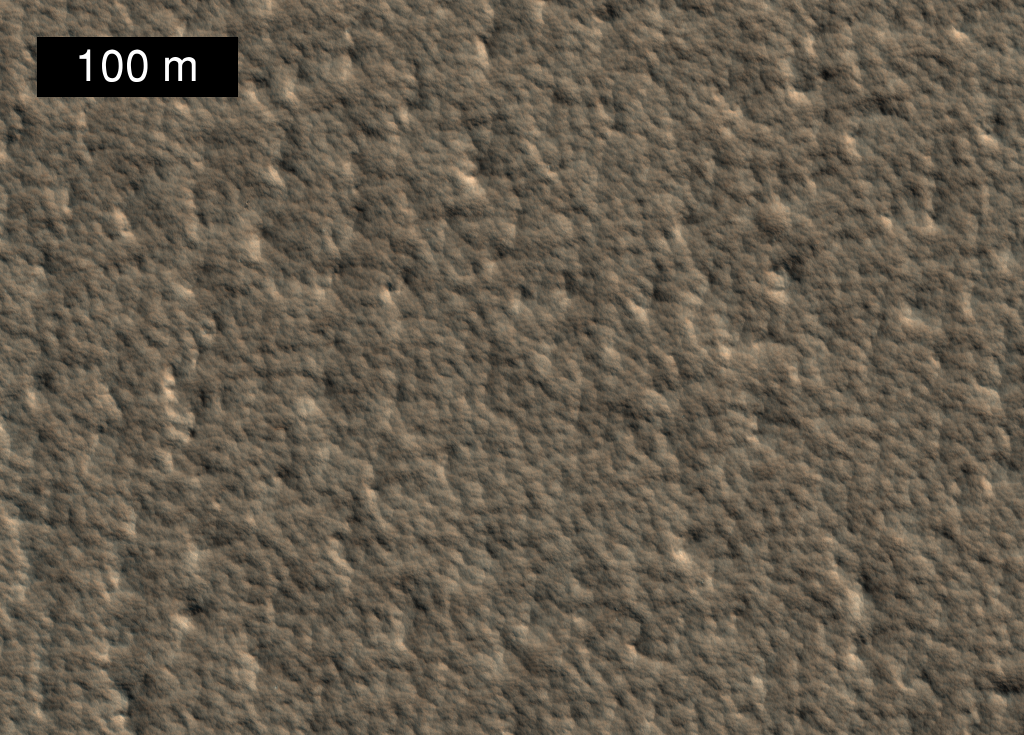
We therefore performed a deeper search , as described in Section 2.5, to determine whether the machine learning candidates stratified by thermal inertia exhibit less bias. We divided the fresh impacts into bins based on thermal inertia and reviewed 100 candidates for each bin. This process yielded an additional five viable candidates, for which we are in the process of obtaining HiRISE follow-up images via HiWish. An example of an impact with THEMIS thermal inertia greater than tiu is shown in Figure 9. The HiRISE follow-up image, when available, will help us resolve its properties.
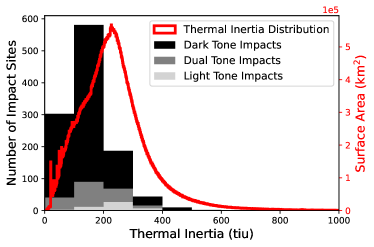
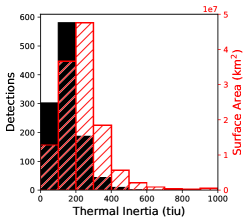
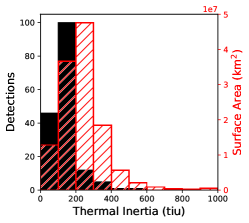
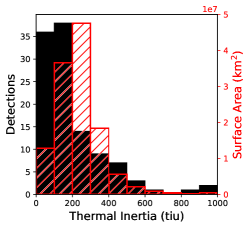
Figure 10 shows the distribution of impacts by their thermal inertia values (black bars) compared to the counts that would be expected given the global distribution of thermal inertia across Mars, assuming uniform observations across the surface (red hashed bars). The manually detected impacts exhibit a bias towards lower thermal inertia bins that does not match the global distribution. The most-confident machine learning detections also exhibit this bias. However, stratifying the detections by thermal inertia bin allows the detection of a larger proportion of impacts at higher thermal inertia, providing a better fit to the global distribution. Note that this strategy is possible only because the machine learning classifier generated so many candidates across the entire archive. There does not exist a similarly voluminous sample of human detections that can be stratified to reduce bias in a post-detection fashion.
To quantify the observational bias, we measure the difference between the observed () and expected () thermal inertia distribution of impacts using the Kullback-Leibler (KL) divergence,
| (2) |
where and refer to the probability of an impact occurring in thermal inertia bin . The magnitude of characterizes the bias present; if the two distributions were identical, this value would be zero. The value for the manual detections was . The most-confident ML detections had a higher value of , while stratifying by thermal inertia corrected the bias to , a value that is lower than that of the manual detections.
Note that KL divergence naturally emphasizes differences where there is high probability mass in the distribution. In this case, it focuses on differences in the lower thermal inertia (TI) bins where most of the detections occur. The increase in detections in the highest TI bins (tiu 500-1000) obtained by the stratified method, while important scientifically, does not have as large of an influence on . Also, while stratification reduces some bias, other biases could remain in the data, such as biases based on the appearance of detected impacts, such as the tone of the surrounding ejecta relative to the background. A re-training of the model with additional relevant examples would be required to mitigate these appearance-based detection biases.
4 Conclusions
We trained a convolutional neural network on thousands of positive and negative examples of fresh impacts and deployed it to search images previously obtained by the Mars Reconnaissance Orbiter (MRO)’s Context Camera (CTX). After classifying more than 2 billion CTX image windows of size km, the top candidate detections (by classifier confidence) were manually reviewed. This process yielded fresh impacts that had not been previously identified in the data. Most of the newly discovered impacts were also in low-TI regions, demonstrating consistency with the examples the model was trained on, which are primarily also in low-TI areas.
Each of the fresh impacts that were identified by the machine learning classifier were further investigated using HiRISE on MRO. The high-resolution image enabled the measurement of key impact properties such as size, multiplicity, the presence of rays, etc. During this follow-up process, three candidates were independently found by human review. We found that the properties of the impacts uniquely identified by the classifier were largely consistent with those of the full catalog. However, the ML-discovered impacts were more likely to be clusters of multiple impacts, and they tended to be smaller than those in the full catalog. These impacts are therefore likely more heterogeneous and somewhat harder to detect with manual review, highlighting a useful role for the classifier in increasing coverage.
The bias towards areas of low thermal inertia in the catalog of known impacts can be addressed by assessing candidates across the TI range, not just the most confident ones. We partitioned the classifier candidates based on the thermal inertia of the terrain surrounding the candidate and reviewed the top candidates for each of thermal inertia ranges. This enabled the identification of five additional impacts that had not been previously found by manual detection. HiWish requests for follow-up imaging of these impacts have also been made and will enable future measurements of their properties. In addition, this analysis yielded four new discoveries of fresh impacts on terrain with thermal inertial of at least tiu, a subpopulation that is rare within the catalog. This analysis was possible only because the classifier generated so many candidates across the globe, with more than one million candidates that had a posterior probability of at least .
We conclude that machine learning is a useful technique for increasing the detection of fresh impacts on Mars. The use of an automated classifier can accelerate the rate at which fresh impacts are found and catalogued. Time is still required to review the machine learning candidates, but this time is focused on the areas most likely to yield new discoveries. The classifier provides a useful pointer to focus attention where it is most likely to pay off.
Acknowledgments
We thank Marko Green and Justin Martia for assisting with the labeling of the CTX data set, the CTX and PDS teams for providing the data, Steven Lu and Masha Liukis for developing the distributed machine learning system used to train the classifier, and the Jet Propulsion Laboratory R&TD program for funding this work. The High Performance Computing resources used in this investigation were provided by funding from the JPL Information and Technology Solutions Directorate. Part of this research was carried out at the Jet Propulsion Laboratory, California Institute of Technology, under a contract with the National Aeronautics and Space Administration. © . All rights reserved.
AG, DW, JP and IJD were partially supported by NASA grant 80NSSC20K0789. VTB was supported by a fellowship within the IFI programme of the German Academic Exchange Service (DAAD).
We are grateful to the HiRISE operations team for acquiring our HiWish target suggestions in a timely manner.
References
- Alexandari et al. (2020) Alexandari, A., Kundaje, A., Shrikumar, A., 2020. Maximum likelihood with bias-corrected calibration is hard-to-beat at label shift adaptation, in: Proceedings of the 2020 International Conference on Machine Learning, pp. 222–232.
- Barrett et al. (2022) Barrett, A.M., Balme, M.R., Woods, M., Karachalios, S., Petrocelli, D., Joudrier, L., Sefton-Nash, E., 2022. NOAH-H, a deep-learning, terrain classification system for Mars: Results for the ExoMars Rover candidate landing sites. Icarus 371, 114701. doi:10.1016/j.icarus.2021.114701.
- Bart et al. (2019) Bart, G.D., Daubar, I.J., Ivanov, B.A., Dundas, C.M., McEwen, A.S., 2019. Dark halos produced by current impact cratering on Mars. Icarus 328, 45–57. doi:10.1016/J.ICARUS.2019.03.004.
- Bickel et al. (2020a) Bickel, V.T., Aaron, J., Manconi, A., Loew, S., Mall, U., 2020a. Impacts drive lunar rockfalls over billions of years. Nature Communications doi:10.1038/s41467-020-16653-3.
- Bickel et al. (2020b) Bickel, V.T., Conway, S.J., Tesson, P.A., Manconi, A., Loew, S., Mall, U., 2020b. Deep learning-driven detection and mapping of rockfalls on Mars. IEEE Journal of Selected Topics in Applied Earth Observations and Remote Sensing 13, 2831–2841. doi:10.1109/JSTARS.2020.2991588.
- Burleigh et al. (2012) Burleigh, K.J., Melosh, H.J., Tornabene, L.L., Ivanov, B., McEwen, A.S., Daubar, I.J., 2012. Impact airblast triggers dust avalanches on Mars. Icarus 217, 194–201. doi:10.1016/j.icarus.2011.10.026.
- Byrne et al. (2009) Byrne, S., Dundas, C.M., Kennedy, M.R., Mellon, M.T., McEwen, A.S., Cull, S.C., Daubar, I.J., Shean, D.E., Seelos, K.D., Murchie, S.L., Cantor, B.A., Arvidson, R.E., Edgett, K.S., Reufer, A., Thomas, N., Harrison, T.N., Posiolova, L.V., Seelos, F.P., 2009. Distribution of mid-latitude ground ice on Mars from new impact craters. Science 325, 1674–1676. doi:10.1126/science.1175307.
- Chojnacki et al. (2020) Chojnacki, M., McEwen, A.S., Byrne, S., Hansen, C., Daubar, I.J., Beyer, R., McArthur, G., the HiRISE science, operations team, 2020. HiWish: The High Resolution Imaging Science Experiment (HiRISE) suggestion tool, in: Proceedings of the 51st Lunar and Planetary Science Conference, The Woodlands, TX. Abstract 2095.
- Christensen et al. (2001) Christensen, P.R., Bandfield, J.L., Hamilton, V.E., Ruff, S.W., Kieffer, H.H., Titus, T.N., Malin, M.C., Morris, R.V., Lane, M.D., Clark, R.L., Jakosky, B.M., Mellon, M.T., Pearl, J.C., Conrath, B.J., Smith, M.D., Clancy, R.T., Kuzmin, R.O., Roush, T., Mehall, G.L., Gorelick, N., Bender, K., Murray, K., Dason, S., Greene, E., Silverman, S., Greenfield, M., 2001. Mars Global Surveyor Thermal Emission Spectrometer experiment: Investigation description and surface science results. Journal of Geophysical Research: Planets 106, 23823–23871. doi:10.1029/2000JE001370.
- Christensen et al. (2009) Christensen, P.R., Engle, E., Anwar, S., Dickenshied, S., Noss, D., Gorelick, N., Weiss-Malik, M., 2009. JMARS - A planetary GIS, in: Proceedings of the Fall Meeting of the AGU, pp. Abstract IN22A–06.
- Christensen et al. (2004) Christensen, P.R., Jakosky, B.M., Kieffer, H.H., Malin, M.C., Jr., H.Y.M., Nealson, K., Mehall, G.L., Silverman, S.H., Ferry, S., Caplinger, M., Ravine, M., 2004. The Thermal Emission Imaging System (THEMIS) for the Mars 2001 Odyssey mission. Space Science Reviews 110, 85–130. doi:10.1023/B:SPAC.0000021008.16305.94.
- Daubar et al. (2016) Daubar, I., Dundas, C., Byrne, S., Geissler, P., Bart, G., McEwen, A., Russell, P., Chojnacki, M., Golombek, M., 2016. Changes in blast zone albedo patterns around new martian impact craters. Icarus 267, 86–105. doi:10.1016/j.icarus.2015.11.032.
- Daubar et al. (2014) Daubar, I.J., Atwood-Stone, C., Byrne, S., McEwen, A.S., Russell, P.S., 2014. The morphology of small fresh craters on mars and the moon. Journal of Geophysical Research: Planets 119, 2620–2639. doi:10.1002/2014JE004671.
- Daubar et al. (2019) Daubar, I.J., Banks, M.E., Schmerr, N.C., Golombek, M.P., 2019. Recently formed crater clusters on Mars. Journal of Geophysical Research: Planets 124, 958–969. doi:10.1029/2018JE005857.
- Daubar et al. (2022) Daubar, I.J., Dundas, C., McEwen, A.S., Gao, A., Wexler, D., Piqueux, S., Collins, G.S., Mijkovic, K., Neidhart, T., Eschenfelder, J., Bart, G.D., Wagstaff, K., Doran, G., Posiliova, L., Malin, M., 2022. New craters on Mars: An updated catalog. Journal of Geophysical Research: Planets doi:10.1029/2021JE007145.
- Daubar et al. (2020) Daubar, I.J., Gao, A., Wexler, D., Dundas, C., McEwen, A., Neidhart, T., Miljkovic, K., Eschenfelder, J., Collins, G.S., Piqueux, S., Malin, M., Posiolova, L., 2020. New craters on Mars: An updated catalog, in: Proceedings of the 11th Planetary Crater Consortium. Abstract 2069.
- Daubar et al. (2013) Daubar, I.J., McEwen, A.S., Byrne, S., Kennedy, M.R., Ivanov, B., 2013. The current martian cratering rate. Icarus 225, 506–516. doi:10.1016/j.icarus.2013.04.009.
- DeLatte et al. (2019) DeLatte, D., Crites, S., Guttenberg, N., Yairi, T., 2019. Automated crater detection algorithms from a machine learning perspective in the convolutional neural network era. Advances in Space Research 64, 1615–1628. URL: https://www.sciencedirect.com/science/article/pii/S0273117719305071, doi:https://doi.org/10.1016/j.asr.2019.07.017.
- Dundas et al. (2014) Dundas, C.M., Byrne, S., McEwen, A.S., Mellon, M.T., Kennedy, M.R., Daubar, I.J., Saper, L., 2014. HiRISE observations of new impact craters exposing Martian ground ice. Journal of Geophysical Research: Planets 119, 109–127. doi:10.1002/2013JE004482.
- Dundas et al. (2021) Dundas, C.M., Mellon, M.T., Conway, S.J., Daubar, I.J., Williams, K.E., Ojha, L., Wray, J.J., Bramson, A.M., Byrne, S., McEwen, A.S., Posiolova, L.V., Speth, G., Viola, D., Landis, M.E., Morgan, G.A., Pathare, A.V., 2021. Widespread exposures of extensive clean shallow ice in the midlatitudes of Mars. Journal of Geophysical Research: Planets 126, e2020JE006617. doi:10.1029/2020JE006617.
- Edwards et al. (2011) Edwards, C.S., Nowicki, K.J., Christensen, P.R., Hill, J., Gorelick, N., Murray, K., 2011. Mosaicking of global planetary image datasets: 1. Techniques and data processing for Thermal Emission Imaging System (THEMIS) multi-spectral data. Journal of Geophysical Research: Planets 116. doi:10.1029/2010JE003755.
- Hartmann (2005) Hartmann, W.K., 2005. Martian cratering 8: Isochron refinement and the chronology of Mars. Icarus 174, 294–320.
- Hartmann and Daubar (2017) Hartmann, W.K., Daubar, I.J., 2017. Martian cratering 11. Utilizing decameter scale crater populations to study Martian history. Meteoritics & Planetary Science 52, 493–510. doi:10.1111/maps.12807.
- Hartmann and Neukum (2001) Hartmann, W.K., Neukum, G., 2001. Cratering chronology and the evolution of Mars. Space Science Reviews 96, 165–194.
- Ivanov (2001) Ivanov, B.A., 2001. Mars/Moon cratering rate ratio estimates. Space Science Reviews 96, 87–104.
- Jia et al. (2021) Jia, Y., Liu, L., Zhang, C., 2021. Moon impact crater detection using nested attention mechanism based unet++. IEEE Access 9, 44107–44116. doi:10.1109/ACCESS.2021.3066445.
- Kerner et al. (2020) Kerner, H.R., Wagstaff, K.L., Bue, B.D., Wellington, D.F., Jacob, S., Horton, P., III, J.F.B., Kwan, C., Amor, H.B., 2020. Comparison of novelty detection methods for multispectral images in rover-based planetary exploration missions. Data Mining and Knowledge Discvoery 34, 1642–1675. doi:10.1007/s10618-020-00697-6.
- Kodikara and McHenry (2020) Kodikara, G.R., McHenry, L.J., 2020. Machine learning approaches for classifying lunar soils. Icarus 345, 113719. doi:10.1016/j.icarus.2020.113719.
- Lagain et al. (2021) Lagain, A., Servis, K., Benedix, G.K., Norman, C., Anderson, S., Bland, P.A., 2021. Model age derivation of large Martian impact craters, using automatic crater counting methods. Earth and Space Science 8, e2020EA001598. URL: https://agupubs.onlinelibrary.wiley.com/doi/abs/10.1029/2020EA001598, doi:https://doi.org/10.1029/2020EA001598.
- Malin et al. (2007) Malin, M.C., Bell III, J.F., Cantor, B.A., Caplinger, M.A., Calvin, W.M., Clancy, R.T., Edgett, K.S., Edwards, L., Haberle, R.M., James, P.B., Lee, S.W., Ravine, M.A., Thomas, P.C., Wolff, M.J., 2007. Context Camera Investigation on board the Mars Reconnaissance Orbiter. Journal of Geophysical Research: Planets 112. doi:10.1029/2006JE002808.
- Malin et al. (2006) Malin, M.C., Edgett, K.S., Posiolova, L.V., McColley, S.M., Dobrea, E.Z.N., 2006. Present-day impact cratering rate and contemporary gully activity on Mars. Science 314, 1573–1577. doi:10.1126/science.1135156.
- McEwen et al. (2007) McEwen, A.S., Eliason, E.M., Bergstrom, J.W., Bridges, N.T., Hansen, C.J., Delamere, W.A., Grant, J.A., Gulick, V.C., Herkenhoff, K.E., Keszthelyi, L., Kirk, R.L., Mellon, M.T., Squyres, S.W., Thomas, N., Weitz, C.M., 2007. Mars Reconnaissance Orbiter’s High Resolution Imaging Science Experiment (HiRISE). Journal of Geophysical Research: Planets 112. doi:10.1029/2005JE002605.
- Naeini et al. (2015) Naeini, M.P., Cooper, G.F., Hauskrecht, M., 2015. Obtaining well calibrated probabilities using bayesian binning, in: Proceedings of the… AAAI Conference on Artificial Intelligence. AAAI Conference on Artificial Intelligence, NIH Public Access. p. 2901.
- Ono et al. (2016) Ono, M., Rothrock, B., Almeida, E., Ansar, A., Otero, R., Huertas, A., Heverly, M., 2016. Data-driven surface traversability analysis for Mars 2020 landing site selection, in: 2016 IEEE Aerospace Conference, pp. 1–12. doi:10.1109/AERO.2016.7500597.
- Palafox et al. (2017) Palafox, L.F., Hamilton, C.W., Scheidt, S.P., Alvarez, A.M., 2017. Automated detection of geological landforms on Mars using Convolutional Neural Networks. Computers & Geosciences 101, 48–56. doi:10.1016/j.cageo.2016.12.015.
- Paszke et al. (2019) Paszke, A., Gross, S., Massa, F., Lerer, A., Bradbury, J., Chanan, G., Killeen, T., Lin, Z., Gimelshein, N., Antiga, L., Desmaison, A., Kopf, A., Yang, E., DeVito, Z., Raison, M., Tejani, A., Chilamkurthy, S., Steiner, B., Fang, L., Bai, J., Chintala, S., 2019. Pytorch: An imperative style, high-performance deep learning library, in: Wallach, H., Larochelle, H., Beygelzimer, A., d'Alché-Buc, F., Fox, E., Garnett, R. (Eds.), Advances in Neural Information Processing Systems 32. Curran Associates, Inc., pp. 8024–8035. URL: http://papers.neurips.cc/paper/9015-pytorch-an-imperative-style-high-performance-deep-learning-library.pdf.
- Putzig and Mellon (2007) Putzig, N.E., Mellon, M.T., 2007. Apparent thermal inertia and the surface heterogeneity of Mars. Icarus 191, 68–94. doi:10.1016/j.icarus.2007.05.013.
- Robbins and Hynek (2012) Robbins, S.J., Hynek, B.M., 2012. A new global database of Mars impact craters 1 km: 1. database creation, properties, and parameters. Journal of Geophysical Research: Planets 117. doi:10.1029/2011JE003966.
- Ruff and Christensen (2002) Ruff, S.W., Christensen, P.R., 2002. Bright and dark regions on Mars: Particle size and mineralogical characteristics based on Thermal Emission Spectrometer data. Journal of Geophysical Research: Planets 107, 10–1–10–22. doi:10.1029/2000JE001364.
- Russakovsky et al. (2015) Russakovsky, O., Deng, J., Su, H., Krause, J., Satheesh, S., Ma, S., Huang, Z., Karpathy, A., Khosla, A., Bernstein, M., Berg, A.C., Fei-Fei, L., 2015. ImageNet Large Scale Visual Recognition Challenge. International Journal of Computer Vision (IJCV) 115, 211–252. doi:10.1007/s11263-015-0816-y.
- Silburt et al. (2019) Silburt, A., Ali-Dib, M., Zhu, C., Jackson, A., Valencia, D., Kissin, Y., Tamayo, D., Menou, K., 2019. Lunar crater identification via deep learning. Icarus 317, 27–38. URL: https://www.sciencedirect.com/science/article/pii/S0019103518301386, doi:https://doi.org/10.1016/j.icarus.2018.06.022.
- Smith et al. (2001) Smith, D.E., Zuber, M.T., Frey, H.V., Garvin, J.B., Head, J.W., Muhleman, D.O., Pettengill, G.H., Phillips, R.J., Solomon, S.C., Zwally, H.J., Banerdt, W.B., Duxbury, T.C., Golombek, M.P., Lemoine, F.G., Neumann, G.A., Rowlands, D.D., Aharonson, O., Ford, P.G., Ivanov, A.B., Johnson, C.L., McGovern, P.J., Abshire, J.B., Afzal, R.S., Sun, X., 2001. Mars Orbiter Laser Altimeter: Experiment summary after the first year of global mapping of Mars. Journal of Geophysical Research: Planets 106, 23689–23722. doi:10.1029/2000JE001364.
- Szegedy et al. (2015) Szegedy, C., Liu, W., Jia, Y., Sermanet, P., Reed, S., Anguelov, D., Erhan, D., Vanhoucke, V., Rabinovich, A., 2015. Going deeper with convolutions, in: Proceedings of the IEEE Conference on Computer Vision and Pattern Recognition (CVPR). doi:10.1109/CVPR.2015.7298594.
- Viviano et al. (2019) Viviano, C.E., Murchie, S.L., Daubar, I.J., Morgan, M.F., Seelos, F.P., Plescia, J.B., 2019. Composition of Amazonian volcanic materials in Tharsis and Elysium, Mars, from MRO/CRISM reflectance spectra. Icarus 328, 274–286. doi:10.1016/j.icarus.2019.03.001.
- Wagstaff et al. (2021) Wagstaff, K., Lu, S., Dunkel, E., Grimes, K., Zhao, B., Cai, J., Cole, S.B., Doran, G., Francis, R., Lee, J., Mandrake, L., 2021. Mars image content classification: Three years of NASA deployment and recent advances, in: Proceedings of the Thirty-Third Annual Conference on Innovative Applications of Artificial Intelligence, pp. 15204–15213.
- Wagstaff et al. (2018) Wagstaff, K.L., Lu, Y., Stanboli, A., Grimes, K., Gowda, T., Padams, J., 2018. Deep Mars: CNN classification of Mars imagery for the PDS Imaging Atlas, in: Proceedings of the Thirtieth Annual Conference on Innovative Applications of Artificial Intelligence, pp. 7867–7872.
- Wilhelm et al. (2020) Wilhelm, T., Geis, M., Püttschneider, J., Sievernich, T., Weber, T., Wohlfarth, K., Wöhler, C., 2020. DoMars16k: A diverse dataset for weakly supervised geomorphologic analysis on Mars. Remote Sensing 12. URL: https://www.mdpi.com/2072-4292/12/23/3981, doi:10.3390/rs12233981.
- Williams et al. (2014) Williams, J.P., Pathare, A.V., Aharonson, O., 2014. The production of small primary craters on Mars and the Moon. Icarus 235, 23–36. doi:10.1016/j.icarus.2014.03.011.