STUDY OF THE PROCESS IN THE C.M. ENERGY RANGE 1.6–2.0 GEV WITH THE CMD-3 DETECTOR
Abstract
A cross section of the process has been measured for the first time using a data sample of 185.4 pb-1 collected with the CMD-3 detector at the VEPP-2000 collider. With the decay detection, 37320 and 51428 signal events have been selected with six and five reconstructed tracks, respectively, in the center-of-mass energy range 1.6–2.0 GeV. The total systematic uncertainty of the cross section is about 15%. A study of the production dynamics allows us to extract a contribution from the intermediate state and to measure the corresponding cross section. The intermediate states with the and resonances have been observed.
1 Introduction
annihilation into hadrons below 2 GeV is rich for various multi-particle final states. Their detailed studies are important for the development of the phenomenological models describing strong interactions at low energies. The contributions from the different intermediate states are particularly important for the calculations of the hadronic vacuum polarization (HVP), and the calculation of the hadronic contribution to the muon anomalous magnetic moment [1, 2, 3]. The reaction has been studied before only in the mode by the BaBar collaboration [4], based on the Initial-State Radiation (ISR) method. This mode is dominated by the and intermediate states, and possible contributions from the other states below 2 GeV are not observed with the available data. From the other hand, the process includes many isospin combinations of the kaons and pions, and a small signal in each mode can give a sizable effect in the total cross section value. A measurement of the cross section for the different isospin combinations of the kaons and pions, and a study of the production dynamics can further improve the accuracy of the HVP calculations.
In this paper we report an analysis of the reaction using a data sample of 185.4 pb-1 collected with the CMD-3 detector in the Ec.m.=1.6–2.0 GeV center-of-mass energy range. These data were collected during six energy scans, with 5–10 MeV c.m. energy step each, performed at the VEPP-2000 collider [5, 6, 7, 8] in 2011–2021 experimental runs. Starting in 2017 a beam energy was monitored by the back-scattering laser-light system [9, 10], providing an absolute beam-energy measurement with better than 0.1 MeV uncertainty at every 10–20 minutes of the data taking. In earlier runs the beam energy was determined using measurements of the charged track momenta in the detector magnetic field with an about 1 MeV uncertainty.
The general-purpose detector CMD-3 has been described in detail elsewhere [11]. Its tracking system consists of a cylindrical drift chamber (DC) [12] and double-layer multi-wire proportional Z-chamber, both are also used for a charged track trigger, and both inside a thin (0.2 X0) superconducting solenoid with a field of 1.3 T. The tracking system provides the (96–99)% tracking efficiency in about 70% of the solid angle. The ionisation losses for the charged tracks in the DC are measured with the 15% accuracy. A liquid xenon (LXe) barrel calorimeter with a 5.4 X0 thickness has a fine electrode structure, providing 1–2 mm spatial resolution for the photons independently of their energy [13], and shares a cryostat vacuum volume with the solenoid. A barrel CsI crystal calorimeter with a thickness of 8.1 X0 surrounds the LXe calorimeter, while an end cap BGO calorimeter with a thickness of 13.4 X0 is placed inside the solenoid [14]. Altogether, the calorimeters cover 90% of the solid angle and their amplitude signals provide information for the neutral trigger. A charged trigger requirement of at least one track in DC is quite loose that provides almost 100% trigger efficiency for the process under study with five or six detected tracks. About 80% of these events have a sufficient energy deposition in the calorimeter for the independent neutral trigger: these events are used to control the charged trigger efficiency. A luminosity is measured using the Bhabha scattering events at large angles with about 1.5% systematic uncertainty [15].
To understand the detector response to the processes under study and to obtain a detection efficiency, we have developed Monte Carlo (MC) simulation of our detector based on the GEANT4 [16] package, in which all simulated events pass the whole reconstruction and selection procedure. The MC simulation uses primary generators with the matrix elements for the final state with the and intermediate states. We simulate the resonance decaying to , which gives about 9% of decay rate to , while predominantly decays to final state [17]. The primary generator with the events uniformly distributed in the phase-space (PS) has been also tested. The primary generators include radiation of the photons by an initial electron and positron, calculated according to Ref. [18].
2 Selection of events
The analysis procedure is similar to our study of the production of six charged pions or final state described in Refs. [19, 20]. Candidate events are required to have six or five tracks with the total charge zero or , each having:
-
1.
more than five hits in the DC;
-
2.
a transverse momentum larger than 40 MeV/c;
-
3.
a minimum distance from a track to the beam axis in the transverse plane of less than 6 cm, that allows reconstruction of a decay point of up to this distances;
-
4.
a minimum distance from a track to the center of the interaction region along the beam axis Z of less than 15 cm.
Reconstructed momenta and angles of the tracks for the five- and six-track events are used for the further selection.
In our reconstruction procedure we create a list of the candidates which includes every pair of the oppositely charged tracks, assuming them to be pions, with an invariant mass within MeV/c2 from the mass [17] and a common vertex point within a spacial uncertainty of the DC. We calculate momentum and energy for the candidate taking the values of the pions mass from Ref. [17].
At the first stage of the signal event selection we require at least one candidate with two independent tracks plus three or four additional charged tracks, which are required to be within 0.35 cm from the beam axis. If there are more than one candidate, a candidate pair with a minimal deviation from the mass is retained. A charged kaon candidate is selected from these beam-originated tracks using the ionization loss measurement in the DC as described below.
The signal event candidate is required to have at least one and at least one for the next selection stage.
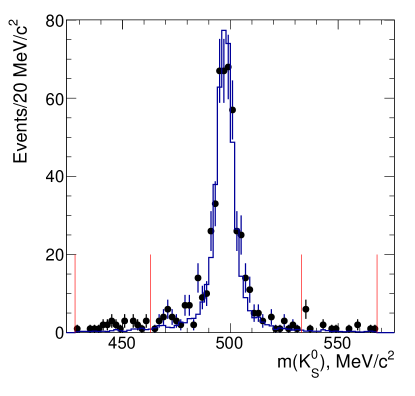
Figure 1(a) shows the invariant mass of the candidates for the data (points) and MC simulation (histogram). The data from the energy intervals above E1950 MeV are combined for the presented histograms. The vertical lines show selections for the signal events and events for a background level estimate by using the side bands with equal to the signal mass intervals. The radial distances of the decay vertices from the beam axis are shown in Fig. 1(b) for the data (points) and MC simulation (histogram) for the events in the signal region. The dashed histogram represents a background contribution, estimated from the side bands of Fig. 1(a). Figure 1(c) shows a scatter plot for the dE/dX values vs momentum for the six tracks of the events from Fig. 1(a). Clear bands for the pions and kaons are seen. The signals from the kaons and pions are overlapped at large momenta, and we use a selection boundary formed by the two linear functions. The most critical is the horizontal boundary above the 300 MeV/c momentum. This boundary is set at the two sigma level above the average dE/dX value for the pions, and rejects about 50% of the kaons in this momentum range. The black dots show the selected charged kaon candidates. The radial distance from the beam axis for the charged kaon tracks is shown in Fig. 1(d). Our simulation well describes the experimental distributions.
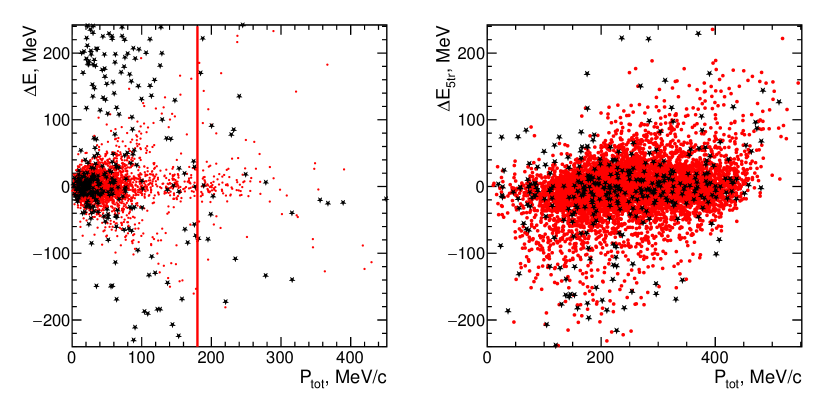
For the six- and five-track candidates we calculate the total energy of two kaons and three pions: for the five-track candidates a missing momentum is used to calculate an energy of the lost pion. Figure 2 shows a scatter plot of the difference between the total energy and c.m. energy, , vs the total momentum, , of six- (a) and five-track (b) candidates. A clear signal of the reaction is seen in Fig. 2(a) as a cluster of the stars near zero, in agreement with the expectation from the simulation shown by (red in the color version) dots. We require to be less than 180 MeV/c, thus reducing a number of signal events with the hard radiative photons.
The expected signal of the five-track candidates has the value near zero, and the value is distributed up to about 500 MeV/c, as shown by the (red) dots from the signal MC simulation in Fig. 2(b). The (black) stars show our data: signal events are clearly seen.

The background contribution from the reaction, seen as a cluster at 200 MeV in Fig. 2(a), is effectively reduced by a requirement of the minimum distance between any track from the decay and the beam axis to be larger than 0.1 cm. A signal loss due to this requirement is small as seen in Fig. 1(b). Another significant background from the reaction with additional tracks from the photon conversion is reduced by a requirement of missing mass to any of the combination to be larger than two pion masses.
Figure 3 shows the projection plots of Fig. 2, , for the six-track (a) and the five-track (b) events with all above selection applied: the dots present events from the signal region, while the histograms are the events from the side bands of Fig. 1(a), which are used to subtract the remaining background contribution. All energy intervals are summed. The background contribution is small: almost negligible for the six-track events and is about 15% for the five-track events.
As seen in Fig. 1(c), the dE/dX values for the kaons and pions are significantly overlapped at large momentum, and above the selection boundary we observe about 20% of the events with more than one charged kaon candidate. In this case we apply kaon mass to only one candidate, assume all the other tracks to be pions, test all combinations, and retain a combination with the closest to zero. The MC simulation shows that the procedure relatively well recover the leakage of the pions to the kaon selections.
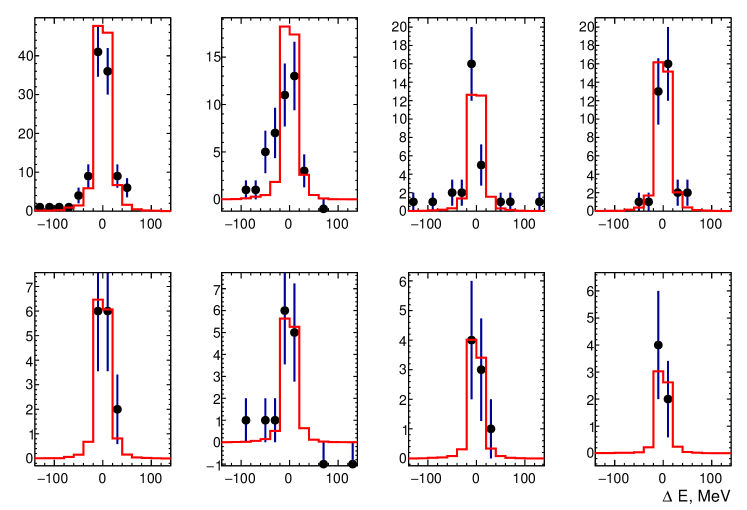
The observed signal is small, and to get a reasonable number of events we combine our scanned points from the early runs into eight energy intervals, as shown in Table 1, while the latest scans with the larger integrated luminosity are presented as individual energy points. To obtain the number of signal events, we use distributions of Fig. 3 after the background subtraction for each energy interval for the six- and the five-track events. We count remaining events in the 70 MeV region for the six-track events, and in the 150 MeV region for the five-track events. The obtained differences are shown in Fig. 4 by dots for the six- (a) and the five-track (b) events: from left to right, from top to bottom according to the last eight energy points of Table 1. The histograms show expected signals from the simulation. In total, we obtain 37320 and 51428 six- and five-track signal events, respectively. The numbers of selected events in each energy interval are listed in Table 1.
3 Study of the production dynamics
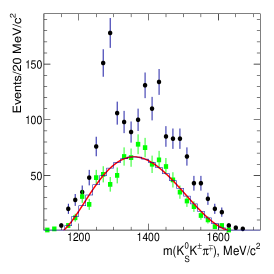
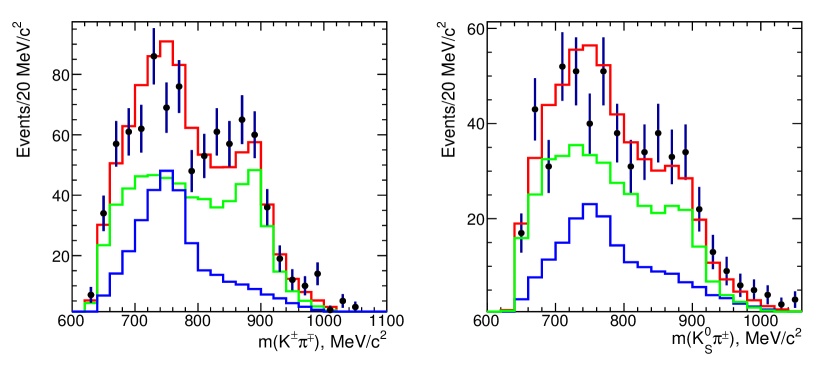
The events from the side bands of Fig. 1(a) have no structures, and are used to subtract the background in the other distributions. The background-subtracted invariant mass for the two kaons and one pion, , (two entries per event) is shown in Fig. 5(a) by points: all energy intervals are summed. We use both six- and five-track events assigning the missing four-momenta to the lost pion for the latter case. This distribution indicates a presence of a narrow resonance which is interpreted as from the reaction. A bump at 1400 MeV/c2 can be interpreted as resonance. These resonances were previously studied in proton-proton interactions, see for example Ref. [21], and have relatively well determined parameters [17]. The curve and the histogram show the fit to the combinatorial background, obtained from a wrong-sign combination, .
Figure 5(b) shows the same distribution for the events from the E energy point in comparison with the MC simulation. We simulate production of the and resonances separately and show the expected contribution by blue and green histograms: here and below we perform an approximate weight of the simulated events from the different channels to compare with the data for a demonstration. It is seen, that in addition to the and we need to add the reaction with approximately the same weight as , pink histogram, to describe the events at higher masses. The resonance has the same decay modes as , and it has some inconsistency in the parameters [17], so its mass and width can be varied in a relatively wide range. The solid red histogram shows a sum of these three simulated reactions with approximately equal weights, demonstrating that the above reactions describe the observed mass distribution.
Figure 5(c) shows the events from Fig. 5(b) when the combinatorial background is subtracted by using the wrong-sign mass distribution: the signal from is seen almost isolated, while the bump at higher masses can be explained as a sum of the and resonances, which are wide and highly overlapped.
The existence of the in addition to is supported by a study of the invariant mass distributions. Figure 6 shows the (a) and (b) invariant mass distributions, where signals from the and are well seen. The final state with the resonance has no signal (blue histogram), while the sum of the signals from and , shown by green histogram, explains the observed experimental distribution. Red histograms present the MC simulation with the sum of the three resonances.
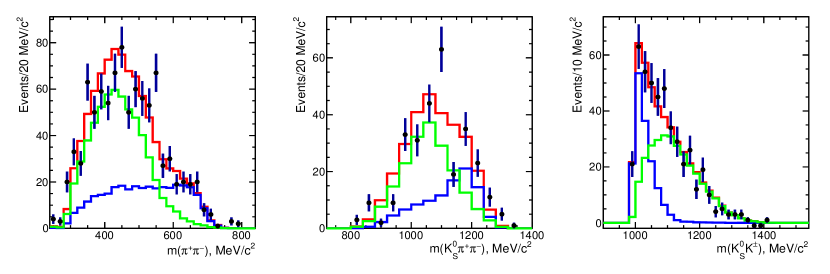
Figure 7 shows the background subtracted (a), (b), and (c) invariant mass distributions. The blue and green histograms show the MC simulated contributions from the reaction, and the sum of and reactions, respectively. An enhancement at the large values of is due to a presence of the from the reaction, while in the case of and the signal from is suppressed kinematically at our energies due to a large energy fraction taken by the pair. Note, that the resonance decays to via the intermediate state, while the and resonances both predominantly decay to the mode. A dominance of the intermediate reaction is demonstrated in Fig. 7(c), where the invariant masses are concentrated at the threshold and well described by the simulation.
From the above study we conclude that the process dominates by the reaction with a combination of the , , and resonances. A small contribution from the other non-resonant processes is not excluded.
The above reactions have the same final state and an interference of them could change the observed mass distributions. The influence of the interference to the distribution is studied with the MC simulation. Because of the relatively narrow width and the difference in the intermediate state, the signal has practically no influence from the interference with the and resonances, while the latter two are highly overlapped and the mass shape depends on the relative phase between the amplitudes.
4 Detection efficiency
Since DC acceptance in our experiment is about 70%, the detection efficiency depends on the particle angular distribitions determined by the hadron production dynamics. In addition, we have to take into account some minor track reconstruction inefficiency.
To obtain the detection efficiency value, we simulate production in the primary generators, 50000 events for each c.m. energy interval for each model, trace simulated particles through the CMD-3 detector using the GEANT4 [16] package, and reconstruct them with the same software as experimental data. We calculate the detection efficiency from the MC-simulated events as a ratio of events after the selections described in Secs. 2, 3 to the total number of generated events.
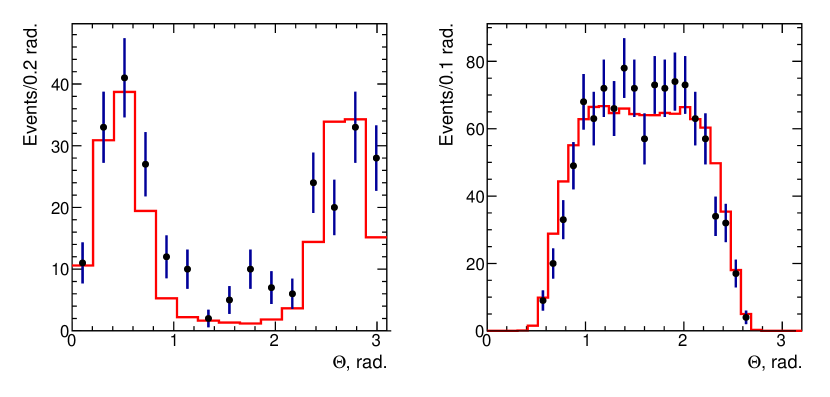
Our selection of the six- and the five-track signal events allows us to estimate a difference in the tracking efficiency in the data and simulation, and perform a test of the model used for the efficiency calculation. Figure 8 shows by dots the background-subtracted polar angle for a missing pion (a) and for all detected charged tracks (b). Solid histograms represent the simulated distribution for the intermediate state, normalized to the number of experimental events in Fig. 8(b). The events inside the DC acceptance, seen in the 1.0–2.1 radians region of Fig. 8(a), are used to estimate the difference in the track resonstruction efficiency for data and simulation (see below).
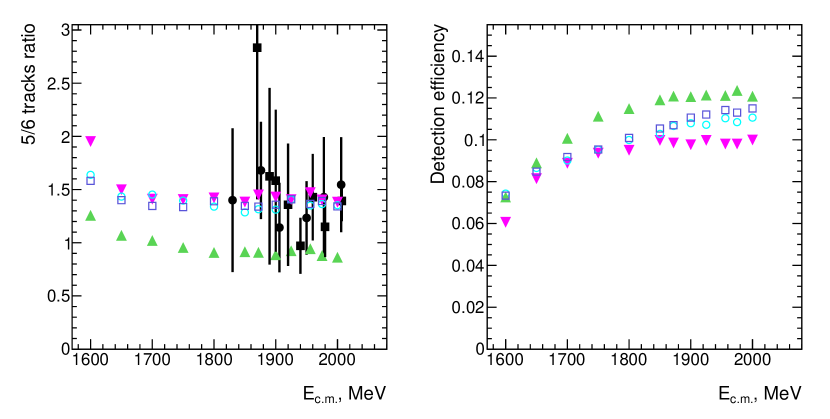
The calculated ratio of the number of five- to six-track events at each c.m. energy interval is shown in Fig. 9(a) by points for the data. The values of the ratio for the PS model (triangles), and for the intermediate states (up-down triangles, open squares, and open circles, respectively) are shown in Fig. 9(a) for a comparison. The PS model is not compatible with our data.
We calculate the detection efficiency for a sum of the events with the six and five detected tracks. Figure 9(b) shows the detection efficiency obtained for the reaction for different intermediate states: markers are the same as for Fig. 9(a).

5 Cross section calculation
In each energy interval the cross section is calculated as
where , are the background-subtracted numbers of the signal events with six and five tracks, is the integrated luminosity for this energy interval, is the detection efficiency, and is a radiative correction calculated according to Ref. [18, 22]. To calculate the radiative correction, we use a procedure with the iterations of the observed cross section in the radiative integral, and obtain with a weak energy dependence.
As shown above the observed events are the mixture of the different intermediate states with slightly different detection efficiency. For the inclusive cross section we use an averaged value of the efficiency for the three observed modes. We assign 5% systematic uncertainty to this procedure, which is close to the difference between calculated efficiencies for the observed reactions. We also apply some corrections due to the difference in the data and MC simulation for the tracking efficiency (see Sec. 7). The cross section is shown in Fig. 10(a) by filled circles for earlier runs, combined into the eight energy intervals, and filled squares for the latest scans. There are no other measurements. We also calculate the cross section by using only events with the six detected tracks: a less than 5% difference within statistical fluctuation is observed.
Energy interval, integrated luminosity, the number of six- and five-track events, and the obtained cross section for each energy interval are listed in Table 1.
| Ec.m., MeV | , nb-1 | , nb | ||
|---|---|---|---|---|
| 2000–2007 | 4259 | 22.0 4.7 | 34.0 6.6 | 0.147 0.021 |
| 1975–1980 | 4640 | 14.0 4.0 | 20.0 5.5 | 0.082 0.016 |
| 1940–1962 | 9653 | 30.0 5.7 | 37.0 7.7 | 0.079 0.011 |
| 1890–1925 | 15158 | 21.0 4.8 | 24.0 6.9 | 0.034 0.006 |
| 1870–1884 | 19333 | 25.0 5.0 | 42.0 7.7 | 0.041 0.006 |
| 1800–1860 | 11428 | 10.0 3.2 | 14.0 5.1 | 0.025 0.006 |
| 1700–1780 | 12783 | 1.0 1.7 | 7.0 3.6 | 0.008 0.004 |
| 1600–1680 | 13193 | 0.0 0.0 | –1.0 1.7 | –0.001 0.002 |
| 2007 | 21643 | 107.0 10.5 | 152.0 14.2 | 0.133 0.009 |
| 1980 | 10093 | 39.0 6.6 | 48.0 8.6 | 0.097 0.012 |
| 1960 | 11065 | 27.0 5.9 | 43.0 7.9 | 0.072 0.010 |
| 1940 | 14416 | 35.0 5.9 | 38.0 7.6 | 0.058 0.008 |
| 1920 | 9904 | 14.0 3.7 | 21.0 6.6 | 0.041 0.009 |
| 1900 | 9675 | 13.0 3.6 | 19.0 5.4 | 0.038 0.008 |
| 1890 | 8912 | 8.0 2.8 | 14.0 4.9 | 0.029 0.007 |
| 1870 | 9286 | 6.0 2.4 | 21.0 5.2 | 0.034 0.007 |
6 Cross section of the
The distributions shown in Fig. 5(c) can be used to extract the number of events associated with the reaction. After the combinatorial background subtraction, the signal is well seen and has low remaining non-resonant background. Simulation shows that a possible interference between and – resonances is negligible because of the difference in the width and in the decay modes. The numbers of events are extracted in the MeV/c2 mass interval around peak of Fig. 5(c) with a background subtraction from side bands. The numbers of events are small therefore we combine the results into the six energy intervals. The results for the number of events in the energy intervals and the integrated luminosity are shown in Table 2. The contribution of the reaction to the inclusive cross section is shown in Fig. 10(a) and listed in Table 2.
We correct the number of events for the missing decay modes of the resonance, containing and (factor of 3), and using the branching fraction of from Ref. [17] we obtain the cross section for the reaction. The obtained cross section for the reaction is shown in Fig. 10(b) by open circles and listed in Table 2.
This cross section can be compared with the only available measurement by BaBar [4], shown in Fig. 10(b), in which the resonance was observed in the decay mode. Our measurement demonstrates a faster rise of the cross section from the threshold.
Because of the relatively large widths, large uncertainty in the parameters, and unknown influence of the interference we cannot extract separately the events for the and resonances from our data.
| Ec.m., MeV | , nb-1 | , nb | , nb | |
|---|---|---|---|---|
| 1700–1780 | 12783 | 2.0 40.0 | 0.002 0.003 | 0.07 0.11 |
| 1800–1860 | 11428 | 10.0 30.0 | 0.012 0.007 | 0.38 0.23 |
| 1860–1900 | 36903 | 44.0 20.0 | 0.016 0.004 | 0.52 0.12 |
| 1900–1935 | 34738 | 58.0 17.5 | 0.022 0.004 | 0.72 0.15 |
| 1935–1965 | 35134 | 64.0 15.0 | 0.024 0.005 | 0.79 0.16 |
| 1980–2010 | 40675 | 113.0 15.0 | 0.036 0.006 | 1.20 0.21 |
7 Systematic uncertainties
The following sources of systematic uncertainties and corrections are considered for the cross section measurement.
-
1.
The major uncertainty in the event number comes from the separation of the kaons and pions using the dE/dX values. As shown in Fig. 1(c) signals from the kaons and pions are highly overlapped, and the applied boundary rejects about 50% of the kaons with momentum above 300 MeV/c, corresponding to about 20% of losses in the total number of the events. By changing the boundary we either loosing the signal events or rapidly increase the pion leakage to the kaons. We vary the boundary and only half of these losses is properly described by the simulation. It corresponds to about 10% systematic uncertainty in the result.
-
2.
The tracking efficiency was studied in detail in our previous papers [19, 23]. A similar estimate is made using angular distribution in Figs. 8(a,b) where we observe a difference for the data and MC simulation in the number of missing tracks inside the DC acceptance. The correction for the track reconstruction efficiency compared to the MC simulation is estimated as about (2.01.0)% per track. Since we add events with one missing pion track, the MC-simulated detection efficiency is corrected by (–75)%: the uncertainty is taken as the corresponding systematic uncertainty.
-
3.
The model dependence of the acceptance is determined by a comparing efficiencies calculated for the different production dynamics. Since we assume a mixture of the intermediate states with the approximately equal contributions, we average the efficiences shown in Fig. 9, and assign a 5% uncertainty to the calculation.
-
4.
Since only one charged track is sufficient for a trigger (98–99% single track efficiency), and using a cross check with the independent neutral trigger, we conclude that the trigger inefficiency for the multitrack events gives a negligible contribution to the systematic uncertainty.
-
5.
The systematic uncertainty due to the selection criteria is studied by varying the requirements described above and doesn’t exceed 5%.
-
6.
The uncertainty on the the integrated luminosity comes from the selection criteria of the Bhabha events, the radiative corrections, the detector calibrations, and does not exceed 1.5% [15].
-
7.
The radiative correction uncertainty is estimated as about 2%, mainly due to the uncertainty on the maximum allowed energy of the emitted photon, as well as from the uncertainty on the cross section.
The above systematic uncertainties summed in quadrature give an overall systematic uncertainty of about 15%.
Conclusion
The total cross section of the process has been measured using 185.4 pb-1 of integrated luminosity collected by the CMD-3 detector at the VEPP-2000 collider in the 1.6–2.0 GeV c.m. energy range. The systematic uncertainty is about 15%. At the present statistical accuracy we do not observe any influence of the threshold to the cross section. From our study we can conclude that the observed final state can be described by the reaction with the contribution from the , , and resonances. We extracted the number of events associated with the resonance, and the measured cross section for the reaction is compatible with the only available measurement by BaBar.
Acknowledgments
We thank the VEPP-2000 team for the excellent machine operation. The work is partially supported by the Russian Foundation for Basic Research grant 20-02-00496.
References
- [1] M. Davier, A. Hoecker, B. Malaescu, and Z. Zhang, Eur. Phys. J. C 77, 827 (2017).
- [2] F. Jegerlehner, Acta Phys. Polon. B49, 1157 (2018).
- [3] A. Keshavarzi, D. Nomura, T. Teubner, Phys. Rev. D 97, 114025 (2018).
- [4] B. Aubert et al. (BaBar Collaboration), Phys. Rev. D 76, 092005 (2007).
- [5] V. V. Danilov et al., Proceedings EPAC96, Barcelona, p.1593 (1996).
- [6] I. A. Koop, Nucl. Phys. B (Proc. Suppl.) 181-182, 371 (2008).
- [7] P. Yu. Shatunov et al., Phys.Part.Nucl.Lett. 13, 995 (2016).
- [8] D. Shwartz et al., PoS ICHEP2016, 054 (2016).
- [9] E. V. Abakumova et al., Phys. Rev. Lett. 110, 140402 (2013).
- [10] E. V. Abakumova et al., JINST 10, T09001 (2015).
- [11] B. I. Khazin, Nucl. Phys. B (Proc. Suppl.) 181-182, 376 (2008).
- [12] F. Grancagnolo et al., Nucl. Instr. Meth. A623, 114 (2010).
- [13] A. V. Anisyonkov et al., Nucl. Instr. Meth. A598, 266 (2009).
- [14] D. Epifanov (CMD-3 Collaboration), J. Phys. Conf. Ser. 293, 012009 (2011).
- [15] A. E. Ryzhenenkov et al., EPJ Web Conf. 212 (2019) 04011.
- [16] S. Agostinelli et al. (GEANT4 Collaboration), Nucl. Instr. Meth. A506, 250 (2003).
- [17] P. A. Zyla et al. (Particle Data Group), Prog. Theor. Exp. Phys. 2020, 083C01 (2020) and 2021 update.
- [18] E. A. Kuraev and V. S. Fadin, Sov. J. Nucl. Phys. 41, 466 (1985).
- [19] R. R. Akhmetshin et al. (CMD-3 Collaboration), Phys. Lett. B723, 82 (2013).
- [20] R. R. Akhmetshin et al. (CMD-3 Collaboration), Phys. Lett. B804, 135380 (2020).
- [21] D. Barberis et al. (WA102 Collaboration), Phys. Lett. B413, 225-231 (1997).
- [22] S. Actis et al., Eur. Phys. J. C66, 585 (2010).
- [23] R. R. Akhmetshin et al. (CMD-3 Collaboration), Phys. Lett. B768, 345 (2017).