NICER X-ray Observations of Eta Carinae During its Most Recent Periastron Passage
Abstract
We report high-precision X-ray monitoring observations in the 0.4–10 keV band of the luminous, long-period colliding-wind binary Eta Carinae up to and through its most recent X-ray minimum/periastron passage in February 2020. Eta Carinae reached its observed maximum X-ray flux on 7 January 2020, at a flux level of ergs s-1 cm-2, followed by a rapid plunge to its observed minimum flux, ergs s-1 cm-2 near 17 February 2020. The NICER observations show an X-ray recovery from minimum of only 16 days, the shortest X-ray minimum observed so far. We provide new constraints of the “deep” and “shallow” minimum intervals. Variations in the characteristic X-ray temperature of the hottest observed X-ray emission indicate that the apex of the wind-wind “bow shock” enters the companion’s wind acceleration zone about 81 days before the start of the X-ray minimum. There is a step-like increase in column density just before the X-ray minimum, probably associated with the presence of dense clumps near the shock apex. During recovery and after, the column density shows a smooth decline, which agrees with previous measurements made by Swift at the same orbital phase, indicating that changes in mass-loss rate are only a few percent over the two cycles. Finally, we use the variations in the X-ray flux of the outer ejecta seen by NICER to derive a kinetic X-ray luminosity of the ejecta of ergs s-1near the time of the “Great Eruption”.
1 Introduction
At a distance of 2.3 kpc (Smith, 2006), Eta Carinae ( Car, Davidson, 1971; Davidson & Humphreys, 1997; Humphreys & Martin, 2012) is the nearest star system with a mass 100 (Hillier et al., 2001; Madura et al., 2012; Corcoran & Ishibashi, 2012). The Car system is a high-mass non-compact binary system containing an extremely unstable “Luminous Blue Variable” (LBV), Car-A. In the mid-nineteenth century, this star experienced (and survived) the most energetic stellar mass ejection event ever observed to date, where a mass of 45 (Morris et al., 2017) was ejected. This material created the bipolar “Homunculus Nebula” (Gaviola, 1950), which today surrounds the star and which is expanding outward at a velocity of 650 km s-1(Davidson & Humphreys, 1997). Observations of the He I 1.083m emission line over a period of 50 years reported by Damineli (1996) established, for the first time, a strict periodicity associated with the stellar spectrum, suggesting that the star is a massive binary system with an orbital period of 5.52 years (Damineli et al., 1997). The discovery of periodic X-ray variability (Corcoran et al., 1995; Ishibashi et al., 1999; Corcoran, 2005) was critical to identifying the system as a highly eccentric () “colliding-wind” binary (Corcoran et al., 1998). The X-ray emission observed from the Car system is dominated by hot shocked gas produced when the dense, slow ( 420 km s-1, Groh et al., 2012) wind of the LBV primary Car-A collides with the wind of its companion star, Car-B. Because the companion star has never been directly detected, X-ray observations remain critical to constraining its stellar wind properties and monitoring changes in mass-loss rate from either star. The temperatures inferred from the X-ray spectrum and the X-ray brightness of the gas shocked in the wind collision suggest that the unseen companion star has a fast ( 3000 km s-1, Pittard & Corcoran, 2002) lower-density wind, probably some type of hot massive star (Verner et al., 2005; Mehner et al., 2010). Table 1 summarizes the stellar and orbital parameters of the Car system.
| Parameter | Value | Reference |
|---|---|---|
| Distance (pc) | 2300200 | Smith (2006) |
| Period (X-ray, days) | 2023.40 0.71 days | Corcoran et al. (2017) |
| Eccentricity | 0.9 | Corcoran et al. (2001) |
| (Periastron Passage, MJD) | 56873.90 | Teodoro et al. (2016) |
| (Deep X-ray Minimum Start, MJD) | 50799.42 | Corcoran et al. (2017) |
| Total Luminosity () | 5 | Hillier et al. (2001) |
| Mass, () | Hillier et al. (2001) | |
| Mass, , ZAMS () | 40–50 | Mehner et al. (2010) |
| (km s-1) | 420 | Groh et al. (2012) |
| (km s-1) | 3000 | Pittard & Corcoran (2002) |
| ( yr-1) | Madura et al. (2013) | |
| ( yr-1) | Parkin et al. (2009) | |
| (AU) | 15.9 |
X-ray spectra provide important observational constraints on temperatures and densities in the hot shocked gas in the wind-wind collision “bow shock”, while the absorption suffered by the X-ray emission provides information on the density distribution of the wind of the LBV primary (since the matter along the line-of sight to the X-ray source is dominated by the wind of the LBV). These quantities change with the distance between the stars (Stevens et al., 1992) as the stars revolve in their extremely eccentric orbit.
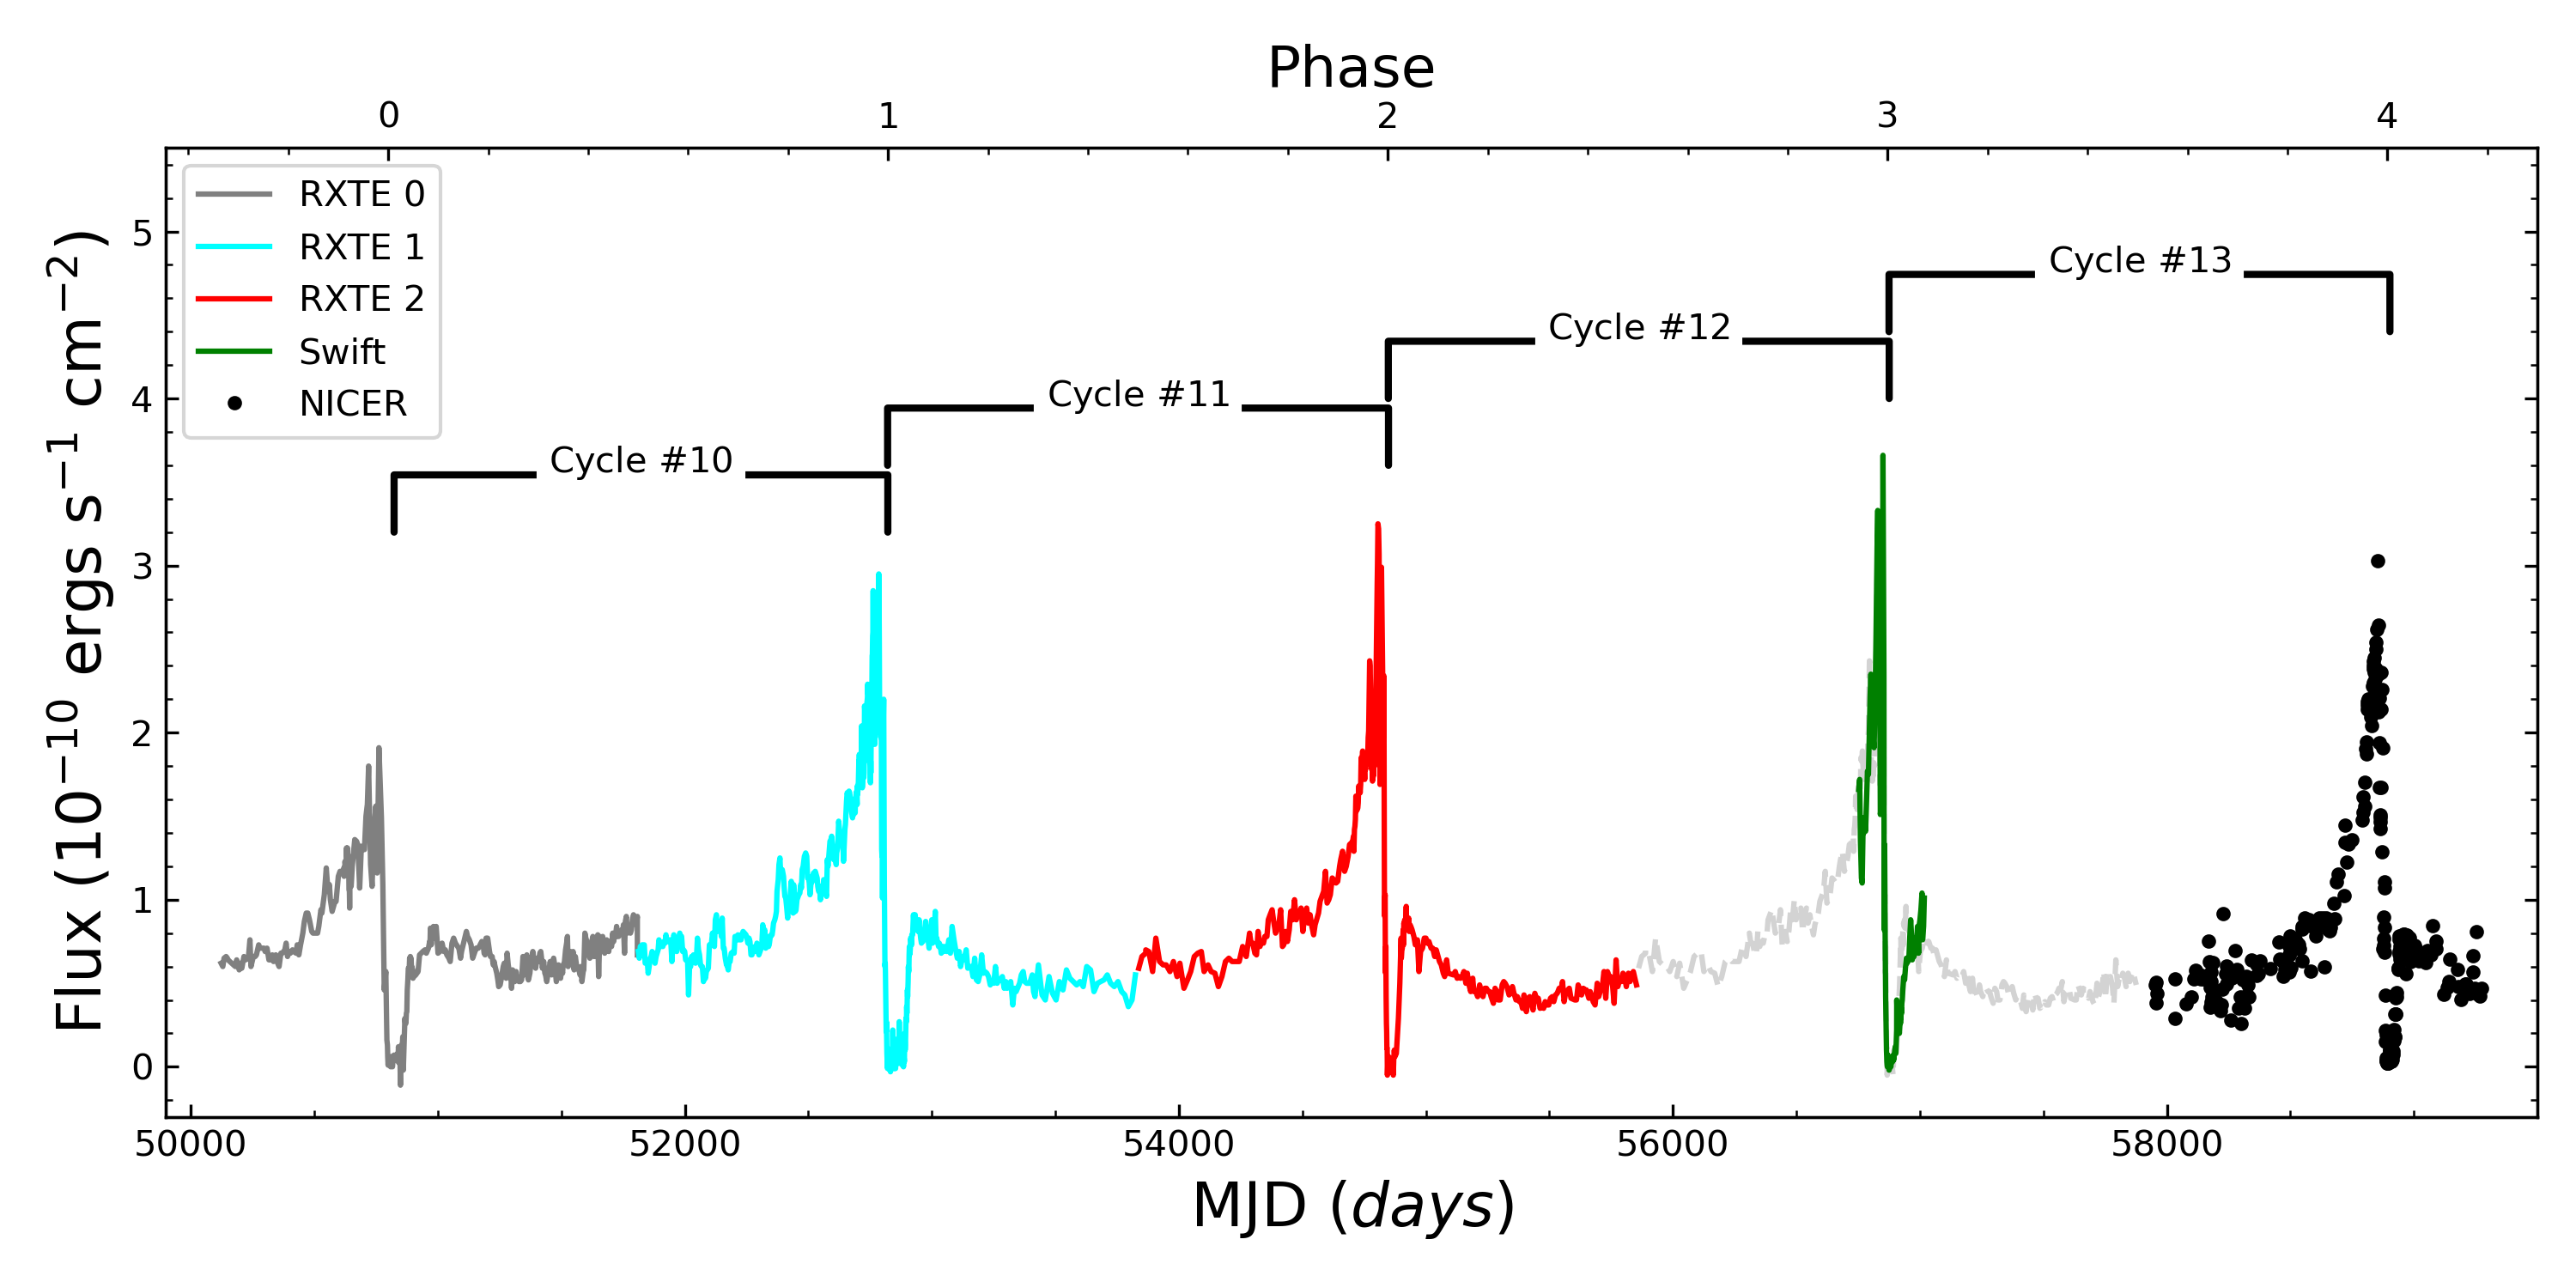
Figure 1 shows previous observations (Ishibashi et al., 1999; Corcoran et al., 2001; Pittard & Corcoran, 2002; Corcoran, 2005; Corcoran et al., 2010, 2017) of the time-variable X-ray emission from the Car system. These observations have helped to establish the temperatures and densities of the shocked gas in the wind-wind collision region, and analyses of these observations using even-more-sophisticated models (Okazaki et al., 2008; Parkin et al., 2011; Madura et al., 2013) determined the geometry of the shocked winds, temperatures at the colliding-wind region (CWR) and mass-loss rate of the winds from the stars. Even though published 3-D models of the X-ray spectral variability provide a good overall description of the CWR (Parkin et al., 2011; Russell et al., 2016) they do not explain some important details of Car’s X-ray behavior, such as the “flaring” episodes seen prior to the start of the X-ray minimum (Ishibashi et al., 1999; Moffat & Corcoran, 2009), variation in the recovery from the X-ray minimum (Corcoran et al., 2010), or the “Deep”/“Shallow” minimum transition (Hamaguchi et al., 2014).
In this paper we report the first monitoring of the variable X-ray spectrum of Car with the Neutron Star Interior Composition Explorer (NICER). Here we discuss the observed X-ray spectrum variations from our NICER X-ray observing campaign, and compare them to X-ray variations seen during previous orbital cycles. Throughout the paper, phases are calculated using the X-ray ephemeris (Corcoran et al., 2017) where is the cycle count.
| (1) |
The X-ray epoch in Figure 1 refers to the first RXTE deep minimum. Previous works like Damineli et al. (2008) and Teodoro et al. (2016) have used spectral variations of He emission to number the cycles of Car, starting from the event observed in 1948 by Gaviola (1953). The square brackets in Figure 1 show the corresponding cycle number based on the He minima. The epoch of periastron using He cycles in the Figure is based on variations of the transient He II line, found by Teodoro et al. (2016). This He II epoch corresponds to the starting point of cycle 10, which is 4.3 days later than the X-ray minimum for the 1997 periastron passage.
This paper is organized as follows. We describe the NICER observing program and reduction and analysis of the NICER spectra in Section 2, including a discussion of NICER background estimation. We present the results of the analysis of the net X-ray spectra in Section 4. We discuss the main results of our spectral analysis in Section 5, including a comparison of the NICER spectral properties with similar properties from previous cycles, and in particular compare the flux variations to refine the X-ray period, and examine variations prior to and after the start of the X-ray minimum. We summarize our results in Section 6 and discuss areas of future work.
2 Observations
2.1 Description of the Instrument
The Neutron Star Interior Composition Explorer (NICER, Gendreau et al., 2012; Arzoumanian et al., 2014) is an X-ray astronomy facility attached to the International Space Station (ISS). NICER is devoted to time-resolved X-ray spectrometry in the 0.2 – 12.0 keV energy band. NICER was launched on 3 June 2017 aboard a Space X Falcon 9 rocket, and deployed at the ISS on 16 June 2017. NICER’s X-ray Timing Instrument (XTI, Prigozhin et al., 2016) is comprised of a co-aligned array of 52 Focal Plane Modules, each consisting of a matched pair of X-ray “concentrator” (XRC) optics with a silicon drift detector (SDD) to record the energy and time-of-arrival of source X-ray photons. Each XRC optic collects X-rays over a roughly 30 arcmin2 region of the sky centered on the target of interest in the 0.2 – 12 keV energy band and concentrates them onto an SDD. NICER’s primary mission is to obtain X-ray spectrometry with high time and moderate spectral resolution of cosmic X-ray sources, primarily of X-ray binary pulsars. NICER’s combination of large effective area, restricted field of view and broad bandpass in the thermal X-ray range makes it especially well-suited to observe X-ray variables like long-period colliding-wind binaries (and other sources) in addition to X-ray pulsars. Table 2 lists key technical specifications of NICER’s capabilities.
NICER observed Car starting on 20 July 2017 (as part of NICER’s “observatory science” program), continuing with guest investigator programs in Cycle 1 (Principle Investigator, M. F. Corcoran) and Cycle 2 (Principal Investigator, D. Espinoza-Galeas). The whole set of NICER observations are listed in the appendix but we present a summary of the observations in Table 3. NICER has provided frequent measure of Car’s X-ray spectrum, typically twice per month, with appropriately increased sampling near periastron when the variation in the X-ray spectrum occurs on timescales of days. An alternative analysis of some of these spectra was discussed by Kashi et al. (2021).
| Property | |
|---|---|
| Effective area | 2000 cm2 at 1.5 keV |
| 600 cm2 at 6 keV | |
| Energy resolution | 85 eV at 1 keV |
| 137 eV at 6 keV | |
| Broad Bandpass | 0.2 E 12.0 keV |
| Absolute timing precision | 300 ns |
| Restricted field of view | 30 arcmin2 |
| Sensitivity | ergs s-1 cm-2 |
| (0.5-10.0 keV, 5 in 10 ksec) |
| # of Obs. | First Obs. | Last Obs. | |
|---|---|---|---|
| CHANDRA | 31 | 2000-11-19 | 2020-01-26 |
| NICER | 249 | 2017-07-21 | 2021-02-21 |
2.2 Data Reduction and Calibration
The NICER spectra for all Car observations were extracted from the clean, merged photon events file, using data obtained outside of the South Atlantic Anomaly at sun angles to avoid optical stray-light contamination, using the NICERDAS111see https://heasarc.gsfc.nasa.gov/docs/software/lheasoft/help/nicer.html software package distributed with HEASoft software analysis package (version 6.27.2). We used standard NICER event cleaning criteria222see https://heasarc.gsfc.nasa.gov/lheasoft/ftools/headas/nimaketime.html for a description of the standard cleaning criteria to convert the observed event times and pulse-heights to cleaned events with calibrated energies, using data from all 52 active detectors. We used calibration data (effective areas and instrument response functions) from the publicly available NICER calibration data version 20200202.
2.3 NICER Background Estimation
NICER is subject to a varying charged particle environment in the high-inclination ISS orbit, that traverses regions of trapped charged particles near the South Atlantic Anomaly and the regions near the north and south poles (the “polar horns”). Charged particle background is most noticeable at high energies. At low energies, the NICER background is dominated by optical light contamination at low sun angles and an instrumental “noise peak” of excess events at energies keV. Correction for background is important, especially near X-ray minimum. To minimize background contamination in the NICER spectra, we extracted lightcurves in the keV band for all the NICER observations and visually inspected them, defining time regions to exclude short intervals of large rapid increases in count rate produced by the variable charged particle environment. We then extracted X-ray spectra for each observation from the cleaned and screened event files. Residual charged particle background and/or optical light contamination generally affects spectra even after the exclusion of obvious intervals of high background.
Background estimation is still under development, so we used two different background estimator tools provided by the NICER Guest Observer Facility333See https://heasarc.gsfc.nasa.gov/docs/nicer/tools/nicer_bkg_est_tools.html., the nibackgen3C50 (Remillard et al., 2021) and the nicer_bkg_estimator “space-weather” (SW) background estimators. Both estimators use NICER observations of “blank sky” fields (i.e. fields with no obvious sources in the XRC field of view) to estimate background. The nibackgen3C50 tool compares NICER spectra in various bands in the observed and blank-field observations to construct a background, while the nicer_bkg_estimator tool matches sun angle, cut off rigidity and the solar Kp index between the observation and NICER observations of “blank sky” regions to estimate the amount of background due to optical loading and the charged particle environment. Because background estimates continue to be refined, we used both models to gauge the effects of background contamination, but because the SW background estimator showed more dispersion in the value of the fittings, we adopted the nibackgen3C50 backgrounds in our analysis.
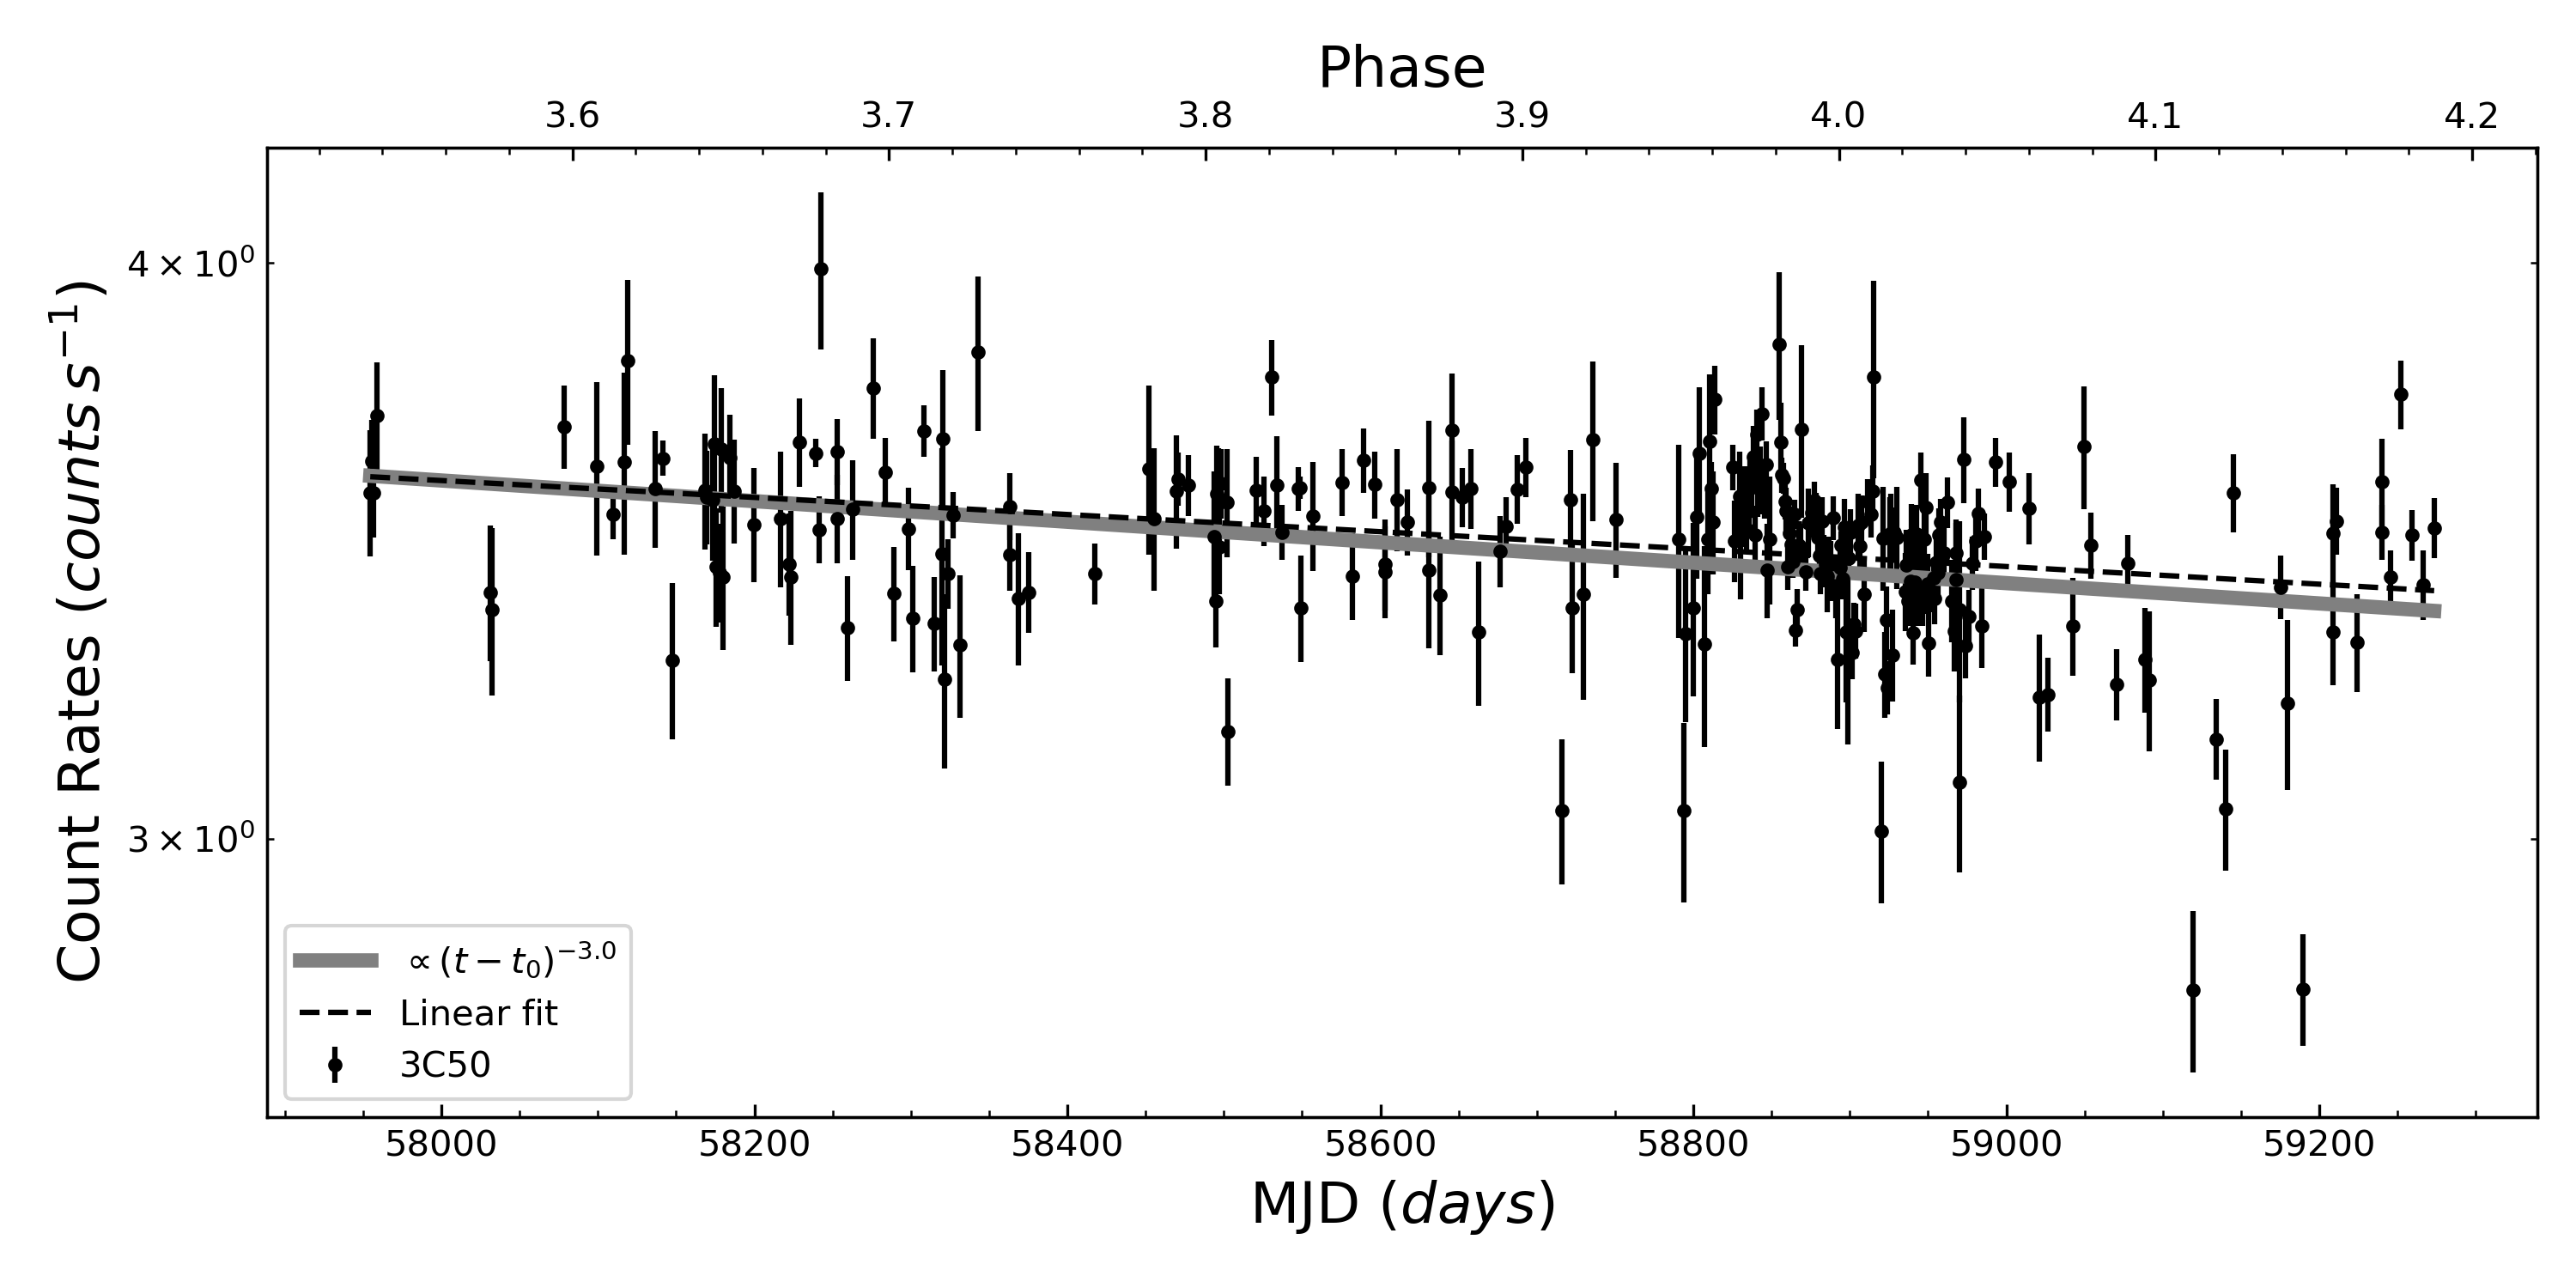
As a check on the background estimation, Figure 2 shows the total count rates for Car between 0.5 – 1.0 keV, along with the net rates using the backgrounds estimated from the nibackgen3C50 method. In this range, the X-ray emission is totally dominated by the emission from the “Outer Ejecta” (OE) region surrounding the Homunculus Nebula (Seward et al., 1979; Weis et al., 2004; Hamaguchi et al., 2007a). The emission from the OE region, which extends out to from Car, is entirely within the radius of the field of view of the NICER SDDs and so present in all NICER observations of Car. The mean of the total source+background rates in the 0.5 – 1.0 keV is cts s-1, while the mean of the net count rate using the nibackgen3C50 method is cts s-1 and the mean of the net count rate using the space-weather nicer_bkg_estimator method is cts s-1. In this band the 3c50 method appears to have a slightly smaller standard deviation, but similar to that in the total band. Figure 2 shows the net NICER count rates in the 0.5 – 1.0 keV band using the nibackgen3C50 background estimate. The net NICER count rates in this band seem to show a decline of about 7% over the 1000 days of the NICER monitoring, also visible in the gross rates and the net rates corrected using the “space weather” model. A linear fit to the total (non-background subtracted) count rate data yields a decline of cts ks-1 day-1. We suspected this apparent decline is instrumental, as might be expected from increasing condensations on the FPMs, but examination of NICER observations of the supernova remnant 1E 0102.2-7219, an extended soft source, covering the same timespan as the Car observations did not find a comparable decline in the soft-band flux. This decrease might be due to expansion of the outer ejecta. Car’s X-ray emission below 2.0 keV comes from gas heated by the shocked ejecta from the 19th century eruption. The X-ray flux is proportional to the emission measure , where is the particle density and is the emission volume of hot gas. Assuming a constant mass of gas expanding freely at a constant velocity then . Figure 2 shows how the power-law gives good agreement of the observed Car’s soft X-ray emission assuming the gas expansion started near the time of the Great Eruption in 1843. The decline in X-ray flux is observed in the soft X-ray emission ( keV) of young SN remnants (Immler & Kuntz, 2005). Extrapolating this power law to 100 days after the Great Eruption, the initial X-ray luminosity of the shocked ejecta would have been ergs s-1. This would be close to the total luminosity at longer wavelengths derived from the observed brightness of the system at that time (L= L⊙, Davidson & Humphreys (1997)). If confirmed, this would be the first estimate of the X-ray luminosity of the Great Eruption.
3 Multi-Band X-ray Variations
3.1 NICER Broad Band X-ray Lightcurves of Car
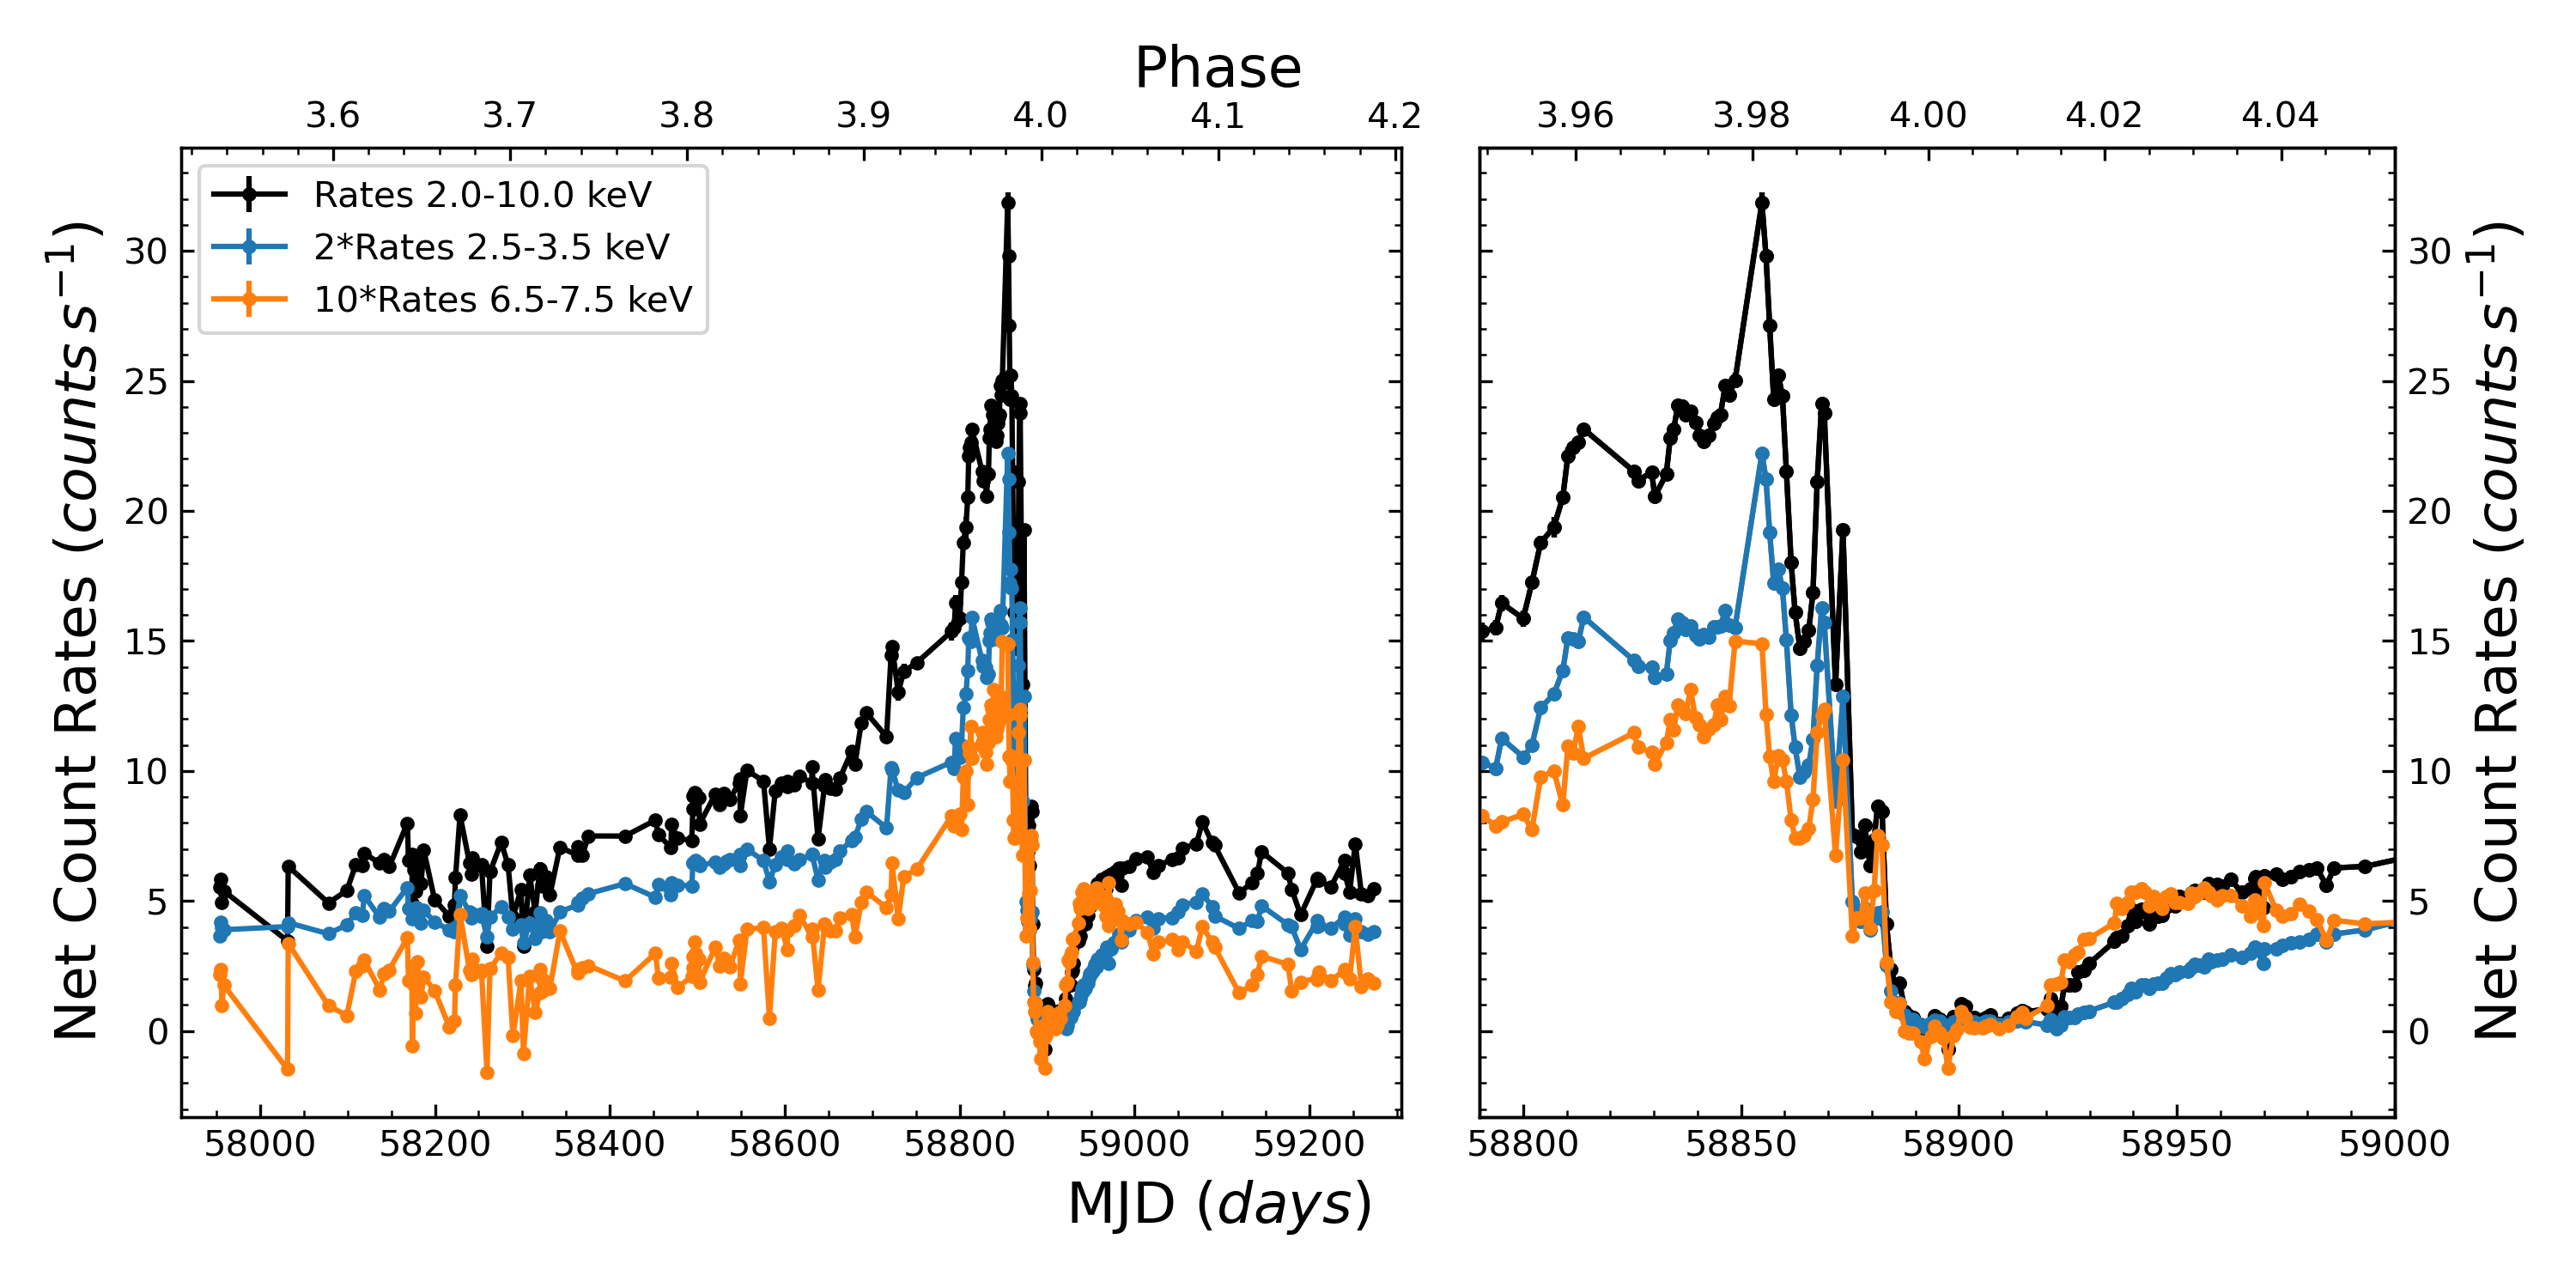
Measurements of net count rates in the 2.5 – 3.5 keV, 6.5 – 7.5 keV, and 2.0 – 10.0 keV bands are shown in Figure 3. Rates in these three bands are dominated by emission from the hot gas in the colliding-wind shock and background contamination is fairly low. The 2.0 – 10.0 keV band was originally adopted by Ishibashi et al. (1999) in their analysis of the RXTE monitoring observations of Car, and includes nearly all of the observable thermal X-ray emission from the colliding-wind region, while excluding contamination from the OE region which is of lower energy.
The net count rates soon after the start of the NICER observations (on MJD 57954.5, 2017-07-20) show significant artificial scatter from observation to observation because of variations in background which are not accurately accounted for by the background model. To mitigate this variability, we requested that observations obtained after MJD 58306 (2018-07-07) be restricted to avoid times of low geomagnetic rigidity, i.e. when the ISS was not near the South Atlantic Anomaly or the polar horns. This restriction significantly reduced variability from charged particle events, which accounts for the reduced scatter after that time.
The X-ray variability seen by NICER in the 2 – 10 keV band is similar to that seen in other cycles by the RXTE Proportional Counter Array and Swift X-ray Telescope. As shown in Figure 3, the count rates in all energy bands show a gradual increase from MJD 57954.5 (2017-07-20) to MJD 58610 (2019-05-07). After MJD 58610, the count rate increase accelerates, and short-term brightenings (“flares”, Moffat & Corcoran, 2009) occur as the stars approach X-ray minimum near periastron passage. Starting at MJD 58855 (2020-01-06, about 0.98) a rapid decline in X-ray count rate began, reaching to the “Deep” X-ray minimum near MJD 58893 (2020-02-14). The emission in this band starts to increase by MJD 58912.5 (2020-03-04), just 19.5 days after the start of the Deep minimum.
The 6.5 – 7.5 keV band is dominated by the high energy thermal emission and includes emission in the Fe K region. This band is not greatly affected by absorption from the wind of the LBV except at phases very close to the X-ray minimum when column densities rise in excess of cm-2. The flares in the 6.5 – 7.5 keV band are somewhat smaller in amplitude compared to the 2 – 10 keV band, and there is also evidence that the flares begin sooner in the 6.5 – 7.5 keV than at lower energies. All the flares are present in the 2.5 – 3.5 and 6.5 – 7.5 bands, except for the last flare just before X-ray minimum. The last flare occurs only in the 6.5 – 7.5 band while the 2.5 – 3.5 count rates stay almost constant. The plunge to the X-ray minimum in the 6.5 – 7.5 keV band seems to occur almost simultaneously with the drop seen in the lower-energy bands, and X-ray minimum flux is reached at MJD 58854 (2020-01-06) in all energy bands. The X-ray count rates in the all bands begin to increase by MJD 58912.5 (2020-03-04), but at different rates. The rate of increase is greatest in the 6.5 – 7.5 keV band, and net rates in this band increase until 58942 (2020-04-03), when it begins to start a slow decline as the stars separate towards apastron. Of the three bands, the rate of increase is slowest in the low energy 2.5 – 3.5 keV band, which shows the importance of extended absorption of the low energy X-rays by the intervening, unshocked wind of Car-A. This absorption continues for about 200 days after periastron passage.
3.2 Hardness Variations
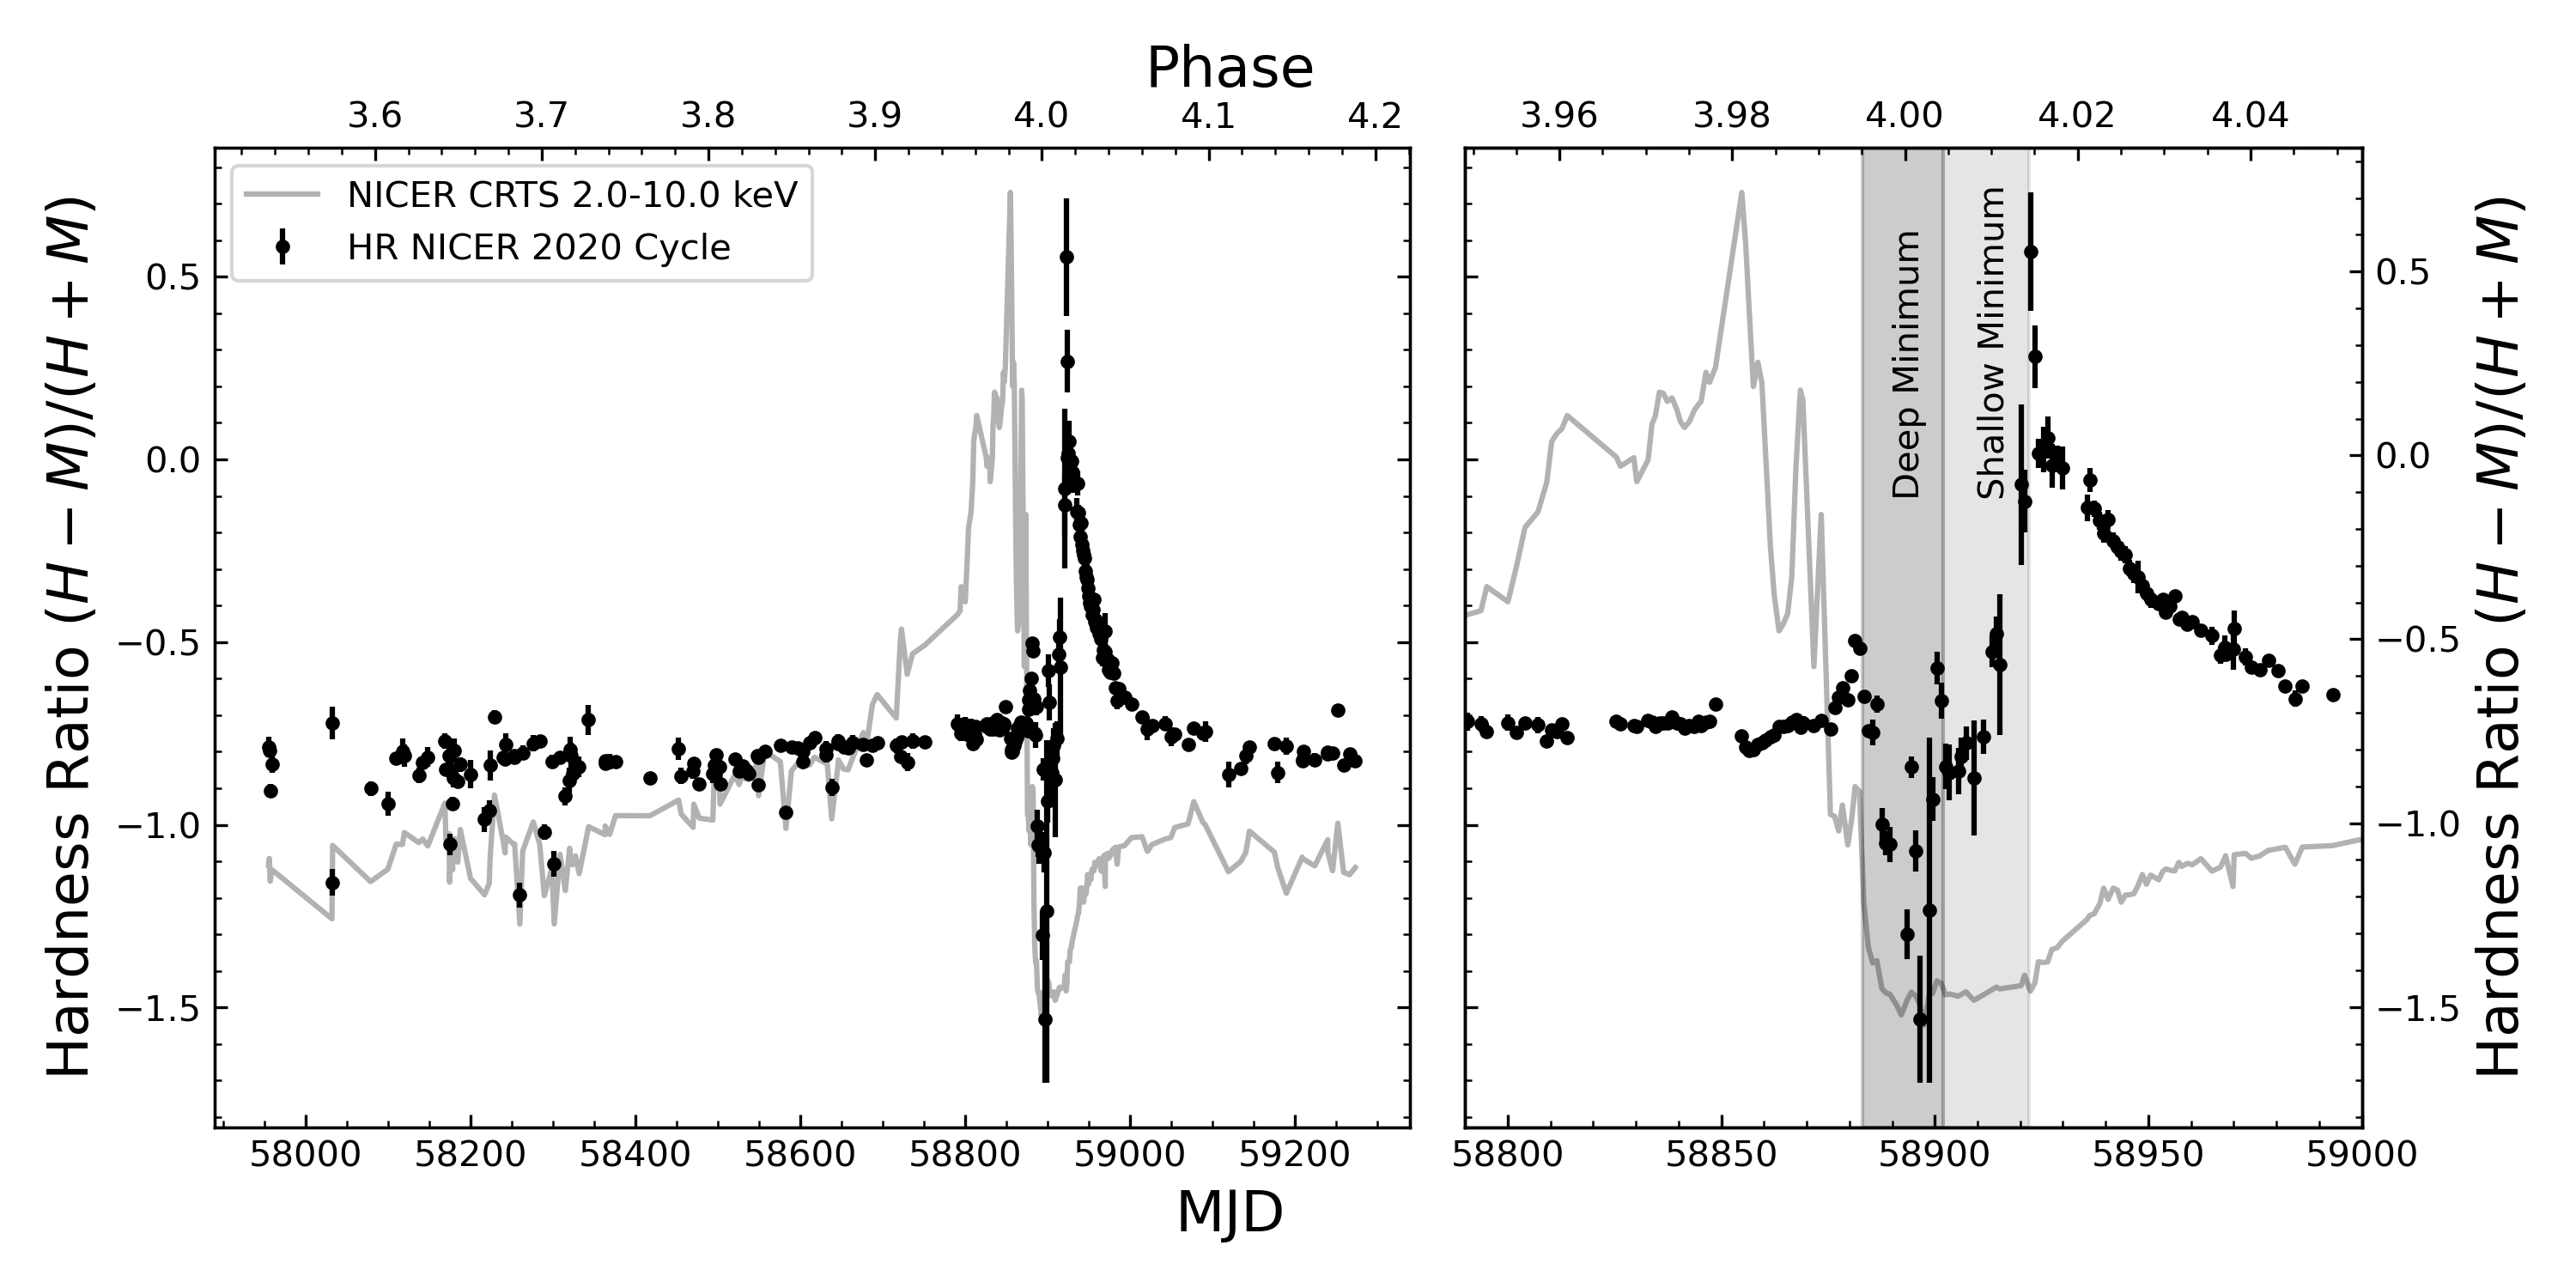
We calculated the hardness ratio where , the hard band, is defined as the net count rates between keV, and the medium energy band, , the net count rates between keV. We chose these bands because both are dominated by the colliding-wind source with (generally) minimal background contamination, and because the medium band is also sensitive to changes in absorption (as shown in Figure 6) more so than the hard band. This hardness ratio (HR) mainly provides a measure of how the absorption to the X-ray source is changing in time, since changes in shock temperature should be modest, because for most of the orbit the winds collide at terminal velocity.
Figure 4 shows the derived HR from the NICER observations. The HR shows a nearly linear increase with a small positive slope from mid-cycle near apastron to about 20 days before the start of the X-ray minimum, indicating that the hard band flux increases more rapidly compared to the soft band flux, probably due to residual absorption in the soft band. After this, there is a significant increase in the HR occurring in a short phase interval, days, due to a combined increase in emission measure of the shocked wind from the secondary and increased absorption by the wind of Car-A as the colliding-wind shock starts to move closer to and behind the primary star. This hardness increase happens at the same time the colliding-wind flux is at its observed maximum just before the plunge to minimum. When the plunge to flux minimum starts, the HR also decreases, implying the higher energy emission is decreasing rapidly compared to lower-energy emission. This abrupt decline marks the start of the “deep” X-ray minimum, when the source spectrum is dominated by soft emission from the “Central Constant Emission” (CCE) component (Hamaguchi et al., 2007b), cosmic background in the NICER field-of-view, and uncertainties in correction of background contamination, and the colliding-wind source emission is depressed.
Shortly thereafter, the HR abruptly increases marking the end of the deep minimum, followed by a short interval during which the HR continues to increase, but at a slower rate. This time corresponds to the “shallow” part of the X-ray minimum. As the colliding-wind source strengthens, the HR abruptly reaches a maximum (which corresponds to the end of the post-minimum flux increase in the 6.5 – 7.5 keV band shown in Figure 3), then declines in a quasi-exponential fashion, as the colliding-wind emission increases but the soft band emission is still heavily absorbed by the wind of Car-A.
4 The NICER X-ray Spectrum
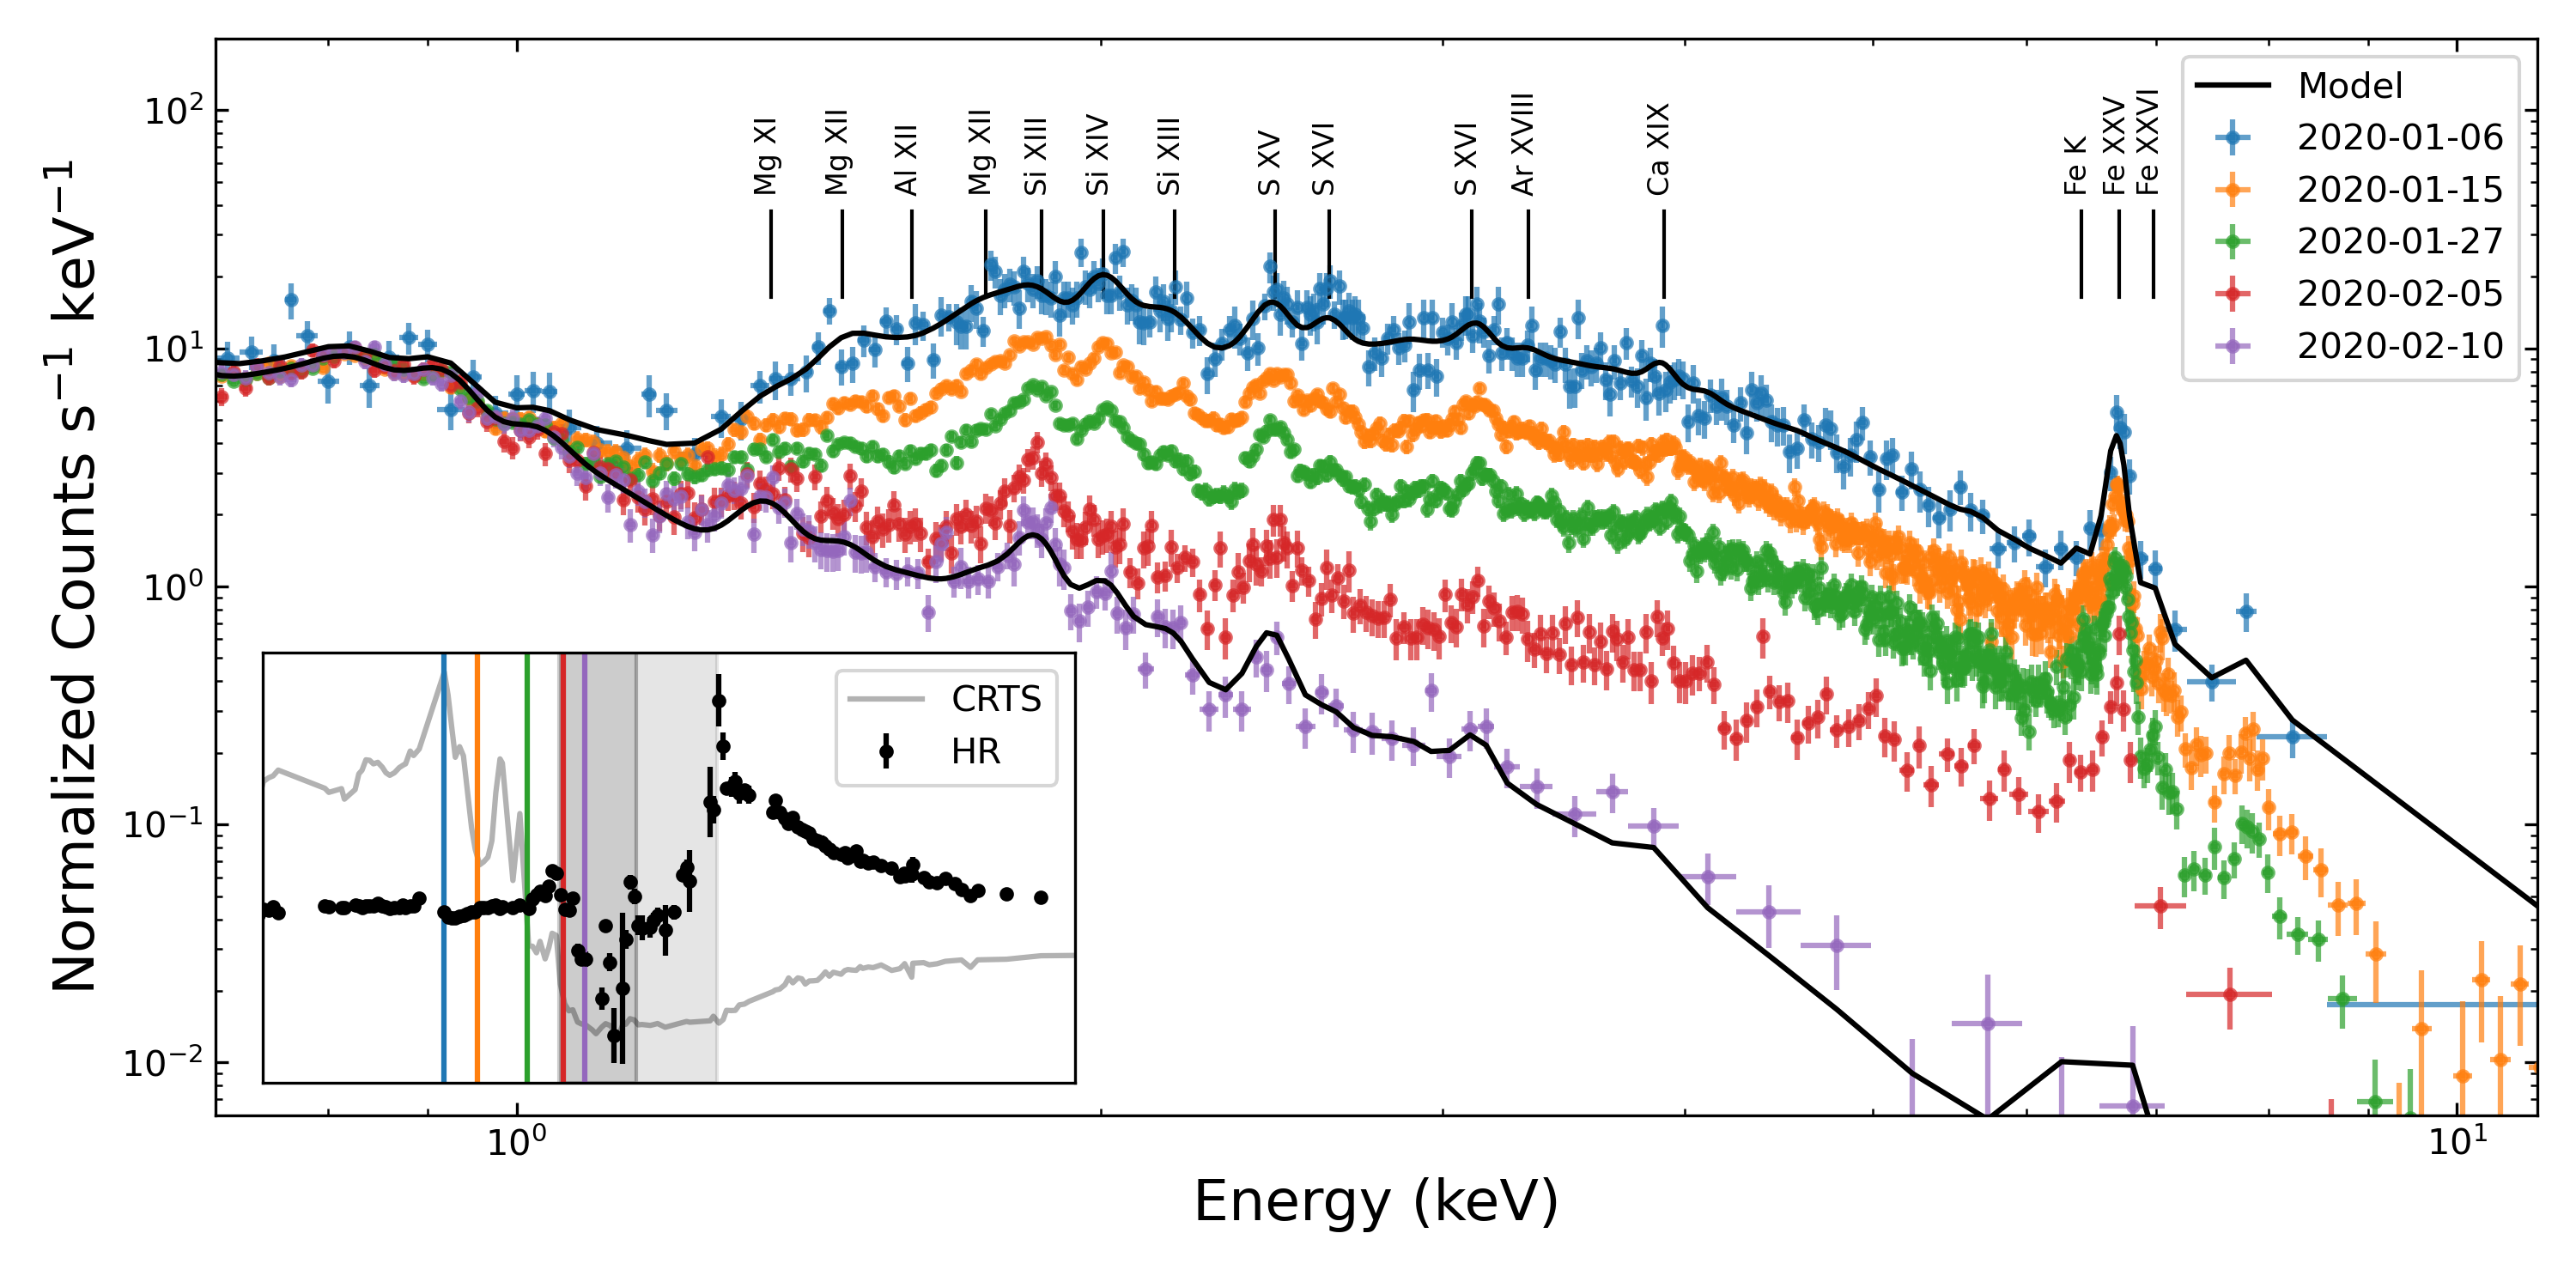
Figure 5 shows NICER spectra from the last X-ray maximum (06 January 2020), through the plunge, and until the last X-ray minimum (10 February 2020). Figure 5 is similar to Figure 2 in Kashi et al. (2021) but chosen to avoid flare peaks. Some strong emission lines are marked. The first three spectra show a gradual decline in count rate above 1.5 keV. By 5 February the harder X-ray emission near 1.5 keV is so low that the CCE is clearly observed in the region close to 2.0 keV. The strong Fe XXV feature is still present on 5 February, indicating that hard X-ray emission disappears completely only at minimum.
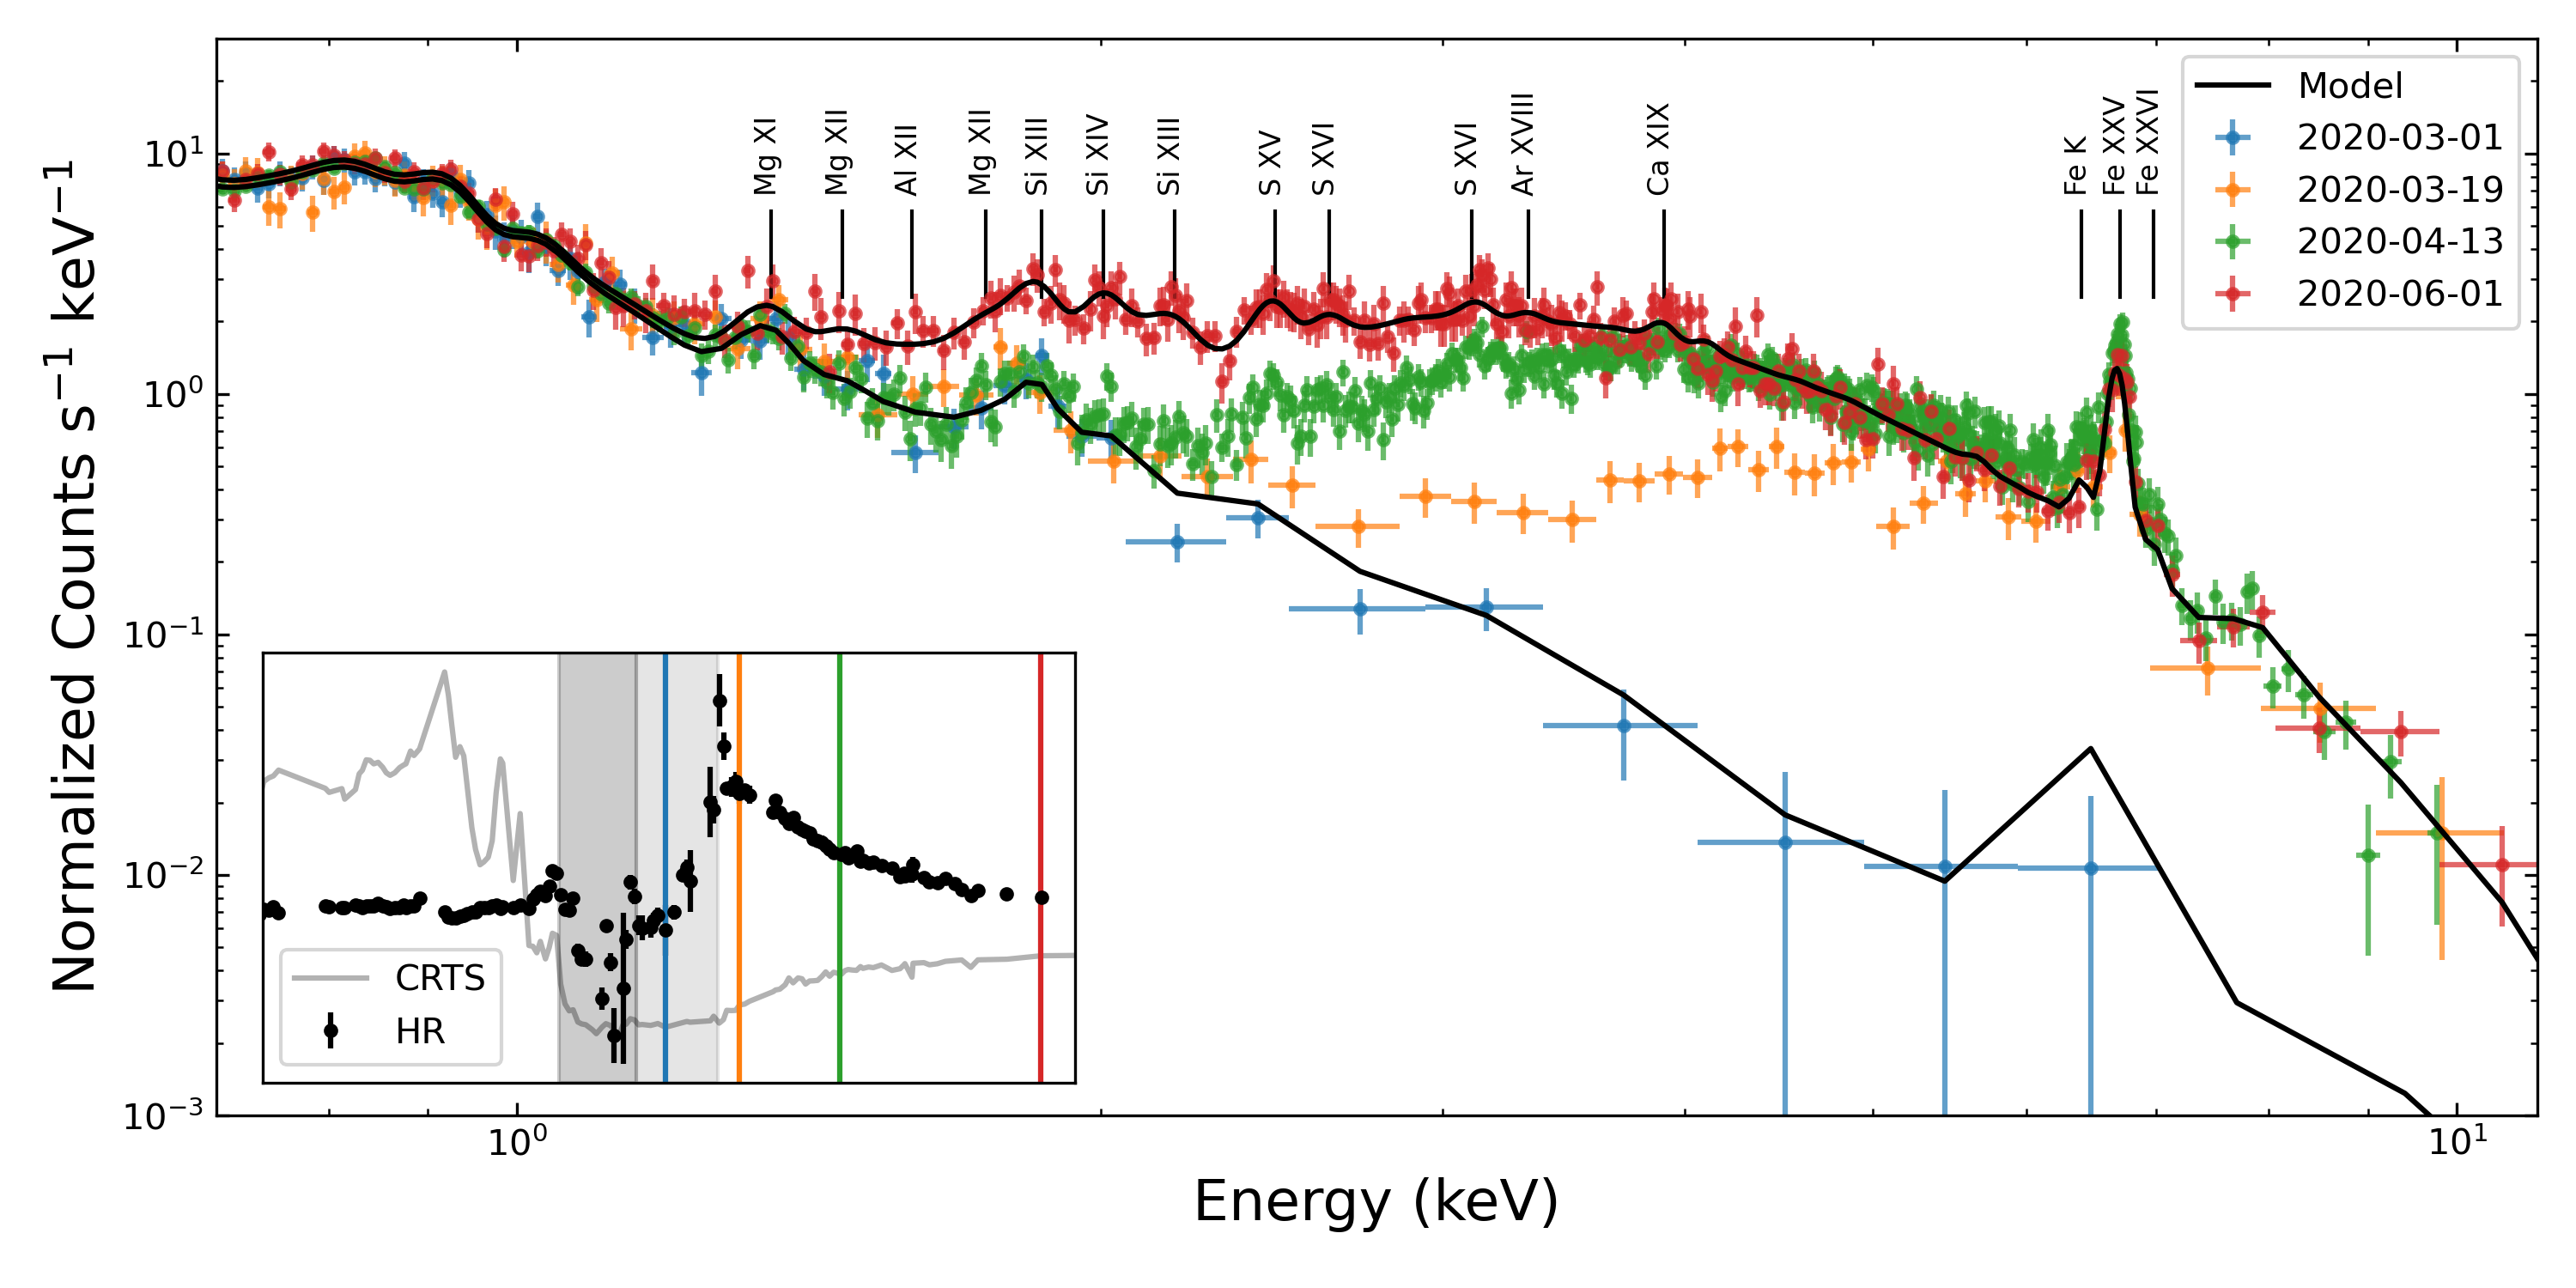
Figure 6 shows a sample of four NICER spectra of Car from the X-ray minimum (01 Mar 2020, in blue) up to three months later after the X-ray emission has completely recovered from the X-ray minimum (1 Jun 2020, in blue). Figure 6 can be compared to Figure 4 from Hamaguchi et al. (2007b), which shows a similar montage of the XMM-Newton spectra of Car from 2003. The colliding wind emission cannot be seen below 1.5 keV due to absorption from the Homunculus nebula, which correspond to N1022 cm-2. The emission below 1.0 keV comes from the OE and does not change significantly. The emission above 4.0 keV recovers faster than the emission between 2.0 - 4.0 keV since it is less affected by absorption, as can be seen by comparing the 19 March and 1 March spectra. By 3 April 2020 (30 days after the start of the X-ray minimum) the flux above 4 keV has fully recovered, with the colliding wind flux below 4 keV continuing to increase through June 1. Emission above 1.5 keV is mostly thermal emission from the hot shocked wind from the companion star, Car-B, while below 1.5 keV emission is dominated by the soft thermal emission in the OE. It is worth noting that the Fe XXV line can be detected by NICER even in a short (889 s) observation during the X-ray minimum. In addition to the thermal line emission, NICER clearly shows the Fe-K fluorescence line at 6.4 keV (See Corcoran et al., 1998) blended with the 6.7 keV Fe XXV triplet.
4.1 X-ray Template Model
Car’s spectrum varies over different phases, changing the physical parameters that produce the X-ray emission from the CWR. In order to obtain a better estimation of the temperatures and the column densities from the NICER spectrum we used an Car spectrum template using all available dispersed spectra from the CHANDRA HETG (Espinoza-Galeas & Corcoran, 2020; Espinoza-Galeas, 2021, Espinoza-Galeas et al. 2022, in prep, ). We combined the 32 CHANDRA HETG observations in Table 4 to obtain a high-precision dispersed X-ray spectrum with a total exposure of 2 Msec, with a exposure weighted average phase of 0.73. This is the highest precision, highest spectral resolution spectrum of Car currently available. We fit the combined spectrum with a linear combination of a small number of collisionally-ionized plasma models444http://atomdb. org/ plus a Gaussian line to model the fluorescence Fe K emission line, plus absorption (Wilms et al., 2000). The NICER spectra are not sensitive to the broadening of the emission lines, but using the CHANDRA combined spectrum it was clear that a velocity-broadened model was necessary. We found that two velocity-broadened non-solar abundance thermal components were sufficient to describe the combined HETG spectrum. We used the CHANDRA combined spectrum as a template model to fit each NICER spectrum to derive X-ray spectral parameters. We fixed the abundances and line broadening to the CHANDRA values when fitting the NICER spectra.
| obsid | expt | Date | MJD | Phase |
|---|---|---|---|---|
| 632 | 89545.68 | 2000-11-19T02:47:43 | 51867.65 | 0.527 |
| 3749 | 91280.92 | 2002-10-16T08:09:53 | 52563.89 | 0.871 |
| 3745 | 94533.00 | 2003-05-02T11:57:20 | 52762.07 | 0.969 |
| 3748 | 97249.20 | 2003-06-16T05:36:31 | 52806.82 | 0.991 |
| 7445 | 25393.24 | 2008-10-15T20:18:41 | 54755.01 | 1.954 |
| 10787 | 68904.23 | 2008-10-21T23:11:26 | 54761.38 | 1.957 |
| 10831 | 17589.25 | 2008-12-08T12:31:41 | 54808.63 | 1.980 |
| 8930 | 29646.37 | 2008-12-10T01:49:02 | 54810.26 | 1.981 |
| 10827 | 27365.77 | 2008-12-12T17:34:07 | 54812.90 | 1.983 |
| 10895 | 15257.55 | 2009-03-16T17:18:12 | 54906.82 | 2.029 |
| 10894 | 21986.45 | 2009-03-17T21:26:40 | 54908.04 | 2.030 |
| 9945 | 31275.61 | 2009-04-21T06:46:35 | 54942.48 | 2.047 |
| 10905 | 26298.47 | 2009-04-26T13:56:49 | 54947.75 | 2.049 |
| 9946 | 56628.15 | 2009-09-06T20:45:21 | 55081.21 | 2.116 |
| 11992 | 18428.78 | 2009-12-21T12:52:08 | 55186.66 | 2.167 |
| 11017 | 17454.93 | 2009-12-22T09:47:25 | 55187.52 | 2.168 |
| 12064 | 17703.14 | 2009-12-23T03:48:06 | 55188.28 | 2.168 |
| 12065 | 18625.89 | 2009-12-23T23:44:42 | 55189.11 | 2.168 |
| 11993 | 43826.40 | 2010-11-14T13:33:42 | 55514.84 | 2.329 |
| 11994 | 39364.24 | 2010-11-21T07:26:40 | 55521.56 | 2.333 |
| 12358 | 102189.1 | 2011-10-20T11:19:40 | 55855.10 | 2.497 |
| 13670 | 31173.59 | 2012-10-19T16:25:08 | 56219.88 | 2.678 |
| 15569 | 68162.57 | 2012-10-20T17:29:41 | 56221.15 | 2.678 |
| 21177 | 29027.65 | 2019-05-16T02:58:19 | 58619.31 | 3.863 |
| 22218 | 15446.14 | 2019-05-17T00:32:15 | 58620.12 | 3.864 |
| 22219 | 33862.69 | 2019-05-18T17:35:26 | 58621.94 | 3.864 |
| 21178 | 29024.17 | 2019-07-01T17:56:35 | 58665.93 | 3.886 |
| 22272 | 27089.92 | 2019-07-02T10:13:04 | 58666.60 | 3.887 |
| 22273 | 15489.07 | 2019-07-04T10:01:32 | 58668.52 | 3.887 |
| 21179 | 57150.21 | 2019-08-27T05:54:31 | 58721.71 | 3.914 |
| 21180 | 24249.47 | 2019-10-08T13:56:11 | 58764.74 | 3.937 |
| 22310 | 19570.27 | 2020-01-06T01:58:12 | 58854.21 | 3.981 |
| 23117 | 19570.34 | 2020-01-06T17:13:59 | 58854.84 | 3.981 |
| 23119 | 19567.59 | 2020-01-11T06:06:16 | 58859.38 | 3.983 |
| 22311 | 34169.62 | 2020-01-13T11:07:07 | 58861.68 | 3.984 |
| 23126 | 34168.16 | 2020-01-14T10:03:59 | 58862.63 | 3.985 |
| 22846 | 29302.70 | 2020-01-16T02:34:15 | 58864.29 | 3.986 |
| 22847 | 14703.70 | 2020-01-26T16:22:24 | 58874.78 | 3.991 |
| 23131 | 33195.76 | 2020-01-27T16:42:56 | 58875.90 | 3.991 |
To model the NICER spectra, we also added to the HETG model a third non-variable thermal component to account for non-variable soft emission below 1.5 keV from the shocked gas in the OE (which is not strongly visible in the HETG spectrum). The initial spectral model parameters are given in Table 5. We then fit all the net NICER spectra, allowing temperatures, column densities and emission measures (normalization) of the two colliding-wind components to vary, with other components and the OE emission component held fixed.
A complete detailed analysis of the combined HETG CHANDRA spectrum is in Espinoza-Galeas (2021). To compare NICER temperatures and column densities we also present preliminary results of temperatures and column densities using the individual HETG CHANDRA spectra (Espinoza-Galeas et al. 2022, in prep).
| Parameter | Cooler Comp | Hotter Comp | Outer Ejecta Comp |
|---|---|---|---|
| NH ( cm-2 | 3.00 | 10.00 | 0.60 |
| kT (keV) | 1.26 | 4.43 | 0.25 |
| Redshift | 0.00 | 0.00 | 0.00 |
| Broadening (km s | 598.00 | 888.88 | 900.00 |
| He | 1.00 | fixed | fixed |
| C | 1.00 | fixed | fixed |
| N | 20.00 | fixed | fixed |
| O | 1.00 | fixed | fixed |
| Ne | 1.00 | fixed | fixed |
| Mg | 0.59 | fixed | fixed |
| Al | 0.47 | fixed | fixed |
| Si | 0.41 | fixed | fixed |
| S | 0.46 | fixed | fixed |
| Ar | 0.66 | fixed | fixed |
| Ca | 0.88 | fixed | fixed |
| Fe | 0.51 | fixed | fixed |
| Ni | 1.00 | fixed | fixed |
Note. — Elemental abundances are relative to solar values, using Anders & Grevesse (1989). The model also includes a variable gaussian iron K line near 6.4 keV.
4.2 Flux Variations
Figure 7 shows the NICER flux between 2.0 – 10.0 keV of all the NICER observations using the nibackgen3C50 estimator to correct for background, although this model overestimates background for a small number of observations under conditions of high background. The bottom panel shows the reduced value for all the fits, which is generally acceptable except close to X-ray minimum when uncertainties in background subtraction play a significant role in defining the net spectrum. The inset highlights the variations near the X-ray minimum.
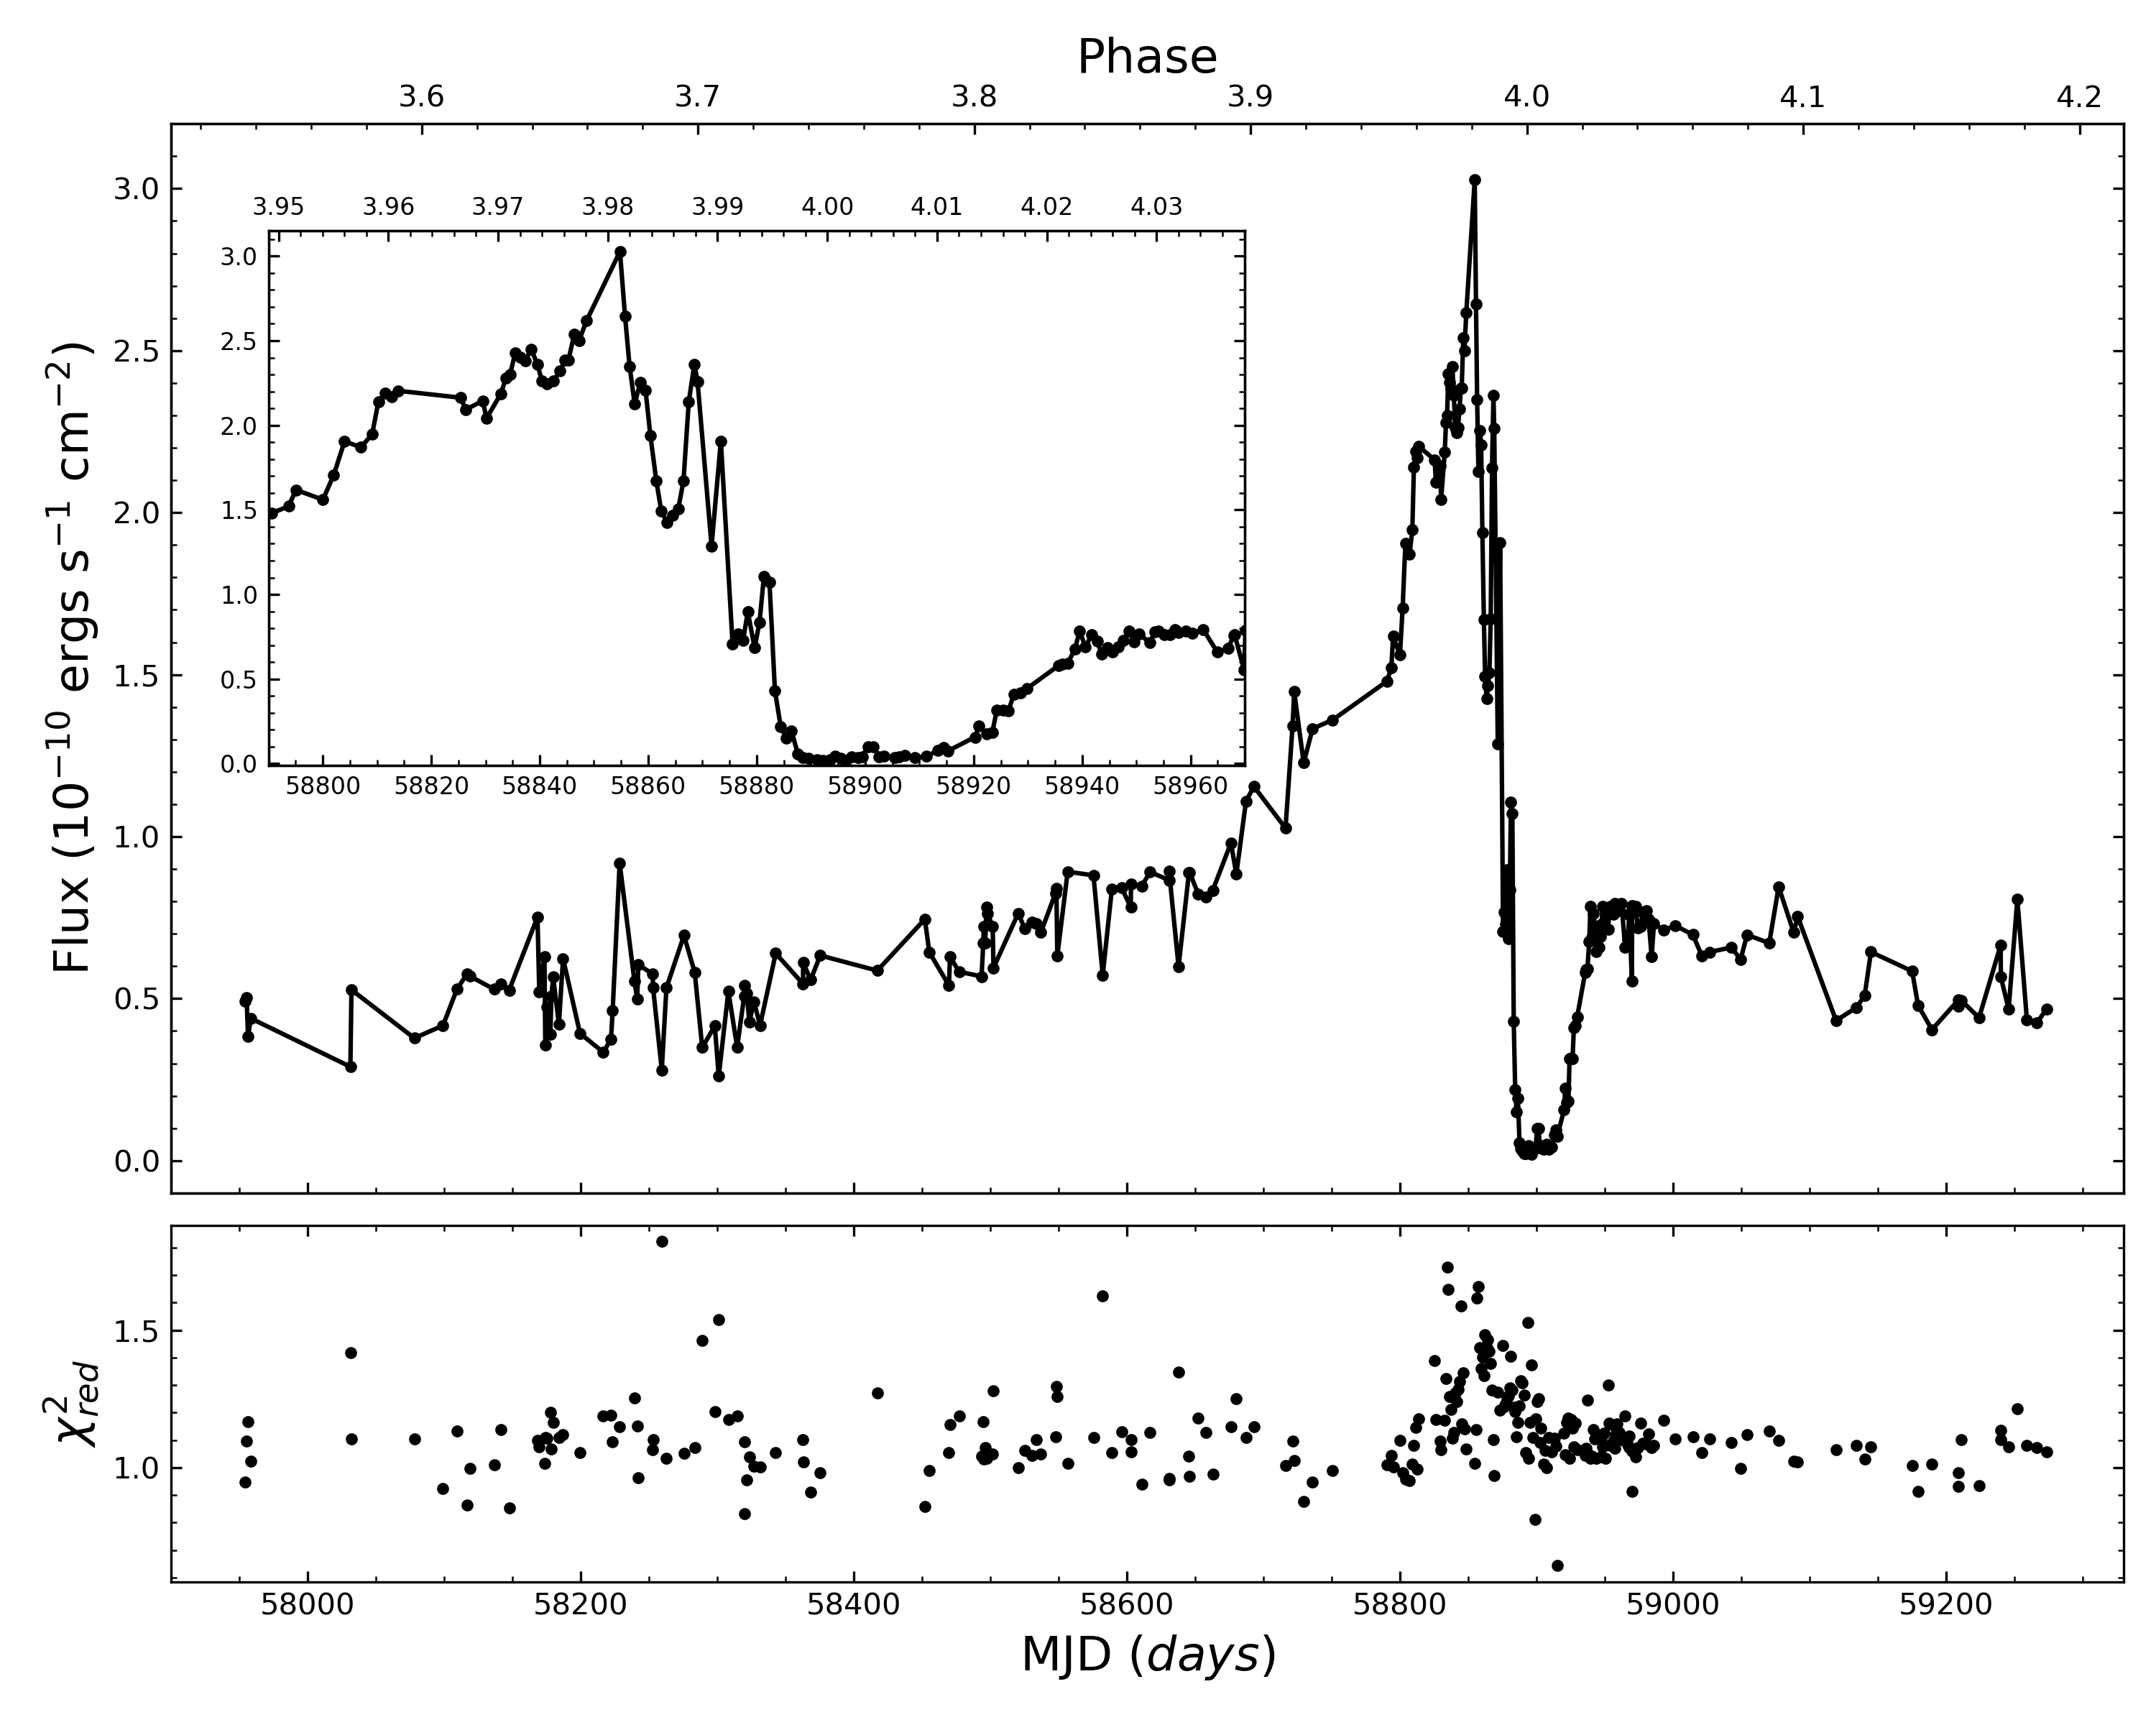
Figure 8 shows the flux between 2.0 – 10.0 keV in ergs s-1 cm-2 compared with RXTE and Swift fluxes in the same band (taken from Corcoran et al., 2017). The three telescopes have instrumental differences and different fields of view that can cause differences in the flux in the same range due to the varying amount of cosmic and instrumental background contamination and other factors. We calibrated the data from NICER with the RXTE and Swift data by subtracting a small amount of flux from each flux measure to match the flux of the X-ray deep minimum in all the cycles. During the deep minimum the net flux is close to the cosmic X-ray background and flux differences are minimal then.
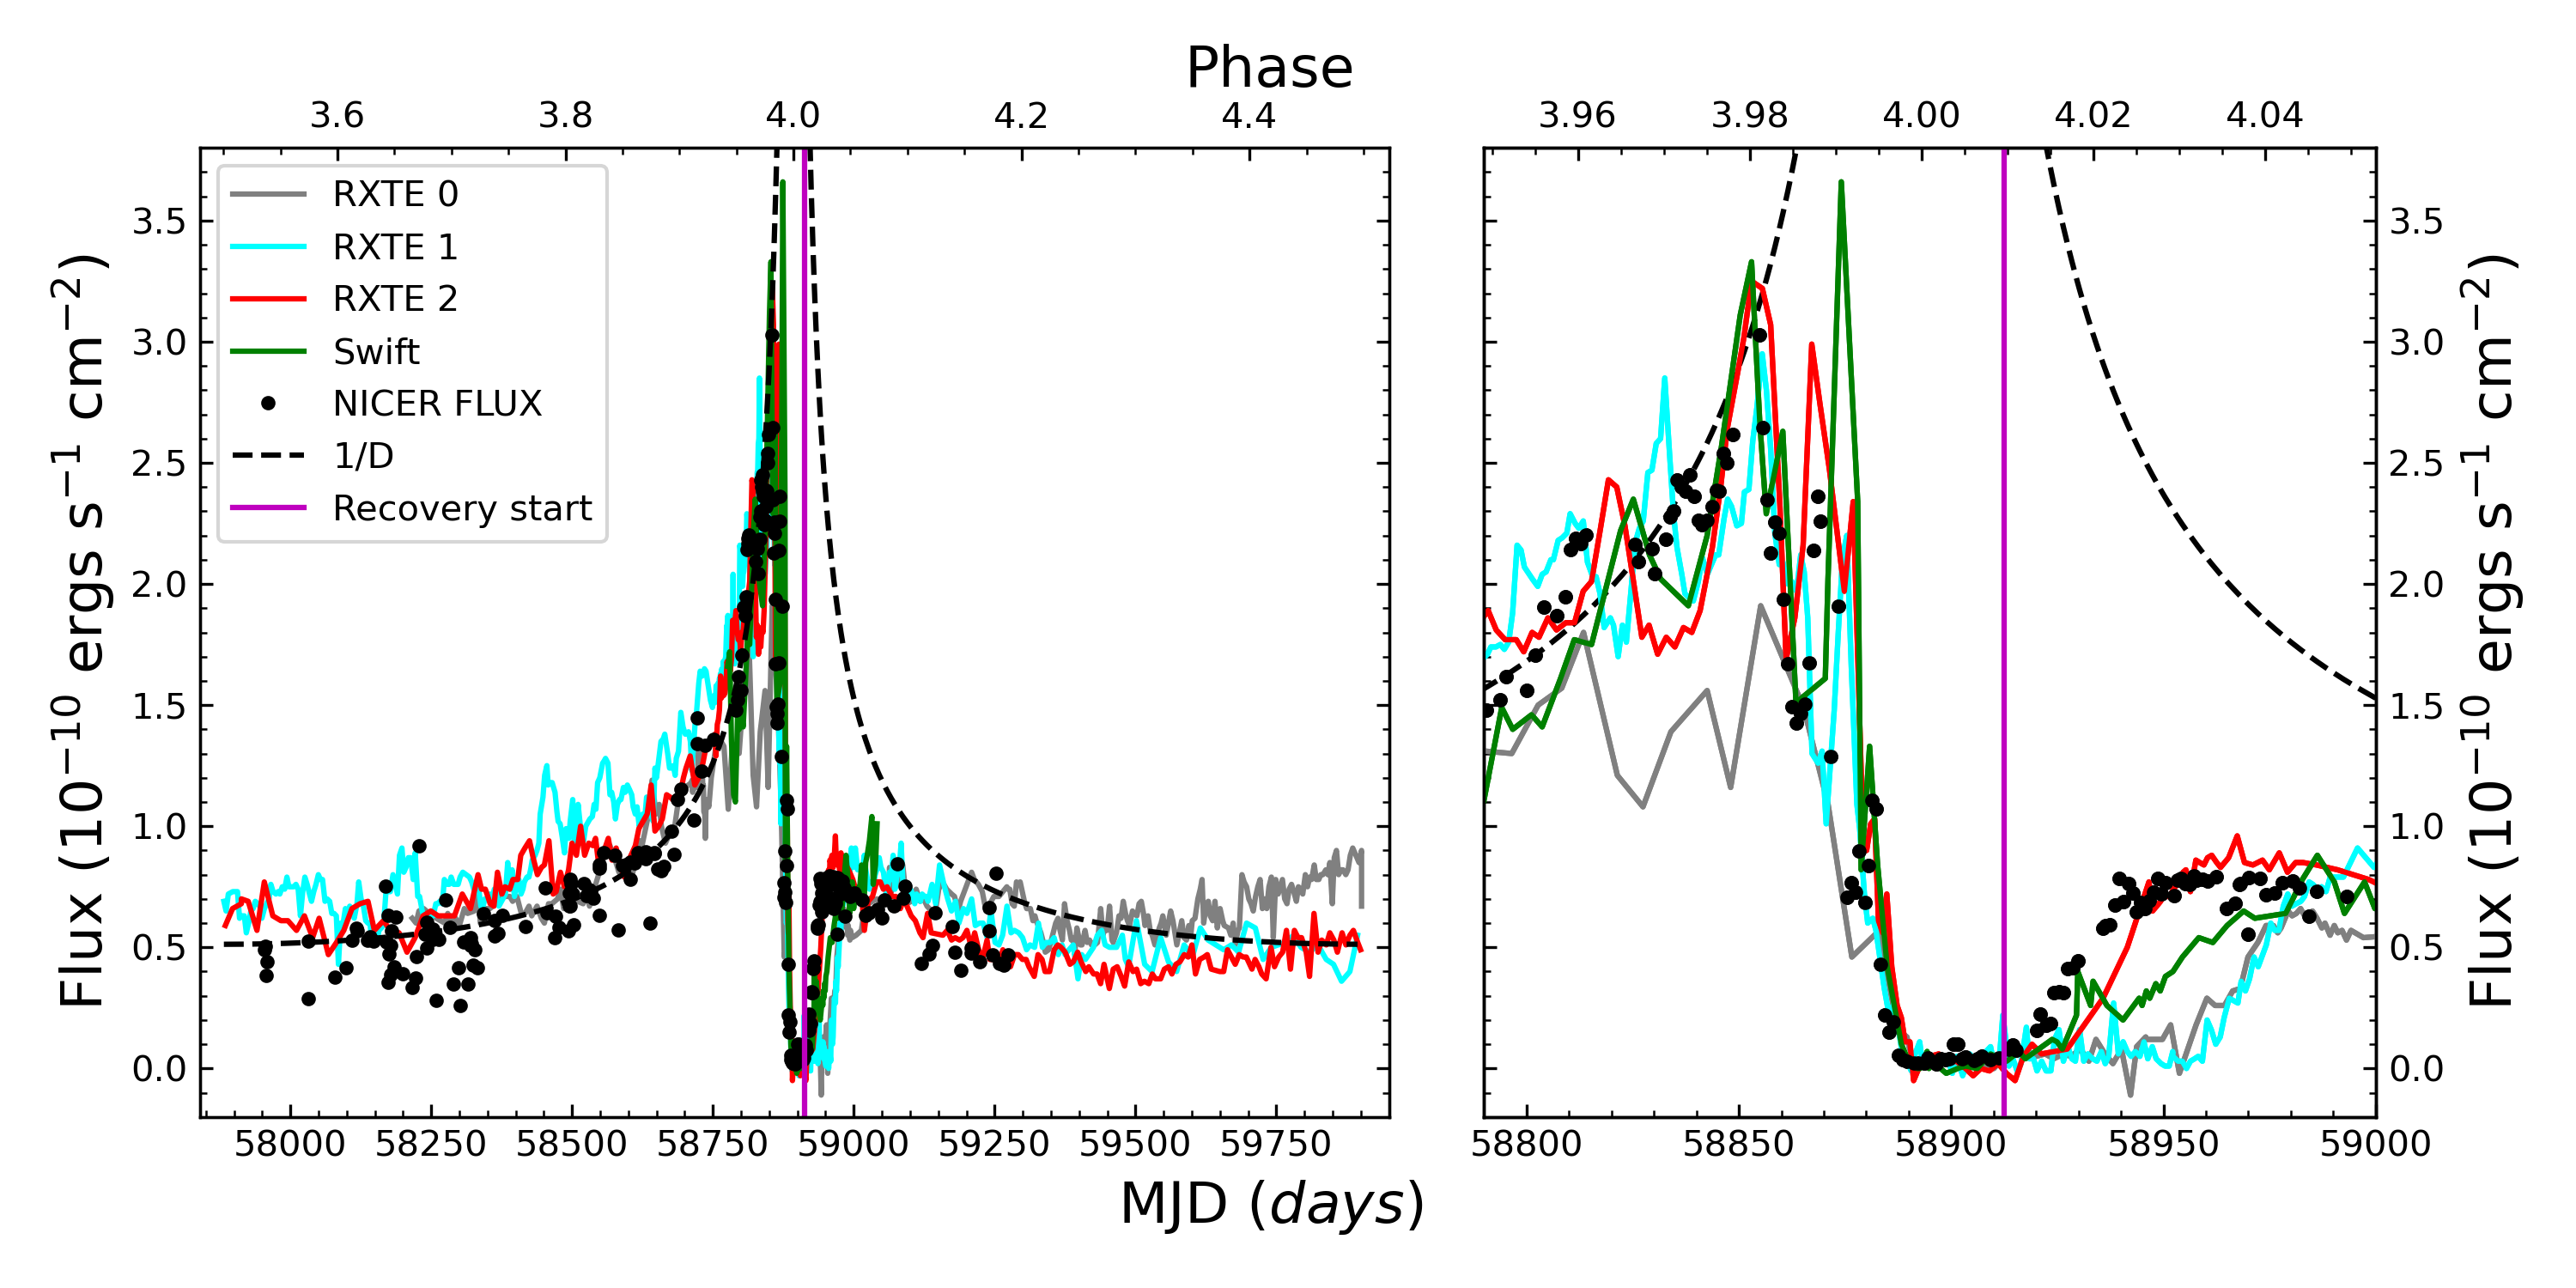
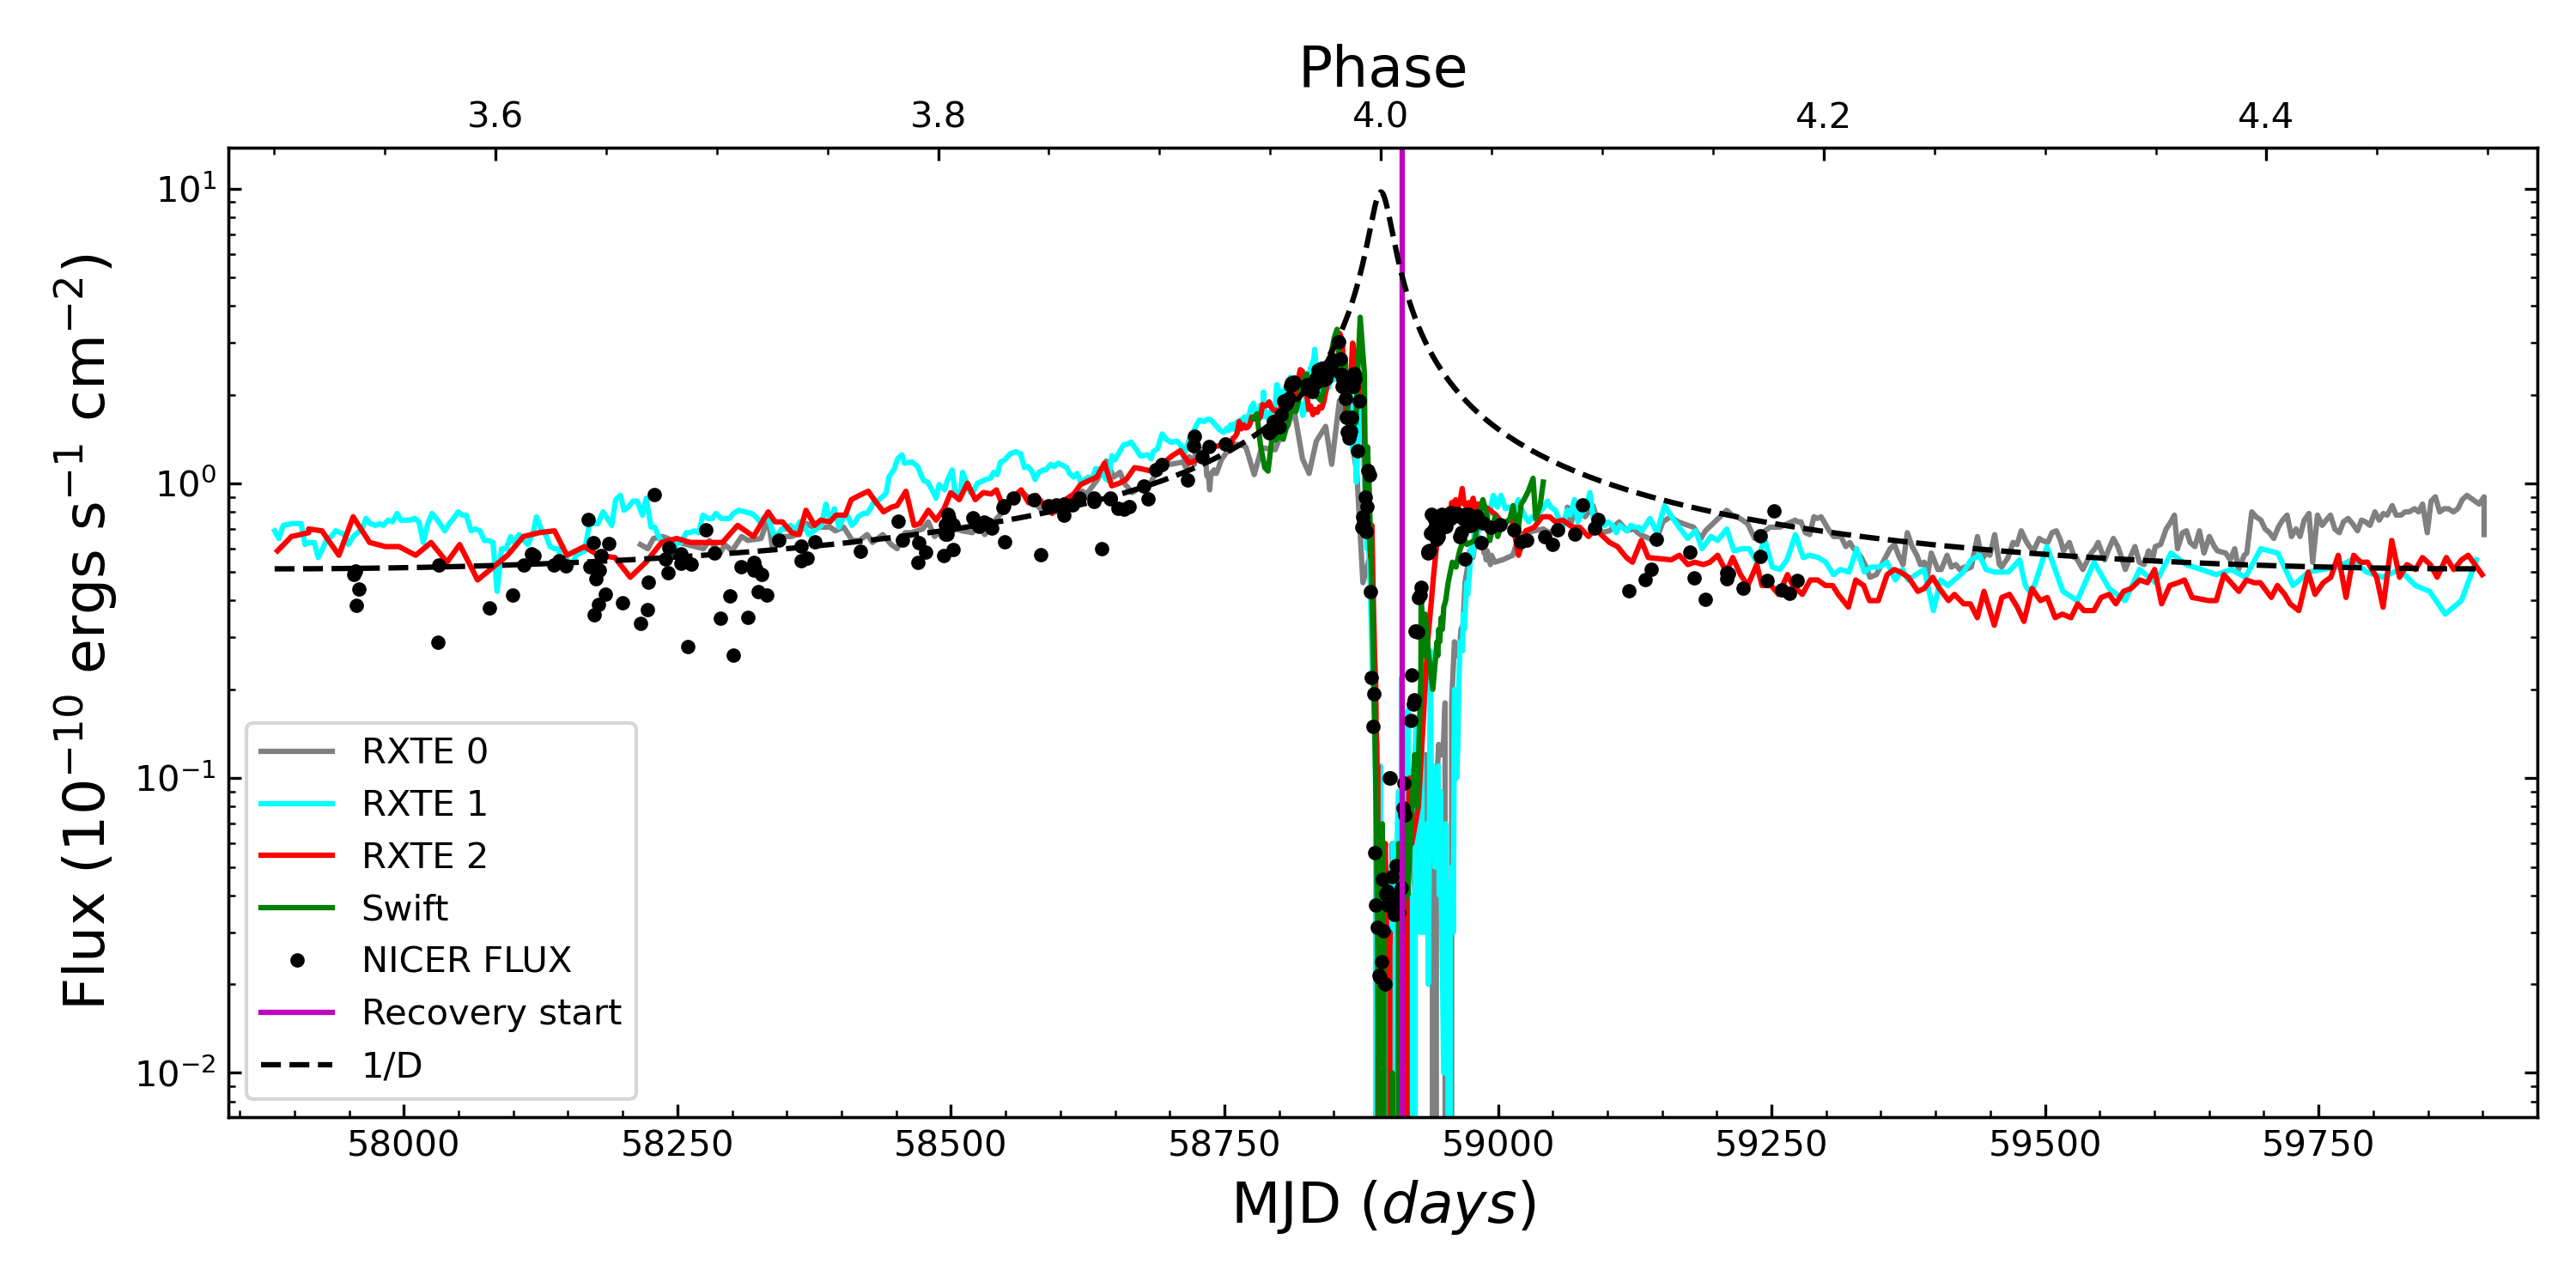
X-ray flux from a colliding-wind shock in an eccentric binary should vary inversely with the separation of the stars (Usov, 1992; Stevens et al., 1992) if the shock cools adiabatically. The smooth dashed curve in Figure 8 shows a variation using the orbital elements in Table 1. For most of the orbit, the NICER 2 – 10 keV X-ray flux agrees with the curve, but starts to deviate from it 10 days before the X-ray minimum is reached. Prior to X-ray minimum, the RXTE fluxes lie on the curve which fits the NICER data, though the agreement is better about 80 days after X-ray minimum.
Once reaching maximum flux, the NICER lightcurve shows the same plunge into the X-ray minimum as seen in the earlier orbital cycles, as shown in the inset in the upper panel in Figure 8. The X-ray minimum is caused by a combination of eclipse and the disruption of the shock around Car B by the wind of Car A, as discussed by Hamaguchi et al. (2014). According to Eq. 1, the deep X-ray minimum should have been reached around 14 February 2020. NICER observed the deep minimum around 13 February 2020 as we reported in Corcoran et al. (2020).
Based on the behavior shown in previous cycles, the end of the X-ray minimum was expected no earlier than the end of March. But the NICER data show a clear increase in flux between 0.5 - 9.0 keV starting approximately on 15 March 2020 (MJD 58923.0, Espinoza-Galeas et al., 2020). This was the earliest recovery of Car’s X-ray emission yet observed. The flux increase from minimum in the 2 – 10 keV band ended by MJD 58950 (2020-04-11). The analogous analysis in Kashi et al. (2021) shows similar results, confirming our announcement in Espinoza-Galeas et al. (2020).
4.3 The X-ray Period
We re-determined the X-ray period including the NICER data using a simple implementation of a phase-dispersion minimization technique (Stellingwerf, 1978). We phase-folded the four X-ray flux curves from RXTE, Swift(Corcoran et al., 2017), and NICER using trial periods in the range 2015 – 2025 days. For each trial period, we interpolated each flux curve to a common phase scale assuming a common epoch, then calculated the sum of the residuals between the three flux curves relative to the NICER fluxes. Figure 9 plots the summed residuals versus test phase. We found that a period of 2023.03 1.12 days yielded the smallest summed residuals. This period is 0.36 days shorter than the X-ray period derived by Corcoran et al. (2017), and 0.33 days longer than the period derived from analysis of the He II 4686 emission line by Teodoro et al. (2016).
Corcoran et al. (2017) calculated an error of 0.71 which is smaller than our calculation. This is probably due to the high variability of the first observations made with high background conditions. But, the calculation of the period in this work is still in very good agreement with Teodoro et al. (2016) and Corcoran et al. (2017). We decided to keep the period of 2023.40 0.71 days to try to avoid the uncertainty added by the first NICER observations.

4.4 X-ray Flaring
Just prior to minimum, the X-ray emission from Car brightens and undergoes a period of rapid variability (“flares”) which have been observed by RXTE, Swift, and now NICER. X-ray “flaring” seen by NICER was first observed on MJD 58802 (15 November 2019, Corcoran et al., 2019), about 90 days prior to the X-ray minimum, similar to the start of the flare interval seen by RXTE and Swift. During the flare interval, the X-ray flux in the 2 – 10 keV band changes dramatically on timescales of days. This rapid X-ray variability has been seen by all three instruments. However, the RXTE cycle 0 observations were not obtained as frequently as observations in latter cycles, which meant some of the short-timescale variations were not sampled as completely as they were in subsequent cycles. Except for the undersampled RXTE cycle 0 observations, the maximum fluxes in the flares are similar.
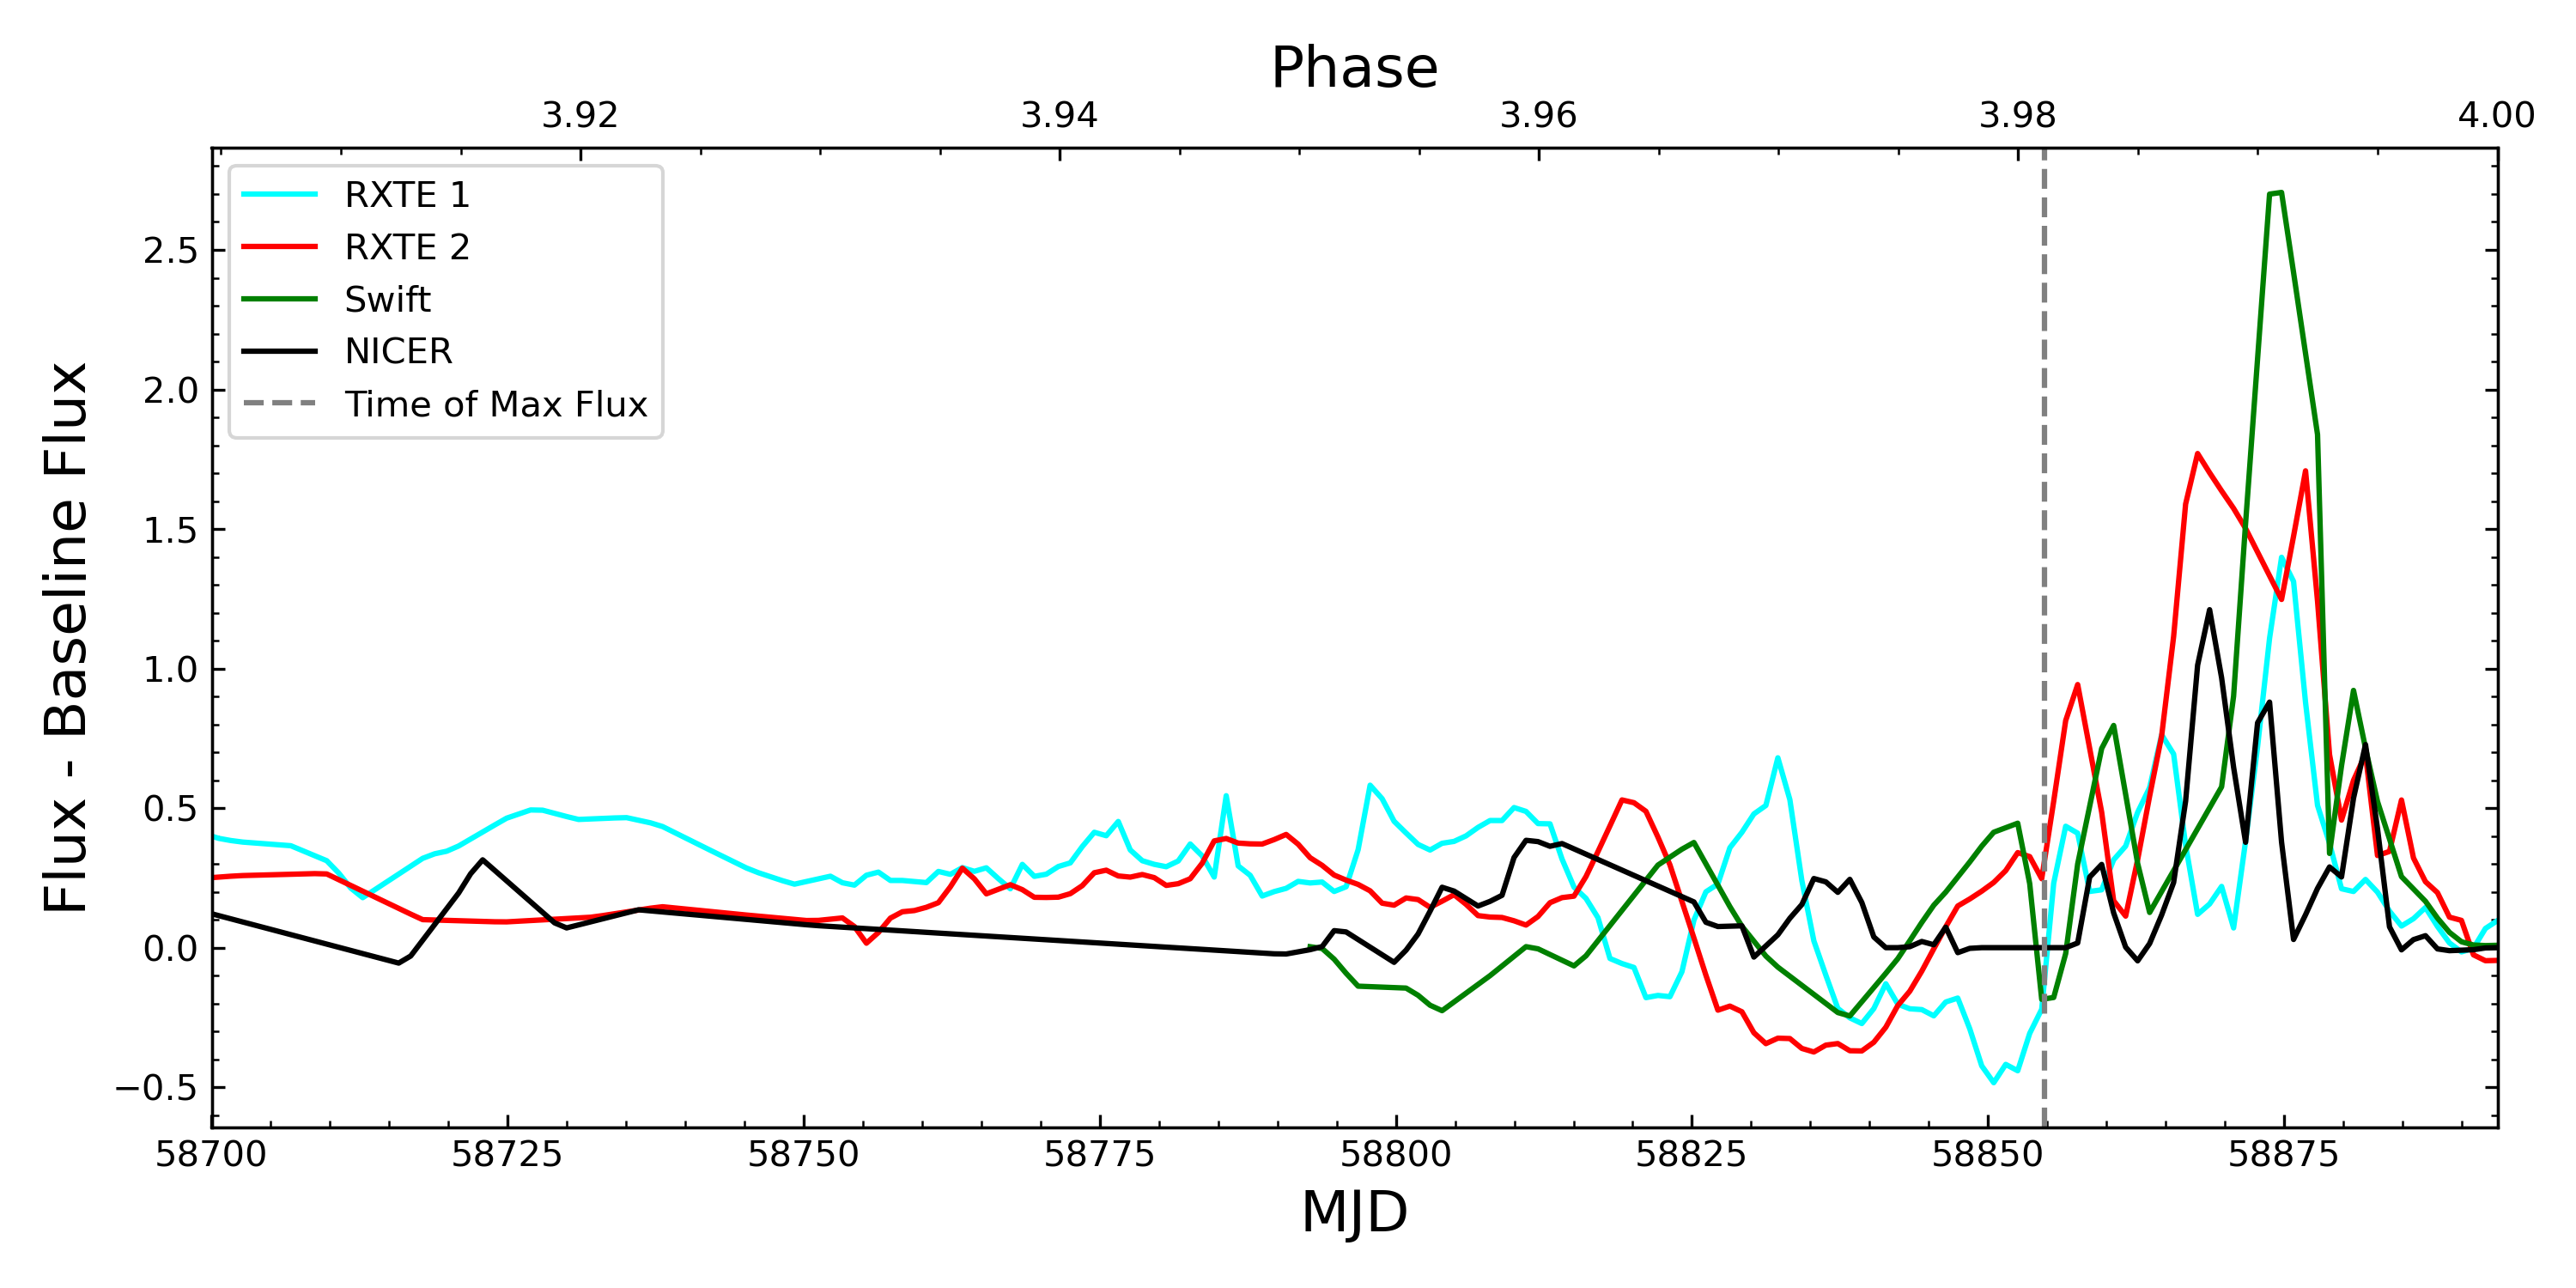
To quantify the flaring observed by NICER we adopted a process similar to that used by Moffat & Corcoran (2009), namely we estimate an underlying smooth flux baseline by eye, and then subtracted this baseline from the net NICER fluxes. One difference with Moffat & Corcoran (2009) analysis is that we use for the baseline flux observations that follow closely the line in Figure 8. Also we use the same NICER baseline flux to calculate the RXTE and Swift residuals. The NICER fluxes, the baseline, and the residuals are shown in Figure 10. In Figure 10, the NICER measures are shown versus time using the epoch of periastron given by Corcoran et al. (2017). Figure 10 also compares the residuals for the RXTE and Swift data (we do not include the first set of RXTE observations since the sampling frequency was not as high as in the later two cycles).
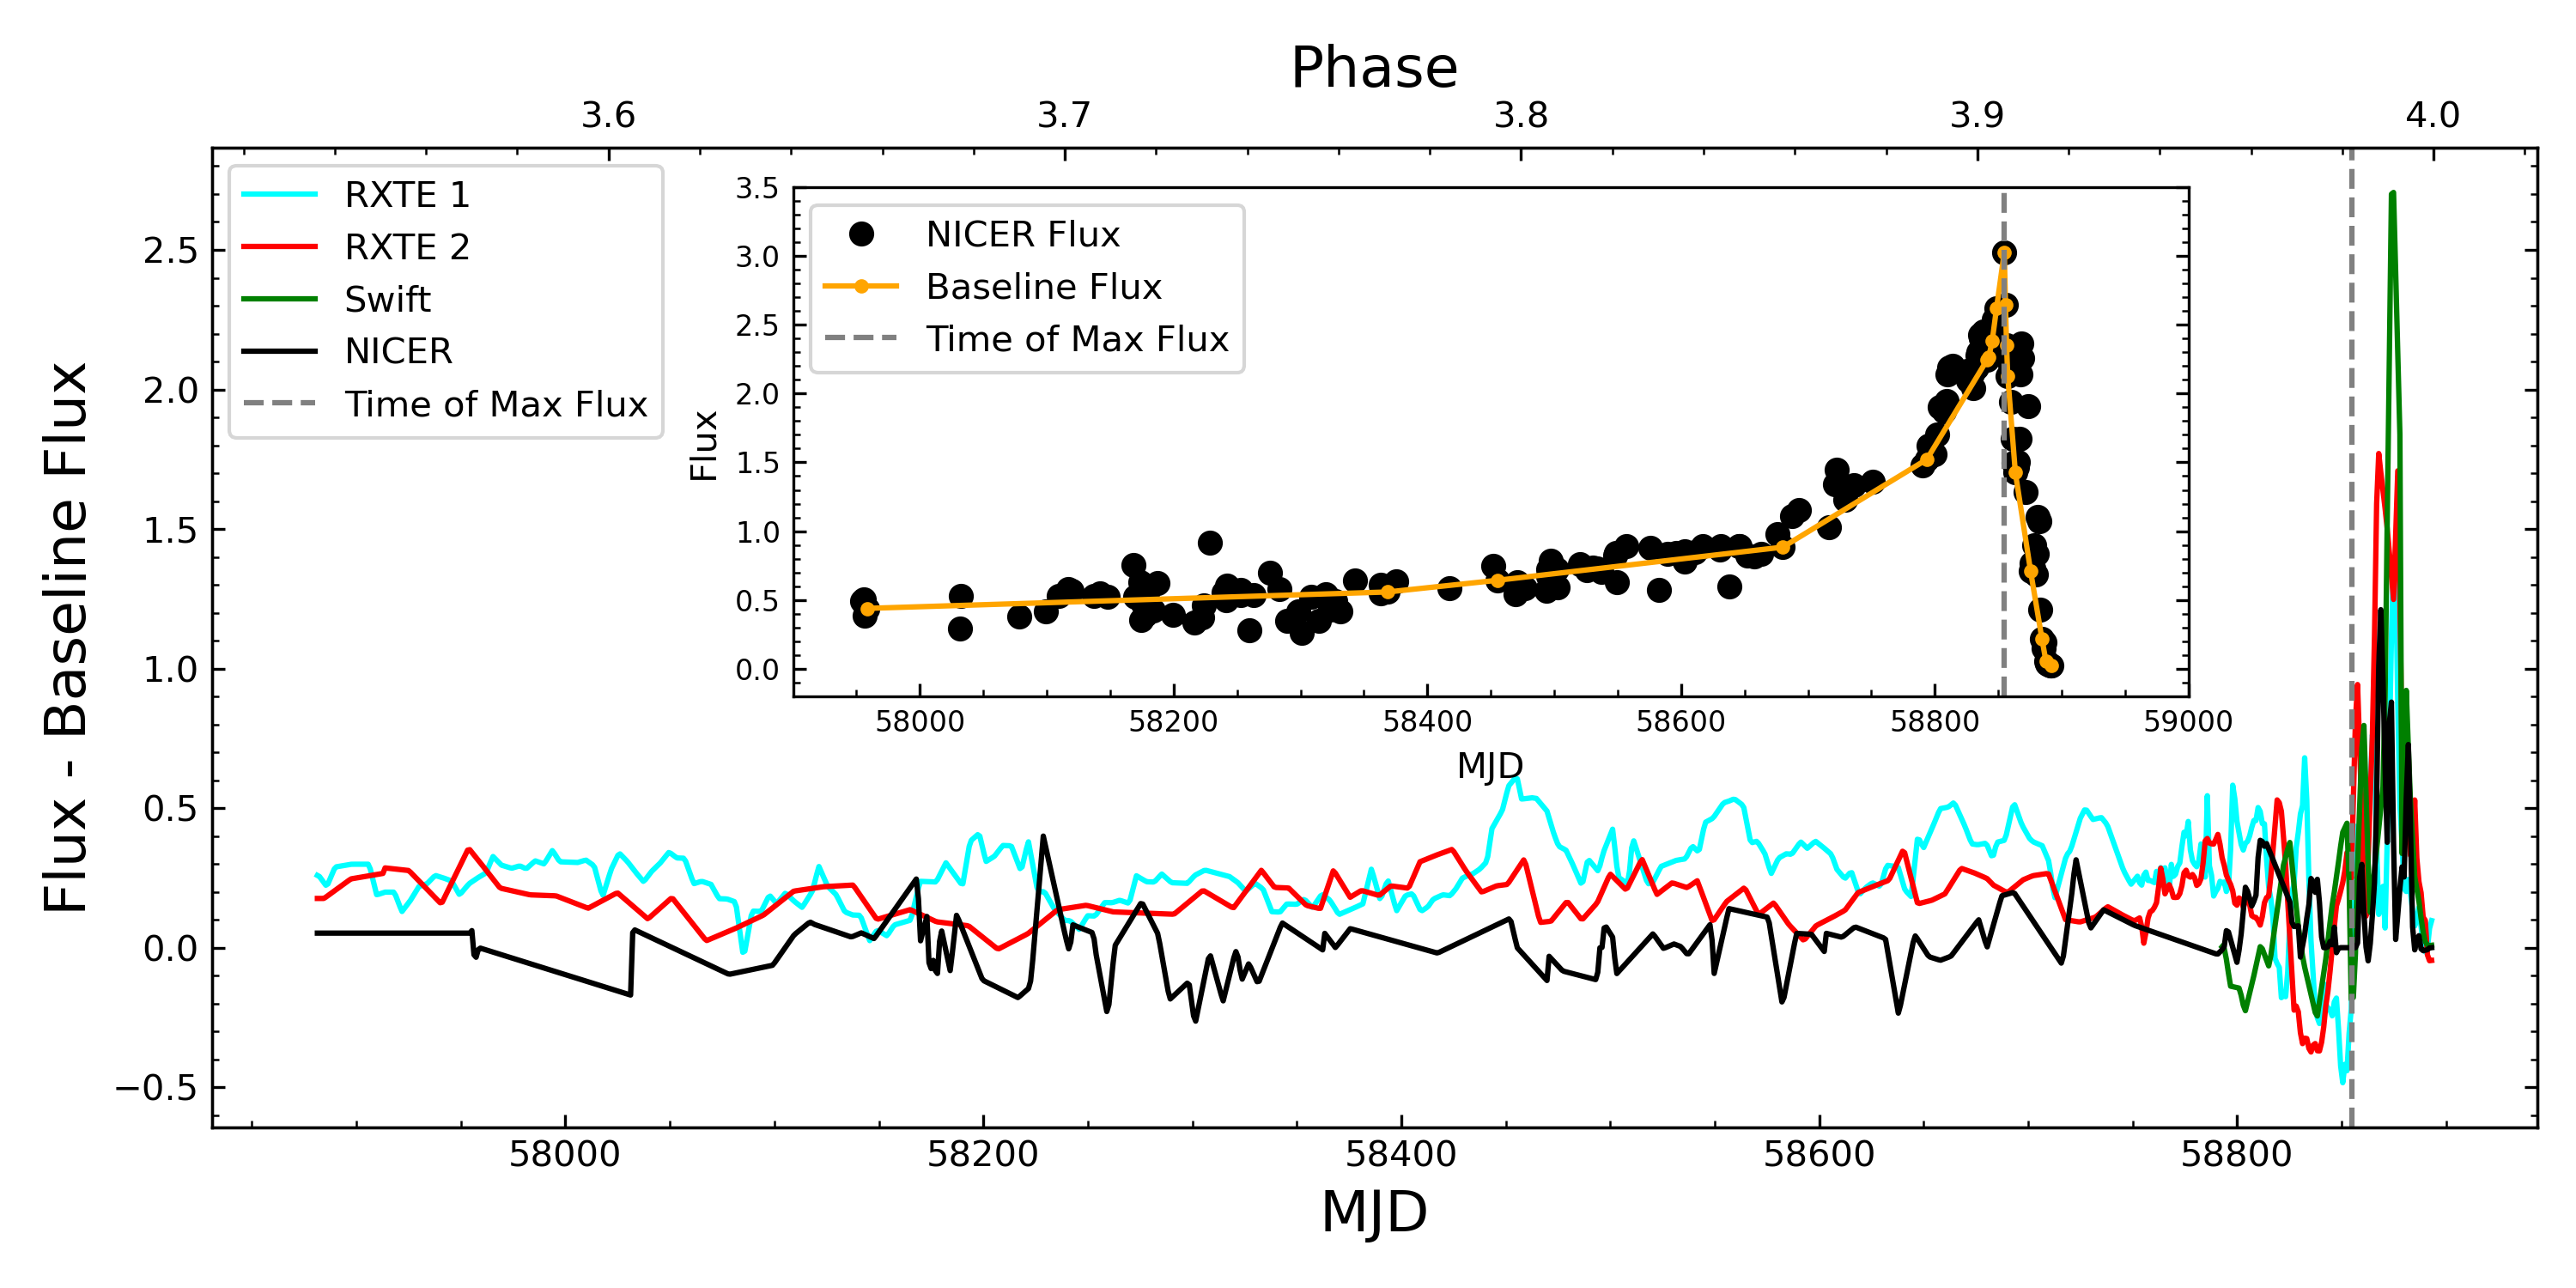
We do note that Moffat & Corcoran (2009) argued that long-duration, low-intensity X-ray flares could be seen near the apastron in RXTE observations. But NICER observations near apastron were obtained at the start of the mission and were affected by variations in local charged particle background and scattered solar radiation, so we can not claim that variations before MJD=58308 d (3.71) are signs of intrinsic source X-ray variability. After Car’s NICER observations started to be taken at low background conditions.
After MJD=58400 (), Figure 10 shows small excess seen by NICER during the rise to X-ray maximum. Similarly, the excess in the residuals for the RXTE and Swift observations increases after . At phases , RXTE and Swift residuals show a decrease in the width of flares. The shortening between flares can be seen by NICER just until since we do not have observations between . The plot shows a break up at when the X-ray flux is approaching its maximum. The flares are not clearly seen at the same time in each orbital cycle, though some coincidences between cycles do occur. After X-ray maximum flux, during the plunge, the flares peaks show more coincidences between different cycles but this can be just a bias due to the fast orbital motion close to the periastron passage.
4.5 Variations in X-ray Absorption
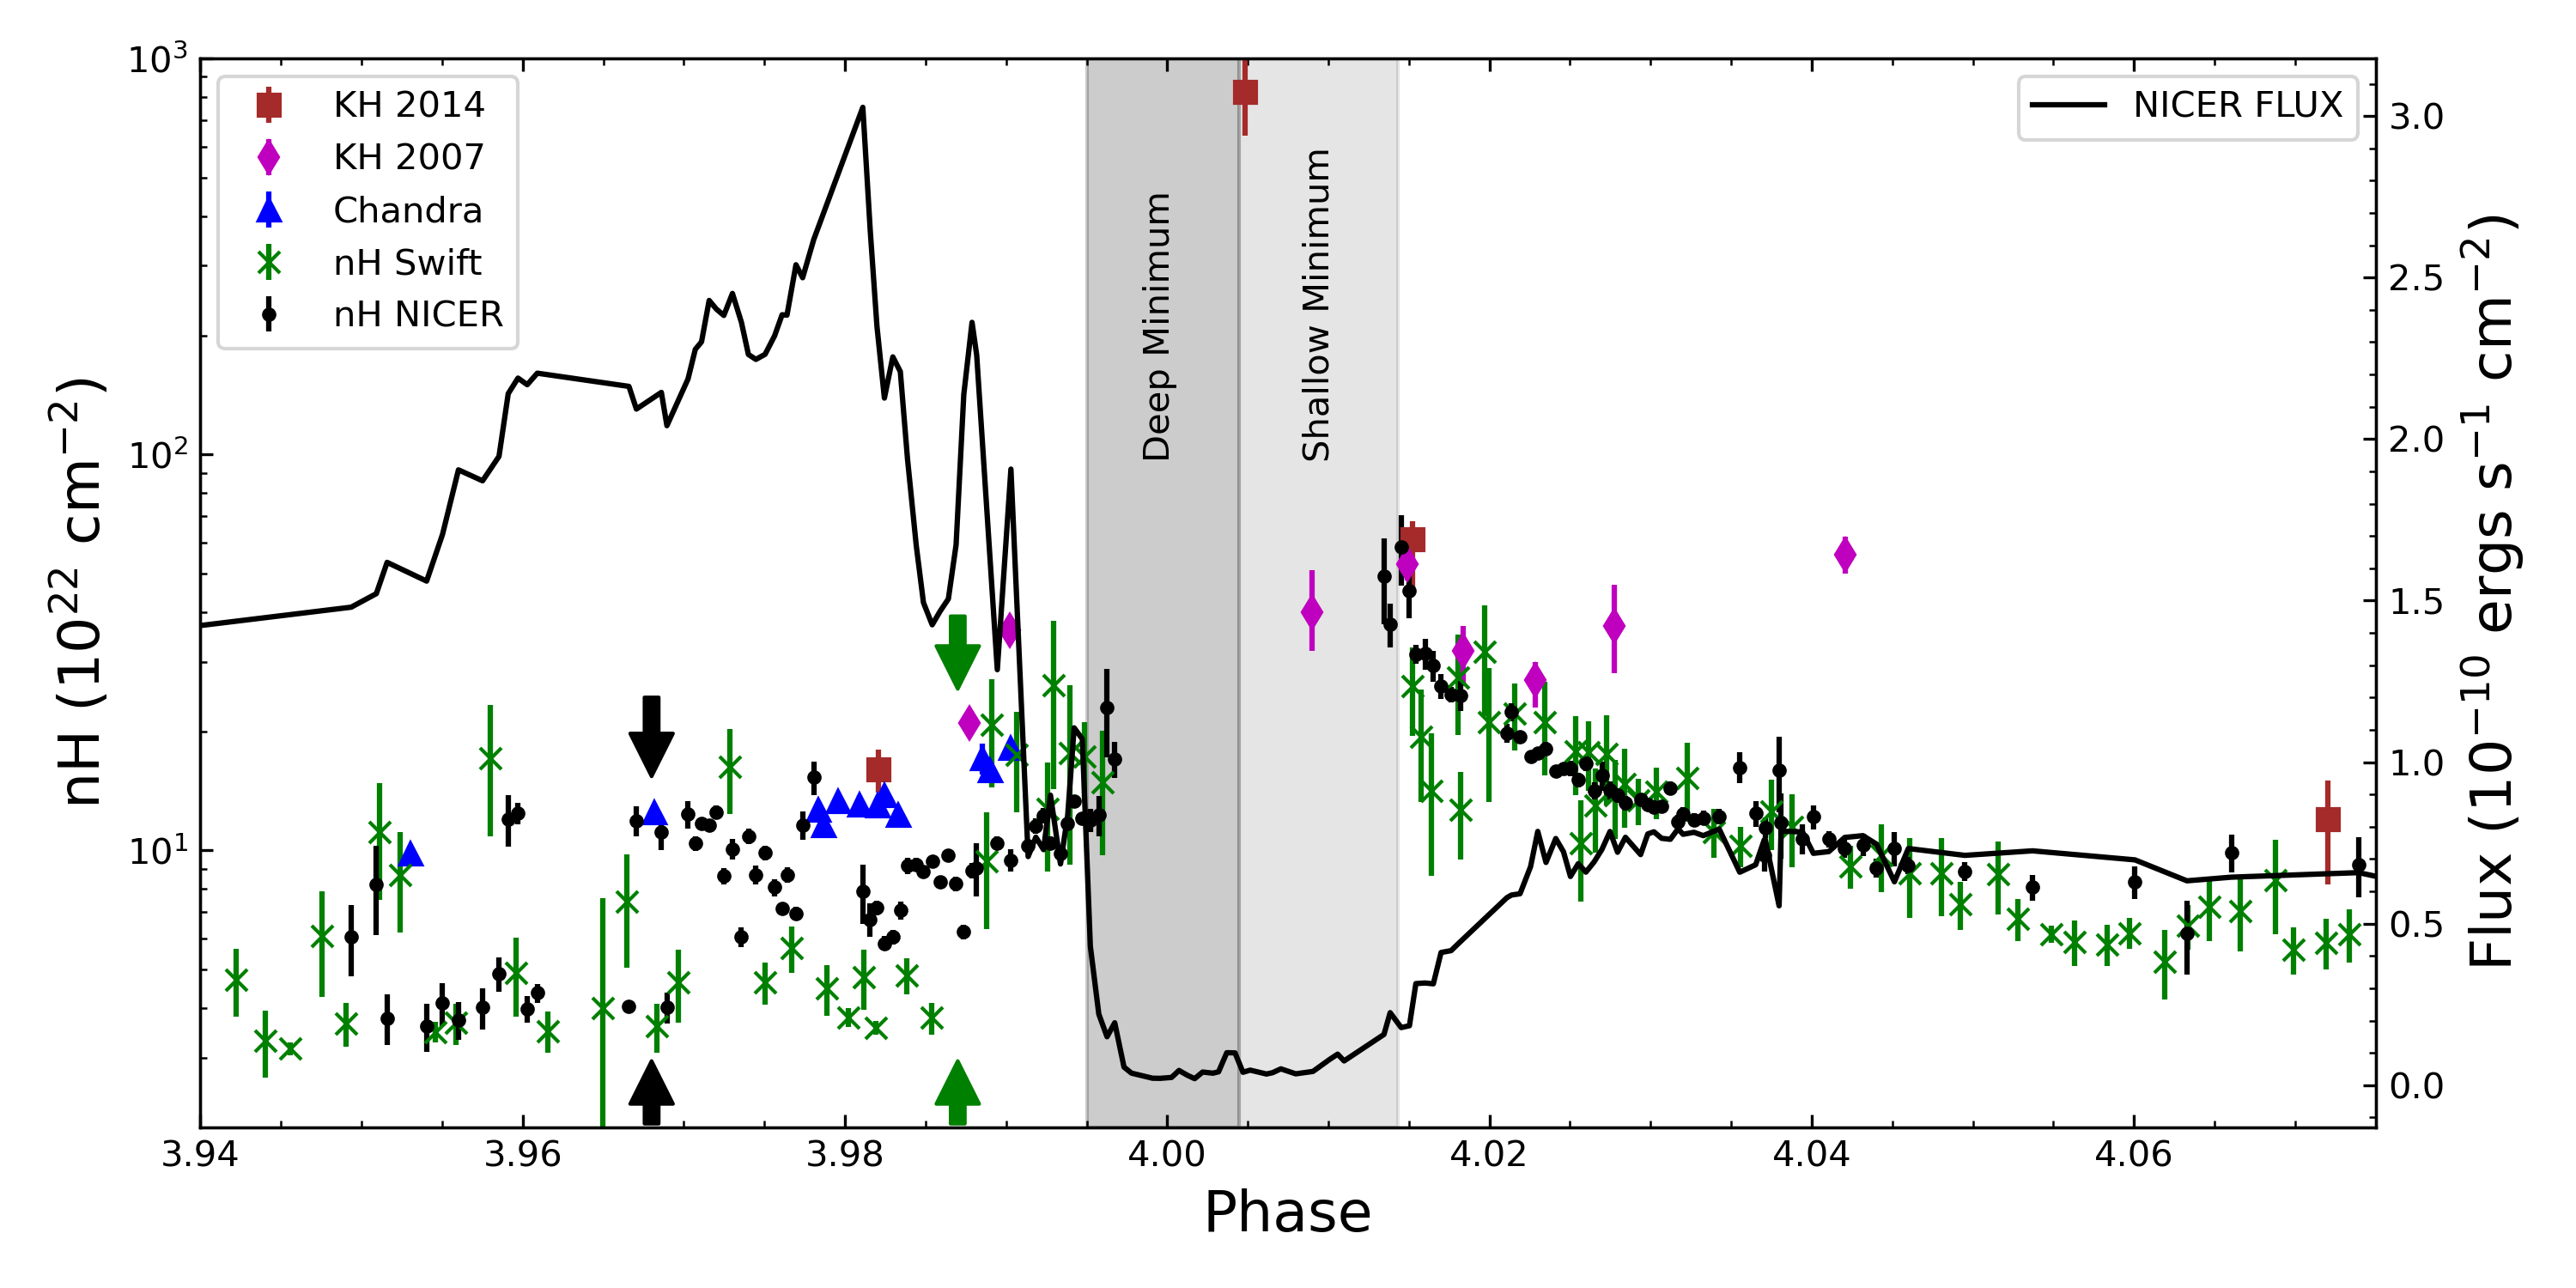
Figure 11 shows the derived variation in column density from the analysis of the NICER spectra compared to the column densities derived from the analysis of the Swift spectra in 2014 (Corcoran et al., 2017). The NICER column densities show substantial scatter between cm-2 to cm-2 before phase 3.97. Derived column densities may be influenced by uncertainties in our estimate of the background and contamination by the soft OE emission below 2 keV. As flux increases, column-densities measures become more precise and show a quasi-exponential increase reaching a maximum value of cm-2 the end of the deep X-ray minimum. Note that near the X-ray minimum determining the column density precisely is difficult because the flux level is so low and the spectrum not well defined in the individual NICER observations. After reaching maximum, the measured column densities show a quasi-exponential decline through the shallow minimum, which appears to be fairly symmetric to the quasi-exponential increase seen up through the deep minimum. This is somewhat surprising since the distortion of Car-A’s wind is very different before the X-ray minimum and afterward, as shown by hydrodynamical modeling (see, for example, Madura et al., 2013).
Figure 11 also shows previous column density measures from the literature and column densities determined from a new analysis of available CHANDRA High Energy Transmission Grating spectra (Espinoza-Galeas et al., 2022, in prep.). In general there is good agreement between the NICER column densities and the Swift column densities obtained during the previous periastron passage in 2014. There are significant discrepancies between the NICER column densities and others measured from “snapshot” spectra obtained by Suzaku, XMM-Newton, and CHANDRA at some phases. In particular the maximum column measured by Hamaguchi et al. (2014) is near cm-2, about an order of magnitude larger than the maximum NICER column. It may be that the maximum NICER column is underestimated due to residual soft circumstellar emission in the NICER field of view and due to uncertainties in background estimation. There are also large differences, up to an order of magnitude, during the high-absorption interval following X-ray minimum between the Hamaguchi et al. (2007b) measures, the CHANDRA measure and the Swift and NICER column densities. The column densities and temperatures we derive from our analysis of the NICER spectra differ from those derived by Kashi et al. (2021). These differences are mostly due to the different methods used in the spectral analysis. Kashi et al., following Hamaguchi et al. (2007b), apparently derived column densities and temperatures by fitting the hard-band portion of the spectrum with a simple absorbed 1-temperature model (see their table 2). Their analysis tends to underestimate the X-ray temperature but overestimate the emission measure and column densities. We use a more realistic model which describes the complex emission seen in the high resolution CHANDRA spectra (as discussed above) and which also includes analysis of lower-energy emission which is most sensitive to column density changes. These temperatures are also consistent with the observed Fe XXVI/Fe XXV ratio , seen in CHANDRA spectra near apastron (Espinoza-Galeas, 2021).
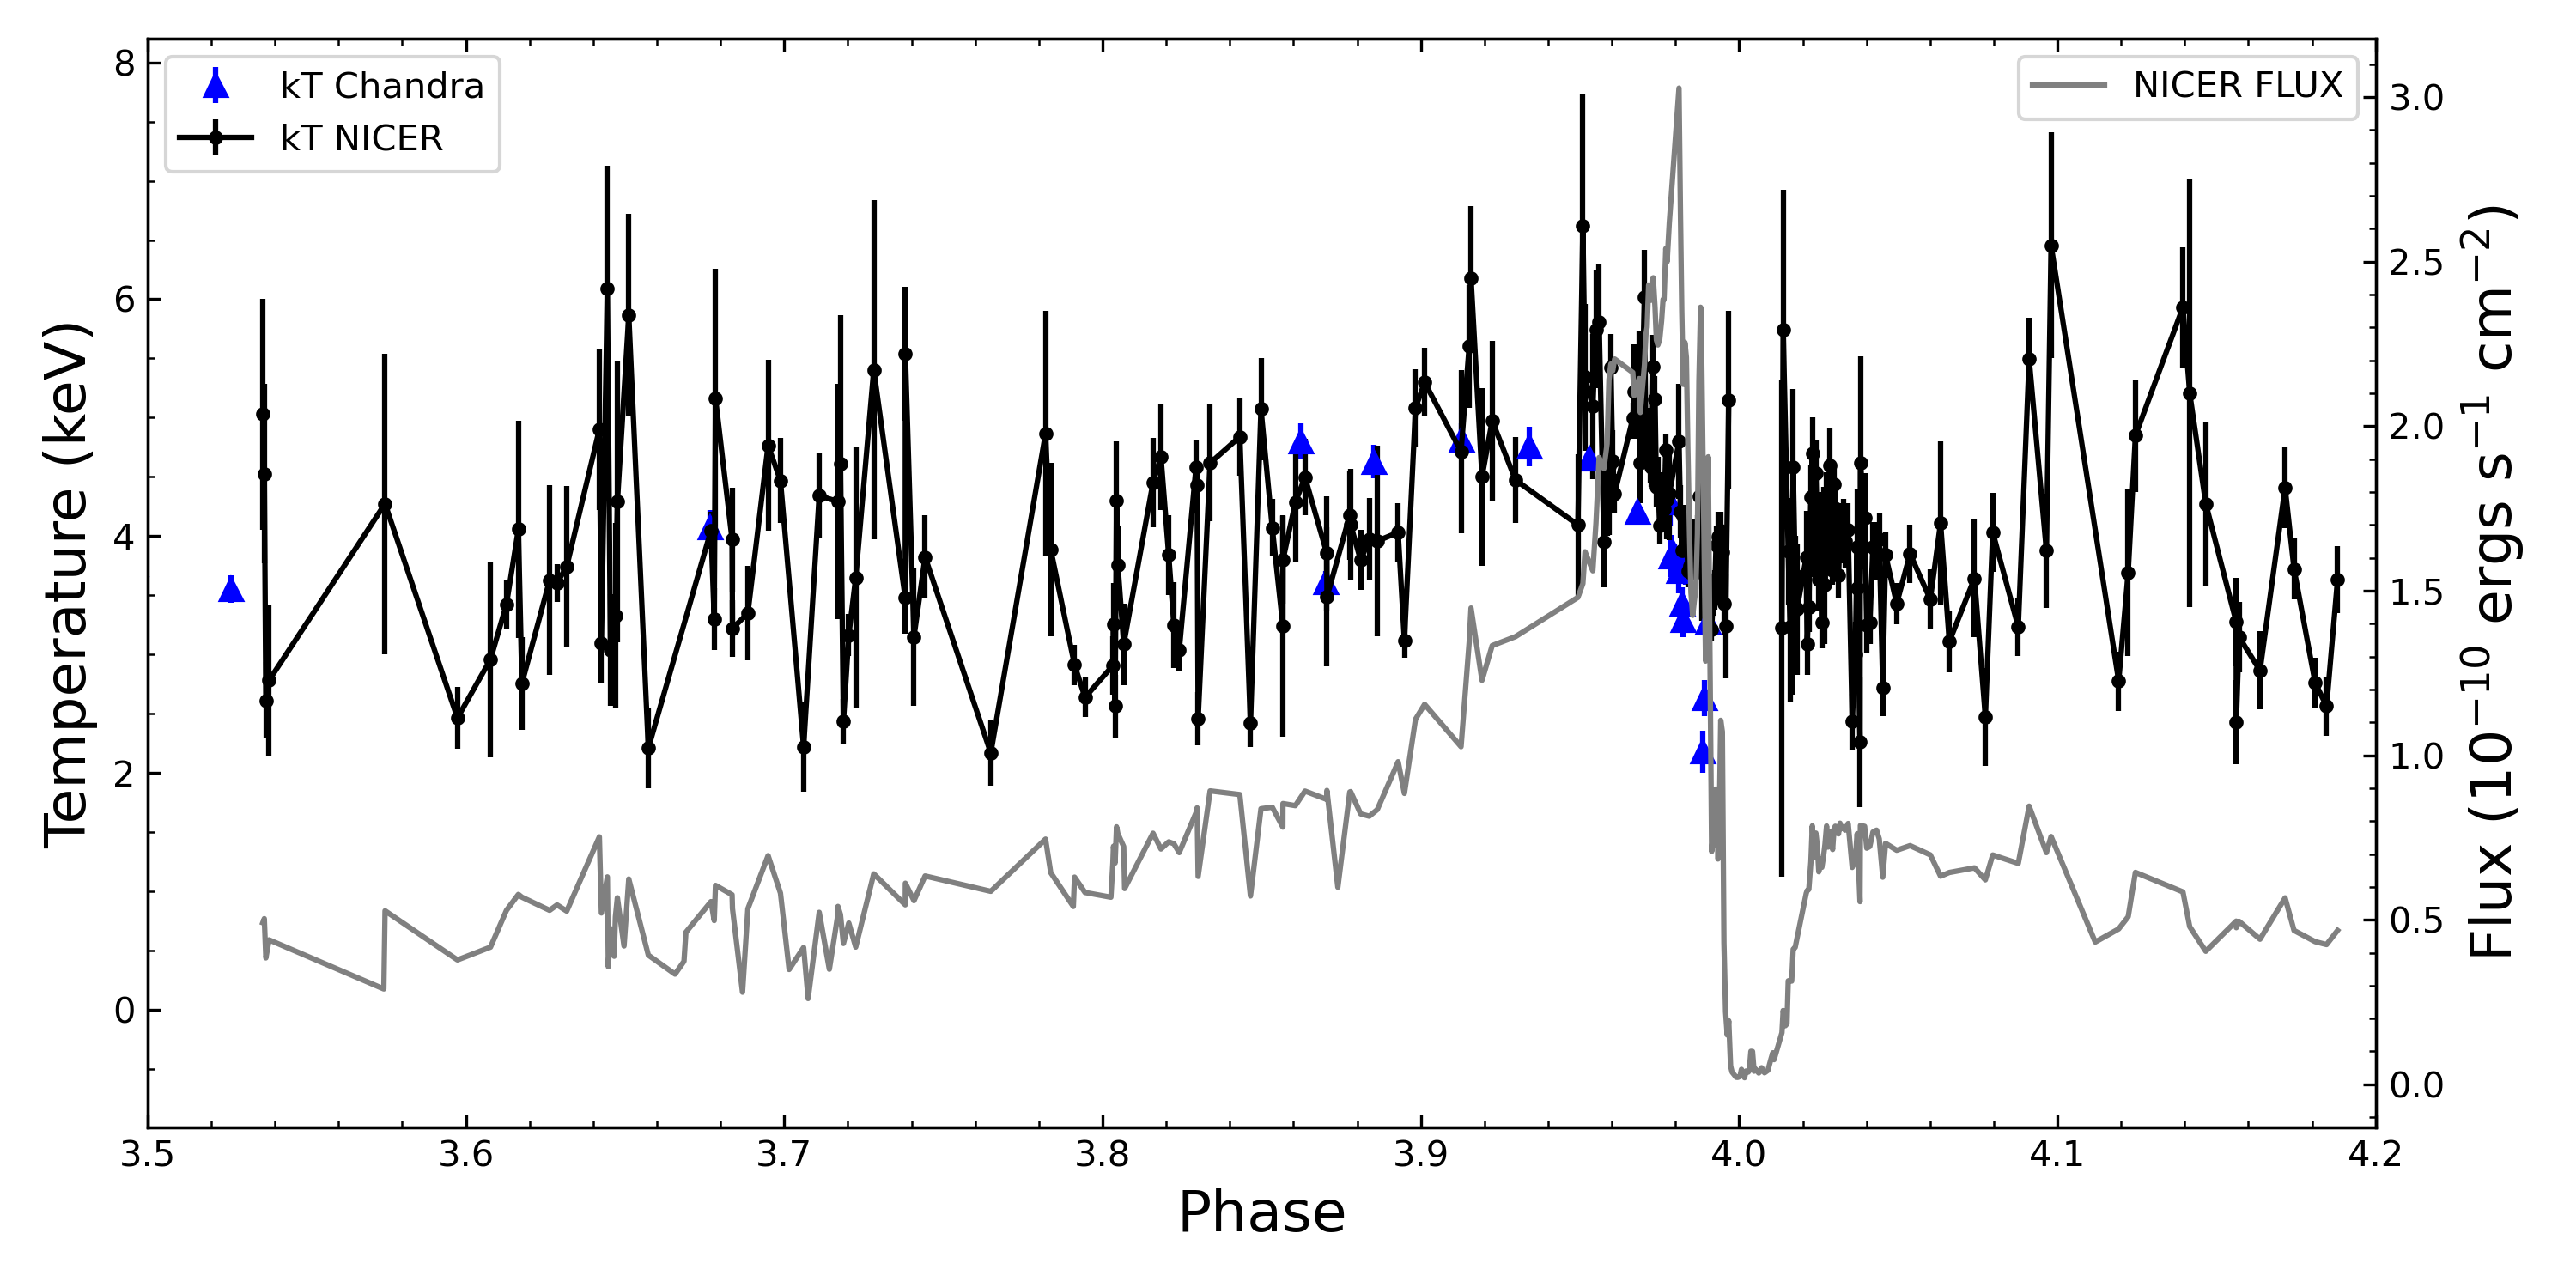
4.6 X-ray Temperatures
The maximum X-ray temperature of the shocked gas in a colliding-wind binary should be approximately constant with orbital phase if the pre-shock velocities of the winds are near terminal velocity at every point in the orbit. Figure LABEL:fig:eta_car_kT_hot_alone_shows_the_temperatures_for_the_higher-temperature_component_in_our_assumed_two-temperature_spectral_model_for_the_CWR_X-ray_emission. The temperature of this high-temperature component shows significant scatter for most of the orbit, as can be seen in the upper panel, but overall there is not much evidence for significant change in temperature when the stars are well separated. In the interval 3.5 3.9 the weighted average temperature for this component k keV. For comparison, Hamaguchi et al. (2007b) derived a temperature of k keV near . Over the entire orbit, the weighted average temperature is similar, k keV.
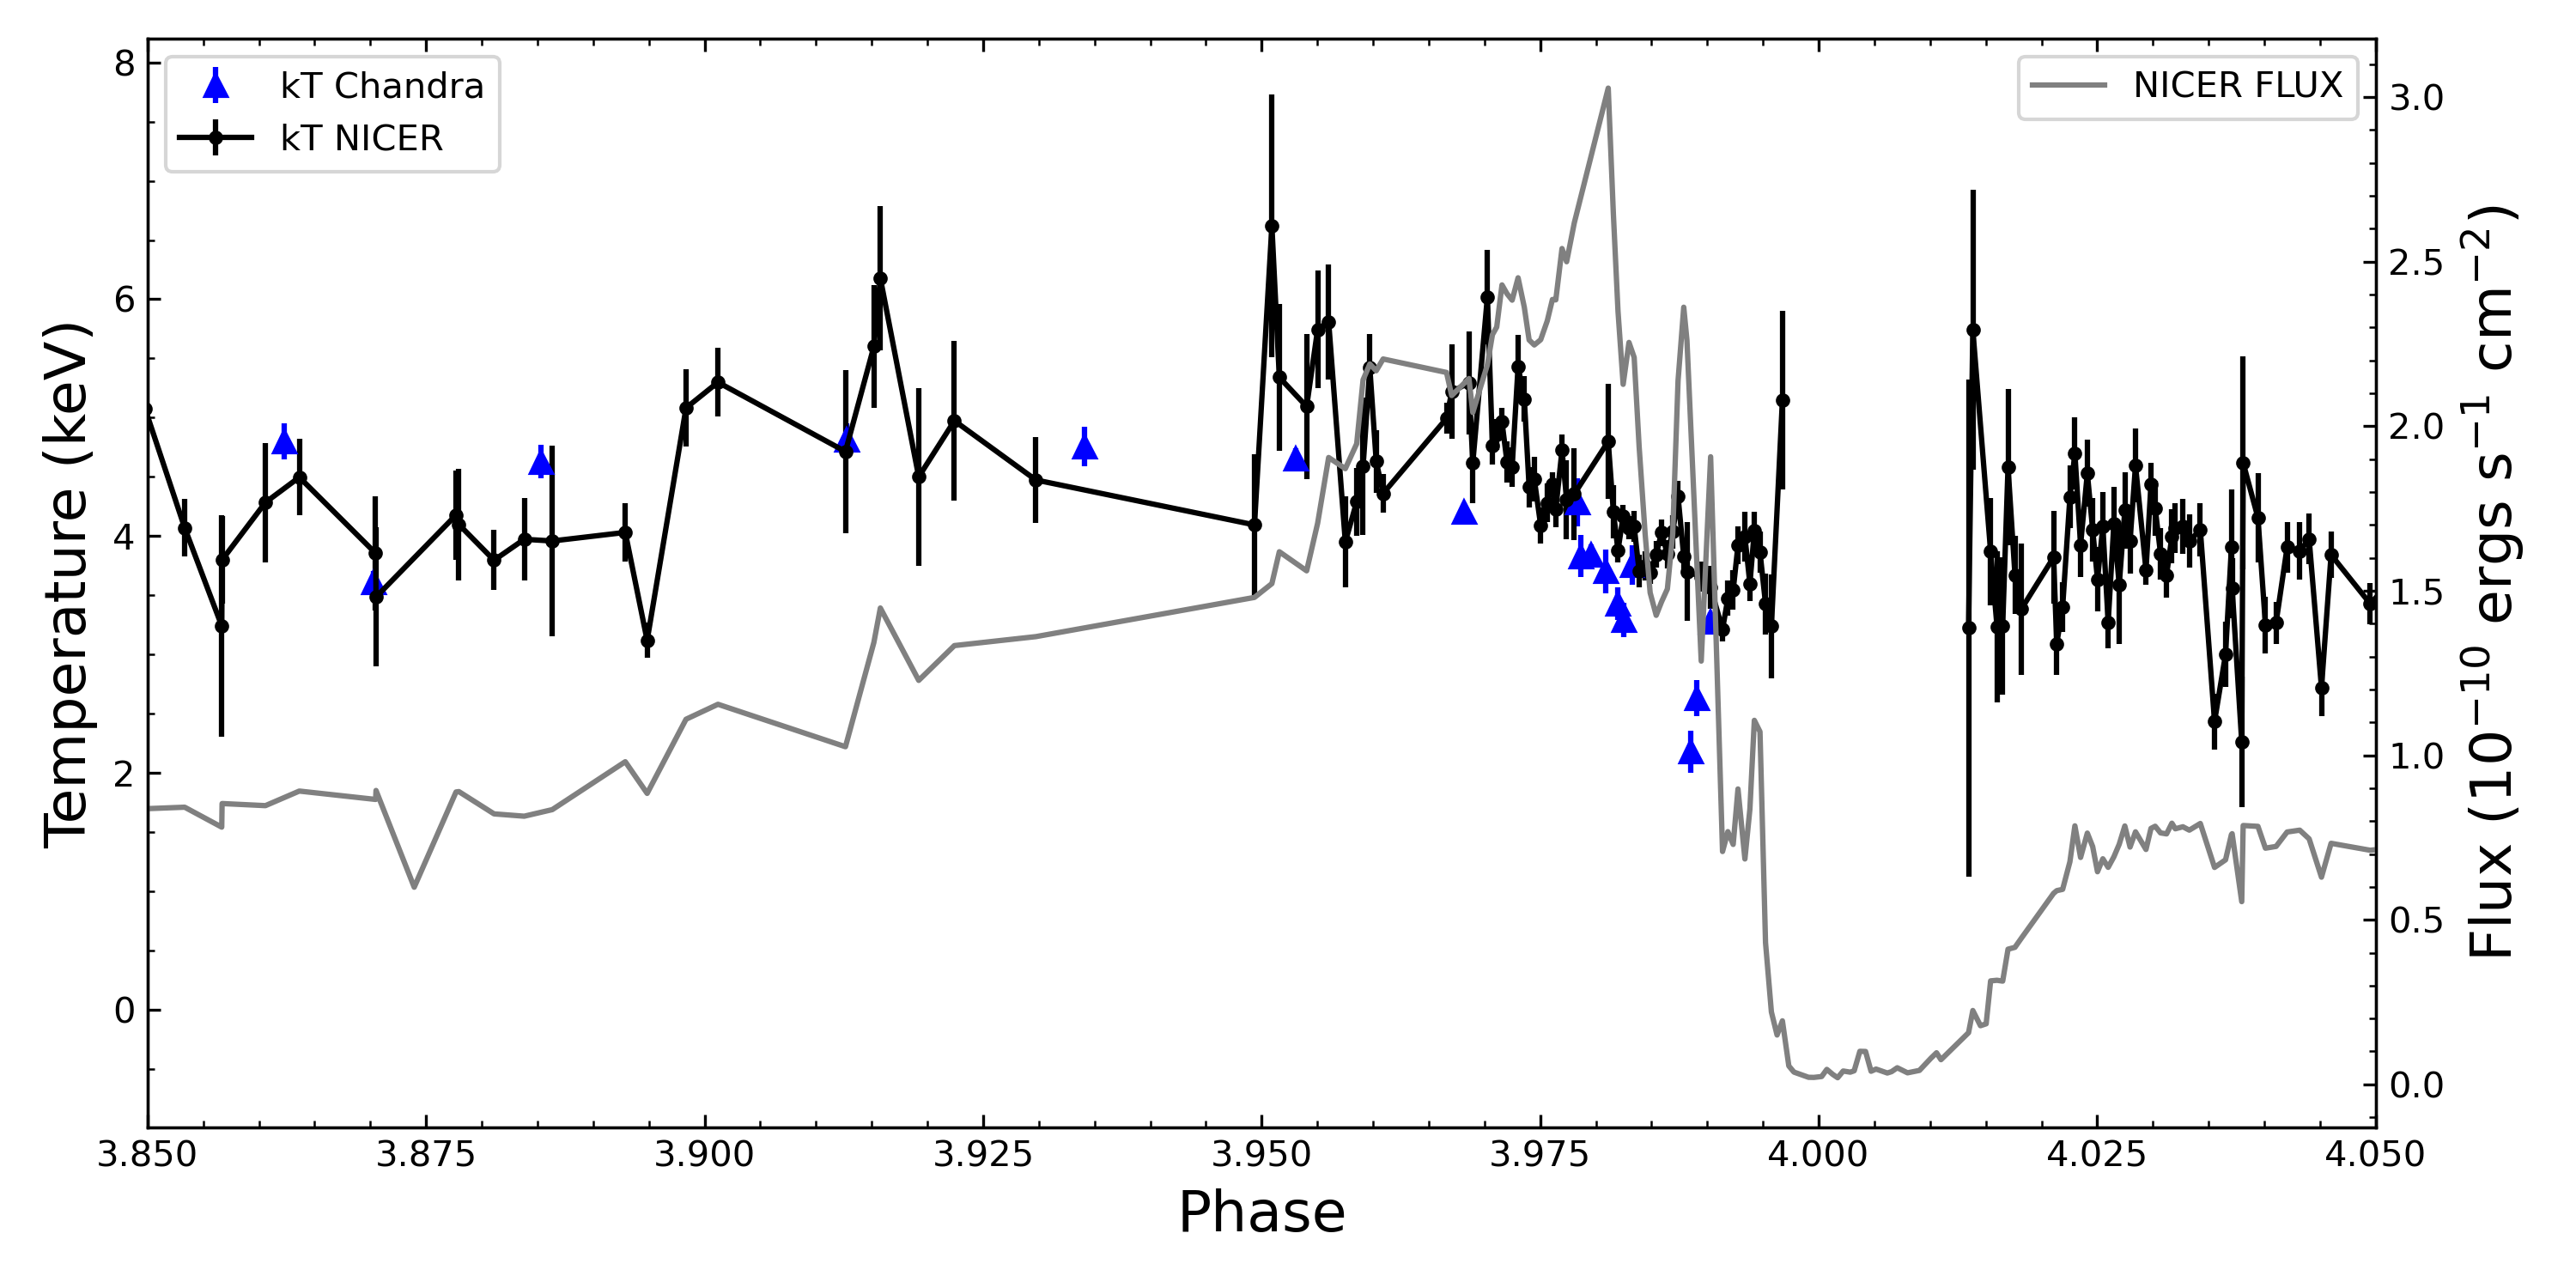
The bottom panel in the Figure 12 shows the temperature variation near the X-ray maximum/minimum, in the phase range 3.85 4.05. Temperature measures are more precise near the X-ray maximum, when the hard emission component is bright. The temperatures at X-ray minimum are not shown because it is not possible to get reliable measurements from the NICER spectra between 2.0 - 10.0 keV since the source is too faint. Starting after , the temperature is nearly constant at k keV, and again shows more scatter starting at , with an average temperature near 4.0 keV. As can be seen from Fig. 12, there is a significant, apparently monotonic decline in the temperature of this component starting at . This decline in temperature happens before the plunge of Car’s X-ray emission to minimum, when the stars are moving towards each other as they approach the point of periastron. The temperature shows a mostly linear decline from about keV (T 52.2 K) to approximately keV (T 34.8 K) in only 60 days, cooling at a rate of about 3 K day-1. However, Hamaguchi et al. (2007b) measured higher temperatures in the phase range from 2 XMM-Newton spectra obtained just before the 2003 X-ray minimum, reporting temperatures of k4.5 keV at 1.988 and 5.4 keV at 1.99, neither of which was consistent with cooling during this interval in 2003. As a check on the phase dependence of the hot component temperature, we also measured temperatures from CHANDRA HETGS spectra obtained contemporaneously with the NICER observations, using the same spectral model (Espinoza-Galeas 2021, Espinoza Galeas et al., 2021, in prep.) We found good agreement between the temperatures derived from the fits to the CHANDRA HETGS spectra and the NICER spectra, and in particular that the CHANDRA temperatures showed a similar monotonic decline in the phase interval
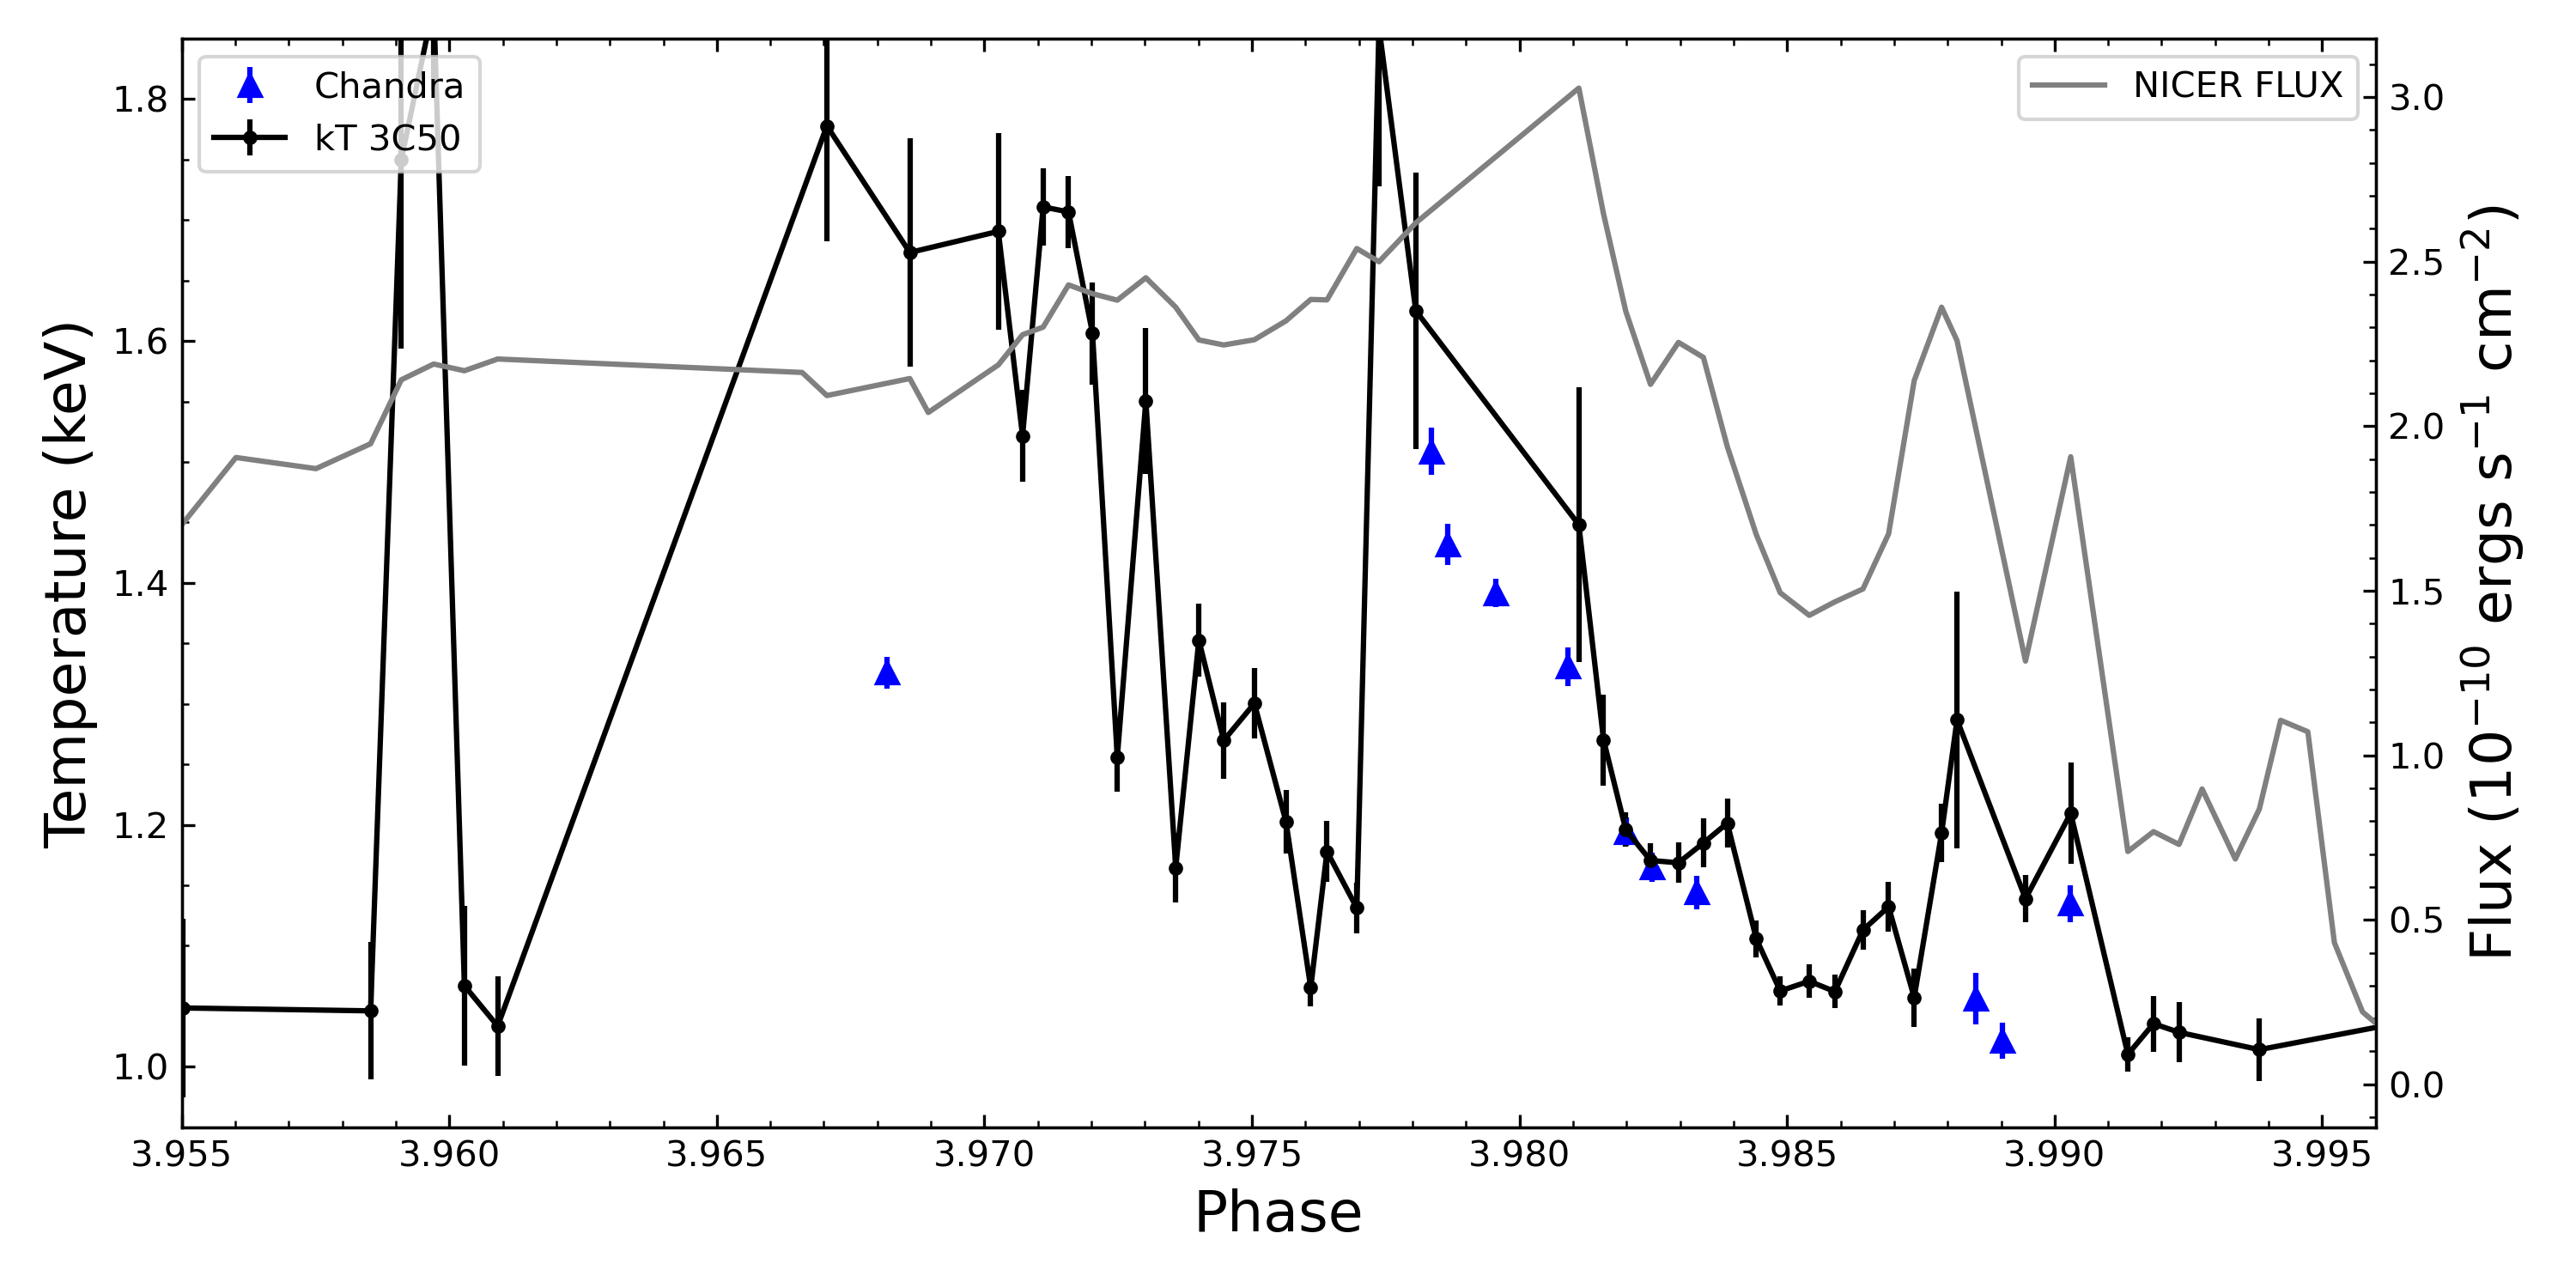
We also measured the temperature of the cooler component. The cooler emission originates from gas farther downstream from the shock apex, and is a combination of hotter gas that has cooled as it flows away from the shock apex and lower-temperature shocked gas produced where the wind flows collide indirectly. The cool component temperatures are often difficult to constrain because of the soft emission from the constant outer debris X-ray emission below 2 keV. Several of the fits reach our assumed 1 keV lower constraint. Temperatures for this cooler component are easier to constrain near the X-ray maximum when the source is bright, but also depend on accurate assessment of the increasing absorption column. In the flare region close to X-ray maximum, the temperatures of the cool component show interesting behavior, as can be seen in Figure 13. At phases between 3.97 and 4.00, the cool component temperatures are somewhat higher than at earlier phases, and show a possible correlation with the flares, where higher flux seems to correspond to higher values of the cool component temperature.
5 Discussion
5.1 Changes in Mass-Loss Rates
The X-ray emission measure and column density provide arguably the most robust measure of the variation in mass loss from the winds of Car-A and Car-B. This is because the 2 – 10 keV thermal emission is dependent on the density of the shocked wind of Car-B along the shock front, while the absorption of this emission suffered by this emission depends on the density profile of the wind of Car-A as the X-ray emission travels from the shock front through the wind of Car-A to the observer. The excellent agreement in derived column densities between the NICER and Swift observations shows that there has been no significant change in the mass-loss rate from Car-A in the 2014-2020 time interval. There is also, generally, good agreement between the NICER column densities and most of the column densities from earlier cycles measured by Hamaguchi et al. (2007b) and Hamaguchi et al. (2014) which suggests, for the most part, a fairly constant density profile through the wind of Car-A. As shown in Figure 11, however, there are some disagreements between the NICER and Swift column densities and the earlier measures, in particular in the interval , in which the Swift and NICER column densities are significantly lower than the two measures reported in Hamaguchi et al. (2007b) in this phase range. This discrepancy may indicate that a significant change in the wind density profile from Car-A occurred sometime between 2003 and 2014. Conclusively deciding the nature of this discrepancy is difficult because of the poor time sampling of the 2003 observations, and stochastic variations in the density profile caused by local clumping in the wind of Car-A cannot be entirely ruled out (though the discrepancy, about a factor of 5 in derived column at seems large for a local perturbation which might be produced, for example by a wind clump or other local density enhancement). At this phase, simulations show that the X-ray emission from the colliding-wind bow shock passes through the distorted wind from Car-A as the wind is wrapped around the leading wall of the bow shock, and it is plausible that small stochastic changes in this region of the wind could have large effects on the absorbing column.
Overall, the measured X-ray column densities from the 2003-2020 interval agree to better than 40-50% with previous observations. Since column density is directly proportional to , and since the NICER and Swift column densities tend to be lower than the earlier measurements, this agreement constrains the decline in the mass-loss rate from Car-A , , to percent per year.
The X-ray flux in the 2 – 10 keV band depends on the emission measure of the shocked wind of Car-B, which is proportional to the mass-loss rate from the companion, . Thus comparing fluxes in the 2 – 10 keV band from different orbital cycles provides a measure of the changes in mass-loss rate from the companion, , over time. It is best to compare fluxes when the stars are close to apastron, since the shock is stable and cooling is adiabatic. As shown in Figure 8, there is good agreement between the RXTE Cycle 1 (2003) and Cycle 2 (2009) observations near , while the RXTE Cycle 0 and NICER fluxes are about 25% lower. This could indicate non-monotonic variability in the mass-loss rate from the companion; also this can indicate some systematic error in calibration between the RXTE Cycle 0 and NICER fluxes and the RXTE fluxes from the other two cycles. Kashi et al. (2021) suggest that Car’s different X-ray emission recoveries are the result of a decrease in Car-A’s wind. If this were the case we should expect significant differences in column densities for different recoveries. But as shown in Figure 11, the column densities in the recoveries observed by Swift and NICER are very similar, showing no significant changes in the mass-loss despite the different recovery durations.
5.2 Shock Temperatures, Wind Velocities, and the Radius of Car-B
As seen in Figure 12, the hotter component shows a fairly constant X-ray temperature of k keV up to , after which there is a rather linear decline up to (at which point the spectra become too faint for analysis). The hottest plasma in the colliding-wind shock originates near the apex of the shock cone, where the winds collide nearly head on, and as the stars approach periastron passage, the apex of the colliding-wind shock moves closer to the companion star. If the apex enters the region of the companion’s wind where the wind is still accelerating and has not yet reached terminal velocity, this would cause a drop in the temperature of the hot shocked gas near the apex. The drop in temperature of 2/3 by compared to the temperature at when the decline apparently starts, suggests a drop in the pre-shock velocity of the fast wind of Car-B. Since , this corresponds to a decrease in the pre-shock velocity of the wind of Car-B of 2.5% where is the wind velocity at and is the wind velocity .
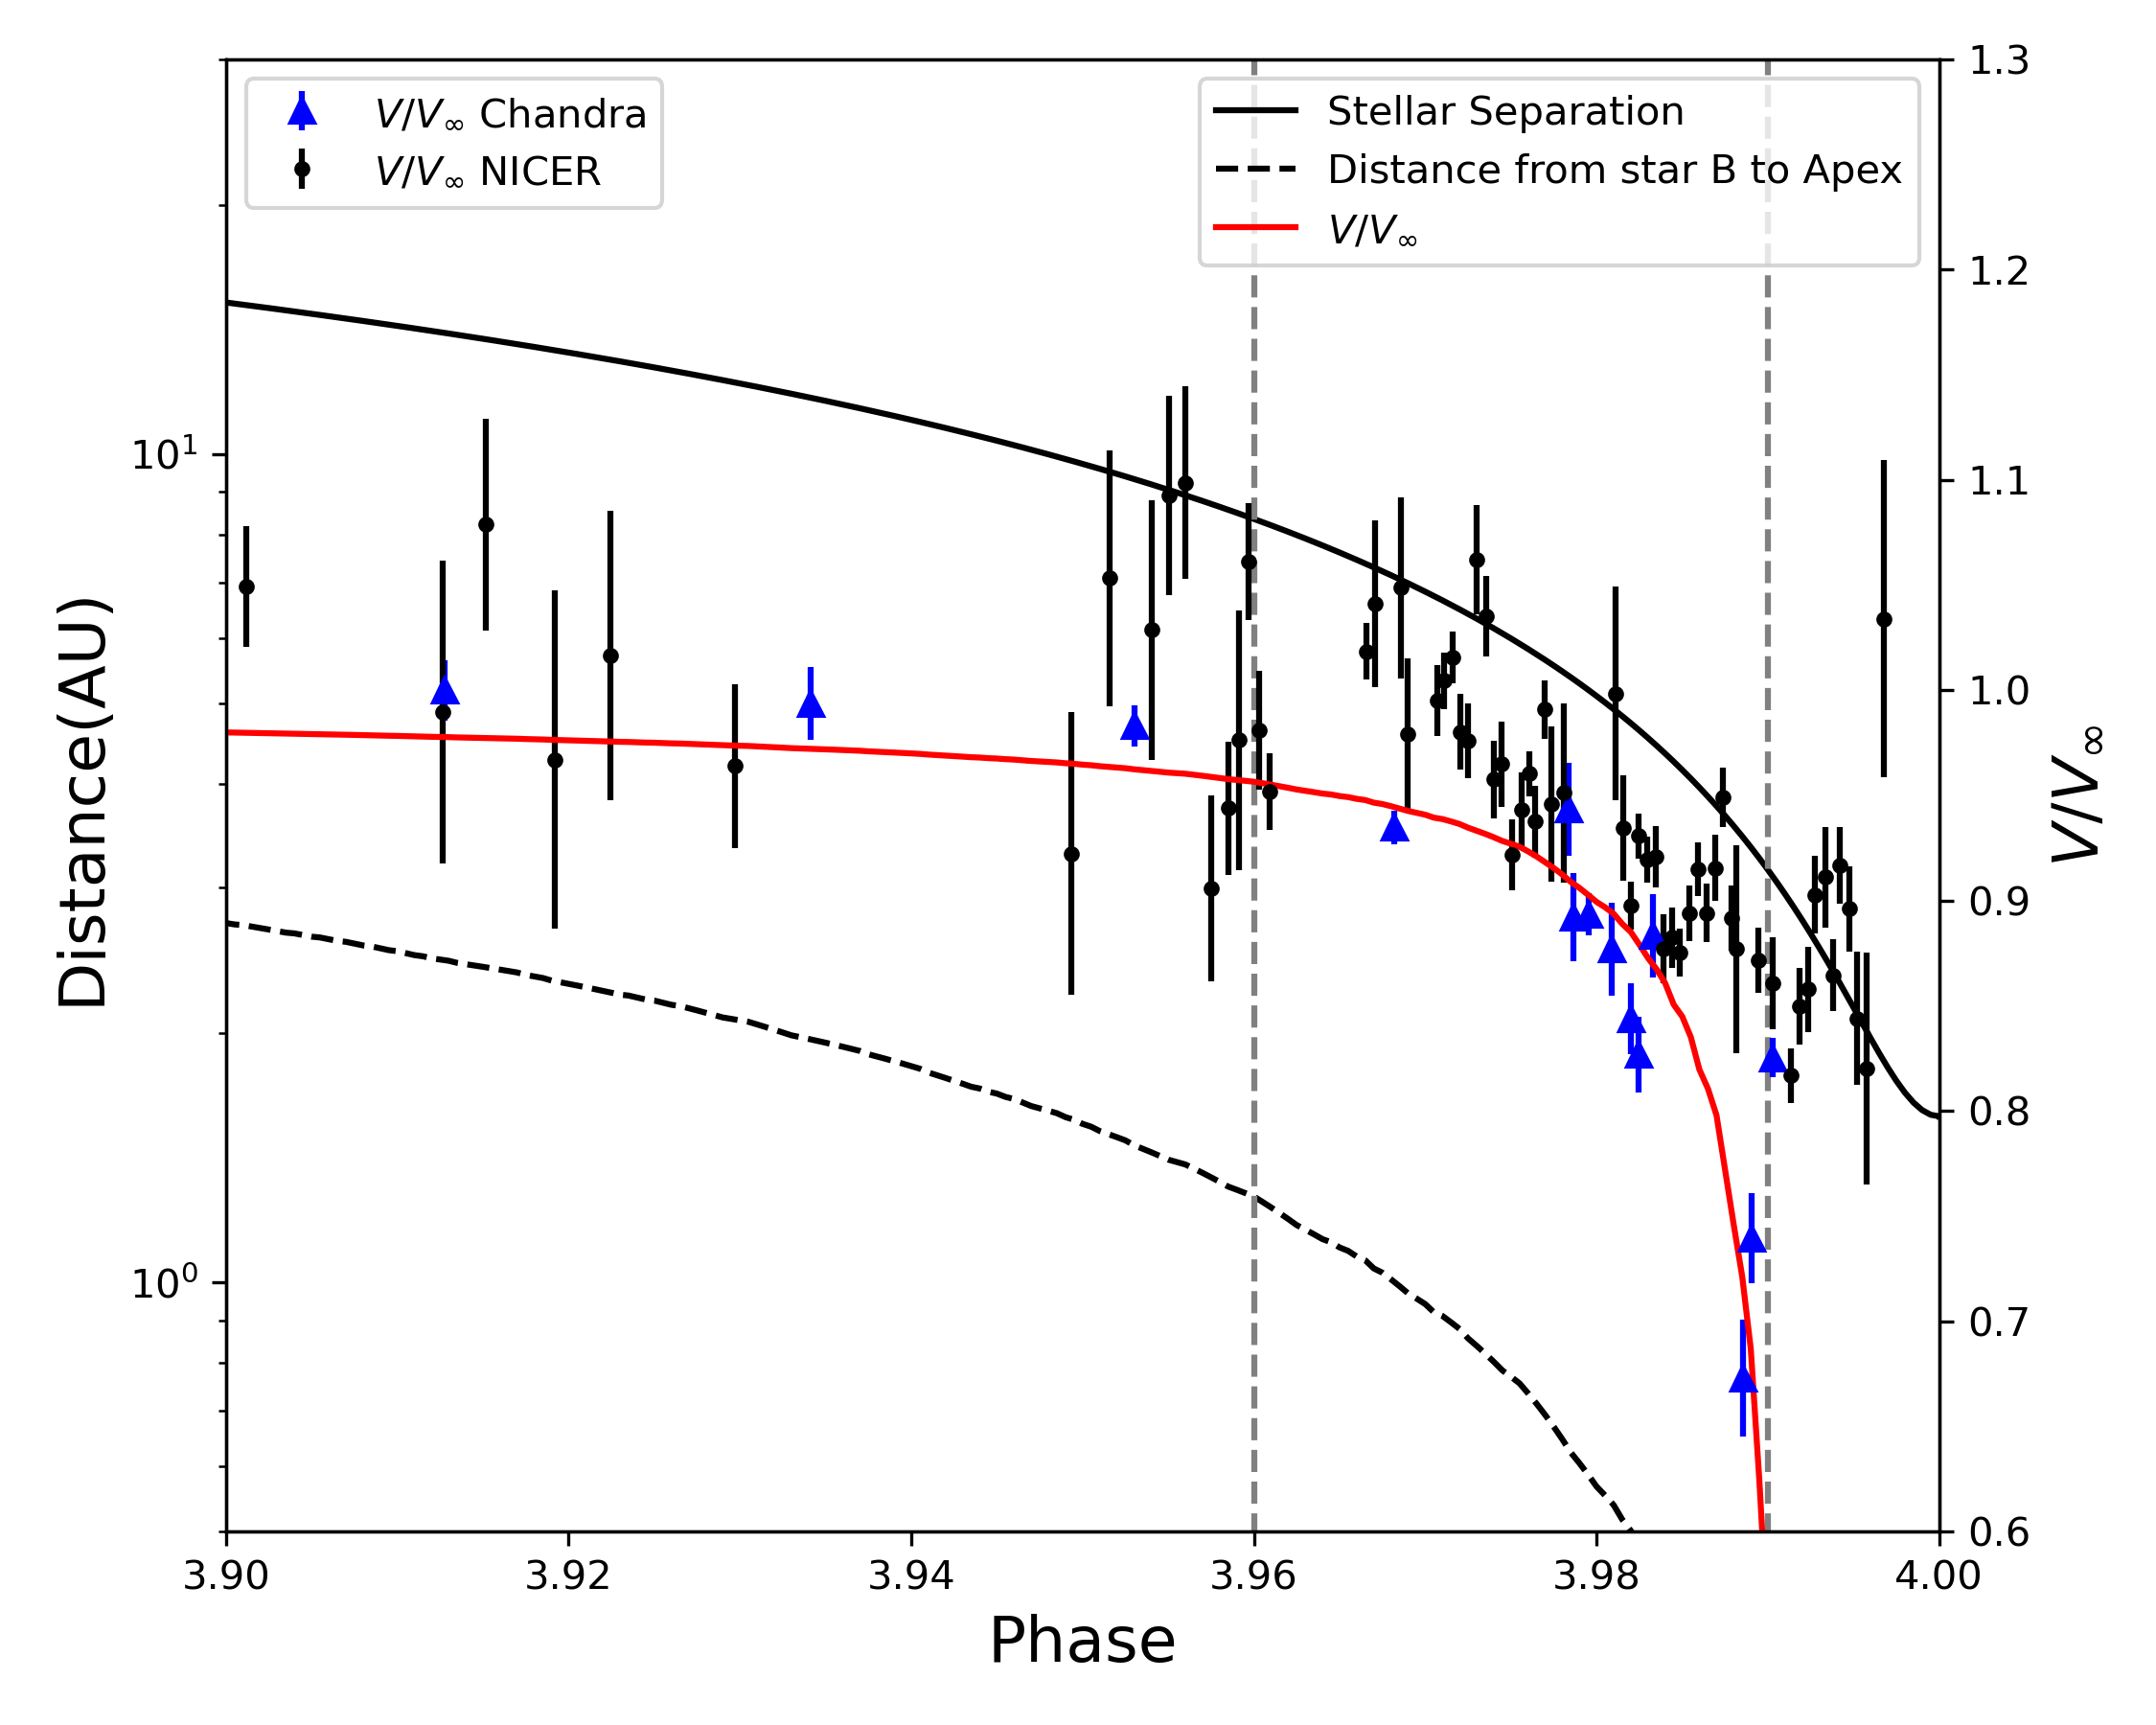
Figure 14 shows the expected variation in separation of the two stars and the distance from Car-B to the stagnation point of the shock, derived by balancing the pressure of the wind from Car-A and Car-B between the two stars. Figure 14 also shows the derived change in wind velocity assuming a standard wind velocity law , where is the velocity of Car-B’s wind at a distance from the star, is the terminal velocity of Car-B’s wind, and the wind acceleration constant (usually close to 1 for most radiatively-driven winds). Note that very near periastron, the apex moves very close to the companion and the velocity calculation breaks down. The dashed vertical gray lines indicate the phase interval of the observed cooling of the hotter component, while the red line shows the change in wind velocity implied by the temperature decreases, assuming . The intersection of the dashed vertical gray and red line show the derived velocities at the start and end of the observed cooling interval. We find that the derived change in wind velocity is fairly well matched by the calculated variation in Car-B’s pre-shock wind velocity at the distance of the shock cone apex over this range of orbital phase, if the radius of Car-B is . Ionization modeling by Verner et al. (2005) yielded values of K and , implying an effective radii of 23.6 , slightly smaller than the radius which reasonably describes the X-ray cooling if shown in Figure 14; but, given the uncertainties and assumptions, these numbers are in good agreement. On the other hand, photoionization modeling by Mehner et al. (2010) suggests a somewhat hotter but fainter companion star, K and , yielding an effective radius of only 14.0 . We can reasonably describe the observed X-ray cooling curve with these radii, but both require higher values of (indicating a more slowly accelerating wind), and for the Verner et al. and Mehner et al. radii, respectively.
5.3 The Deep/Shallow Minimum Transition
The NICER campaign has provided the best measure obtained so far of the variations in X-ray flux and X-ray spectral properties around the X-ray minimum. The NICER HR in Figure 4 shows the transition between the “deep” and “shallow” states of the X-ray minimum first identified by Hamaguchi et al. (2014) from a set of only five CHANDRA ACIS spectra. Figure 4 also show that the deep minimum interval lasts for an interval of 18 days, starting at and ending at , with the transition to the shallow minimum. The shallow interval ends at , a duration of 18 days while the shock gradually strengthens and the absorption dissipates as the companion moves around and away from Car-A. This is consistent with the interpretation offered in Hamaguchi et al. (2014), who suggested that the deep minimum is produced by occultation of the X-ray emitting gas by the optically-thick inner wind of Car-A, which completely hides the X-ray emission from the colliding-wind shock, plus a decline in X-ray emissivity near periastron passage, followed by a gradual strengthening of the shock and a re-heating to X-ray emitting temperatures.
5.4 The Column Density Variation Through Car’s Orbital Motion
The column density from the hot component of Car X-ray emission shows variability through all the NICER monitoring program. Those changes go up to one order of magnitude in column density (Figure 11), with intervals no longer than in phase. The variations indicate changes in the amount of material in front of the apex of the CWR in our line of sight. The occurrence and duration of the variations before do not show a particular correlation with flux or phase. Stochastic changes in Car A’s wind by clumps could explain the variability observed. The lack of more frequent observations before makes difficult a deeper analysis of those variations in column density.
After more frequent NICER observations were allocated. Between phases 3.96 and 3.97 the shows a particular stability in the measurements. The stability of so many subsequent measurements was not observed before. The measurements of between makes clear the increase of one order of magnitude in column density after phase 3.98. After the column density keeps almost constant for the next . The step of one order of magnitude at can be also due a clump in Car A wind. Another interesting explanation for the step change in column density is a transition between the wind from Car B and Car A separated by the walls of the cone formed by the CWR.
5.5 Variation in the Duration of the X-ray Minimum
As first noted by Espinoza-Galeas et al. (2020), NICER showed that the duration of the X-ray minimum in 2020 was the shortest seen in any of the four orbital cycles monitored so far. The first two minima seen by RXTE in 1997 and 2003 had nearly identical X-ray minimum durations, while the RXTE monitoring of the 2009 minimum had a significantly shorter duration. Any hypothesis needs to explain the apparently stochastic behavior observed in the starting time of the X-ray recovery observed in Figure 8. Corcoran et al. (2010) suggested that the different recoveries are due to a decline in Car’s wind momentum. The decline can be caused by a drop in mass-loss or wind terminal velocity, or some combination. If so, we might expect to see differences in column densities when comparing X-ray spectra obtained during recovery in different orbital cycles. Figure 11 compares the column densities from cycle 3 (from Swift) and cycle 4 (NICER). Although the duration of the cycle 3 minimum was substantially longer than the cycle 4 recovery (See Figure 8), after the column densities from Swift and NICER are very similar. This suggests that the differences in the duration of the cycle 3 and cycle 4 minima was not produced by a significant change in the wind momentum of the primary. Kashi et al. (2021) and Kashi & Soker (2009) propose that accretion at periastron weakens the mass-loss rate of Car-A every cycle, implying that any new X-ray emission recovery should be shorter than the previous one. But as discussed above it is not likely that Car-A’s wind has weakened significantly from 2015 to 2020 based in the column densities. Also, the 2009 minima was shorter than the 2015 minima as shown in Figure 8, indicating that there is no systematic weakening of Car-A’s wind with time.
The comparison of the NICER and Swift observations around X-ray minimum suggests that another mechanism produces the variation in duration of the X-ray recoveries. Winds from luminous hot stars are prone to line-deshadowing instabilities (LDIs) that can randomly create localized variations in wind density (Owocki et al., 1988). Figure 4 in Owocki et al. (1988) shows how those instabilities can increase the velocity of the wind from 500 km/s to 1250 km/s, especially in the dense inner parts of the wind. Such local density enhancements (clumps) interacting with the colliding-wind bow shock can move the stagnation point of the CWR closer to Car B, reducing the pre-shock wind speed and reducing the hot X-ray flux from the bow shock. In this scenario, we can still have regions where the shock of the winds can generate high energy X-rays but distributed over a broader region, that together with a high column density, produces the shallow minimum. The shallow minimum duration will be dependent on the size of the clump and the time when the clump forms. Once the clump passes the shock, Car B’s wind can accelerate enough to re-form the hot shocked gas in the CWR between the stars, starting the recovery of the hard X-ray flux.
We suggest that the sudden, step-like increase in column density before the X-ray minimum (See Figure 11) indicates the formation of a dense clump produced by the LDIs in the inner wind of Car A. This step is observed at a later phase in cycle 3 than in cycle 4, suggesting a connection between the clump formation time and the time of recovery. Clumps that form later produce a longer X-ray minimum, while clumps which form earlier in orbital phase pass beyond the bow shock earlier, producing an earlier X-ray recovery and shorter X-ray minimum.
5.6 The Nature of Rapid X-ray Variability
As discussed in Section 4.4, NICER observed similar rapid X-ray variability, or “flares”, which become evident near X-ray maximum and are even seen during the decline to minimum. The comparison of the NICER 2 – 10 keV X-ray fluxes with those from RXTE Cycle 1 and Cycle 2 as a function of time shows no strong correlation. Moffat & Corcoran (2009) concluded that this flaring activity was produced by large, homologously-expanding localized overdensity regions, or clumps, in the wind of Car-A.
The apparent coincidence of peaks in the temperature of the cool component with the peaks of some X-ray flares seen in Figure 13 can be interpreted in terms of the “clump” model of Moffat & Corcoran (2009). In this model, the pressure of a clump on the wall of the bow shock downstream from the apex could in principle decrease the opening angle of the bow shock, causing the winds to collide more directly, increasing the temperature of the downstream shocked wind while increasing the density of that portion of the shock producing an increase in X-ray flux from the shocked wind of the companion star.
6 Conclusions and Future Work
NICER provides time-resolved measures of the 0.4-10 keV Car’s X-ray spectrum from 3.5 and ongoing. Flux measured by NICER follows the behavior for most of the orbit, similar to RXTE and Swift lightcurves. NICER observed that the plunge of the X-ray maximum started at 3.98, similar to the previous cycles indicating that it is strongly correlated with orbital phase. Inspection of Car’s NICER spectrum does not show evidence of a decrease in X-rays due to absorption, suggesting that the decrease in flux is due to a decrease in temperatures at the CWR. This is the first time we have evidence of temperature decrease in the CWR of Car. The temperature of the hot component declines on approach to periastron passage, indicating that the shock apex is moving into the acceleration zone of the wind of Car B.
Measurements of the HRs with NICER constrain the Deep minimum to 3.9954.004 (18 days) and Shallow minimum from 4.0044.013. We have observed the shortest X-ray recovery: the flux starts to increase at which is 7 days earlier than the low limit estimated by Corcoran et al. (2010) in the 2009 periastron passage. The apastron fluxes do not change 5%, indicating a change no more than 0.25% in from Car A or B. The absorption measured by NICER shows an agreement up to 90% after , giving us another indicator that from Car A or Car B has not changed significantly in the last two cycles.
The changes in the soft-band emission from the OE seen for the first time by NICER may be caused by the expansion of the ejecta. If so, simple analysis indicates that the X-ray luminosity near the time of the Great Eruption was about ergs s-1. This is the first estimate of the X-ray luminosity of the Great Eruption and suggests that the X-ray luminosity at that time was comparable to the total luminosity at longer wavelengths.
References
- Anders & Grevesse (1989) Anders, E., & Grevesse, N. 1989, Geochim. Cosmochim. Acta, 53, 197, doi: 10.1016/0016-7037(89)90286-X
- Arzoumanian et al. (2014) Arzoumanian, Z., Gendreau, K. C., Baker, C. L., et al. 2014, in Society of Photo-Optical Instrumentation Engineers (SPIE) Conference Series, Vol. 9144, Space Telescopes and Instrumentation 2014: Ultraviolet to Gamma Ray, 914420, doi: 10.1117/12.2056811
- Astropy Collaboration et al. (2013) Astropy Collaboration, Robitaille, T. P., Tollerud, E. J., et al. 2013, A&A, 558, A33, doi: 10.1051/0004-6361/201322068
- Astropy Collaboration et al. (2018) Astropy Collaboration, Price-Whelan, A. M., SipHocz, B. M., et al. 2018, aj, 156, 123, doi: 10.3847/1538-3881/aabc4f
- Corcoran (2005) Corcoran, M. F. 2005, AJ, 129, 2018, doi: 10.1086/428756
- Corcoran et al. (2019) Corcoran, M. F., Hamaguchi, K., Gendreau, K., et al. 2019, The Astronomer’s Telegram, 13327, 1
- Corcoran et al. (2010) Corcoran, M. F., Hamaguchi, K., Pittard, J. M., et al. 2010, ApJ, 725, 1528, doi: 10.1088/0004-637X/725/2/1528
- Corcoran & Ishibashi (2012) Corcoran, M. F., & Ishibashi, K. 2012, in Astrophysics and Space Science Library, Vol. 384, Astrophysics and Space Science Library, ed. K. Davidson & R. M. Humphreys, 195, doi: 10.1007/978-1-4614-2275-4_9
- Corcoran et al. (2001) Corcoran, M. F., Ishibashi, K., Swank, J. H., & Petre, R. 2001, ApJ, 547, 1034, doi: 10.1086/318416
- Corcoran et al. (1995) Corcoran, M. F., Rawley, G. L., Swank, J. H., & Petre, R. 1995, ApJ, 445, L121, doi: 10.1086/187904
- Corcoran et al. (1998) Corcoran, M. F., Petre, R., Swank, J. H., et al. 1998, ApJ, 494, 381, doi: 10.1086/305190
- Corcoran et al. (2017) Corcoran, M. F., Liburd, J., Morris, D., et al. 2017, ApJ, 838, 45, doi: 10.3847/1538-4357/aa6347
- Corcoran et al. (2020) Corcoran, M. F., Hamaguchi, K., Espinoza, D., et al. 2020, The Astronomer’s Telegram, 13516, 1
- Damineli (1996) Damineli, A. 1996, ApJ, 460, L49+, doi: 10.1086/309961
- Damineli et al. (1997) Damineli, A., Conti, P. S., & Lopes, D. F. 1997, New Astronomy, 2, 107, doi: 10.1016/S1384-1076(97)00008-0
- Damineli et al. (2008) Damineli, A., Hillier, D. J., Corcoran, M. F., et al. 2008, MNRAS, 384, 1649, doi: 10.1111/j.1365-2966.2007.12815.x
- Davidson (1971) Davidson, K. 1971, MNRAS, 154, 415
- Davidson & Humphreys (1997) Davidson, K., & Humphreys, R. M. 1997, ARA&A, 35, 1, doi: 10.1146/annurev.astro.35.1.1
- Espinoza-Galeas (2021) Espinoza-Galeas, D. A. 2021, PhD thesis, The Catholic University of America
- Espinoza-Galeas & Corcoran (2020) Espinoza-Galeas, D. A., & Corcoran, M. F. 2020, in American Astronomical Society Meeting Abstracts, American Astronomical Society Meeting Abstracts, 377.04
- Espinoza-Galeas et al. (2020) Espinoza-Galeas, D. A., Corcoran, M. F., Hamaguchi, K., et al. 2020, The Astronomer’s Telegram, 13636, 1
- Gaviola (1950) Gaviola, E. 1950, ApJ, 111, 408. http://adsabs.harvard.edu/cgi-bin/nph-bib_query?bibcode=1950ApJ...111..408G&db_key=AST
- Gaviola (1953) —. 1953, ApJ, 118, 234. http://adsabs.harvard.edu/cgi-bin/nph-bib_query?bibcode=1953ApJ...118..234G&db_key=AST
- Gendreau et al. (2012) Gendreau, K. C., Arzoumanian, Z., & Okajima, T. 2012, in Proc. SPIE, Vol. 8443, Space Telescopes and Instrumentation 2012: Ultraviolet to Gamma Ray, 844313, doi: 10.1117/12.926396
- Groh et al. (2012) Groh, J. H., Hillier, D. J., Madura, T. I., & Weigelt, G. 2012, MNRAS, 423, 1623, doi: 10.1111/j.1365-2966.2012.20984.x
- Hamaguchi et al. (2007a) Hamaguchi, K., Corcoran, M. F., Gull, T., et al. 2007a, in Astronomical Society of the Pacific Conference Series, Vol. 367, Massive Stars in Interactive Binaries, ed. N. St.-Louis & A. F. J. Moffat, 257–+
- Hamaguchi et al. (2007b) Hamaguchi, K., Corcoran, M. F., Gull, T., et al. 2007b, ApJ, 663, 522, doi: 10.1086/518101
- Hamaguchi et al. (2014) Hamaguchi, K., Corcoran, M. F., Russell, C. M. P., et al. 2014, ApJ, 784, 125, doi: 10.1088/0004-637X/784/2/125
- Hillier et al. (2001) Hillier, D. J., Davidson, K., Ishibashi, K., & Gull, T. 2001, ApJ, 553, 837, doi: 10.1086/320948
- Humphreys & Martin (2012) Humphreys, R. M., & Martin, J. C. 2012, in Astrophysics and Space Science Library, Vol. 384, Eta Carinae and the Supernova Impostors, ed. K. Davidson & R. M. Humphreys, 1, doi: 10.1007/978-1-4614-2275-4_1
- Immler & Kuntz (2005) Immler, S., & Kuntz, K. D. 2005, ApJ, 632, L99, doi: 10.1086/497910
- Ishibashi et al. (1999) Ishibashi, K., Corcoran, M. F., Davidson, K., et al. 1999, ApJ, 524, 983, doi: 10.1086/307859
- Kashi et al. (2021) Kashi, A., Principe, D. A., Soker, N., & Kastner, J. H. 2021, ApJ, 914, 47, doi: 10.3847/1538-4357/abfa9c
- Kashi & Soker (2009) Kashi, A., & Soker, N. 2009, ApJ, 701, L59, doi: 10.1088/0004-637X/701/1/L59
- Kiminki et al. (2016) Kiminki, M. M., Reiter, M., & Smith, N. 2016, MNRAS, 463, 845, doi: 10.1093/mnras/stw2019
- Madura et al. (2012) Madura, T. I., Gull, T. R., Owocki, S. P., et al. 2012, MNRAS, 420, 2064, doi: 10.1111/j.1365-2966.2011.20165.x
- Madura et al. (2013) Madura, T. I., Gull, T. R., Okazaki, A. T., et al. 2013, MNRAS, 436, 3820, doi: 10.1093/mnras/stt1871
- Mehner et al. (2010) Mehner, A., Davidson, K., Ferland, G. J., & Humphreys, R. M. 2010, ApJ, 710, 729, doi: 10.1088/0004-637X/710/1/729
- Moffat & Corcoran (2009) Moffat, A. F. J., & Corcoran, M. F. 2009, ApJ, 707, 693, doi: 10.1088/0004-637X/707/1/693
- Morris et al. (2017) Morris, P. W., Gull, T. R., Hillier, D. J., et al. 2017, ApJ, 842, 79, doi: 10.3847/1538-4357/aa71b3
- Okazaki et al. (2008) Okazaki, A. T., Owocki, S. P., Russell, C. M. P., & Corcoran, M. F. 2008, MNRAS, 388, L39, doi: 10.1111/j.1745-3933.2008.00496.x
- Owocki et al. (1988) Owocki, S. P., Castor, J. I., & Rybicki, G. B. 1988, ApJ, 335, 914, doi: 10.1086/166977
- Parkin et al. (2011) Parkin, E. R., Pittard, J. M., Corcoran, M. F., & Hamaguchi, K. 2011, ApJ, 726, 105, doi: 10.1088/0004-637X/726/2/105
- Parkin et al. (2009) Parkin, E. R., Pittard, J. M., Corcoran, M. F., Hamaguchi, K., & Stevens, I. R. 2009, MNRAS, 394, 1758, doi: 10.1111/j.1365-2966.2009.14475.x
- Pittard & Corcoran (2002) Pittard, J. M., & Corcoran, M. F. 2002, A&A, 383, 636, doi: 10.1051/0004-6361:20020025
- Prigozhin et al. (2016) Prigozhin, G., Gendreau, K., Doty, J. P., et al. 2016, in Proc. SPIE, Vol. 9905, Space Telescopes and Instrumentation 2016: Ultraviolet to Gamma Ray, 99051I, doi: 10.1117/12.2231718
- Remillard et al. (2021) Remillard, R. A., Loewenstein, M., Steiner, J. F., et al. 2021, arXiv e-prints, arXiv:2105.09901. https://arxiv.org/abs/2105.09901
- Russell et al. (2016) Russell, C. M. P., Corcoran, M. F., Hamaguchi, K., et al. 2016, MNRAS, 458, 2275, doi: 10.1093/mnras/stw339
- Seward et al. (1979) Seward, F. D., Forman, W. R., Giacconi, R., et al. 1979, ApJ, 234, L55, doi: 10.1086/183108
- Smith (2006) Smith, N. 2006, ApJ, 644, 1151, doi: 10.1086/503766
- Stellingwerf (1978) Stellingwerf, R. F. 1978, ApJ, 224, 953, doi: 10.1086/156444
- Stevens et al. (1992) Stevens, I. R., Blondin, J. M., & Pollock, A. M. T. 1992, ApJ, 386, 265, doi: 10.1086/171013
- Teodoro et al. (2016) Teodoro, M., Damineli, A., Heathcote, B., et al. 2016, ApJ, 819, 131, doi: 10.3847/0004-637X/819/2/131
- Usov (1992) Usov, V. V. 1992, ApJ, 389, 635, doi: 10.1086/171236
- Verner et al. (2005) Verner, E., Bruhweiler, F., & Gull, T. 2005, ApJ, 624, 973, doi: 10.1086/429400
- Weis et al. (2004) Weis, K., Corcoran, M. F., Bomans, D. J., & Davidson, K. 2004, A&A, 415, 595, doi: 10.1051/0004-6361:20034306
- Wilms et al. (2000) Wilms, J., Allen, A., & McCray, R. 2000, ApJ, 542, 914, doi: 10.1086/317016
| keV | keV | keV | ||||||||
|---|---|---|---|---|---|---|---|---|---|---|
| OBSID | MJD Start | MJD End | Phase | EXPOSURE | Total | Net | Total | Net | Total | Net |
| cts/s | cts/s | cts/s | ||||||||
| 1110010101 | 57954.1245 | 57954.9641 | 3.5343 | 299.7 | 6.09 | 2.66 | 0.71 | |||
| 1110010102 | 57955.0252 | 57955.9950 | 3.5347 | 677.0 | 6.69 | 2.83 | 0.83 | |||
| 1110010103 | 57956.1829 | 57956.8311 | 3.5352 | 636.5 | 6.59 | 2.82 | 0.82 | |||
| 1110010105 | 57958.4340 | 57958.6970 | 3.5362 | 392.9 | 6.51 | 2.70 | 0.81 | |||
| 1110010106 | 58031.0912 | 58031.8693 | 3.5723 | 297.1 | 7.07 | 3.15 | 0.85 | |||
| 1110010107 | 58032.2539 | 58032.2613 | 3.5727 | 199.5 | 9.73 | 3.45 | 1.44 | |||
| 1110010108 | 58078.2795 | 58078.3071 | 3.5954 | 694.8 | 6.79 | 2.87 | 0.85 | |||
| 1110010109 | 58099.2565 | 58099.3248 | 3.6058 | 163.3 | 6.74 | 2.99 | 0.80 | |||
| 1110010110 | 58109.0289 | 58109.8907 | 3.6108 | 1946.4 | 6.77 | 3.05 | 0.73 | |||
| 1110010111 | 58117.0138 | 58117.0233 | 3.6146 | 141.7 | 6.87 | 2.86 | 0.87 | |||
| 1110010112 | 58119.2025 | 58119.3339 | 3.6157 | 169.5 | 7.74 | 3.38 | 0.86 | |||
| 1110010114 | 58136.8688 | 58136.8737 | 3.6244 | 352.3 | 7.04 | 3.11 | 0.67 | |||
| 1110010115 | 58137.1882 | 58137.3885 | 3.6246 | 349.6 | 7.21 | 3.25 | 0.88 | |||
| 1110010116 | 58141.4193 | 58141.8340 | 3.6267 | 3724.3 | 6.92 | 3.22 | 0.74 | |||
| 1110010117 | 58147.7198 | 58147.7935 | 3.6298 | 208.4 | 6.62 | 3.01 | 0.69 | |||
| 1110010119 | 58168.5028 | 58168.5082 | 3.6400 | 365.9 | 8.87 | 3.59 | 1.21 | |||
| 1110010120 | 58169.6597 | 58169.9231 | 3.6407 | 567.3 | 7.57 | 3.44 | 0.82 | |||
| 1110010121 | 58173.2584 | 58173.9097 | 3.6425 | 331.6 | 7.61 | 3.26 | 0.93 | |||
| 1110010122 | 58174.0347 | 58174.3576 | 3.6429 | 242.8 | 7.28 | 3.27 | 0.75 | |||
| 1110010123 | 58175.1285 | 58175.9722 | 3.6435 | 365.7 | 7.61 | 3.31 | 0.82 | |||
| 1110010125 | 58177.8463 | 58177.9621 | 3.6447 | 522.9 | 7.11 | 3.25 | 0.74 | |||
| 1110010126 | 58178.4093 | 58178.9913 | 3.6451 | 314.5 | 8.37 | 3.68 | 1.03 | |||
| 1110010127 | 58179.9521 | 58179.9563 | 3.6457 | 249.8 | 9.06 | 3.65 | 1.32 | |||
| 1110010128 | 58184.0039 | 58184.3500 | 3.6478 | 643.5 | 6.93 | 3.12 | 0.80 | |||
| 1110010129 | 58187.1653 | 58187.2347 | 3.6493 | 458.8 | 7.93 | 3.40 | 0.96 | |||
| 1110010131 | 58199.5606 | 58199.7051 | 3.6554 | 413.9 | 10.92 | 3.66 | 1.76 | |||
| 1110010132 | 58216.6053 | 58216.6153 | 3.6638 | 276.6 | 7.12 | 3.00 | 0.86 | |||
| 1110010133 | 58222.1339 | 58222.4620 | 3.6666 | 511.7 | 7.75 | 3.06 | 0.99 | |||
| 1110010134 | 58223.2259 | 58223.8129 | 3.6672 | 297.0 | 9.91 | 3.31 | 1.59 | |||
| 1110010136 | 58228.3578 | 58228.9481 | 3.6698 | 616.0 | 9.83 | 3.40 | 1.50 | |||
| 1110010141 | 58239.0352 | 58239.8833 | 3.6751 | 5795.4 | 6.86 | 3.07 | 0.78 | |||
| 1110010142 | 58241.3518 | 58241.6838 | 3.6761 | 1102.0 | 6.75 | 2.99 | 0.79 | |||
| 1110010143 | 58242.3166 | 58242.3278 | 3.6765 | 170.6 | 7.02 | 3.02 | 0.80 | |||
| 1110010146 | 58252.7644 | 58252.9610 | 3.6817 | 616.3 | 6.72 | 2.96 | 0.84 | |||
| 1110010147 | 58253.0192 | 58253.2182 | 3.6819 | 1051.8 | 6.78 | 3.03 | 0.75 | |||
| 1110010148 | 58259.4911 | 58259.5076 | 3.6850 | 516.0 | 7.25 | 3.02 | 0.92 | |||
| 1110010149 | 58262.9049 | 58262.9273 | 3.6867 | 500.7 | 6.90 | 2.92 | 0.83 | |||
| 1110010150 | 58263.0956 | 58263.6347 | 3.6869 | 1773.3 | 6.78 | 2.94 | 0.81 | |||
| 1110010151 | 58275.6873 | 58275.8257 | 3.6931 | 469.0 | 8.83 | 3.34 | 1.30 | |||
| 1110010152 | 58283.5262 | 58283.7279 | 3.6970 | 939.0 | 6.64 | 2.82 | 0.79 | |||
| 1110010153 | 58289.1243 | 58289.1412 | 3.6997 | 581.6 | 6.53 | 2.76 | 0.78 | |||
| 1110010155 | 58298.3313 | 58298.3481 | 3.7042 | 752.8 | 6.96 | 2.87 | 0.88 | |||
| 1110010156 | 58301.1650 | 58301.2340 | 3.7056 | 480.1 | 6.78 | 2.73 | 0.88 | |||
| 1110010157 | 58308.2235 | 58308.3012 | 3.7091 | 1733.4 | 6.37 | 2.78 | 0.75 | |||
| 1110010158 | 58314.6586 | 58314.7329 | 3.7123 | 594.7 | 6.79 | 2.78 | 0.89 | |||
| 1110010159 | 58319.8752 | 58319.8772 | 3.7149 | 109.3 | 6.98 | 2.77 | 0.74 | |||
| 1110010160 | 58320.0683 | 58320.2634 | 3.7150 | 247.1 | 8.26 | 3.01 | 1.16 | |||
| 1110010161 | 58321.7405 | 58321.7432 | 3.7158 | 175.2 | 6.19 | 2.53 | 0.78 | |||
| 1110010163 | 58323.5979 | 58323.6764 | 3.7167 | 1048.4 | 6.92 | 2.92 | 0.84 | |||
| 1110010164 | 58327.0116 | 58327.1006 | 3.7184 | 2275.8 | 6.46 | 2.84 | 0.75 | |||
| 1110010165 | 58331.0049 | 58331.9109 | 3.7206 | 268.2 | 6.27 | 2.80 | 0.68 | |||
| 1110010169 | 58342.8951 | 58342.9643 | 3.7263 | 196.0 | 10.32 | 3.60 | 1.61 | |||
| 1110010171 | 58351.8975 | 58351.9743 | 3.7307 | 359.8 | 13.76 | 4.06 | 2.36 | |||
| 1110010173 | 58362.9475 | 58362.9634 | 3.7362 | 974.1 | 7.35 | 3.38 | 0.79 | |||
| 1110010174 | 58363.0118 | 58363.0294 | 3.7362 | 1052.0 | 7.44 | 3.39 | 0.77 | |||
| 1110010175 | 58368.4795 | 58368.5051 | 3.7389 | 292.7 | 7.27 | 3.27 | 0.82 | |||
| 1110010176 | 58375.4289 | 58375.6970 | 3.7424 | 782.3 | 8.19 | 3.62 | 0.91 | |||
| 1110010179 | 58417.2524 | 58417.3912 | 3.7631 | 1387.3 | 10.37 | 4.15 | 1.40 | |||
| 1110010185 | 58452.0986 | 58452.1674 | 3.7803 | 162.9 | 8.57 | 3.81 | 1.08 | |||
| 1110010186 | 58455.3905 | 58455.4660 | 3.7819 | 244.1 | 8.42 | 3.72 | 1.00 | |||
| 1110010187 | 58458.5218 | 58458.5368 | 3.7834 | 431.0 | 0.25 | 0.05 | 0.05 | |||
| 1110010188 | 58469.7851 | 58469.8005 | 3.7890 | 385.4 | 8.64 | 3.81 | 1.01 | |||
| 1110010189 | 58470.4912 | 58470.6377 | 3.7894 | 1667.6 | 8.96 | 3.97 | 1.00 | |||
| 1110010190 | 58477.1783 | 58477.2631 | 3.7927 | 1316.8 | 9.34 | 3.93 | 1.18 | |||
| 1110010193 | 58493.5105 | 58493.8428 | 3.8008 | 294.9 | 9.40 | 4.10 | 1.09 | |||
| 1110010194 | 58494.9213 | 58494.9373 | 3.8014 | 608.1 | 10.05 | 4.45 | 1.12 | |||
| 1110010195 | 58495.3067 | 58495.3236 | 3.8016 | 518.8 | 10.41 | 4.61 | 1.20 | |||
| 1110010196 | 58496.3350 | 58496.3537 | 3.8021 | 505.6 | 12.65 | 4.77 | 1.75 | |||
| 1110010197 | 58497.2387 | 58497.2565 | 3.8026 | 581.5 | 10.46 | 4.62 | 1.30 | |||
| 1110010198 | 58498.0725 | 58498.1515 | 3.8030 | 1015.7 | 10.44 | 4.55 | 1.22 | |||
| 1110010199 | 58499.5523 | 58499.6398 | 3.8037 | 116.1 | 10.63 | 4.49 | 1.30 | |||
| 1110010201 | 58500.5252 | 58500.6690 | 3.8042 | 168.7 | 10.74 | 4.68 | 1.34 | |||
| 1110010202 | 58501.8114 | 58501.8176 | 3.8048 | 420.6 | 10.30 | 4.52 | 1.14 | |||
| 1110010203 | 58502.2592 | 58502.5343 | 3.8051 | 507.0 | 10.64 | 4.56 | 1.29 | |||
| 1110010204 | 58520.2005 | 58520.7284 | 3.8140 | 1007.0 | 9.51 | 4.46 | 1.02 | |||
| 1110010205 | 58525.4805 | 58525.4935 | 3.8165 | 980.7 | 9.12 | 4.34 | 0.93 | |||
| 1110010206 | 58530.3733 | 58530.4488 | 3.8190 | 773.0 | 9.48 | 4.46 | 0.92 | |||
| 1110010207 | 58533.7206 | 58533.7326 | 3.8206 | 516.8 | 10.20 | 4.65 | 1.16 | |||
| 1110010208 | 58537.0664 | 58537.1440 | 3.8223 | 1657.9 | 10.45 | 4.65 | 1.20 | |||
| 2110010201 | 58547.5717 | 58547.9738 | 3.8275 | 2430.5 | 9.98 | 4.51 | 1.14 | |||
| 2110010202 | 58548.0231 | 58548.9396 | 3.8279 | 9945.4 | 10.29 | 4.61 | 1.18 | |||
| 2110010203 | 58549.1162 | 58549.1329 | 3.8282 | 460.5 | 10.16 | 4.56 | 1.16 | |||
| 2612010101 | 58556.7181 | 58556.7289 | 3.8320 | 400.0 | 10.30 | 4.63 | 1.16 | |||
| 2612010401 | 58575.6100 | 58575.6262 | 3.8413 | 1058.5 | 10.01 | 4.29 | 1.26 | |||
| 2612010501 | 58582.3762 | 58582.3956 | 3.8447 | 704.6 | 10.64 | 4.37 | 1.41 | |||
| 2612010601 | 58589.0624 | 58589.0924 | 3.8480 | 1145.5 | 10.36 | 4.32 | 1.34 | |||
| 2612010701 | 58596.2097 | 58596.2852 | 3.8515 | 1037.5 | 9.85 | 4.32 | 1.17 | |||
| 2612010801 | 58602.9717 | 58602.9838 | 3.8548 | 627.0 | 10.55 | 4.56 | 1.31 | |||
| 2612010802 | 58603.0360 | 58603.0481 | 3.8549 | 599.4 | 10.26 | 4.34 | 1.29 | |||
| 2612010901 | 58610.9071 | 58610.9231 | 3.8588 | 459.1 | 9.90 | 4.33 | 1.24 | |||
| 2612011001 | 58617.0283 | 58617.1039 | 3.8618 | 1128.1 | 10.34 | 4.38 | 1.32 | |||
| 2612011101 | 58624.2824 | 58624.3093 | 3.8654 | 872.3 | 10.06 | 4.32 | 1.27 | |||
| 2612011201 | 58630.9266 | 58630.9417 | 3.8687 | 255.5 | 10.28 | 4.26 | 1.31 | |||
| 2612011202 | 58630.9909 | 58631.0060 | 3.8687 | 210.6 | 10.55 | 4.36 | 1.26 | |||
| 2612011301 | 58637.9304 | 58637.9417 | 3.8721 | 383.4 | 10.33 | 4.39 | 1.37 | |||
| 2612011401 | 58645.5280 | 58645.5381 | 3.8759 | 436.7 | 9.93 | 4.12 | 1.29 | |||
| 2612011402 | 58646.0417 | 58646.0544 | 3.8761 | 335.8 | 10.00 | 4.21 | 1.30 | |||
| 2612011501 | 58652.4240 | 58652.4424 | 3.8793 | 1351.5 | 10.04 | 4.18 | 1.28 | |||
| 2612011601 | 58657.9089 | 58657.9252 | 3.8820 | 797.1 | 11.05 | 4.58 | 1.44 | |||
| 2612011701 | 58663.0030 | 58663.0188 | 3.8845 | 256.9 | 11.25 | 4.72 | 1.42 | |||
| 2612011801 | 58676.2015 | 58676.3370 | 3.8911 | 997.1 | 11.53 | 4.82 | 1.49 | |||
| 2612011901 | 58680.1998 | 58680.2863 | 3.8930 | 1423.1 | 11.46 | 4.83 | 1.43 | |||
| 2612012001 | 58687.2852 | 58687.3171 | 3.8965 | 1007.7 | 12.34 | 5.14 | 1.58 | |||
| 2612012101 | 58693.0936 | 58693.1169 | 3.8994 | 1355.3 | 12.60 | 5.21 | 1.61 | |||
| 2612012401 | 58716.2225 | 58716.2961 | 3.9108 | 277.6 | 12.89 | 5.38 | 1.75 | |||
| 2612012501 | 58721.3835 | 58721.4593 | 3.9134 | 484.2 | 15.69 | 6.52 | 2.01 | |||
| 2612012502 | 58722.5889 | 58722.6042 | 3.9140 | 307.1 | 15.34 | 6.40 | 2.06 | |||
| 2612012601 | 58729.5560 | 58729.5725 | 3.9174 | 125.0 | 14.06 | 5.83 | 1.93 | |||
| 2612012701 | 58736.0142 | 58736.0752 | 3.9206 | 187.8 | 14.50 | 5.85 | 1.93 | |||
| 2612012901 | 58750.8275 | 58750.8435 | 3.9279 | 375.8 | 14.81 | 6.12 | 2.07 | |||
| 2612020301 | 58790.5337 | 58790.5581 | 3.9476 | 137.9 | 16.45 | 6.28 | 2.39 | |||
| 2612020401 | 58793.6933 | 58793.7199 | 3.9491 | 184.5 | 16.21 | 6.37 | 2.28 | |||
| 2612020501 | 58795.0450 | 58795.0728 | 3.9498 | 172.4 | 16.90 | 6.71 | 2.28 | |||
| 2612020701 | 58800.0102 | 58800.0294 | 3.9523 | 172.6 | 16.37 | 6.62 | 2.23 | |||
| 2612020801 | 58802.0076 | 58802.0271 | 3.9532 | 323.5 | 17.68 | 7.10 | 2.44 | |||
| 2612020901 | 58804.0078 | 58804.0278 | 3.9542 | 261.0 | 19.16 | 7.49 | 2.79 | |||
| 2612021001 | 58807.0372 | 58807.0530 | 3.9557 | 131.0 | 19.94 | 7.67 | 2.66 | |||
| 2612021101 | 58809.1014 | 58809.1162 | 3.9567 | 426.8 | 21.18 | 8.53 | 2.91 | |||
| 2612021102 | 58810.2620 | 58810.2770 | 3.9573 | 254.8 | 22.67 | 8.83 | 3.21 | |||
| 2612021201 | 58811.4230 | 58811.5668 | 3.9579 | 1708.2 | 22.81 | 9.07 | 3.15 | |||
| 2612021202 | 58812.6484 | 58812.6634 | 3.9585 | 445.1 | 22.96 | 9.20 | 3.15 | |||
| 2612021301 | 58813.8748 | 58813.9532 | 3.9591 | 956.7 | 23.53 | 9.48 | 3.23 | |||
| 2612021801 | 58825.3557 | 58825.4965 | 3.9648 | 2220.5 | 21.98 | 8.45 | 3.27 | |||
| 2612021901 | 58826.3288 | 58826.3949 | 3.9653 | 751.8 | 21.91 | 8.44 | 3.30 | |||
| 2612022003 | 58829.0544 | 58829.9404 | 3.9668 | 594.8 | 22.23 | 8.64 | 3.28 | |||
| 2612022102 | 58830.1914 | 58830.1999 | 3.9672 | 295.0 | 21.52 | 8.12 | 3.37 | |||
| 2612022103 | 58832.7098 | 58832.9795 | 3.9685 | 779.0 | 22.91 | 8.54 | 3.38 | |||
| 2612022104 | 58833.5626 | 58833.9589 | 3.9689 | 2506.0 | 23.19 | 8.89 | 3.46 | |||
| 2612022105 | 58834.0846 | 58834.9938 | 3.9693 | 5058.4 | 23.70 | 9.19 | 3.46 | |||
| 2612022201 | 58835.0368 | 58835.9627 | 3.9698 | 5613.2 | 24.78 | 9.45 | 3.70 | |||
| 2612022202 | 58836.0743 | 58836.7366 | 3.9702 | 2207.3 | 24.66 | 9.40 | 3.68 | |||
| 2612022301 | 58837.1103 | 58837.5748 | 3.9707 | 1618.0 | 24.07 | 9.20 | 3.58 | |||
| 2612022302 | 58837.9976 | 58838.8468 | 3.9712 | 1212.4 | 25.06 | 9.31 | 3.73 | |||
| 2612022401 | 58839.2858 | 58839.8193 | 3.9718 | 1514.2 | 24.55 | 9.38 | 3.71 | |||
| 2612022402 | 58840.1899 | 58840.6639 | 3.9722 | 1843.7 | 23.77 | 9.16 | 3.49 | |||
| 2612022403 | 58841.1019 | 58841.6312 | 3.9727 | 1363.0 | 23.13 | 8.99 | 3.30 | |||
| 2612022501 | 58842.0653 | 58842.9859 | 3.9733 | 2007.0 | 23.41 | 9.00 | 3.45 | |||
| 2612022502 | 58843.4863 | 58843.9532 | 3.9739 | 1577.2 | 23.81 | 9.03 | 3.50 | |||
| 2612022601 | 58844.3926 | 58844.9211 | 3.9743 | 3449.9 | 24.10 | 8.99 | 3.65 | |||
| 2612022602 | 58845.0414 | 58845.5019 | 3.9746 | 1664.8 | 24.27 | 9.06 | 3.68 | |||
| 2612022701 | 58846.0058 | 58846.7921 | 3.9752 | 2097.4 | 25.20 | 9.42 | 3.79 | |||
| 2612022702 | 58847.2324 | 58847.2438 | 3.9756 | 558.7 | 25.44 | 9.20 | 3.99 | |||
| 2612022703 | 58848.5930 | 58848.6634 | 3.9763 | 294.1 | 25.28 | 9.33 | 4.22 | |||
| 2612023002 | 58854.7581 | 58854.8317 | 3.9793 | 206.8 | 32.42 | 12.95 | 4.24 | |||
| 2612023003 | 58855.5311 | 58855.9255 | 3.9798 | 757.6 | 30.33 | 13.07 | 3.71 | |||
| 2612023101 | 58856.1770 | 58856.9623 | 3.9802 | 3933.6 | 27.89 | 12.15 | 3.27 | |||
| 2612023102 | 58857.0787 | 58857.9306 | 3.9807 | 4910.0 | 25.08 | 10.96 | 2.95 | |||
| 2612023201 | 58858.1715 | 58858.9540 | 3.9812 | 3883.0 | 26.05 | 11.11 | 3.18 | |||
| 2612023202 | 58859.0121 | 58859.9965 | 3.9817 | 2394.8 | 25.01 | 10.48 | 3.20 | |||
| 2612023301 | 58860.0445 | 58860.7725 | 3.9821 | 2505.0 | 22.53 | 9.29 | 2.98 | |||
| 2612023302 | 58861.0099 | 58862.0000 | 3.9826 | 3590.7 | 18.80 | 7.73 | 2.51 | |||
| 2612023303 | 58861.9798 | 58862.8391 | 3.9831 | 6087.6 | 17.04 | 6.89 | 2.36 | |||
| 2612023401 | 58863.0136 | 58864.0000 | 3.9836 | 5149.8 | 15.75 | 6.06 | 2.34 | |||
| 2612023402 | 58863.9819 | 58864.9674 | 3.9841 | 5609.8 | 16.01 | 6.11 | 2.43 | |||
| 2612023501 | 58865.0796 | 58865.9991 | 3.9846 | 4638.6 | 16.64 | 6.28 | 2.55 | |||
| 2612023502 | 58866.1114 | 58866.9021 | 3.9851 | 3088.1 | 17.96 | 6.64 | 2.77 | |||
| 2612023601 | 58867.0169 | 58867.9340 | 3.9856 | 2160.0 | 22.21 | 8.09 | 3.44 | |||
| 2612023602 | 58868.0532 | 58868.9662 | 3.9861 | 2136.0 | 25.44 | 9.40 | 3.76 | |||
| 2612023701 | 58869.0926 | 58869.0951 | 3.9864 | 155.7 | 24.14 | 9.29 | 3.33 | |||
| 2612023702 | 58871.5791 | 58871.7873 | 3.9877 | 3453.0 | 13.71 | 5.38 | 1.99 | |||
| 2612023801 | 58873.3860 | 58873.3998 | 3.9885 | 1024.6 | 19.96 | 7.32 | 3.14 | |||
| 2612023902 | 58875.1947 | 58875.9146 | 3.9896 | 7996.2 | 7.92 | 3.19 | 1.15 | |||
| 2612023903 | 58876.1678 | 58876.8768 | 3.9901 | 3430.3 | 7.82 | 2.85 | 1.32 | |||
| 2612024001 | 58877.1942 | 58877.7828 | 3.9906 | 3294.1 | 7.31 | 2.61 | 1.31 | |||
| 2612024002 | 58878.0315 | 58878.6894 | 3.9910 | 3273.5 | 8.37 | 2.65 | 1.61 | |||
| 2612024101 | 58879.3874 | 58879.8468 | 3.9916 | 2977.0 | 6.80 | 2.38 | 1.20 | |||
| 2612024102 | 58880.3555 | 58880.6928 | 3.9921 | 3923.6 | 7.94 | 2.45 | 1.59 | |||
| 2612024201 | 58881.0009 | 58881.6606 | 3.9925 | 2965.1 | 9.15 | 2.46 | 2.13 | |||
| 2612024202 | 58882.0326 | 58882.6844 | 3.9930 | 2005.6 | 8.79 | 2.34 | 1.98 | |||
| 2612024203 | 58883.0014 | 58883.7255 | 3.9935 | 2799.5 | 4.71 | 1.64 | 0.85 | |||
| 2612024301 | 58884.0341 | 58884.8225 | 3.9940 | 2396.9 | 2.77 | 1.13 | 0.44 | |||
| 2612024302 | 58885.1958 | 58885.7257 | 3.9945 | 1019.0 | 2.40 | 1.02 | 0.39 | |||
| 2612024401 | 58886.1641 | 58886.6937 | 3.9950 | 2063.9 | 2.36 | 0.95 | 0.42 | |||
| 2612024402 | 58887.2009 | 58887.9845 | 3.9955 | 2232.9 | 1.74 | 0.71 | 0.28 | |||
| 2612024501 | 58888.1667 | 58888.8880 | 3.9960 | 5279.9 | 1.28 | 0.58 | 0.18 | |||
| 2612024502 | 58889.2662 | 58889.7914 | 3.9965 | 2560.0 | 1.19 | 0.53 | 0.17 | |||
| 2612024601 | 58891.0744 | 58891.2757 | 3.9973 | 1283.8 | 1.18 | 0.47 | 0.19 | |||
| 2612024602 | 58892.0451 | 58892.2438 | 3.9978 | 283.9 | 1.29 | 0.59 | 0.21 | |||
| 2612024701 | 58893.1359 | 58893.9863 | 3.9985 | 3916.0 | 1.07 | 0.47 | 0.15 | |||
| 2612024702 | 58894.0379 | 58894.9544 | 3.9990 | 7101.6 | 1.34 | 0.51 | 0.23 | |||
| 2612024801 | 58895.2003 | 58895.9225 | 3.9995 | 3254.0 | 1.25 | 0.50 | 0.19 | |||
| 2612024802 | 58896.0400 | 58896.8905 | 3.9999 | 1525.8 | 0.99 | 0.41 | 0.15 | |||
| 2612024803 | 58897.1371 | 58897.7942 | 4.0004 | 282.3 | 1.04 | 0.52 | 0.11 | |||
| 2612024901 | 58898.5569 | 58898.9558 | 4.0011 | 112.4 | 1.93 | 0.60 | 0.34 | |||
| 2612024902 | 58899.0053 | 58899.9241 | 4.0014 | 2883.9 | 1.53 | 0.55 | 0.28 | |||
| 2612025001 | 58900.1019 | 58900.8921 | 4.0019 | 2283.0 | 2.11 | 0.63 | 0.41 | |||
| 2612025002 | 58901.1381 | 58901.9248 | 4.0024 | 1959.0 | 1.91 | 0.63 | 0.35 | |||
| 2612025101 | 58902.1053 | 58902.9576 | 4.0029 | 2788.0 | 1.34 | 0.45 | 0.24 | |||
| 2612025102 | 58903.1390 | 58903.7326 | 4.0034 | 1766.2 | 1.36 | 0.47 | 0.22 | |||
| 2612025103 | 58904.0440 | 58904.9725 | 4.0039 | 1441.3 | 0.87 | 0.39 | 0.12 | |||
| 2612025201 | 58905.4724 | 58905.4887 | 4.0044 | 1185.1 | 0.76 | 0.36 | 0.11 | |||
| 2612025202 | 58905.9894 | 58906.5208 | 4.0048 | 1677.3 | 0.85 | 0.40 | 0.12 | |||
| 2612025301 | 58907.0194 | 58907.5532 | 4.0053 | 1632.6 | 0.87 | 0.39 | 0.12 | |||
| 3651010101 | 58909.1446 | 58909.1664 | 4.0062 | 889.1 | 1.18 | 0.39 | 0.22 | |||
| 3651010301 | 58911.2796 | 58911.3602 | 4.0073 | 2290.9 | 0.85 | 0.37 | 0.15 | |||
| 3651010501 | 58913.3458 | 58913.4252 | 4.0083 | 2133.6 | 0.92 | 0.37 | 0.18 | |||
| 3651010601 | 58914.3821 | 58914.4576 | 4.0088 | 1768.9 | 1.16 | 0.43 | 0.27 | |||
| 3651010701 | 58915.2266 | 58915.2317 | 4.0092 | 111.7 | 0.96 | 0.38 | 0.14 | |||
| 3651011201 | 58920.0419 | 58920.4350 | 4.0117 | 306.0 | 2.50 | 0.50 | 0.72 | |||
| 3651011301 | 58921.0092 | 58921.0174 | 4.0121 | 464.0 | 1.84 | 0.48 | 0.57 | |||
| 3651011401 | 58922.3619 | 58922.4398 | 4.0128 | 771.7 | 2.91 | 0.55 | 0.87 | |||
| 3651011501 | 58923.3950 | 58923.4743 | 4.0133 | 1209.3 | 2.47 | 0.51 | 0.79 | |||
| 3651011601 | 58924.0403 | 58924.4435 | 4.0137 | 1986.8 | 3.16 | 0.63 | 0.95 | |||
| 3651011701 | 58925.3936 | 58925.4125 | 4.0142 | 902.0 | 3.24 | 0.60 | 0.99 | |||
| 3651011801 | 58926.4269 | 58926.4463 | 4.0148 | 793.0 | 2.71 | 0.52 | 0.87 | |||
| 3651011901 | 58927.3329 | 58927.4787 | 4.0152 | 646.9 | 3.28 | 0.62 | 1.04 | |||
| 3651012001 | 58928.3694 | 58928.9609 | 4.0159 | 1889.9 | 3.33 | 0.53 | 1.10 | |||
| 3651012101 | 58929.7262 | 58929.9278 | 4.0164 | 467.4 | 2.98 | 0.42 | 1.03 | |||
| 3651012701 | 58935.5725 | 58935.7766 | 4.0193 | 810.1 | 3.73 | 0.52 | 1.21 | |||
| 3651012801 | 58936.2185 | 58936.2949 | 4.0196 | 925.5 | 3.81 | 0.48 | 1.33 | |||
| 3651012901 | 58937.2523 | 58937.3938 | 4.0201 | 2118.2 | 4.00 | 0.56 | 1.28 | |||
| 3651013001 | 58938.6072 | 58938.6859 | 4.0208 | 1538.0 | 4.37 | 0.60 | 1.36 | |||
| 3651013101 | 58939.5112 | 58939.5868 | 4.0212 | 1256.3 | 5.21 | 0.77 | 1.60 | |||
| 3651013201 | 58940.5455 | 58940.6201 | 4.0217 | 1255.2 | 4.49 | 0.61 | 1.42 | |||
| 3651013301 | 58941.7729 | 58941.8472 | 4.0224 | 1382.3 | 5.14 | 0.74 | 1.55 | |||
| 3651013401 | 58942.7402 | 58942.8160 | 4.0228 | 1454.0 | 5.11 | 0.79 | 1.50 | |||
| 3651013501 | 58943.6447 | 58943.6648 | 4.0233 | 1244.0 | 4.75 | 0.66 | 1.37 | |||
| 3651013601 | 58944.6164 | 58944.6366 | 4.0237 | 1450.1 | 5.14 | 0.78 | 1.53 | |||
| 3651013701 | 58945.5833 | 58945.6046 | 4.0242 | 1513.1 | 5.05 | 0.81 | 1.45 | |||
| 3651013801 | 58946.6181 | 58946.6377 | 4.0247 | 1152.5 | 5.14 | 0.82 | 1.45 | |||
| 3651013901 | 58947.5933 | 58947.6058 | 4.0252 | 368.5 | 6.04 | 0.94 | 1.73 | |||
| 3651014001 | 58948.6098 | 58948.6285 | 4.0257 | 981.8 | 5.66 | 0.96 | 1.56 | |||
| 3651014101 | 58949.5296 | 58949.6067 | 4.0262 | 1439.1 | 5.67 | 0.92 | 1.53 | |||
| 3651014201 | 58950.5447 | 58950.5750 | 4.0267 | 1224.3 | 5.99 | 1.06 | 1.55 | |||
| 3651014401 | 58952.1164 | 58952.8088 | 4.0276 | 5773.1 | 5.76 | 0.99 | 1.54 | |||
| 3651014501 | 58953.0829 | 58953.6523 | 4.0281 | 3055.3 | 5.96 | 1.07 | 1.53 | |||
| 3651014601 | 58954.0950 | 58954.1731 | 4.0284 | 1960.4 | 5.98 | 1.06 | 1.58 | |||
| 3651014701 | 58955.0616 | 58955.1397 | 4.0289 | 1688.9 | 5.81 | 1.03 | 1.51 | |||
| 3651014801 | 58956.1606 | 58956.2384 | 4.0295 | 1914.5 | 5.75 | 1.02 | 1.54 | |||
| 3651014901 | 58957.1315 | 58957.2067 | 4.0299 | 1678.3 | 6.12 | 1.15 | 1.54 | |||
| 3651015001 | 58957.7099 | 58957.8713 | 4.0303 | 2274.8 | 6.13 | 1.16 | 1.55 | |||
| 3651015101 | 58959.1297 | 58959.2074 | 4.0309 | 1725.5 | 6.10 | 1.17 | 1.47 | |||
| 3651020101 | 58960.2915 | 58960.3690 | 4.0315 | 1838.8 | 6.21 | 1.21 | 1.53 | |||
| 3651020201 | 58962.2925 | 58962.3694 | 4.0325 | 1887.8 | 6.26 | 1.27 | 1.50 | |||
| 3651020301 | 58964.8742 | 58964.9507 | 4.0338 | 752.0 | 6.33 | 1.31 | 1.47 | |||
| 3651020401 | 58966.8713 | 58966.9512 | 4.0348 | 795.6 | 6.37 | 1.34 | 1.49 | |||
| 3651020501 | 58967.9761 | 58967.9836 | 4.0353 | 392.4 | 6.71 | 1.48 | 1.54 | |||
| 3651020502 | 58968.0411 | 58968.1771 | 4.0354 | 1151.2 | 6.78 | 1.49 | 1.56 | |||
| 3651020601 | 58969.7219 | 58969.9840 | 4.0362 | 192.0 | 6.65 | 1.40 | 1.56 | |||
| 3651020602 | 58970.0447 | 58970.1778 | 4.0363 | 155.7 | 6.51 | 1.48 | 1.40 | |||
| 3651020701 | 58972.6956 | 58972.8975 | 4.0377 | 633.2 | 6.38 | 1.47 | 1.39 | |||
| 3651020801 | 58974.1151 | 58974.1965 | 4.0383 | 1282.4 | 6.81 | 1.58 | 1.54 | |||
| 3651020901 | 58976.0506 | 58976.1319 | 4.0393 | 1707.4 | 6.45 | 1.51 | 1.42 | |||
| 3651021001 | 58978.0533 | 58978.1322 | 4.0403 | 1755.5 | 6.56 | 1.62 | 1.38 | |||
| 3651021101 | 58980.3171 | 58980.4553 | 4.0414 | 1372.7 | 6.53 | 1.62 | 1.37 | |||
| 3651021201 | 58981.9933 | 58982.1968 | 4.0423 | 1856.3 | 6.61 | 1.74 | 1.33 | |||
| 3651021301 | 58984.2954 | 58984.3755 | 4.0434 | 773.1 | 6.77 | 1.80 | 1.28 | |||
| 3651030101 | 58986.0354 | 58986.1236 | 4.0442 | 2253.9 | 6.68 | 1.82 | 1.29 | |||
| 3651030201 | 58993.1429 | 58993.2231 | 4.0477 | 1974.9 | 6.77 | 1.91 | 1.26 | |||
| 3651030301 | 59001.6386 | 59001.7127 | 4.0519 | 1364.0 | 7.18 | 2.17 | 1.27 | |||
| 3651030501 | 59014.5339 | 59014.5519 | 4.0583 | 960.0 | 7.12 | 2.31 | 1.15 | |||
| 3651030601 | 59021.0581 | 59021.0757 | 4.0615 | 344.0 | 8.12 | 2.45 | 1.42 | |||
| 3651030701 | 59026.5948 | 59026.6718 | 4.0643 | 963.6 | 6.80 | 2.24 | 1.10 | |||
| 3651030901 | 59042.5980 | 59042.6750 | 4.0722 | 545.1 | 7.48 | 2.58 | 1.14 | |||
| 3651031001 | 59049.5060 | 59049.5801 | 4.0756 | 327.1 | 7.90 | 2.70 | 1.19 | |||
| 3651031101 | 59054.2120 | 59054.2336 | 4.0779 | 1136.5 | 7.59 | 2.78 | 1.11 | |||
| 3651031301 | 59070.3993 | 59070.5398 | 4.0860 | 1047.9 | 7.97 | 2.98 | 1.10 | |||
| 3651031401 | 59077.3005 | 59077.4419 | 4.0894 | 1524.5 | 8.90 | 3.14 | 1.36 | |||
| 3651031501 | 59088.3202 | 59088.3984 | 4.0948 | 468.8 | 7.65 | 2.90 | 1.10 | |||
| 3651031601 | 59091.2896 | 59091.3718 | 4.0963 | 264.2 | 7.58 | 2.89 | 1.06 | |||
| 3651032001 | 59119.3602 | 59119.4403 | 4.1101 | 245.0 | 7.29 | 2.78 | 1.00 | |||
| 3651032201 | 59134.2673 | 59134.3447 | 4.1175 | 848.5 | 6.49 | 2.71 | 0.77 | |||
| 3651032301 | 59140.2679 | 59140.4062 | 4.1205 | 391.3 | 6.69 | 2.87 | 0.75 | |||
| 3651032401 | 59144.8590 | 59144.9954 | 4.1228 | 775.2 | 7.31 | 3.00 | 0.88 | |||
| 3651032801 | 59175.0871 | 59175.1664 | 4.1377 | 1218.4 | 6.42 | 2.63 | 0.82 | |||
| OBSID | Phase | Flux | NH3 | kT4 | EM4 | NH5 | kT6 | EM6 | FluxFeK |
|---|---|---|---|---|---|---|---|---|---|
| 10-11 ergs cm-2 s-1 | 1022 cm-2 | 1058 cm-3 | 1022 cm-2 | 1058 cm-3 | 10-5 photons cm-2 s-1 | ||||
| 1110010101 | 3.53 | 4.96 | |||||||
| 1110010102 | 3.53 | 5.03 | |||||||
| 1110010103 | 3.54 | 3.84 | |||||||
| 1110010105 | 3.54 | 4.35 | |||||||
| 1110010106 | 3.57 | 2.65 | |||||||
| 1110010107 | 3.57 | 5.15 | |||||||
| 1110010108 | 3.60 | 3.57 | |||||||
| 1110010109 | 3.61 | 3.93 | |||||||
| 1110010110 | 3.61 | 5.24 | |||||||
| 1110010111 | 3.61 | 5.56 | |||||||
| 1110010112 | 3.62 | 5.32 | |||||||
| 1110010114 | 3.62 | 5.45 | |||||||
| 1110010115 | 3.62 | 4.16 | |||||||
| 1110010116 | 3.63 | 5.44 | |||||||
| 1110010117 | 3.63 | 5.24 | |||||||
| 1110010119 | 3.64 | 7.64 | |||||||
| 1110010120 | 3.64 | 5.27 | |||||||
| 1110010121 | 3.64 | 5.69 | |||||||
| 1110010122 | 3.64 | 3.53 | |||||||
| 1110010123 | 3.64 | 4.60 | |||||||
| 1110010125 | 3.64 | 3.90 | |||||||
| 1110010126 | 3.65 | 5.00 | |||||||
| 1110010127 | 3.65 | 4.93 | |||||||
| 1110010128 | 3.65 | 4.14 | |||||||
| 1110010129 | 3.65 | 6.14 | |||||||
| 1110010131 | 3.66 | 3.93 | |||||||
| 1110010132 | 3.66 | 3.20 | |||||||
| 1110010133 | 3.67 | 3.77 | |||||||
| 1110010134 | 3.67 | 4.63 | |||||||
| 1110010136 | 3.67 | 8.86 | |||||||
| 1110010141 | 3.68 | 5.56 | |||||||
| 1110010142 | 3.68 | 5.02 | |||||||
| 1110010143 | 3.68 | 6.15 | |||||||
| 1110010146 | 3.68 | 5.61 | |||||||
| 1110010147 | 3.68 | 5.35 | |||||||
| 1110010148 | 3.69 | 2.76 | |||||||
| 1110010149 | 3.69 | 5.32 | |||||||
| 1110010150 | 3.69 | 3.77 | |||||||
| 1110010151 | 3.69 | 6.95 | |||||||
| 1110010152 | 3.70 | 5.87 | |||||||
| 1110010153 | 3.70 | 3.47 | |||||||
| 1110010155 | 3.70 | 4.18 | |||||||
| 1110010156 | 3.71 | 2.84 | |||||||
| 1110010157 | 3.71 | 5.25 | |||||||
| 1110010158 | 3.71 | 3.54 | |||||||
| 1110010159 | 3.71 | 5.01 | |||||||
| 1110010160 | 3.72 | 5.22 | |||||||
| 1110010161 | 3.72 | 5.15 | |||||||
| 1110010163 | 3.72 | 4.32 | |||||||
| 1110010164 | 3.72 | 4.91 | |||||||
| 1110010165 | 3.72 | 4.00 | |||||||
| 1110010169 | 3.73 | 6.63 | |||||||
| 1110010171 | 3.73 | 2.36 | |||||||
| 1110010173 | 3.74 | 5.48 | |||||||
| 1110010174 | 3.74 | 6.13 | |||||||
| 1110010175 | 3.74 | 5.58 | |||||||
| 1110010176 | 3.74 | 6.46 | |||||||
| 1110010179 | 3.76 | 5.90 | |||||||
| 1110010185 | 3.78 | 7.20 | |||||||
| 1110010186 | 3.78 | 6.45 | |||||||
| 1110010187 | 3.78 | 0.01 | |||||||
| 1110010188 | 3.79 | 5.32 | |||||||
| 1110010189 | 3.79 | 6.31 | |||||||
| 1110010190 | 3.79 | 5.82 | |||||||
| 1110010193 | 3.80 | 5.59 | |||||||
| 1110010194 | 3.80 | 6.83 | |||||||
| 1110010195 | 3.80 | 7.29 | |||||||
| 1110010196 | 3.80 | 6.34 | |||||||
| 1110010197 | 3.80 | 7.79 | |||||||
| 1110010198 | 3.80 | 7.65 | |||||||
| 1110010199 | 3.80 | 3.96 | |||||||
| 1110010201 | 3.80 | 4.26 | |||||||
| 1110010202 | 3.80 | 7.20 | |||||||
| 1110010203 | 3.81 | 5.98 | |||||||
| 1110010204 | 3.81 | 7.65 | |||||||
| 1110010205 | 3.82 | 7.18 | |||||||
| 1110010206 | 3.82 | 7.46 | |||||||
| 1110010207 | 3.82 | 7.16 | |||||||
| 1110010208 | 3.82 | 7.08 | |||||||
| 2110010201 | 3.83 | 8.30 | |||||||
| 2110010202 | 3.83 | 8.43 | |||||||
| 2110010203 | 3.83 | 6.36 | |||||||
| 2612010101 | 3.83 | 8.91 | |||||||
| 2612010401 | 3.84 | 8.87 | |||||||
| 2612010501 | 3.84 | 5.69 | |||||||
| 2612010601 | 3.85 | 8.41 | |||||||
| 2612010701 | 3.85 | 8.51 | |||||||
| 2612010801 | 3.85 | 8.00 | |||||||
| 2612010802 | 3.85 | 8.52 | |||||||
| 2612010901 | 3.86 | 8.53 | |||||||
| 2612011001 | 3.86 | 9.02 | |||||||
| 2612011101 | 3.87 | 5.80 | |||||||
| 2612011201 | 3.87 | 8.61 | |||||||
| 2612011202 | 3.87 | 9.06 | |||||||
| 2612011301 | 3.87 | 5.76 | |||||||
| 2612011401 | 3.88 | 8.71 | |||||||
| 2612011402 | 3.88 | 8.82 | |||||||
| 2612011501 | 3.88 | 8.17 | |||||||
| 2612011601 | 3.88 | 8.19 | |||||||
| 2612011701 | 3.88 | 8.51 | |||||||
| 2612011801 | 3.89 | 9.79 | |||||||
| 2612011901 | 3.89 | 8.81 | |||||||
| 2612012001 | 3.90 | 11.16 | |||||||
| 2612012101 | 3.90 | 11.65 | |||||||
| 2612012401 | 3.91 | 10.23 | |||||||
| 2612012501 | 3.91 | 13.50 | |||||||
| 2612012502 | 3.91 | 14.29 | |||||||
| 2612012601 | 3.92 | 12.23 | |||||||
| 2612012701 | 3.92 | 13.33 | |||||||
| 2612012901 | 3.93 | 13.43 | |||||||
| 2612020301 | 3.95 | 15.02 | |||||||
| 2612020401 | 3.95 | 15.39 | |||||||
| 2612020501 | 3.95 | 16.13 | |||||||
| 2612020701 | 3.95 | 15.47 | |||||||
| 2612020801 | 3.95 | 17.09 | |||||||
| 2612020901 | 3.95 | 19.09 | |||||||
| 2612021001 | 3.96 | 18.69 | |||||||
| 2612021101 | 3.96 | 19.54 | |||||||
| 2612021102 | 3.96 | 21.27 | |||||||
| 2612021201 | 3.96 | 22.13 | |||||||
| 2612021202 | 3.96 | 21.83 | |||||||
| 2612021301 | 3.96 | 22.18 | |||||||
| 2612021801 | 3.96 | 21.59 | |||||||
| 2612021901 | 3.97 | 21.16 | |||||||
| 2612022003 | 3.97 | 21.43 | |||||||
| 2612022102 | 3.97 | 20.45 | |||||||
| 2612022103 | 3.97 | 21.88 | |||||||
| 2612022104 | 3.97 | 23.03 | |||||||
| 2612022105 | 3.97 | 22.97 | |||||||
| 2612022201 | 3.97 | 24.31 | |||||||
| 2612022202 | 3.97 | 24.21 | |||||||
| 2612022301 | 3.97 | 23.82 | |||||||
| 2612022302 | 3.97 | 24.65 | |||||||
| 2612022401 | 3.97 | 23.81 | |||||||
| 2612022402 | 3.97 | 22.78 | |||||||
| 2612022403 | 3.97 | 22.42 | |||||||
| 2612022501 | 3.97 | 22.72 | |||||||
| 2612022502 | 3.97 | 23.36 | |||||||
| 2612022601 | 3.97 | 24.03 | |||||||
| 2612022602 | 3.97 | 24.02 | |||||||
| 2612022701 | 3.98 | 25.58 | |||||||
| 2612022702 | 3.98 | 25.13 | |||||||
| 2612022703 | 3.98 | 26.47 | |||||||
| 2612023002 | 3.98 | 30.43 | |||||||
| 2612023003 | 3.98 | 26.43 | |||||||
| 2612023101 | 3.98 | 23.64 | |||||||
| 2612023102 | 3.98 | 21.20 | |||||||
| 2612023201 | 3.98 | 22.51 | |||||||
| 2612023202 | 3.98 | 22.31 | |||||||
| 2612023301 | 3.98 | 19.53 | |||||||
| 2612023302 | 3.98 | 16.67 | |||||||
| 2612023303 | 3.98 | 15.01 | |||||||
| 2612023401 | 3.98 | 14.37 | |||||||
| 2612023402 | 3.98 | 14.75 | |||||||
| 2612023501 | 3.98 | 14.98 | |||||||
| 2612023502 | 3.99 | 16.83 | |||||||
| 2612023601 | 3.99 | 21.52 | |||||||
| 2612023602 | 3.99 | 23.72 | |||||||
| 2612023701 | 3.99 | 22.99 | |||||||
| 2612023702 | 3.99 | 12.97 | |||||||
| 2612023801 | 3.99 | 19.14 | |||||||
| 2612023902 | 3.99 | 7.06 | |||||||
| 2612023903 | 3.99 | 7.72 | |||||||
| 2612024001 | 3.99 | 7.36 | |||||||
| 2612024002 | 3.99 | 8.97 | |||||||
| 2612024101 | 3.99 | 6.83 | |||||||
| 2612024102 | 3.99 | 8.45 | |||||||
| 2612024201 | 3.99 | 11.11 | |||||||
| 2612024202 | 3.99 | 10.65 | |||||||
| 2612024203 | 3.99 | 4.31 | |||||||
| 2612024301 | 3.99 | 2.21 | |||||||
| 2612024302 | 3.99 | 1.50 | |||||||
| 2612024401 | 3.99 | 1.97 | |||||||
| 2612024402 | 4.00 | 0.55 | |||||||
| 2612024501 | 4.00 | 0.37 | |||||||
| 2612024502 | 4.00 | 0.41 | |||||||
| 2612024601 | 4.00 | 0.17 | |||||||
| 2612024602 | 4.00 | 0.13 | |||||||
| 2612024701 | 4.00 | 0.24 | |||||||
| 2612024702 | 4.00 | 0.46 | |||||||
| 2612024801 | 4.00 | 0.29 | |||||||
| 2612024802 | 4.00 | 0.19 | |||||||
| 2612024803 | 4.00 | 0.11 | |||||||
| 2612024901 | 4.00 | 0.34 | |||||||
| 2612024902 | 4.00 | 0.43 | |||||||
| 2612025001 | 4.00 | 1.17 | |||||||
| 2612025002 | 4.00 | 1.00 | |||||||
| 2612025101 | 4.00 | 0.43 | |||||||
| 2612025102 | 4.00 | 0.41 | |||||||
| 2612025103 | 4.00 | 0.13 | |||||||
| 2612025201 | 4.00 | 0.35 | |||||||
| 2612025202 | 4.00 | 0.50 | |||||||
| 2612025301 | 4.01 | 0.50 | |||||||
| 3651010101 | 4.01 | 0.24 | |||||||
| 3651010301 | 4.01 | 0.45 | |||||||
| 3651010501 | 4.01 | 0.75 | |||||||
| 3651010601 | 4.01 | 1.02 | |||||||
| 3651010701 | 4.01 | 0.70 | |||||||
| 3651011201 | 4.01 | 1.62 | |||||||
| 3651011301 | 4.01 | 2.23 | |||||||
| 3651011401 | 4.01 | 1.45 | |||||||
| 3651011501 | 4.01 | 1.84 | |||||||
| 3651011601 | 4.01 | 3.11 | |||||||
| 3651011701 | 4.01 | 3.08 | |||||||
| 3651011801 | 4.01 | 2.94 | |||||||
| 3651011901 | 4.02 | 4.04 | |||||||
| 3651012001 | 4.02 | 4.17 | |||||||
| 3651012101 | 4.02 | 4.52 | |||||||
| 3651012701 | 4.02 | 5.77 | |||||||
| 3651012801 | 4.02 | 5.98 | |||||||
| 3651012901 | 4.02 | 5.93 | |||||||
| 3651013001 | 4.02 | 6.75 | |||||||
| 3651013101 | 4.02 | 7.89 | |||||||
| 3651013201 | 4.02 | 7.00 | |||||||
| 3651013301 | 4.02 | 7.65 | |||||||
| 3651013401 | 4.02 | 7.30 | |||||||
| 3651013501 | 4.02 | 6.38 | |||||||
| 3651013601 | 4.02 | 6.82 | |||||||
| 3651013701 | 4.02 | 6.47 | |||||||
| 3651013801 | 4.02 | 6.83 | |||||||
| 3651013901 | 4.03 | 7.26 | |||||||
| 3651014001 | 4.03 | 7.89 | |||||||
| 3651014101 | 4.03 | 7.15 | |||||||
| 3651014201 | 4.03 | 7.76 | |||||||
| 3651014401 | 4.03 | 7.16 | |||||||
| 3651014501 | 4.03 | 7.82 | |||||||
| 3651014601 | 4.03 | 7.86 | |||||||
| 3651014701 | 4.03 | 7.60 | |||||||
| 3651014801 | 4.03 | 7.66 | |||||||
| 3651014901 | 4.03 | 7.94 | |||||||
| 3651015001 | 4.03 | 7.73 | |||||||
| 3651015101 | 4.03 | 7.86 | |||||||
| 3651020101 | 4.03 | 7.65 | |||||||
| 3651020201 | 4.03 | 7.92 | |||||||
| 3651020301 | 4.03 | 6.66 | |||||||
| 3651020401 | 4.03 | 6.93 | |||||||
| 3651020501 | 4.04 | 7.62 | |||||||
| 3651020502 | 4.04 | 7.61 | |||||||
| 3651020601 | 4.04 | 5.70 | |||||||
| 3651020602 | 4.04 | 7.91 | |||||||
| 3651020701 | 4.04 | 7.90 | |||||||
| 3651020801 | 4.04 | 7.23 | |||||||
| 3651020901 | 4.04 | 7.27 | |||||||
| 3651021001 | 4.04 | 7.71 | |||||||
| 3651021101 | 4.04 | 7.70 | |||||||
| 3651021201 | 4.04 | 7.53 | |||||||
| 3651021301 | 4.04 | 6.19 | |||||||
| 3651030101 | 4.04 | 7.33 | |||||||
| 3651030201 | 4.05 | 7.14 | |||||||
| 3651030301 | 4.05 | 7.24 | |||||||
| 3651030501 | 4.06 | 6.95 | |||||||
| 3651030601 | 4.06 | 6.42 | |||||||
| 3651030701 | 4.06 | 6.36 | |||||||
| 3651030901 | 4.07 | 6.60 | |||||||
| 3651031001 | 4.08 | 5.99 | |||||||
| 3651031101 | 4.08 | 6.96 | |||||||
| 3651031301 | 4.09 | 6.64 | |||||||
| 3651031401 | 4.09 | 8.49 | |||||||
| 3651031501 | 4.09 | 7.04 | |||||||
| 3651031601 | 4.10 | 7.21 | |||||||
| 3651032001 | 4.11 | 4.20 | |||||||
| 3651032201 | 4.12 | 4.72 | |||||||
| 3651032301 | 4.12 | 5.18 | |||||||
| 3651032401 | 4.12 | 6.48 | |||||||
| 3651032801 | 4.14 | 5.91 |