Electron induced nanoscale nuclear spin relaxation probed by hyperpolarization injection
Abstract
We report on experiments that quantify the role of a central electronic spin as a relaxation source for nuclear spins in its nanoscale environment. Our strategy exploits hyperpolarization injection from the electron as a means to controllably probe an increasing number of nuclear spins in the bath, and subsequently interrogate them with high fidelity. Our experiments are focused on a model system of a nitrogen vacancy (NV) center electronic spin surrounded by several hundred nuclear spins. We observe that the transverse spin relaxation times vary significantly with the extent of hyperpolarization injection, allowing the ability to measure the influence of electron mediated relaxation extending over several nanometers. These results suggest interesting new means to spatially discriminate nuclear spins in a nanoscale environment, and have direct relevance to dynamic nuclear polarization and quantum sensors and memories constructed from hyperpolarized nuclei.
Introduction – Coupled electron-nuclear spin systems are highly relevant to quantum information processing [1, 2], quantum sensing [3], and dynamic nuclear polarization (DNP) [4]. Consider an electronic spin centrally located (position ) in a bath of nuclear spins within a magnetic field (see Fig. 1A-B), coupled to them via hyperfine interactions. The electrons are fast-relaxing (short ), often on account of interactions with phonons [5], and in turn they can serve as a relaxation source for the nuclear spins [6, 7, 8] (schematically shown in Fig. 1C). Such electron induced nuclear relaxation is an important consideration for applications in quantum registers, memories, and sensors constructed out of nuclear spins [9, 10, 11], and is therefore important to quantify. It also plays a key role in determining rates of polarization transfer in DNP [12, 13, 14]. However, probing such relaxation influences, particularly in a spatially defined manner, is challenging. This is because experiments typically have very restricted access to spins in the bath, i.e. there is a limited possibility of spatially distinguishing the spins, other than a small shell where the nuclear resonance frequencies can be significantly shifted from those of the bulk [8, 15, 16, 17, 18]. Previous nanoscale quantum sensing experiments have, for instance, been limited to proximal central spin relaxation effects in small (20) spin networks [19, 20].
In this paper, we report on experiments that study the effects of an electronic spin on nuclei over wider length scales, spanning several nanometers and involving several hundred nuclei. Our strategy (Fig. 1D) exploits controllable hyperpolarized spin injection from the electron to the nuclear bath. The hyperpolarization time is employed as a knob to tune length scales in the bath being probed; the polarization is carried over longer distances with increasing . Simultaneously, the nuclei are subject to a RF driving protocol that permits continuous tracking of their magnetization over minute long periods with high signal-to-noise (SNR) [21]. The measurements reveal, surprisingly, that ensemble-averaged nuclear lifetimes in the rotating frame increase dramatically with increasing polarization time . We demonstrate that this constitutes a direct experimental signature of electron induced nuclear spin relaxation, allowing us to quantify its influence extending over several nanometers.
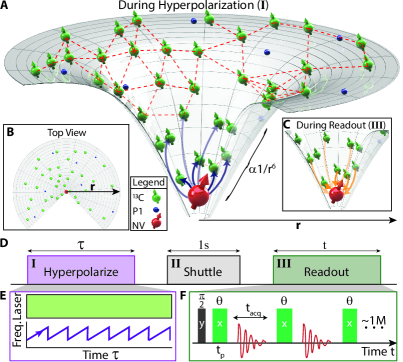
System and Protocol – Experiments here are carried out in diamond as a model system, with central NV [25, 26] electronic spins surrounded by nuclei (Fig. 1A-B). At 1ppm, the NV centers are separated by nm, and nuclei appear with lattice density 0.92 spins/nm3, yielding a relative NV: ratio [27, 28]. In addition, the lattice hosts randomly positioned paramagnetic impurities (P1 centers) at a concentration 20ppm, which can also serve as relaxation sources (Fig. 1A-B).
Experiments are conducted in three regimes (indicated in Fig. 1D): (I) optically induced NV spin injection for period at low-field (mT), (II) rapid adiabatic transport to high field, and (III) interrogation at T. For hyperpolarization (Fig. 1E), we exploit a mechanism previously described in Ref. [22, 23, 29]. Distant spins are polarized by spin diffusion driven by the internuclear dipolar Hamiltonian [18, 30, 31], , where refer to spin-1/2 operators, and coupling strengths , with magnetogyric ratio 10.7MHz/T, and being the inter-nuclear distance. Bulk averaged hyperpolarization under maximal conditions is .
Sample transport (regime II) occurs in in a manner adiabatic with respect to the instantaneous Larmor frequency, thereby preserving the hyperpolarization generated [32]. Conversely, since ms [33, 5], the NV center rapidly loses hyperpolarization and ultimately returns to thermal polarization levels % in regime III (Fig. 1F). Subsequently, the NV center predominantly serves as a point relaxation source for the nuclear bath (Fig. 1C).
Ensemble readout (regime III) employs a protocol described in Refs. [34, 24]. spins are prepared along the transverse axis () on the Bloch sphere, and a train of spin-locking -pulses are applied [35, 36]. nuclei are interrogated in windows between the pulses, allowing their dynamics to be continuously tracked with high SNR [37]. Signal obtained corresponds to measuring the survival probability in the plane. The sequence operation can be described by the unitary . For sufficiently rapid pulsing duty cycle, , such that the inter-nuclear Hamiltonian is engineered to leading order in the Magnus expansion to , where is a flip-flop Hamiltonian [24]. Since commutes with the initial state, dipolar evolution is suppressed to leading order. As a result, free induction decay lifetimes ms (in the absence of spin-lock pulses), are significantly extended, here to 65.5s (see Fig. 2A).
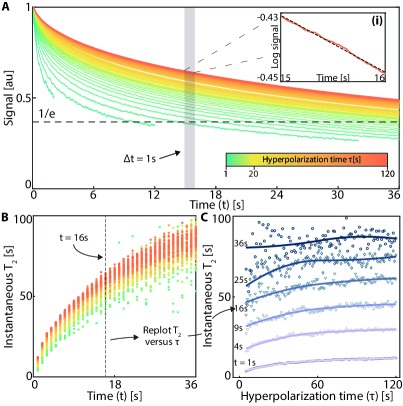
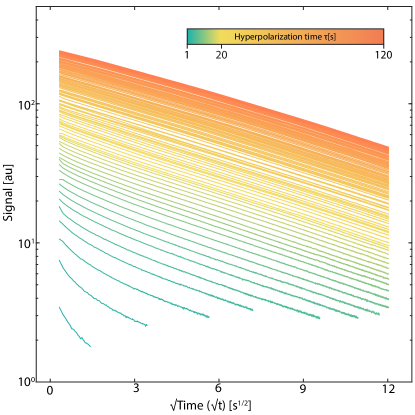
Results — Fig. 2A describes our primary experimental result (see movie at Ref. [38]), showing NMR signal measured employing differing hyperpolarization periods (varied every one second from 1s to s, see colorbar). The signals here are normalized to their values at 9.7ms. Each 36s trace consists of pulses (full data in Fig. 3 consists of pulses), and the nuclei are interrogated after every pulse (Fig. 1F). Surprisingly, we observe that the signals decay more slowly with increasing hyperpolarization period . Normalization of the signal profiles allows the ability to unravel the relative changes in the decay time constant , estimated from the intercept (dashed line in Fig. 2A). For example, comparing s and 120s in Fig. 2A, we observe a increase from 10.2s to 65.5s.
The -intercept (dashed line in Fig. 2A) is blind to the instantaneous change of the decay profile and therefore provides only limited information. To more clearly observe the decay dynamics, we divide the curves in Fig. 2A into 36 segments of width s, with one such segment shown in the gray window in Fig. 2A. We fit the decay in each segment to a monoexponential (as in inset (i)) and extract the instantaneous time constants , which are plotted in Fig. 2B. The notation (as opposed to ) is used to emphasize that these are monoexponential constants. Colors here represent with the same color bar as in Fig. 2A. For each trace, the signals decay markedly slower with increasing time (see also Fig. 3). Ultimately, the times are remarkably long (100s) at large . Increasing polarization time makes the overall decay slower for any selected segment. Indeed, for the segment ending at s (vertical dashed line in Fig. 2B), the value is increased by -fold. To now emphasize the relative change in the values for different segments, Fig. 2C shows the lifetimes plotted against , where data corresponding to each segment in Fig. 2A-B forms the lines (values denote segments ending at ). Fig. 2C makes clear that the instantaneous increases for each segment with increasing , and within each segment with hyperpolarization time . The maximum relative change occurs for short and at early .
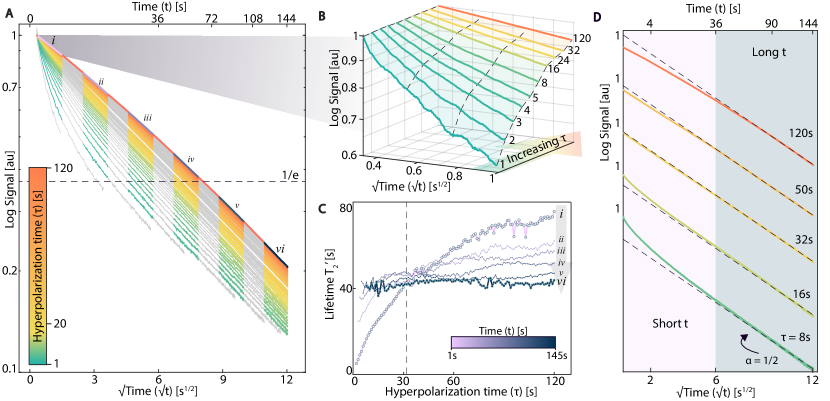
A clearer view of data in Fig. 2 can be obtained by noting that the decays approximately follow a stretched exponential of the form with (see Fig. 3 and movies at Refs. [39, 40]). Fig. 3A shows the signals in Fig. 2 plotted on a logarithmic scale with respect to ; the colorbar represents increasing hyperpolarization time . The signals (gray lines) then manifest as approximately straight lines, demonstrating stretched exponential character with . lifetimes can now be extracted conveniently from the instantaneous slopes , as . High SNR, along with rapid data collection rates (allowing points per trace), allow the unique ability to continuously observe the stretched exponential dynamics. We now focus attention to six segments along the decay curves (labeled (i)-(vi) in Fig. 3A). Complementary to Fig. 2A, data reveals that the values at short time vary considerably with increasing , as evident in segment (i). In contrast, the values at long time are observed to be independent of (evident from the approximately parallel relaxation profiles in segment (vi)). Segment (i) is zoomed in Fig. 3B on the same logarithmic scale for representative values of . The panel makes clear the large relative change in with , most evident in the difference between traces corresponding to 1s and 120s.
To quantify this change with greater clarity, Fig. 3C elucidates the extracted values for the six segments, with a special emphasis on segments (i) (0-1s) and (vi) (121-144s) (highlighted traces). Data reveals that the grows significantly with increasing hyperpolarization time , while is flat and almost independent of . Indeed, the dependence of becomes “flatter” with increasing segment number. Interestingly also, the extracted values for the different segments display a crossing point at 32s (dashed line in Fig. 3C). Finally, Fig. 3D offers insight into variations from exact stretched exponential behavior with changing . We observe that at long times (dark shaded region), the behavior follows a universal dependence (dashed lines). However, in the short time region (36s), there is a deviation from this, exhibited as a transition from convex to concave behavior around . Cross-over occurs at 32s, similar to Fig. 3C.
While similar stretched exponential decay dynamics have been observed before in some restrictive model systems [41, 42, 43], the relatively low number of measurement points in these reports allowed only a limited ability to characterize them. By contrast, the points per trace in Fig. 3A, along with the high SNR, provide a remarkably clear view into the dynamics at short and long .
Theory – To describe the experimental observations, we construct a simple, semi-quantitative model for the nuclear polarization at coordinate and time . We assume centrosymmetry, a good approximation given the ensemble average in our experiments. We then model the dynamics using the differential equation,
| (1) |
where denotes the rate of hyperpolarization injection and is the strength of spatially dependent relaxation due to the central NV center. The scaling of the term in Eq. (1) does not yield qualitatively different behavior compared to a scaling but makes the equation better conditioned near . In any case, the spatial regime and associated nuclear spin frozen core are outside the ambit of our experimental observations because of the relatively small detection bandwidth (32kHz) in our measurements. In contrast to the NV center (at ), we assume that the relatively dense P1 centers (20ppm) serve as contributors to background relaxation of the nuclei independent of their position; this is captured by the term in Eq. (1). Finally, the last term denotes spin diffusion which we assume to be Fickian and Gaussian with a single constant at all locations. This is a good approximation given the large number of nuclei participating in the measured signal around every NV center [18]. For instance, a sphere of injected polarization with radius 4nm contains nuclear spins.
We solve Eq. (1) separately in the three regimes of the experiment (Fig. 1D), with the solution for one regime setting the initial conditions for the next. Obtaining a precise estimate of the parameters in Eq. (1) is challenging and outside the scope of this paper; our goals instead are to obtain qualitative agreement with the experimental observations in Fig. 2-Fig. 3. We therefore make some simplifying assumptions to the parameters in Eq. (1). In regime I, we assume for simplicity ( in regime III). In regime I and III, we employ and respectively, where s and s are the measured low and high-field bulk lifetimes respectively at s [37], and is a scaling factor that we employ as a free parameter in the fits. For Fig. 4, we find good agreement with . The latter assumption can be rationalized by the fact that (1) the individual contributions from P1 centers to relaxation are hard to separate in the bulk measurements; (2) longitudinal and transverse relaxation rates in regime III are expected to be proportional, but are in general, unequal, making the measured only approximately reflective of in Eq. (1); and (3) is measured under dark conditions at a fixed s, but the corresponding in regime I is measured under optical illumination (making measurement more challenging).
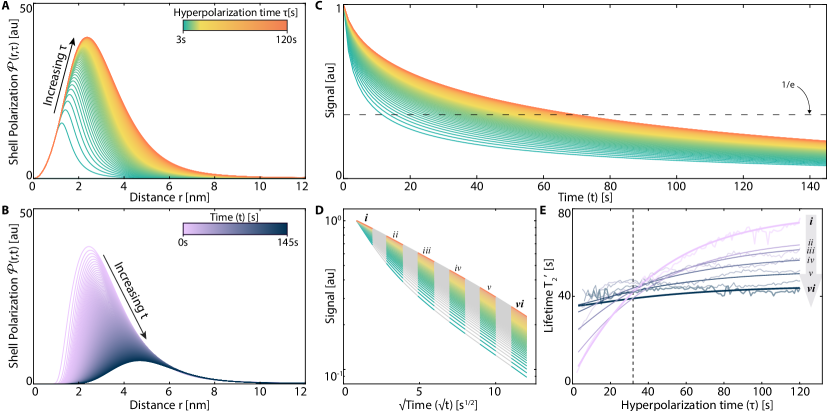
With these assumptions, Fig. 4A-B shows the simulated system dynamics, where we plot the polarization contained in a shell at radius , . Fig. 4A first shows with increasing hyperpolarization time (see colorbar) in regime I, assuming a 1s shuttling period in regime II. Simulation parameters are set to obtain good qualitative agreement with experiment (here nm2/s and s-1). With increasing , spin diffusion leads to a spread of polarization; this is evidenced by the movement of the ”centroid” of with increasing towards greater in Fig. 4A. Notably however, the continuous replenishment of polarization from the NV in regime I makes the distribution of skewed towards the left. In a complementary manner, Fig. 4B elucidates the distribution during the readout period in regime III, assuming one starts with the distribution obtained with s (right-most trace in Fig. 4A). The strong relaxing effect of the NV center yields the polarization “hole” close to , and manifests as the steep wall of growing polarization in Fig. 4B. Additionally, the centroid of moves towards larger and homogenizes as increases; the shift with is apparently larger here because there is no polarization replenishment and relaxation is slower for larger .
Fig. 4C displays the net polarization following the trajectory of Fig. 4B as interrogated during the readout period, but considering here the result for different hyperpolarization times (see colorbar in Fig. 4A). Normalizing the traces then yields an apparent polarization relaxation that becomes slower with increasing , closely matching the experimental results in Fig. 2A. From Fig. 4A-B, we identify that the observations in Fig. 2A arise because the shifting centroid of (see Fig. 4A) makes electron mediated relaxation less effective with increasing . Interestingly, we find that the decays in Fig. 4A also follow an identical stretched exponential as in the experiment. This is evidenced by replotting the data in a logarithmic scale with respect to in Fig. 4D, where we observe a behavior similar to the experiments in Fig. 3A: the stretched exponential dynamics manifest as straight lines here. We hypothesize that the stretched exponentials here result from the inhomogeneity of the polarization distribution in Fig. 4A, which is subject to a collection of relaxation rates based on spatial proximity to the NV. At long readout periods , the parallel lines yield a universal relaxation profile that is independent of ; Fig. 4B allows us to recognize that this is because the polarization spreading far from the NV center is predominantly influenced by the background relaxation. Indeed, as shown in Fig. 4E, taking segments (i)-(vi) along the decay curves in Fig. 4D, and extracting their relaxation times , we observe a progressive flattening of the values with increasing , in good agreement with experimental data in Fig. 3C (overlapped here). Cross-over occurs at s similar to Fig. 3C.
Outlook – These results open many interesting future avenues in a wide class of central spin systems. First, as Fig. 3A and Fig. 4 demonstrate, spin-lock control allows for peering into nuclear polarization localized at different positions with respect to the central electron. Moving through time , the decay curve, as seen in Fig. 2A, effectively corresponds to shifting the centroid location of the sensitive region being probed in the lattice (Fig. 4B). This suggests a (nonlinear) means to map from to an effective coordinate, and can allow interesting new ways to discriminate nuclear spins in the electronic environment. It can enable visualization of the transport of polarization from the central electron [44, 45, 46, 47], and the ability to rewritably engineer spin texture in the nuclear bath [48, 49]. For instance, successive injection of positive and negative polarization from the NV center can result in non-equilibrium “shells” of nuclear polarization whose dynamics can be frozen for minute-long periods by decoupling. Ultimately, this engenders opportunities for exploiting mesoscale nuclear spin baths for quantum information science (QIS) [50] and sensing [51, 52, 53, 54].
Our results illustrate the ability of nuclear spins to probe electronic relaxation processes, therefore providing a means to view the phonon density of states that dominate these relaxation mechanisms [5, 55]. This is relevant to the emerging field of QIS with molecular systems [56], where there is an important need to develop design rules for electronic lifetimes based on molecular vibronic properties [57]. It also has important implications for DNP, wherein the concentration and identity of electron spins can vastly affect nuclear polarization levels [58]. Concurrently, this suggests exciting potential for leveraging long nuclear lifetimes in systems capable of “turning off” the electron spin after hyperpolarization injection [59], for instance in molecules hosting triplet photoexcitable electrons [60, 61, 62].
Conclusion – In summary, we have experimentally measured the influence of a central electronic spin in relaxing the surrounding nuclear spin bath. We exploited controlled hyperpolarization injection as a knob to control length scales over which bath spins are probed, extending over several nanometers and hundreds of spins. Our work informs on a new means to probe nanoscale spin environments, and portends applications in quantum memories and sensors constructed out of hyperpolarized nuclei.
We gratefully acknowledge discussions with C. Ramanathan, C. Meriles and J. Reimer. This work was funded by ONR (N00014-20-1-2806) and DOE STTR (DE-SC0022441).
References
- Prokof’ev and Stamp [2000] N. V. Prokof’ev and P. C. E. Stamp, Theory of the spin bath, Reports on Progress in Physics 63, 669 (2000).
- Ladd et al. [2010] T. Ladd, F. Jelezko, R. Laflamme, Y. Nakamura, C. Monroe, et al., Quantum computers, Nature 464, 45 (2010).
- Degen et al. [2017] C. L. Degen, F. Reinhard, and P. Cappellaro, Quantum sensing, Reviews of modern physics 89, 035002 (2017).
- Abragam and Goldman [1978] A. Abragam and M. Goldman, Principles of dynamic nuclear polarization, Reports on Progress in Physics 41, 395 (1978).
- Jarmola et al. [2012] A. Jarmola, V. Acosta, K. Jensen, S. Chemerisov, and D. Budker, Temperature-and magnetic-field-dependent longitudinal spin relaxation in nitrogen-vacancy ensembles in diamond, Physical review letters 108, 197601 (2012).
- Witzel and Sarma [2006] W. M. Witzel and S. D. Sarma, Quantum theory for electron spin decoherence induced by nuclear spin dynamics in semiconductor quantum computer architectures: Spectral diffusion of localized electron spins in the nuclear solid-state environment, Phys. Rev. B 74, 035322 (2006).
- Bloembergen et al. [1947] N. Bloembergen, E. Purcell, and R. Pound, Nuclear magnetic relaxation, Nature 160, 475 (1947).
- Blumberg [1960] W. Blumberg, Nuclear spin-lattice relaxation caused by paramagnetic impurities, Physical Review 119, 79 (1960).
- Hanson et al. [2008] R. Hanson, V. V. Dobrovitski, A. E. Feiguin, O. Gywat, and D. D. Awschalom, Coherent dynamics of a single spin interacting with an adjustable spin bath, Science 320, 352 (2008).
- Reiserer et al. [2016] A. Reiserer, N. Kalb, M. S. Blok, K. J. van Bemmelen, T. H. Taminiau, R. Hanson, D. J. Twitchen, and M. Markham, Robust quantum-network memory using decoherence-protected subspaces of nuclear spins, Physical Review X 6, 021040 (2016).
- Morton et al. [2008] J. J. L. Morton, A. M. Tyryshkin, R. M. Brown, S. Shankar, B. W. Lovett, A. Ardavan, T. Schenkel, E. E. Haller, J. W. Ager, and S. A. Lyon, Solid-state quantum memory using the 31p nuclear spin, Nature 455, 1085 (2008).
- Siaw et al. [2014] T. A. Siaw, M. Fehr, A. Lund, A. Latimer, S. A. Walker, D. T. Edwards, and S.-I. Han, Effect of electron spin dynamics on solid-state dynamic nuclear polarization performance, Physical Chemistry Chemical Physics 16, 18694 (2014).
- Saliba et al. [2017] E. P. Saliba, E. L. Sesti, F. J. Scott, B. J. Albert, E. J. Choi, N. Alaniva, C. Gao, and A. B. Barnes, Electron decoupling with dynamic nuclear polarization in rotating solids, Journal of the American Chemical Society 139, 6310 (2017).
- Sarkar et al. [2021] A. Sarkar, B. Blankenship, E. Druga, A. Pillai, R. Nirodi, S. Singh, A. Oddo, P. Reshetikhin, and A. Ajoy, Rapidly enhanced spin polarization injection in an optically pumped spin ratchet, arXiv preprint arXiv:2112.07223 (2021).
- Tse and Hartmann [1968] D. Tse and S. Hartmann, Nuclear spin-lattice relaxation via paramagnetic centers without spin diffusion, Physical Review Letters 21, 511 (1968).
- Horvitz [1971] E. P. Horvitz, Nuclear spin diffusion induced by paramagnetic impurities in nonconducting solids, Physical Review B 3, 2868 (1971).
- Stern et al. [2021] Q. Stern, S. F. Cousin, F. Mentink-Vigier, A. C. Pinon, S. J. Elliott, O. Cala, and S. Jannin, Direct observation of hyperpolarization breaking through the spin diffusion barrier, Science Advances 7, eabf5735 (2021).
- Ramanathan [2008] C. Ramanathan, Dynamic nuclear polarization and spin diffusion in nonconducting solids, Applied Magnetic Resonance 34, 409 (2008).
- Dréau et al. [2014] A. Dréau, P. Jamonneau, O. Gazzano, S. Kosen, J.-F. Roch, J. Maze, and V. Jacques, Probing the dynamics of a nuclear spin bath in diamond through time-resolved central spin magnetometry, Physical review letters 113, 137601 (2014).
- Abobeih et al. [2019] M. Abobeih, J. Randall, C. Bradley, H. Bartling, M. Bakker, M. Degen, M. Markham, D. Twitchen, and T. Taminiau, Atomic-scale imaging of a 27-nuclear-spin cluster using a quantum sensor, Nature 576, 411 (2019).
- Sahin et al. [2022] O. Sahin, H. A. Asadi, P. Schindler, A. Pillai, E. Sanchez, M. Elo, M. McAllister, E. Druga, C. Fleckenstein, M. Bukov, et al., Continuously tracked, stable, large excursion trajectories of dipolar coupled nuclear spins, arXiv preprint arXiv:2206.14945 (2022).
- Ajoy et al. [2018a] A. Ajoy, K. Liu, R. Nazaryan, X. Lv, P. R. Zangara, B. Safvati, G. Wang, D. Arnold, G. Li, A. Lin, et al., Orientation-independent room temperature optical 13c hyperpolarization in powdered diamond, Sci. Adv. 4, eaar5492 (2018a).
- Ajoy et al. [2018b] A. Ajoy, R. Nazaryan, K. Liu, X. Lv, B. Safvati, G. Wang, E. Druga, J. Reimer, D. Suter, C. Ramanathan, et al., Enhanced dynamic nuclear polarization via swept microwave frequency combs, Proceedings of the National Academy of Sciences 115, 10576 (2018b).
- Beatrez et al. [2021] W. Beatrez, O. Janes, A. Akkiraju, A. Pillai, A. Oddo, P. Reshetikhin, E. Druga, M. McAllister, M. Elo, B. Gilbert, D. Suter, and A. Ajoy, Floquet prethermalization with lifetime exceeding 90 s in a bulk hyperpolarized solid, Phys. Rev. Lett. 127, 170603 (2021).
- Jelezko and Wrachtrup [2006] F. Jelezko and J. Wrachtrup, Single defect centres in diamond: A review, Physica Status Solidi (A) 203, 3207 (2006).
- Manson et al. [2006] N. B. Manson, J. P. Harrison, and M. J. Sellars, Nitrogen-vacancy center in diamond: Model of the electronic structure and associated dynamics, Phys. Rev. B 74, 104303 (2006).
- Ajoy et al. [2019a] A. Ajoy, B. Safvati, R. Nazaryan, J. Oon, B. Han, P. Raghavan, R. Nirodi, A. Aguilar, K. Liu, X. Cai, et al., Hyperpolarized relaxometry based nuclear t 1 noise spectroscopy in diamond, Nature communications 10, 1 (2019a).
- Van Wyk et al. [1997] J. Van Wyk, E. Reynhardt, G. High, and I. Kiflawi, The dependences of esr line widths and spin-spin relaxation times of single nitrogen defects on the concentration of nitrogen defects in diamond, Journal of Physics D: Applied Physics 30, 1790 (1997).
- Ajoy et al. [2020a] A. Ajoy, R. Nazaryan, E. Druga, K. Liu, A. Aguilar, B. Han, M. Gierth, J. T. Oon, B. Safvati, R. Tsang, et al., Room temperature “optical nanodiamond hyperpolarizer”: Physics, design, and operation, Review of Scientific Instruments 91, 023106 (2020a).
- Karabanov et al. [2015] A. Karabanov, D. Wiśniewski, I. Lesanovsky, and W. Köckenberger, Dynamic nuclear polarization as kinetically constrained diffusion, Physical review letters 115, 020404 (2015).
- Hovav et al. [2010] Y. Hovav, A. Feintuch, and S. Vega, Theoretical aspects of dynamic nuclear polarization in the solid state–the solid effect, Journal of Magnetic Resonance 207, 176 (2010).
- Ajoy et al. [2019b] A. Ajoy, X. Lv, E. Druga, K. Liu, B. Safvati, A. Morabe, M. Fenton, R. Nazaryan, S. Patel, T. F. Sjolander, J. A. Reimer, D. Sakellariou, C. A. Meriles, and A. Pines, Wide dynamic range magnetic field cycler: Harnessing quantum control at low and high fields, Review of Scientific Instruments 90, 013112 (2019b), https://doi.org/10.1063/1.5064685 .
- Popa et al. [2004] I. Popa, T. Gaebel, M. Domhan, C. Wittmann, F. Jelezko, and J. Wrachtrup, Energy levels and decoherence properties of single electron and nuclear spins in a defect center in diamond, Phys. Rev. B 70, 201203 (2004).
- Ajoy et al. [2020b] A. Ajoy, R. Nirodi, P. Reshetikhin, E. Druga, A. Akkiraju, M. McAllister, G. Maineri, S. Le, A. Lin, A. M. Souza, C. A. Meriles, B. Gilbert, D. Suter, J. A. Reimer, and A. Pines, Dynamical decoupling in interacting systems: applications to signal-enhanced hyperpolarized readout, arXiv preprint arXiv:2008.08323 (2020b).
- Rhim et al. [1976] W.-K. Rhim, D. Burum, and D. Elleman, Multiple-pulse spin locking in dipolar solids, Physical Review Letters 37, 1764 (1976).
- Rhim et al. [1973] W.-K. Rhim, D. D. Elleman, and R. W. Vaughan, Analysis of multiple pulse nmr in solids, The Journal of Chemical Physics 59, 3740 (1973).
- Beatrez et al. [2022] W. Beatrez, A. Pillai, O. Janes, D. Suter, and A. Ajoy (2022), see Supplemental Material.
- SD_[2021a] Video showing full dataset of Fig. 2A: https://www.youtube.com/watch?v=GEdVRV2cXH4 (2021a).
- SD_[2021b] Video showing full dataset of Fig. 3A: https://www.youtube.com/watch?v=b8Be0R2etZQ (2021b).
- SD_[2021c] Video showing unnormalized dataset of Fig. 3A: https://www.youtube.com/watch?v=5tirO0yE4zg (2021c).
- Lock et al. [1992] H. Lock, G. E. Maciel, and C. E. Johnson, Natural-abundance 13c dynamic nuclear polarization experiments on chemical vapor deposited diamond film, Journal of materials research 7, 2791 (1992).
- Hartman et al. [1994] J. S. Hartman, A. Narayanan, and Y. Wang, Spin-lattice relaxation in the 6h polytype of silicon carbide, Journal of the American Chemical Society 116, 4019 (1994).
- Henrichs and Linder [1984] P. M. Henrichs and M. Linder, Carbon-13 spin diffusion in the determination of intermolecular structure in solids, Journal of Magnetic Resonance (1969) 58, 458 (1984).
- Zhang and Cory [1998] W. Zhang and D. Cory, First direct measurement of the spin diffusion rate in a homogenous solid, Physical review letters 80, 1324 (1998).
- Burgarth and Ajoy [2017] D. Burgarth and A. Ajoy, Evolution-free hamiltonian parameter estimation through zeeman markers, Physical Review Letters 119, 030402 (2017).
- Ajoy et al. [2012] A. Ajoy, R. K. Rao, A. Kumar, and P. Rungta, Algorithmic approach to simulate hamiltonian dynamics and an nmr simulation of quantum state transfer, Physical Review A 85, 030303 (2012).
- Boutis et al. [2004] G. Boutis, D. Greenbaum, H. Cho, D. Cory, and C. Ramanathan, Spin diffusion of correlated two-spin states in a dielectric crystal, Physical review letters 92, 137201 (2004).
- King et al. [2012] J. P. King, Y. Li, C. A. Meriles, and J. A. Reimer, Optically rewritable patterns of nuclear magnetization in gallium arsenide, Nature communications 3, 1 (2012).
- Michal and Tycko [1999] C. A. Michal and R. Tycko, Stray-field nmr imaging and wavelength dependence of optically pumped nuclear spin polarization in inp, Physical Review B 60, 8672 (1999).
- Foletti et al. [2009] S. Foletti, H. Bluhm, D. Mahalu, V. Umansky, and A. Yacoby, Universal quantum control of two-electron spin quantum bits using dynamic nuclear polarization, Nature Physics 5, 903 (2009).
- Sahin et al. [2021] O. Sahin, E. d. L. Sanchez, S. Conti, A. Akkiraju, P. Reshetikhin, E. Druga, A. Aggarwal, B. Gilbert, S. Bhave, and A. Ajoy, High-field magnetometry with hyperpolarized nuclear spins, arXiv preprint arXiv:2112.11612 (2021).
- Ajoy and Cappellaro [2012] A. Ajoy and P. Cappellaro, Stable three-axis nuclear-spin gyroscope in diamond, Physical Review A 86, 062104 (2012).
- Jaskula et al. [2019] J.-C. Jaskula, K. Saha, A. Ajoy, D. J. Twitchen, M. Markham, and P. Cappellaro, Cross-sensor feedback stabilization of an emulated quantum spin gyroscope, Physical Review Applied 11, 054010 (2019).
- Ledbetter et al. [2012] M. Ledbetter, K. Jensen, R. Fischer, A. Jarmola, and D. Budker, Gyroscopes based on nitrogen-vacancy centers in diamond, Physical Review A 86, 052116 (2012).
- Takahashi et al. [2008] S. Takahashi, R. Hanson, J. Van Tol, M. S. Sherwin, and D. D. Awschalom, Quenching spin decoherence in diamond through spin bath polarization, Physical review letters 101, 047601 (2008).
- Bayliss et al. [2020] S. Bayliss, D. Laorenza, P. Mintun, B. Kovos, D. Freedman, and D. Awschalom, Optically addressable molecular spins for quantum information processing, Science 370, 1309 (2020).
- He et al. [2020] C. He, P. R. Christensen, T. J. Seguin, E. A. Dailing, B. M. Wood, R. K. Walde, K. A. Persson, T. P. Russell, and B. A. Helms, Conformational entropy as a means to control the behavior of poly (diketoenamine) vitrimers in and out of equilibrium, Angewandte Chemie International Edition 59, 735 (2020).
- Lange et al. [2012] S. Lange, A. H. Linden, Ü. Akbey, W. T. Franks, N. M. Loening, B.-J. van Rossum, and H. Oschkinat, The effect of biradical concentration on the performance of dnp-mas-nmr, Journal of magnetic resonance 216, 209 (2012).
- Capozzi et al. [2017] A. Capozzi, T. Cheng, G. Boero, C. Roussel, and A. Comment, Thermal annihilation of photo-induced radicals following dynamic nuclear polarization to produce transportable frozen hyperpolarized 13c-substrates, Nature communications 8, 1 (2017).
- Henstra and Wenckebach [2014] A. Henstra and W. T. Wenckebach, Dynamic nuclear polarisation via the integrated solid effect i: theory, Molecular Physics 112, 1761 (2014).
- Tateishi et al. [2014] K. Tateishi, M. Negoro, S. Nishida, A. Kagawa, Y. Morita, and M. Kitagawa, Room temperature hyperpolarization of nuclear spins in bulk, Proceedings of the National Academy of Sciences 111, 7527 (2014).
- Niketic et al. [2015] N. Niketic, B. Brandt, W. T. Wenckebach, J. Kohlbrecher, and P. Hautle, Polarization analysis in neutron small-angle scattering with a novel triplet dynamic nuclear polarization spin filter, Journal of Applied Crystallography 48, 1514 (2015).
Supplementary Information
Electron induced nanoscale nuclear spin relaxation probed by hyperpolarization injection
William Beatrez,1 Arjun Pillai,1 Otto Janes,1Dieter Suter,2 and Ashok Ajoy,1,3,∗
1 Department of Chemistry, University of California, Berkeley, Berkeley, CA 94720, USA.
2 Fakultät Physik, Technische Universität Dortmund, D-44221 Dortmund, Germany.
3 Chemical Science Division, Lawrence Berkeley National Laboratory, University of California, Berkeley, Berkeley, CA 94720, USA.

I measurements at low and high field
Fig. S1 considers the measurement of the of the nuclear spins at the polarizing field (mT) and the readout field (T) respectively. For these measurements, the sample is first hyperpolarized, and is subsequently carried to the field of interest ( or ) for a waiting period . Finally, the sample is transported to where spin-lock readout is carried out similar to Fig. 2, and the integrated signal is plotted. The rapid field cycling for these measurements is carried out via mechanical sample shuttling, and the experimental strategy is similar to that in Ref. [27].
Notably, varying the period allows one to discern the profile of the relaxation at both fields (see Fig. S1). We find that the relaxation profiles closely follow monoexponential decay profiles (solid lines). From a intercept (dashed line) in Fig. S1 we find the respective low and high field relaxation times as 2s and s respectively. We note that the monoexponential decays here stand in contrast to the observed stretched exponential decays that we find for the rotating frame lifetimes in Fig. 2 and Fig. 3 of the main paper.
II Movies showing data in Fig. 2 and Fig. 3
As a complement to the graphs in the main paper, we present movies corresponding to the data in Fig. 2A and Fig. 3A on Youtube (found at Refs. [38, 39]). These movies show clearly the progressive slowing down of the decay profiles upon increasing the hyperpolarization time in both representations. The gray lines here show fitted stretched exponential lines corresponding to the previous data for clarity, allowing a guide to the eye to track the slowing relaxation dynamics with increasing . Fig. S2 shows an unnormalized plot of Fig. 3, from where the polarization buildup dynamics as a function of can be extracted.