mode = titleSeat back and posture
[1] \fnmark[1]
1]organization=Cognitive Robotics, addressline=Mekelweg 2, city=Delft, postcode=2628 CD, state=Zuid-Holland, country=The Netherlands
2]organization=Department of Human Movement Sciences, Vrije Universiteit Amsterdam, addressline=van der Boechorststraat 7-9, postcode=1081 BT Amsterdam, state=Noord-Holland, country=The Netherlands
[1]Corresponding author
Effects of seat back height and posture on 3D vibration transmission to pelvis, trunk and head
Abstract
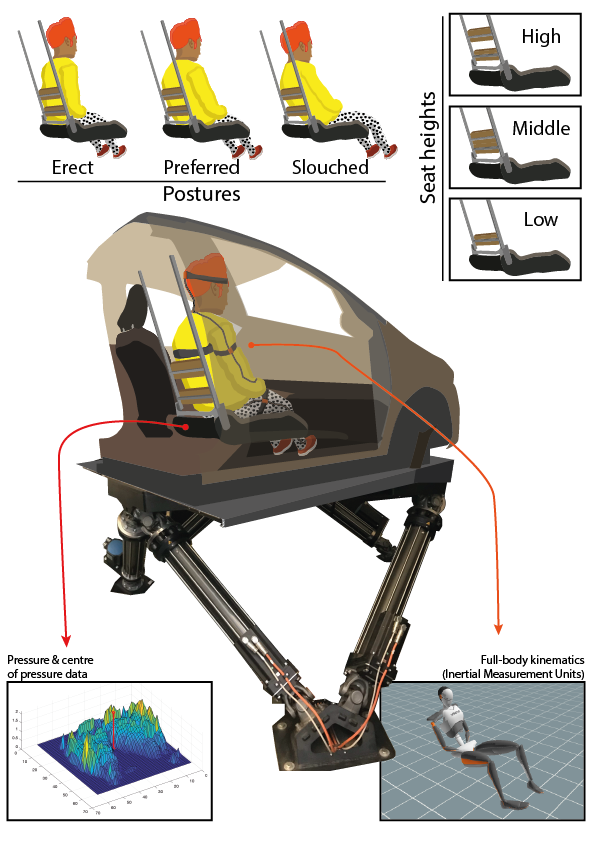
Vibration transmission is essential in the design of comfortable vehicle seats but knowledge is lacking on 3D trunk and head motion and the role of seat back and posture. We hypothesized that head motion is reduced when participants’ upper back is unsupported, as this stimulates active postural control. We developed an experimental methodology to evaluate 3D vibration transmission from compliant seats to the human body. Wide-band (0.1-12 Hz) motion stimuli were applied in fore-aft, lateral and vertical direction to evaluate the translational and rotational body response in pelvis, trunk and head. A standard car seat was equipped with a configurable and compliant back support to test 3 support heights and 3 sitting postures (erect, slouched, and preferred) where we also tested head down looking at a smartphone.
Seat back support height and sitting posture substantially affected vibration transmission and affected low frequency responses in particular for body segment rotation. According to our hypothesis a low support height proved beneficial in reducing head motion.
Relevance to industry: Our methodology effectively evaluates 3D wide-band vibration transmission from compliant seats to the human body. The lowest back support height reduced head motion but was perceived as least comfortable. This calls for seat designs which support but do not so much constrain the upper back. The head down posture enlarged head motion, pleading for computer system integration allowing heads up postures in future automated cars. The biomechanical data will serve to validate human models supporting the design of comfortable (automated) vehicles.
keywords:
\sepVibration \sepComfort \sepPosture \sepAutomotive \sepSeat1 Introduction
Vibrations transmitted from the road to the human body through the seat affect perceived motion comfort (Corbridge and Griffin, 1986; Tiemessen et al., 2007; Dong et al., 2019). Particularly in automated vehicles, motion comfort is essential (Kyriakidis et al., 2015) as these vehicles are intended for spending time on work and leisure activities. Assessment of postural stabilization and comfort can be used in seat design (Papaioannou et al., 2021) and in motion planning (Zheng et al., 2021) of automated vehicles, potentially resulting in higher comfort levels.
The human response to seat vibration is usually quantified by measuring the seat-to-head transmissibility (STHT) including resonance frequencies which are assumed to relate to the level of discomfort (Paddan and Griffin, 1998; Rahmatalla et al., 2010). Human postural responses to vibrations have been studied by investigating the effect of seat configuration factors on STHT, such as back support inclination (Basri and Griffin, 2014; Jalil and Griffin, 2007a; Nawayseh, 2015), seat pan inclination (Jalil and Griffin, 2007a), and thickness of foam cushions (Zhang et al., 2015). Back support height, on the other hand, has been investigated only in few studies. Toward and Griffin (2011, 2009) compared vertical loading with and without back support and reported higher resonance frequencies with back support. Jalil and Griffin (2007b) showed that back support height hardly affected the resonance frequency of the back support in the fore-aft direction but did not report human body responses.
Human sitting posture, in combination with the configuration of the car seat, can affect postural stability, where the seat may promote postures that enhance trunk stability and comfort. Bhiwapurkar et al. (2016) and Song et al. (2017) studied effects of posture sitting without back support. Bhiwapurkar et al. (2016) showed that forward-leaning sitting postures cause an extra peak in STHT in comparison with erect sitting postures. Mansfield (2006) studied the apparent mass in “relaxed” and “tense” sitting postures and report a stronger non-linearity in relaxed postures. Adam et al. (2020) showed significant effects of posture and backrest usage on vertical transmission in a suspended rigid seat but did not report body motion and perceived comfort. However, we are not aware of studies on the effect of erect versus slouched sitting postures on 3D body kinematics, underlying postural control strategies and perceived comfort in car seats.
For a better understanding of biomechanical responses to vibration, relevant body segment responses in the mechanical chain between head and seat (pelvis and trunk) need to be considered. The pelvis response is essential for cushion design, and the trunk response for back support design. Most studies have focused only on head responses, i.e STHT in either vertical (Boileau and Rakheja, 1998; Fairley and Griffin, 1989; Toward and Griffin, 2011), fore-aft (Nawayseh and Griffin, 2005; Nawayseh et al., 2020) or lateral perturbations (Mandapuram et al., 2012; Bhiwapurkar et al., 2016). Many studies investigated seat-to-head transmissibility on rigid seats, which reduces complexity. However, rigid seats are inherently uncomfortable (Li and Huang, 2020) and thereby less suited to study effects of posture and support on perceived comfort. Finally, most studies only report 1D results such as the head vertical response to seat vertical motion. Hence, these studies neglect secondary motion reactions in other translational directions, and ignore body segment rotations which will also affect perceived comfort (Paddan and Griffin, 1998). Several studies report the apparent mass at seat and back support but do not study body and head motion (Mansfield et al., 2006; Wu and Qiu, 2020, 2021).
In the current study, we investigate how sitting posture and seat back height affect the perceived motion comfort and the transmissibility of motion between the car seat and the human body. We jointly analyze pelvis, trunk, and head 3D translation and rotation in responses to fore-aft, lateral and vertical seat motion. In order to achieve realistic seat interaction and comfort levels, we use a commercial car seat pan and a simple but compliant seat back support. We hypothesize that postural stabilization and comfort will depend on back support height. In studies with unsupported back applying fore-aft platform motion we found that participants could effectively minimize head rotations in space (van Drunen et al., 2016) while with rigid full back support and harness belt substantial head rotations emerged (Forbes et al., 2013). We hypothesize that a full back support constrains lumbar and thoracic spine motion and prevents a coordinated full spine control strategy. Hence we expect amplified head rotation with full back support. Conversely we expect a low backrest to be beneficial for head stabilization, as it promotes the back to actively stabilize the trunk and head.
We study effects of back support height and posture including slouched, preferred, and erect postures, as well as a head-down posture representing usage of digital devices. This head-down posture might become very common in automated vehicles as they allow occupants to work on a tablet, laptop, or smartphone without being a hazard to other road users. Furthermore, we vary motion amplitude to quantify the non-linearity of postural responses (Mansfield et al., 2006). For future modeling of postural stabilization, we evaluate the influence of vision on postural control where we expect small but significant effects of vision on trunk (van Drunen et al., 2016) and head (Forbes et al., 2013) stabilization.
To achieve these scientific objectives we developed an experimental methodology to evaluate 3D vibration transmission from compliant seats to the human body. We designed wide-band motion stimuli and applied these in fore-aft, lateral and vertical direction and evaluated the translational and rotational body response in pelvis, trunk and head, and used analyses of variance to assess significance of the effects of posture and seat back height across seat motion directions.
2 Methods
Eighteen healthy adults (9 male, 9 female) participated in this study. Participants were balanced on age group (30-39, 40-49, and 50-60 years) and sex (for participant descriptives see Table A.1 in Appendix A). Inclusion criteria were that participants considered themselves healthy. Prior to any experimentation, participants were informed on the procedures and goals of the experiment by an information letter, and once again just before the start of the experiment. Participants provided written informed consent. The study protocol was approved by the Human Research Ethics Committee of the Delft University of Technology (HREC 962). During the experiment, participants were closely monitored on their well-being and we evaluated their misery after each trial (a long break was offered when MISC>4). All participants were reimbursed with a € 20 gift card.
Participants were instructed to sit in a car mock-up, mounted on top of a six-degrees-of-freedom motion platform (Khusro et al., 2020). The mock-up consists of the cockpit of a Toyota Yaris and participants were seated in the modified passenger’s seat (see Figure 1).
2.1 Input vibrations
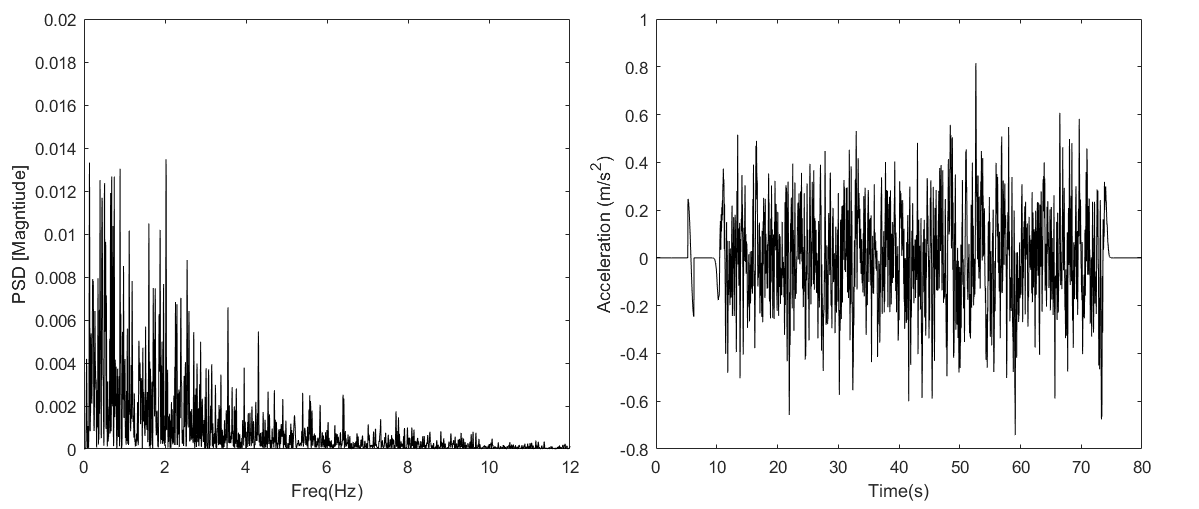
A wide-band noise signal was designed as input for the motion platform (see Figure 2). Similar signals were used to study the human response to bicycle vibrations (Dialynas et al., 2019). We adapted the signal to be more comfortable and to better approximate car driving while maintaining a good coherence between the applied platform motion and the measured body response at the pelvis, trunk, and head and fitting within the working envelope of the motion platform. In short, the signals comprised random noise with a frequency bandwidth of 0.1 - 12.0 Hz and 0.3 m/s2 rms power. This range was selected to include low/mid frequencies with postural stabilization using visual, vestibular, and muscle feedback and high frequencies dominated by the passive body and seat properties including resonance frequencies around 4-6 Hz in vertical loading. This range also includes low frequencies associated with motion sickness causation but duration and amplitude of the 12 trials were limited aiming to prevent actual motion sickness to develop as this would invalidate following trials. The resulting vertical motion resembles driving at somewhat uncomfortable roads. Horizontal vehicle motions will have less power at mid and higher frequencies but we chose to apply the same motion as in vertical as a lower amplitude would preclude the attainment of coherent results using frequency domain analysis.
For each seat back and posture condition, one trial was performed. Each trial lasted 200 s and sequentially applied motions in three different axis directions (i.e., fore-aft, lateral, vertical) with 60-second duration, 3-second fade-in, and 3-second fade-out to avoid abrupt motions.
2.2 Postures & back support height
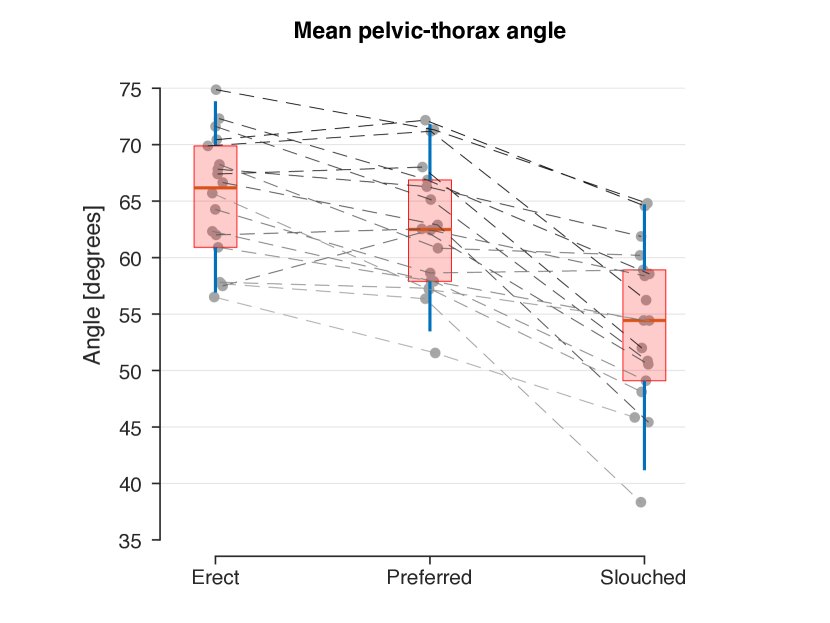
Participants were subjected to the vibrations in three main posture conditions: sitting erect, slouched, and sitting in the subject’s preferred posture. The erect posture aimed to achieve an S-shaped back curvature. We instructed participants to sit straight such that their belly was pressed out while their back made a hollow arch, with their buttocks at the most posterior position of the seat. To obtain a slouched posture, participants were instructed to move the pelvis forward while keeping their chest straight, which flexes the lumbar spine towards a C shape curvature. Prior to the first slouched condition, we instructed the participants to sit in the middle of the seat with their belly pressed inward, trying to bend the lower back as much as possible, while keeping the upper chest straight. We verified the posture by evaluating the pitch angle of the thorax with respect to the pelvis as measured in real-time using the motion capture system (see below), and if needed we gave feedback to the participants. Post hoc analysis of the angle between thorax and pelvis relative to the horizontal showed that the angle between the horizontal and the line connecting the pelvis Centre of Mass (CoM) with the thorax CoM was largest for the erect posture (mean angle = 65.1°), followed by the preferred posture (mean angle = 62.4°). The angle was sharpest when participants were slouching (mean angle = 53.6°, see Figure A.1 in Appendix A for more detail on postural differences between conditions).
Besides the sitting posture, the back support height was varied (see Fig. 1 for an overview of the different conditions). The seat was equipped with a lower and an upper back support pad (both 11.6 cm height x 42.0 cm width x 6 cm thick cushion pads mounted on flat plates). The lower back support pad was fixed to the chair, while the upper back support pad could be taken off and could be shifted vertically, along two beams that were 20 degrees backward rotated (i.e., backrest made a 110-degree angle with the horizontal). The pad could be re-oriented in pitch to match the curvature of the subject’s back. Participants were subjected to three back support conditions: 1) low back support (lower pad only; the top of the support pad was situated at the height of the posterior superior iliac spine), 2) mid back support (two pads; the upper back support pad was placed on top of the lower support pad, thereby covering the pelvis and lumbar spine), and 3) high support (two pads; also supporting the thorax - the top of the upper support pad was aligned with the apex of the scapula’s angulus inferior, which was identified by palpation). Changing the back support height might induce an undesired change in sitting posture; however, a post hoc analysis on the effect of back support height showed only very subtle changes.
2.3 Measurement protocol
Participants were guided on top of the platform and took place in the experimental seat, mounted in the passenger’s position of the car mock-up. The seat belt was not fastened as modern belts exert marginal forces in normal driving and the belt might interfere with instrumentation and cables. Participants looked straight ahead through the windshield of the car mock-up (Figure 1).
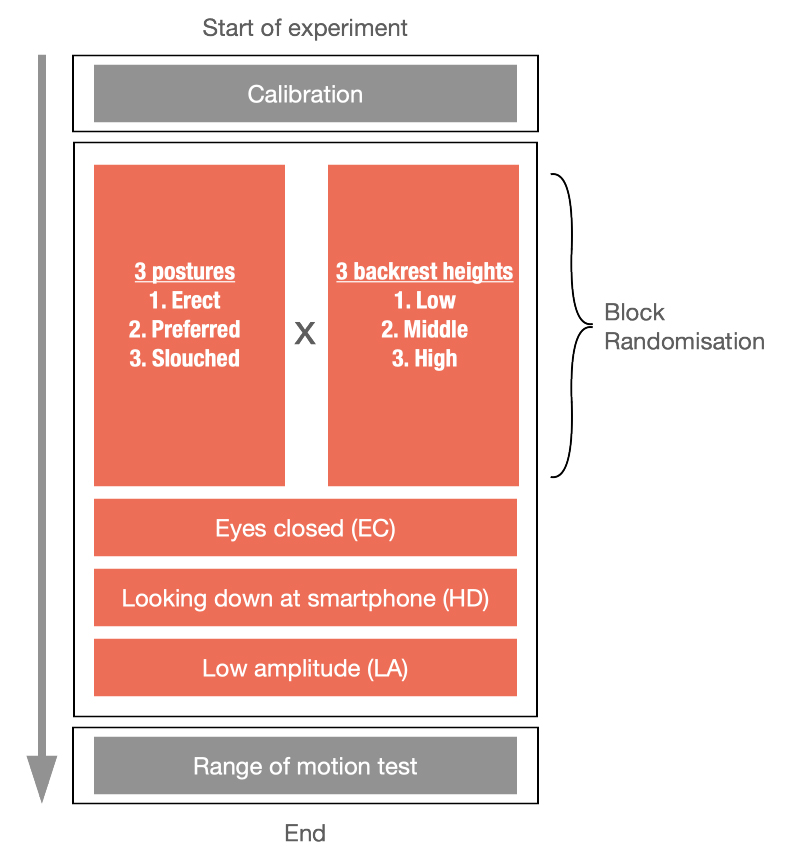
Participants were subjected to 12 conditions shown in Figure 3. Participants were allowed to take breaks between conditions to prevent drowsiness and discomfort due to prolonged sitting. We tested 3 postures for 3 seat back configurations as described above. In three additional trials, subjects sat in their preferred posture, with middle-back support. They were subjected to the same platform vibrations, but now with respectively 1) their eyes closed (EC), 2) looking down at a turned-off smartphone (i.e., head down, HD), or 3) looking forward with a lower input vibration amplitude (0.25 times the original amplitude, LA). The order of conditions was randomized across participants. However, adjusting the back support height was time-consuming. Therefore the randomisation was performed at two levels, firstly randomizing the order of the three back support heights, and secondly randomizing the other variations within each back support block.
Finally the active ranges of motion of the entire spine (flexion/extension and lateral flexion) were recorded while standing using a protocol from Frey et al. (2020) to support future modelling (see Appendix A).
2.4 Measurement devices
2.4.1 Perceived discomfort & sway
Perceived discomfort and perceived sway were assessed using a 9-item questionnaire. This consisted of three main parts assessing 1) subjective Misery using the misery scale (MISC) (Reason and Brand, 1975), 2) perceived discomfort (van Veen et al., 2015), and 3) perceived sway (modified from van Veen et al. (2015)). Besides the overall discomfort of the chair and backrest, seven questions concerned the perceived discomfort and sway specific for the studied body parts (trunk, lower and upper back, and neck). Participants filled the questionnaire for each individual excitation direction. The full questionnaire can be viewed on the experimental data repository. Prior to any experimentation, participants were given some time to study the items of the questionnaire. After each trial, the experimenter read the questionnaire’s items out loud, and participants verbally responded by rating their misery on a 0-9 scale, and their perceived discomfort and perceived sway on a 1-10 scale (i.e., a high score corresponded to high discomfort or sway and vice versa). Perceived sway was mentioned by the first participants and formally reported and analyzed starting from the fifth participant (N=14).
2.4.2 Kinematics
The platform acceleration was recorded by three triaxial acceleration sensors mounted at the upper part of the motion platform, and equally distributed on a circle with a radius of 0.5 meters, with a sampling frequency of 100 Hz. To capture the 3D whole-body kinematics, participants wore a motion capture suit with seventeen triaxial inertial measurement units at 240 Hz (MTW Awinda, Xsens Technologies, Enschede, The Netherlands). Before experimentation, for each participant, calibration postures were recorded and circumferences of body segments were measured using measurement tape. Through integration, the Xsens software reconstructs orientations of all body segments and the quasi-global positioning of their joints (Schepers et al., 2018). On the basis of the reconstructed joint positions, the center of mass (CoM) of each body segment was estimated (Zatsiorsky, 2002). Segment accelerations were projected on these estimated CoM positions. In this paper, we use the reconstructed 3D motion of the pelvis, trunk, and head center of gravity, presented in world coordinates (X=forward, Y=left, Z=up).
2.4.3 Seat pressure & electromyography
Seat pressure was recorded using the XSENSOR X3 medical seat system (XSensor Technology Corporation, Calgary, AB, Canada). Pressure was recorded at the buttocks and thighs, with a grid of 48 48 sensors at a 1.27 cm distance between load cells and used to estimate the center of pressure and the resultant force (see Appendix B).
Muscular activity (EMG) recorded in 4 participants showed a disappointing coherence to the applied motion stimuli in particular for lumbar muscles, and was therefore not recorded in other subjects (Appendix C).
2.5 Data analysis
Data was synchronized using recorded timestamps for kinematics, seat pressure and EMG while platform acceleration was synchronized using a pulse applied at the onset of platform motion (Figure 2).
2.5.1 Perceived comfort & sway
To quantify the overall discomfort, and the perceived trunk and head sway within conditions, the ratings of the overall seat-discomfort and perceived-sway items were averaged over the 3 excitation directions.
2.5.2 Kinematics
Platform accelerations were up-sampled to 240 samples per second to match the body kinematic data. To evaluate the transmission from platform motion to body segment motion, transfer functions were calculated, for each condition for each individual participant. The Hanning function was used for windowing the signal in 15 segments (i.e., a window size of 24 seconds) with 50 percent overlap. Gain, phase, and coherence were calculated for the linear (fore-aft, lateral, and vertical) and rotational accelerations (roll, pitch, and yaw) of body segments (pelvis, trunk, and head) in response to the measured platform accelerations. To quantify the effect of seat back support and sitting posture, peaks and related frequencies of response gains were analyzed. Peaks were analyzed for the main translational responses (fore-aft to fore-aft, lateral to lateral, and vertical to vertical), and main rotational responses (pitch to fore-aft, roll for lateral, and pitch for vertical). The peak search was constrained to frequencies where consistent peaks were observed across participants. Regarding the fore-aft responses to fore-aft perturbations, the peak search for pelvis and head was constrained between 2 and 7 Hz. For lateral head responses to lateral perturbations, the peak search was constrained to frequencies below 2.2 Hz. The peak search for rotational responses was constrained between 1 and 6.5 Hz. In addition, low-frequency gains were derived for both translational and rotational responses using the average gains between 1 and 2 Hz.
2.6 Statistical analysis
A repeated measures ANOVA was used to statistically test the effects of seat backrest height, and sitting posture. Four factors of direction, body segment, posture, and backrest height have been included in the statistical model. A repeated measures ANOVA was also used to statistically test if there are any significant differences between extra trials (eyes closed, head down, and low amplitude) and the corresponding reference trial (middle support and preferred posture). Repeated measures ANOVAs were performed separately for peak translational and rotational gains and their related frequencies, and for low-frequency gains between 1-2 Hz. In case of significant interactions, post hoc comparison tests (i.e., t-tests) were performed with Bonferroni corrections. The above statistical analyses were performed after log transformation to enhance normality. For these analyses, Matlab’s statistical functions were used.
3 Results
Seventeen participants finished the complete experiment reporting acceptable comfort levels (median MISC = 2, interquartile range = 2). Participant 18 (female, 40-49 years) dropped out as the vibrations led to severe motion sickness (MISC = 8) after 5 out of 12 trials. Participant 6 showed deviant kinematics and was excluded from all kinematic analyses.
3.1 Perceived comfort & sway
Perceived overall discomfort was modulated by both posture and back support height (posture: F(2) = 10.21, p <0.01, support : F(2) = 14.61, p <0.001, see Figure 4 for a graphical overview). A low support was perceived as more discomforting than mid (Cohen’s \textdelta = 1.19, t = 4.91, pbonf <0.001), and high (Cohen’s \textdelta = 1.07, t = 4.42, pbonf <0.001) back support heights. Similarly, a slouched posture was rated as more discomforting than the preferred (Cohen’s \textdelta = 1.06, t = 4.37, pbonf <0.001), and erect postures (Cohen’s \textdelta = 0.77, t = 3.19, pbonf = 0.01). The interaction effect of postureback support height did not explain the data (F(4) = 0.80, p = 0.53).
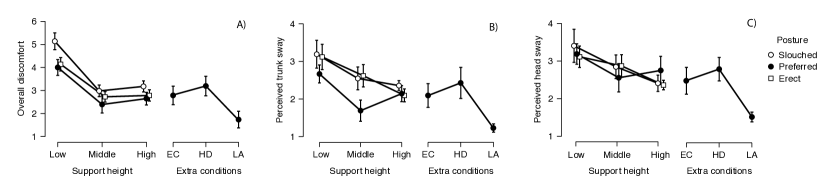
eyes closed (EC), head down (HD), and low amplitude (LA). In the extra conditions participants sat in their preferred posture with middle back support height.
The perceived head sway was not modulated by either posture or back support height (posture: F(2) = 1.77, p = 0.190, backrest: F(2) = 0.14, p = 0.867). A main effect of back support height (F(2) =3.78, p = 0.036) and posture (F(2)= 3.68, p = 0.039) was present on perceived trunk sway. Although not significant, the largest effect sizes in the post hoc comparison were found between low and high back support (Cohen’s \textdelta = 0.67, t = 2.51, pbonf = 0.056), and between slouched and preferred (Cohen’s \textdelta = 0.68, t = 2.53, pbonf = 0.053).
Regarding the additional conditions (eyes closed, head down, low amplitude), the discomfort and perceived sway were affected by condition (overall discomfort: F(3) = 4.16, p = 0.012, perceived trunk sway: F(3) = 6.69, p = 0.008 (corrected for sphericity by Greenhouse-Geisser correction), perceived head sway: F(3) = 6.01, p = 0.002). Post hoc tests showed that vibrating at a lower amplitude decreased the perceived head sway compared to the reference condition (Cohen’s \textdelta = 0.94, t = 3.39, pbonf = 0.010 but did not significantly affect perceived discomfort (Cohen’s \textdelta = 0.50, t = 1.87, pbonf = 0.418). The head down and eyes closed conditions did not differ significantly from the reference condition for either overall discomfort or perceived trunk or head sway.
3.2 Kinematics
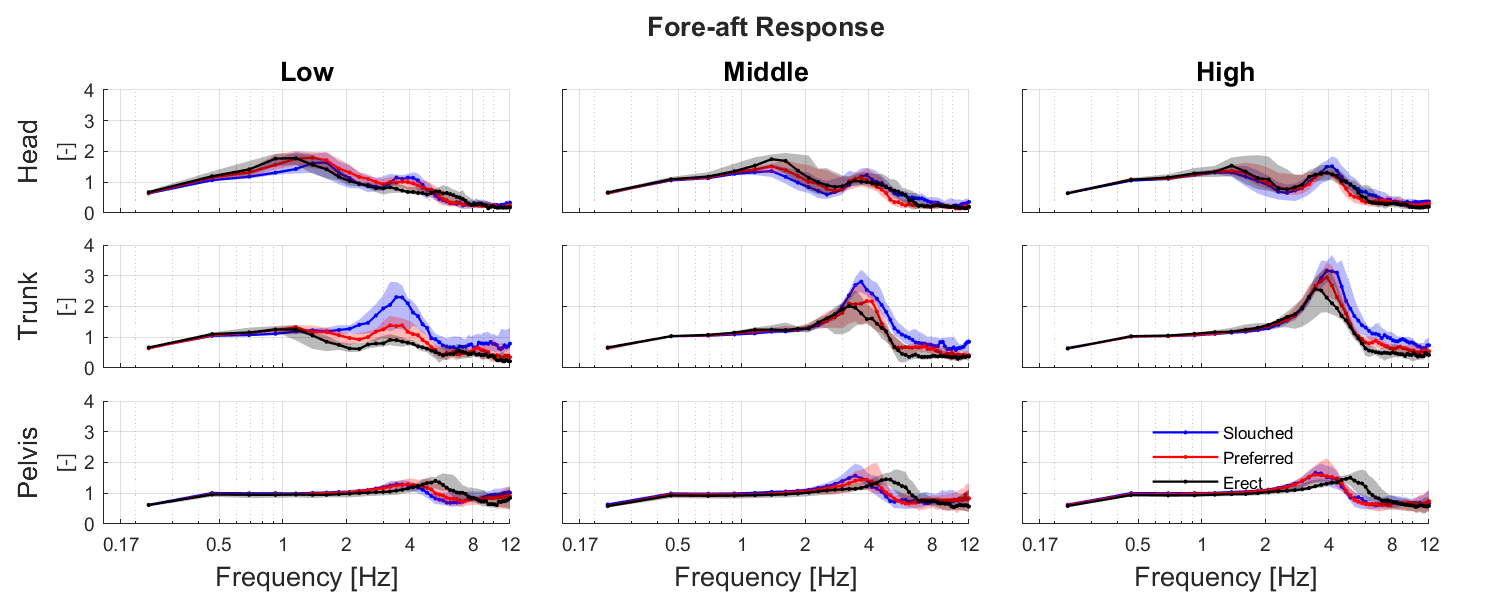
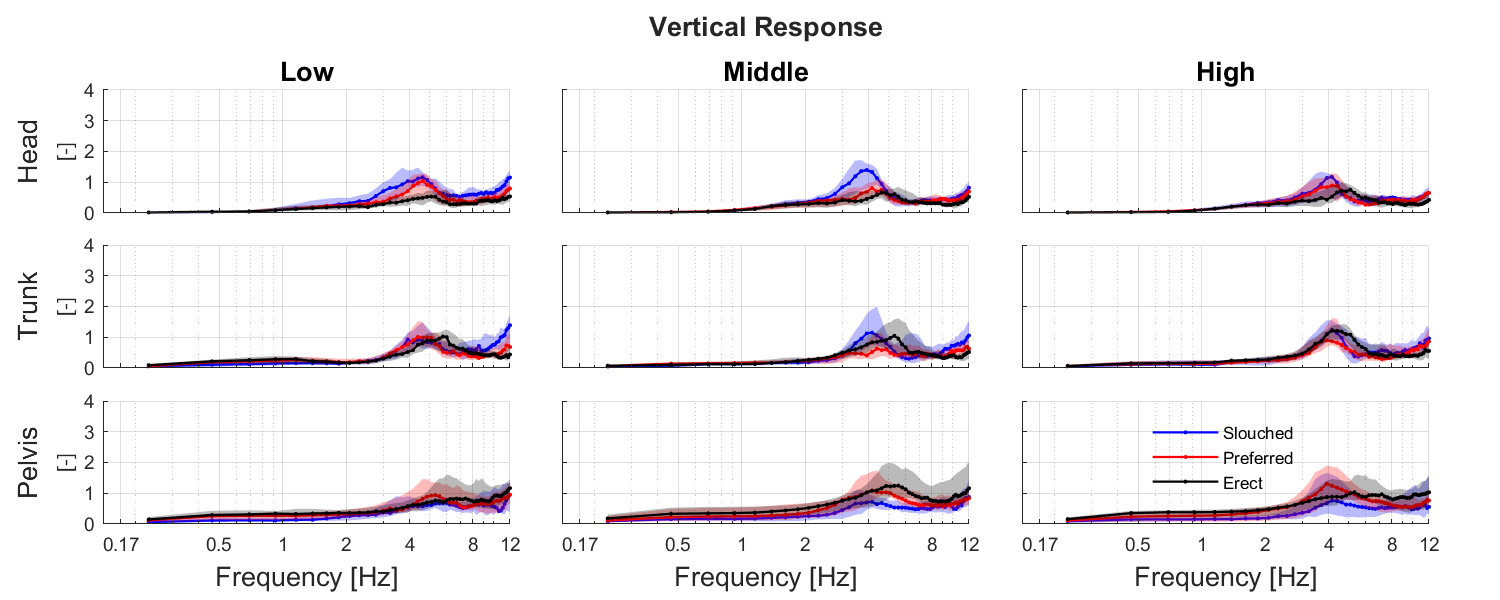
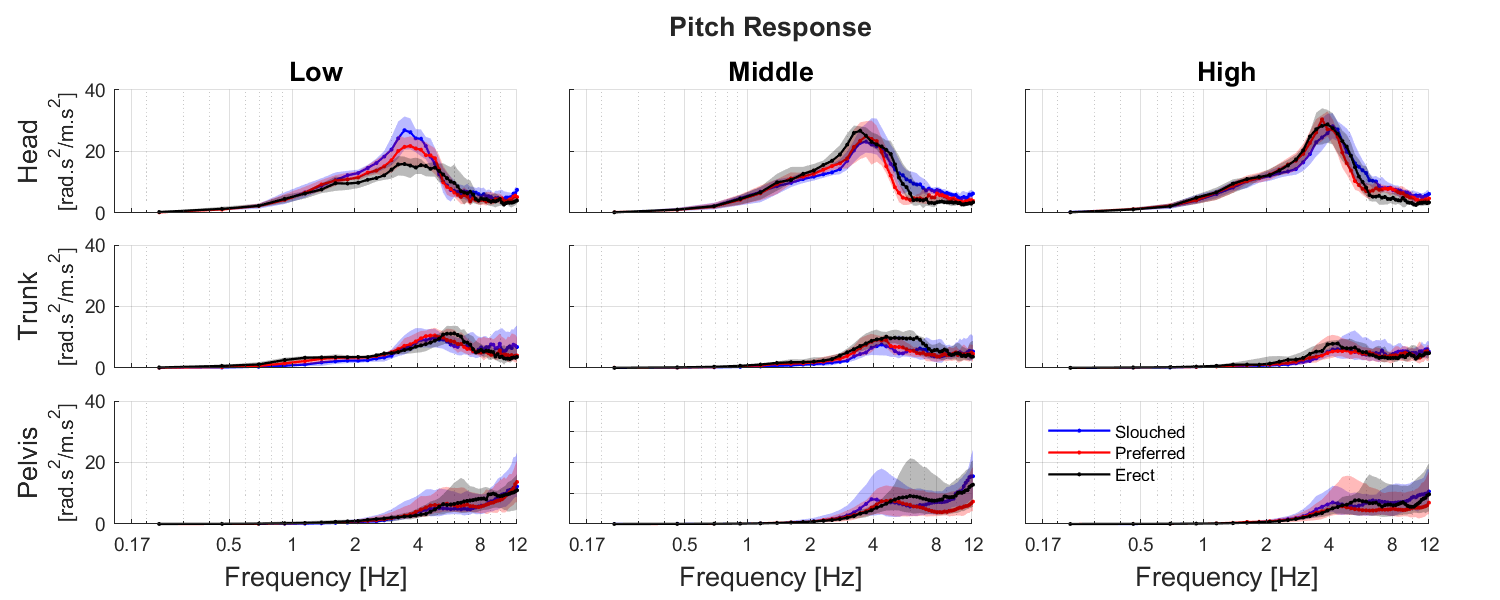
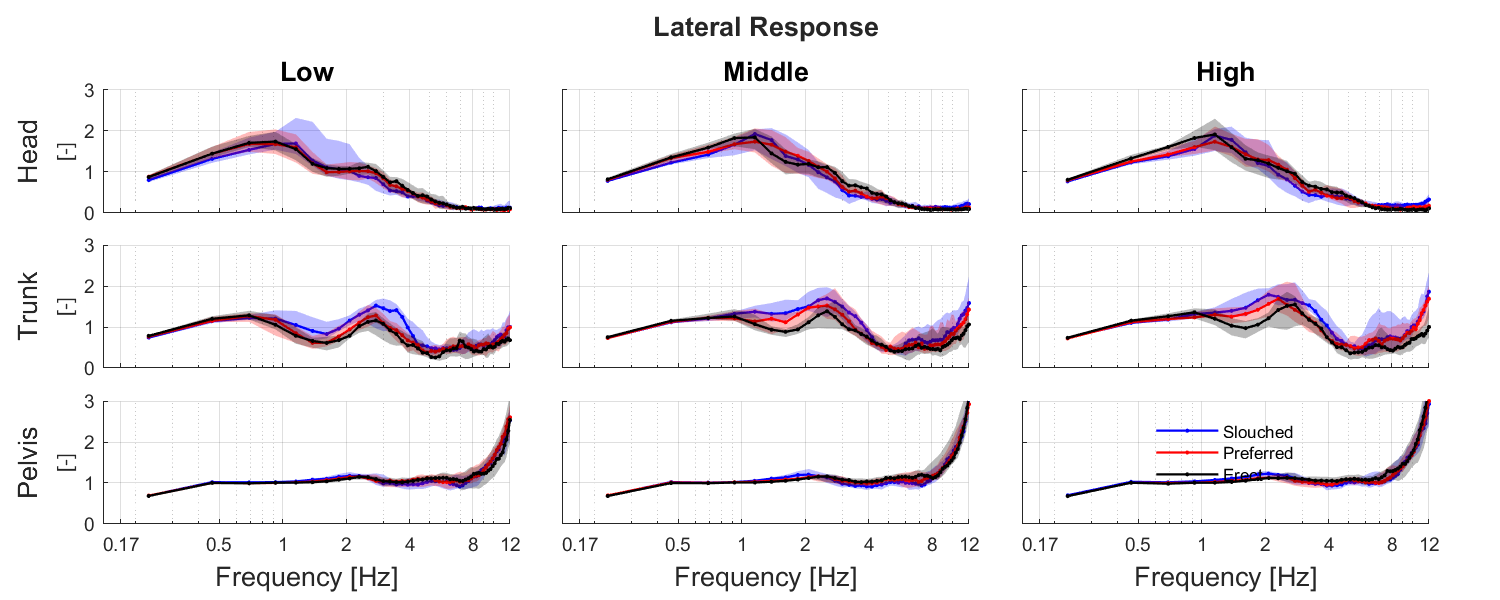
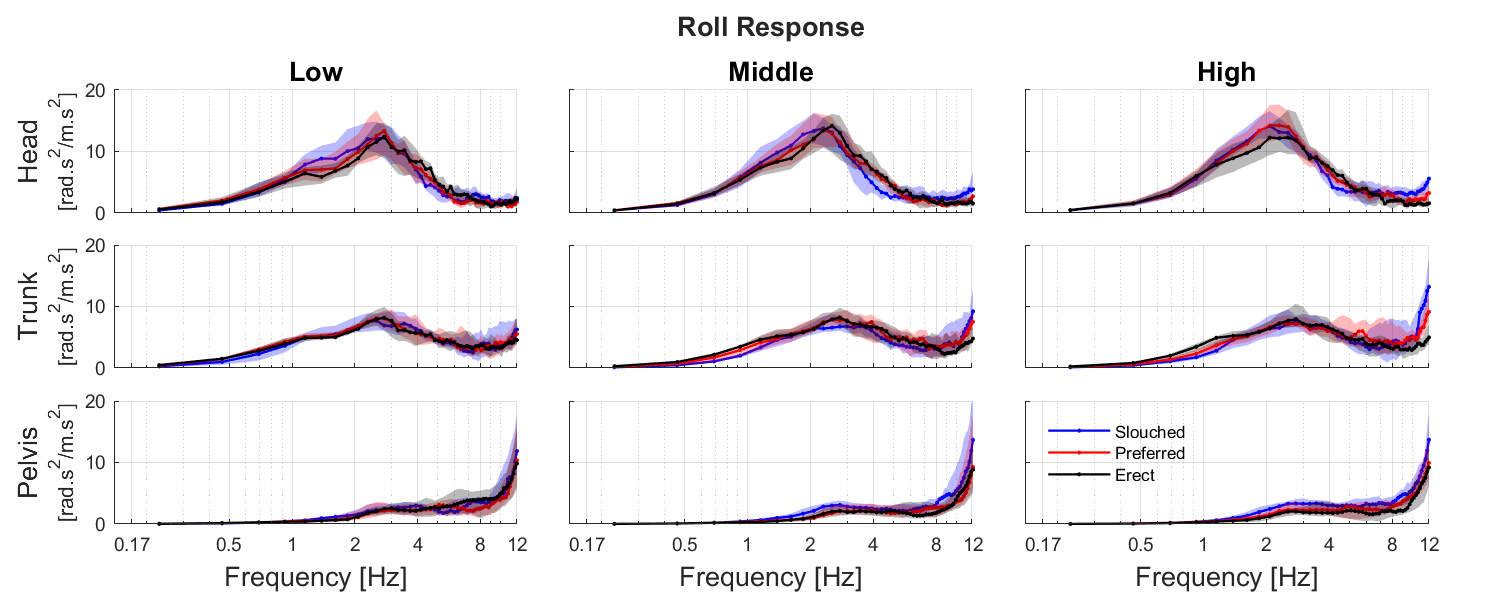
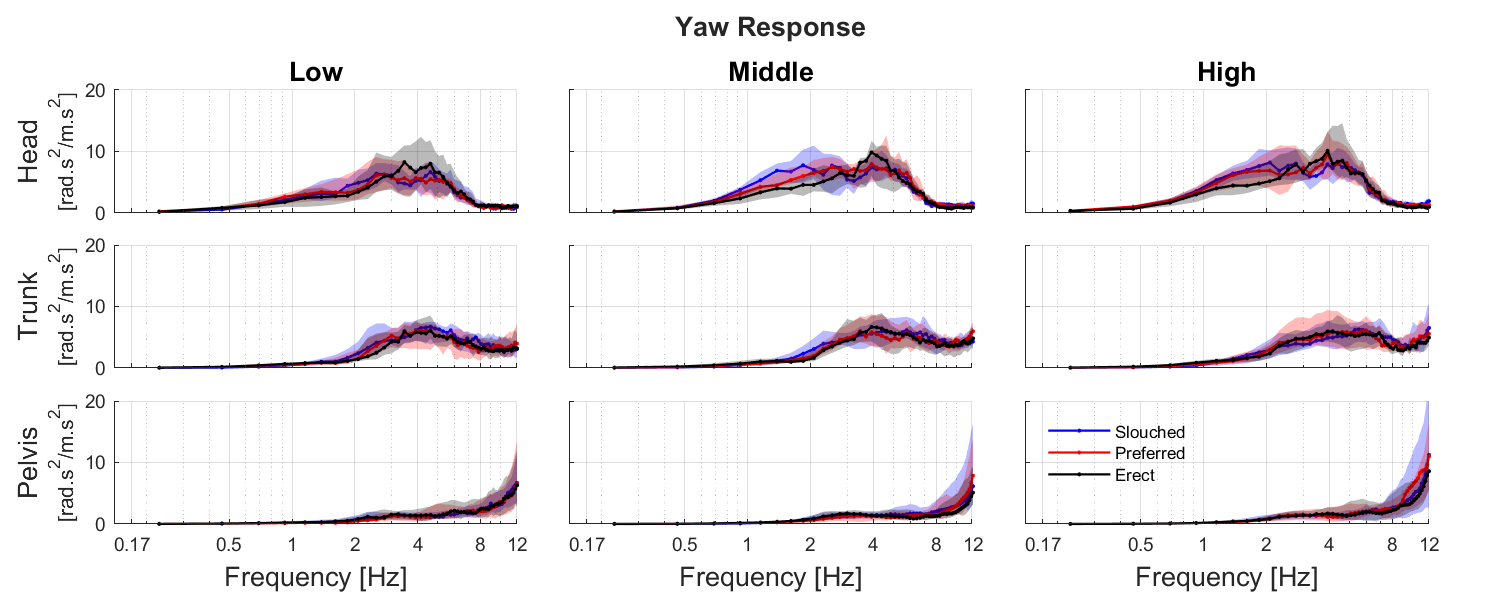
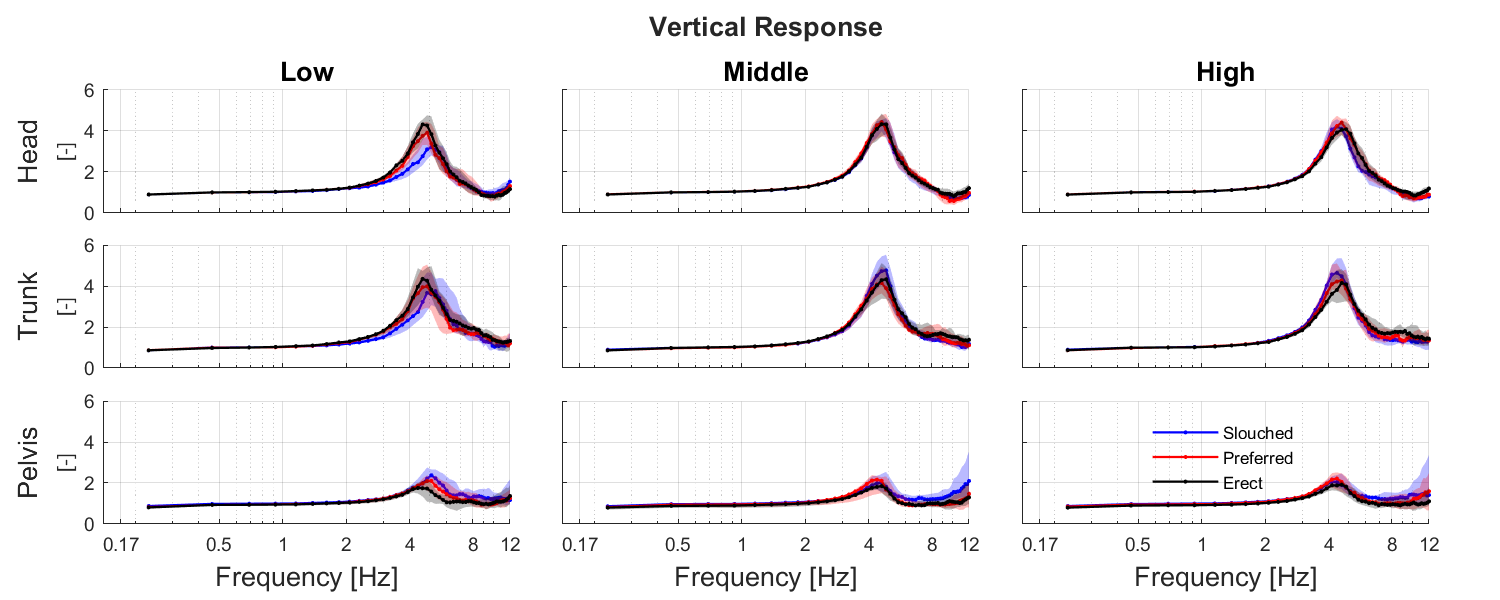
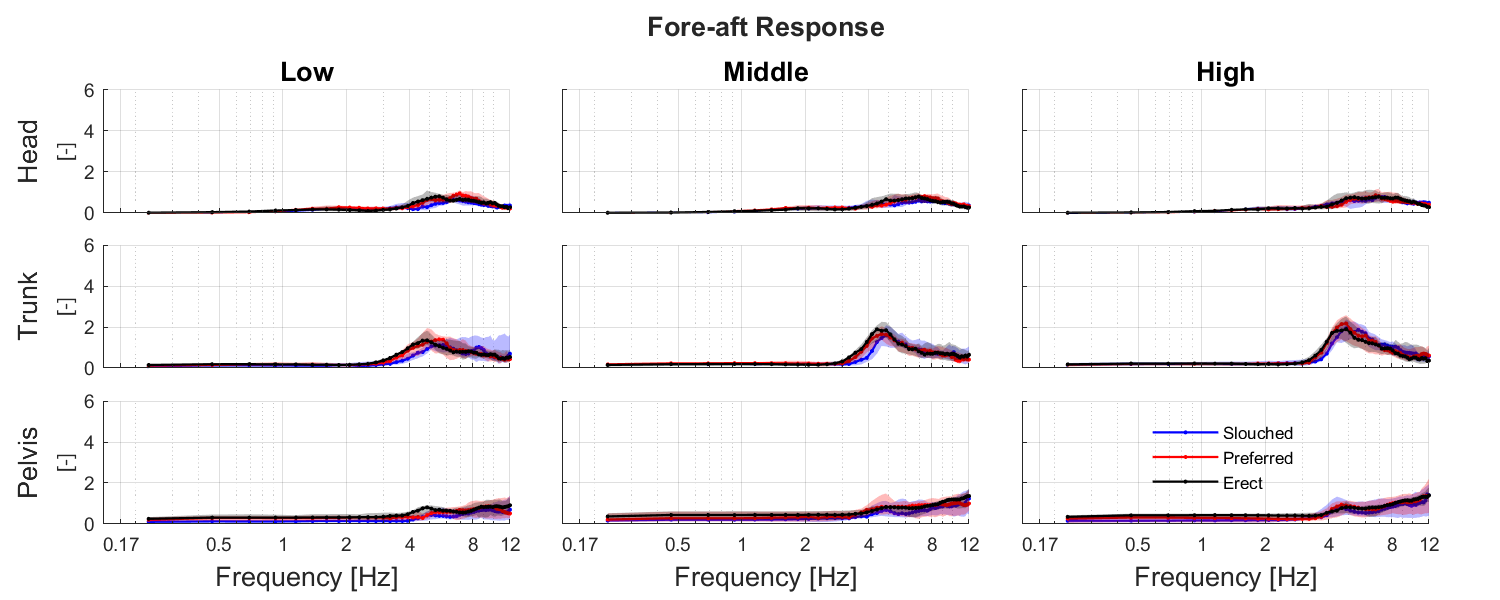
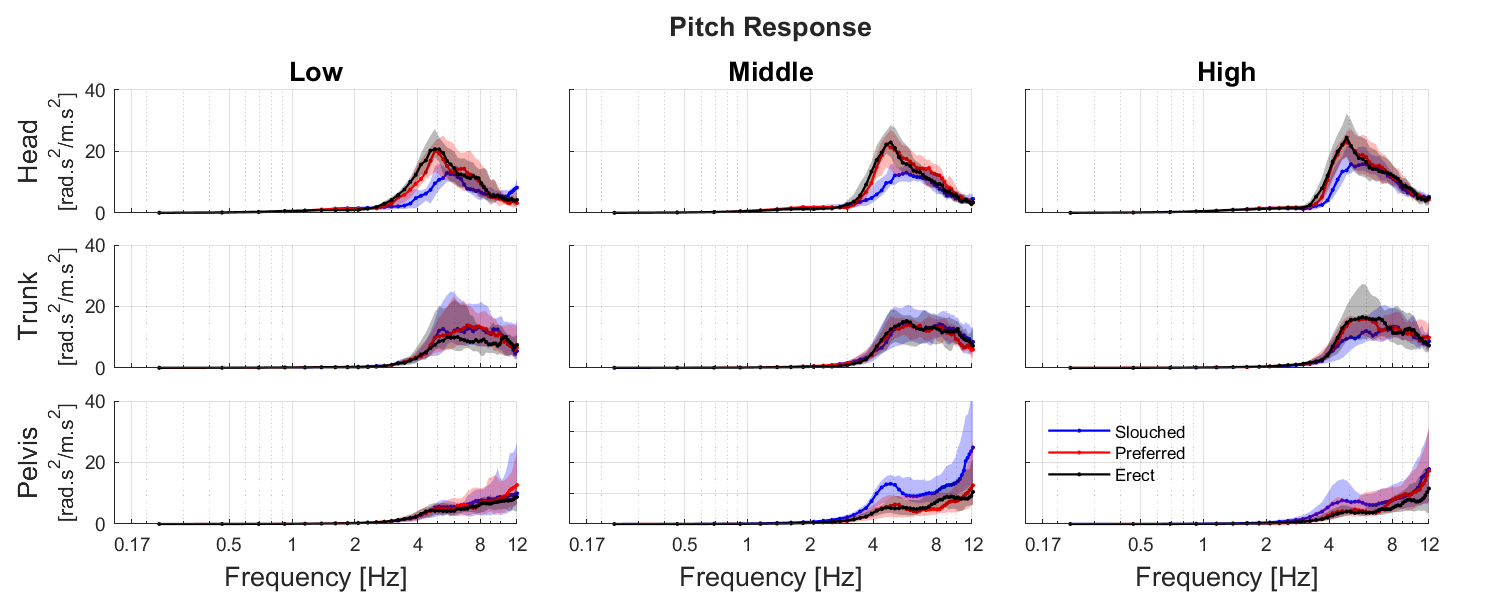
Figures 5, 6 and 7 show the effects of backrest height and sitting posture on the head, trunk, and pelvis responses during fore-aft, lateral, and vertical perturbations. These figures show gains for the 3 most relevant responses for each platform motion direction. In all cases, the response in the applied motion direction is shown in the upper section, while the middle and lower sections show interaction terms. For the fore-aft platform motion, Figure 5 shows the fore-aft response in the upper panel, the vertical response in the middle panel, and the pitch response in the lower panel. Likewise for the lateral platform motion, Figure 6 shows lateral, roll, and yaw responses, and for vertical platform motion Figure 7 shows vertical, fore-aft, and pitch responses. Appendix D shows gains, phases, and coherences for all 6 translational and rotational degrees of freedom for the pelvis, trunk, and head for all individual participants. The main effects are largely consistent between subjects with coherence generally exceeding 0.5 from 0.34-12 Hz. At the lowest frequency analyzed (0.17 Hz) coherence is low and hence these results are not very informative, presumably due to voluntary motion, non-linearity and limited perturbation power. From 0.34 Hz to about 2 Hz we see a gain close to 1 for the fore-aft direction with some amplification for the head. Gains are close to 1 from 0.34-3 Hz for the vertical direction. For the lateral direction, the response is not as straightforward as for the other directions and shows amplification around 1 Hz for the head and trunk with an additional peak around 3 Hz for the trunk. For all motion directions the phase for main responses at low frequency is close to zero indicating a limited timing difference between seat and body motion. Hence, at low frequencies the pelvis, trunk, and head translational motions closely follow the seat motion. At higher frequencies we see oscillations evidenced by gain peaks which are prominent in particular for vertical.
The main interactions shown in Figures 5, 6 and 7 are consistent between participants and show good coherence. Other interactions can be found in Appendix D and show partially inconsistent responses with a low coherence and variable phase which was largely expected. These interactions include lateral and roll responses to fore-aft and vertical seat motion which should be zero if the human body would be symmetric and would be perfectly aligned with the seat. Hence these non-zero interactions presumably represent postural and/or biomechanical asymmetries.
3.3 Back support height and sitting posture
| Fore-aft Perturbation - Fore-aft Response | |||||||||||||||
| Head Gain | 2.02 ± 0.4 | 1.98 ± 0.4 | 1.80 ± 0.4 | 1.88 ± 0.4 | 1.75 ± 0.3 | 1.71 ± 0.3 | 1.88 ± 0.4 | 1.74 ± 0.5 | 1.79 ± 0.3 | 3.15 ± 1.2 | 2.50 ± 0.6 | 3.52 ± 1.5 222Peaks not found for 2 subjects | |||
| Freq. | 1.12 ± 0.2 | 1.32 ± 0.3 | 1.34 ± 0.3 | 1.59 ± 0.8 | 1.98 ± 1.1 | 2.14 ± 1.3 | 2.34 ± 1.2 | 2.50 ± 1.2 | 3.07 ± 1.5 | 3.78 ± 0.5 | 2.44 ± 1.0 | 4.42 ± 0.5 222Peaks not found for 2 subjects | |||
| Trunk Gain | 1.38 ± 0.2 | 1.40 ± 0.2 111Peaks not found for 1 subjects | 1.31 ± 0.2 | 2.14 ± 0.5 | 2.48 ± 0.8 | 2.97 ± 0.6 | 2.70 ± 0.9 | 3.11 ± 0.7 | 3.45 ± 0.5 | 2.46 ± 0.7 | 2.17 ± 0.6 | 3.04 ± 0.9 222Peaks not found for 2 subjects | |||
| Freq. | 0.97 ± 0.3 | 1.17 ± 0.3 111Peaks not found for 1 subjects | 1.26 ± 0.3 | 3.10 ± 0.9 | 3.44 ± 0.7 | 3.90 ± 0.3 | 3.33 ± 0.9 | 3.90 ± 0.3 | 4.09 ± 0.4 | 3.57 ± 0.5 | 3.30 ± 1.0 | 4.15 ± 0.5 222Peaks not found for 2 subjects | |||
| Pelvis Gain | 1.52 ± 0.4 | 1.47 ± 0.4 | 1.41 ± 0.3 111Peaks not found for 1 subjects | 1.64 ± 0.4 | 1.61 ± 0.5 | 1.78 ± 0.5 | 1.69 ± 0.4 | 1.79 ± 0.4 | 1.86 ± 0.5 | 1.76 ± 0.5 111Peaks not found for 1 subjects | 1.79 ± 0.4 111Peaks not found for 1 subjects | 1.81 ± 0.4 222Peaks not found for 2 subjects | |||
| Freq. | 5.30 ± 1.2 | 4.35 ± 1.0 | 3.59 ± 0.7 111Peaks not found for 1 subjects | 5.27 ± 0.9 | 4.39 ± 1.6 | 4.09 ± 1.2 | 4.94 ± 0.8 | 3.97 ± 0.5 | 3.87 ± 0.4 | 3.84 ± 0.3 111Peaks not found for 1 subjects | 3.92 ± 0.5 111Peaks not found for 1 subjects | 4.39 ± 0.3 222Peaks not found for 2 subjects | |||
| Fore-aft Perturbation - Pitch Response | |||||||||||||||
| Head Gain | 17.45 ± 3.5 | 22.13 ± 6.4 | 25.67 ± 9.7 | 25.21 ± 6.9 | 25.40 ± 10.3 | 27.10 ± 6.6 | 28.61 ± 7.4 | 29.88 ± 6.6 | 30.39 ± 5.6 | 25.35 ± 10.1 | 24.41 ± 4.9 | 34.27 ± 10.4 222Peaks not found for 2 subjects | |||
| Freq. | 4.06 ± 0.8 | 4.00 ± 0.6 | 4.33 ± 1.3 | 3.93 ± 0.7 | 4.14 ± 0.9 | 3.94 ± 0.4 | 3.81 ± 0.4 | 3.93 ± 0.3 | 4.30 ± 0.5 | 4.17 ± 1.1 | 3.81 ± 0.3 | 4.32 ± 0.5 222Peaks not found for 2 subjects | |||
| Trunk Gain | 13.01 ± 3.9 | 13.20 ± 6.2 | 12.62 ± 5.9 | 12.31 ± 2.9 | 11.81 ± 6.1 | 10.92 ± 8.1 | 10.10 ± 4.2 | 8.99 ± 5.4 | 9.97 ± 8.4 | 10.47 ± 4.2 | 9.79 ± 4.1 | 13.31 ± 7.1 222Peaks not found for 2 subjects | |||
| Freq. | 5.91 ± 0.7 | 5.40 ± 0.9 | 4.84 ± 1.0 | 5.37 ± 0.9 | 4.67 ± 1.0 | 5.06 ± 1.2 | 4.82 ± 0.8 | 5.24 ± 1.3 | 5.39 ± 1.3 | 4.60 ± 0.9 | 4.82 ± 0.9 | 5.10 ± 1.1 222Peaks not found for 2 subjects | |||
| Pelvis Gain | 9.62 ± 6.2 111Peaks not found for 1 subjects | 9.64 ± 6.1 | 8.32 ± 6.0 | 13.19 ± 8.9 | 9.27 ± 5.9 | 11.71 ± 8.9 | 10.86 ± 8.4 | 10.59 ± 9.3 | 10.91 ± 8.3 | 8.68 ± 6.3 111Peaks not found for 1 subjects | 9.15 ± 8.1 | 10.64 ± 8.3 222Peaks not found for 2 subjects | |||
| Freq. | 6.21 ± 1.0 111Peaks not found for 1 subjects | 5.76 ± 0.9 | 5.37 ± 1.1 | 5.94 ± 1.0 | 5.19 ± 0.9 | 4.94 ± 1.2 | 5.86 ± 1.2 | 5.00 ± 1.1 | 5.39 ± 1.5 | 5.17 ± 1.0 111Peaks not found for 1 subjects | 5.10 ± 1.2 | 5.75 ± 1.1 222Peaks not found for 2 subjects | |||
| Lateral Perturbation - Lateral Response | |||||||||||||||
| Head Gain | 1.85 ± 0.4 | 1.86 ± 0.3 | 2.04 ± 0.5 | 1.97 ± 0.4 | 1.98 ± 0.4 111Peaks not found for 1 subjects | 2.06 ± 0.6 | 1.99 ± 0.4 | 1.90 ± 0.4 111Peaks not found for 1 subjects | 2.01 ± 0.5 | 1.83 ± 0.4 | 1.94 ± 0.4 | 2.04 ± 0.7 222Peaks not found for 2 subjects | |||
| Freq. | 0.82 ± 0.2 | 0.80 ± 0.2 | 1.03 ± 0.3 | 1.01 ± 0.2 | 1.02 ± 0.3 111Peaks not found for 1 subjects | 1.15 ± 0.2 | 1.07 ± 0.2 | 1.11 ± 0.2 111Peaks not found for 1 subjects | 1.21 ± 0.3 | 1.55 ± 0.8 | 1.32 ± 0.7 | 1.79 ± 0.8 222Peaks not found for 2 subjects | |||
| Trunk Gain | 1.41 ± 0.2 | 1.49 ± 0.2 | 1.74 ± 0.3 | 1.61 ± 0.4 | 1.81 ± 0.3 | 1.97 ± 0.3 | 1.73 ± 0.5 | 1.92 ± 0.4 | 2.06 ± 0.3 | 2.17 ± 0.6 | 2.17 ± 0.5 | 2.87 ± 0.6 222Peaks not found for 2 subjects | |||
| Freq. | 1.29 ± 0.9 | 1.99 ± 1.0 | 2.46 ± 1.1 | 2.04 ± 0.8 | 2.46 ± 0.6 | 2.35 ± 0.6 | 2.08 ± 0.9 | 2.32 ± 0.6 | 2.43 ± 0.5 | 2.69 ± 0.5 | 2.69 ± 0.5 | 2.98 ± 0.4 222Peaks not found for 2 subjects | |||
| Pelvis Gain | 1.16 ± 0.1 | 1.17 ± 0.1 | 1.24 ± 0.2 | 1.17 ± 0.1 | 1.19 ± 0.1 | 1.27 ± 0.1 | 1.18 ± 0.1 | 1.16 ± 0.1 | 1.26 ± 0.1 | 1.18 ± 0.1 | 1.22 ± 0.1 | 1.24 ± 0.1 222Peaks not found for 2 subjects | |||
| Freq. | 2.54 ± 0.6 | 2.31 ± 0.3 | 2.38 ± 0.5 | 2.44 ± 0.4 | 2.44 ± 0.5 | 2.22 ± 0.4 | 2.49 ± 0.4 | 2.29 ± 0.4 | 2.17 ± 0.5 | 2.35 ± 0.3 | 2.37 ± 0.3 | 2.65 ± 0.3 222Peaks not found for 2 subjects | |||
| Lateral Perturbation - Roll Response | |||||||||||||||
| Head Gain | 13.53 ± 4.2 | 13.79 ± 5.0 | 14.64 ± 3.9 | 14.10 ± 3.9 | 14.93 ± 3.5 | 15.20 ± 3.9 | 14.79 ± 5.5 | 16.20 ± 4.8 | 15.40 ± 3.1 | 16.66 ± 4.5 | 14.28 ± 3.5 | 20.58 ± 7.3 222Peaks not found for 2 subjects | |||
| Freq. | 2.83 ± 0.6 | 2.72 ± 0.4 | 2.59 ± 0.5 | 2.60 ± 0.4 | 2.43 ± 0.3 | 2.34 ± 0.4 | 2.54 ± 0.4 | 2.43 ± 0.2 | 2.29 ± 0.4 | 2.56 ± 0.4 | 2.62 ± 0.4 | 2.79 ± 0.3 222Peaks not found for 2 subjects | |||
| Trunk Gain | 8.82 ± 1.5 | 9.02 ± 2.2 | 8.93 ± 2.1 | 9.36 ± 2.0 | 9.35 ± 1.8 | 8.34 ± 1.5 | 9.34 ± 2.3 | 9.17 ± 2.2 | 8.90 ± 2.3 | 9.13 ± 1.8 | 9.85 ± 1.8 | 10.35 ± 2.3 222Peaks not found for 2 subjects | |||
| Freq. | 2.66 ± 0.3 | 2.86 ± 0.4 | 2.93 ± 0.9 | 2.78 ± 0.6 | 3.11 ± 0.8 | 2.77 ± 0.7 | 2.99 ± 0.5 | 3.11 ± 0.9 | 2.96 ± 0.5 | 2.75 ± 0.7 | 2.93 ± 0.6 | 3.11 ± 0.6 222Peaks not found for 2 subjects | |||
| Pelvis Gain | 3.25 ± 2.0 | 2.90 ± 1.3 | 3.33 ± 1.1 | 2.56 ± 1.0 | 2.61 ± 1.0 | 3.44 ± 1.1 | 2.66 ± 1.3 | 3.03 ± 1.1 | 3.74 ± 1.2 | 2.98 ± 1.2 | 3.10 ± 1.5 | 3.64 ± 1.7 222Peaks not found for 2 subjects | |||
| Freq. | 3.47 ± 1.1 | 3.29 ± 1.0 | 3.47 ± 1.0 | 3.50 ± 0.8 | 3.45 ± 0.9 | 3.41 ± 0.9 | 3.39 ± 0.9 | 3.20 ± 1.0 | 3.66 ± 1.1 | 3.10 ± 0.7 | 3.14 ± 0.7 | 3.52 ± 0.7 222Peaks not found for 2 subjects | |||
| Vertical Perturbation - Vertical Response | |||||||||||||||
| Head Gain | 4.30 ± 1.1 | 4.09 ± 1.0 | 3.54 ± 0.8 | 4.50 ± 0.6 | 4.40 ± 1.0 | 4.48 ± 0.5 | 4.30 ± 0.5 | 4.46 ± 0.6 | 4.42 ± 0.6 | 4.92 ± 0.7 | 4.76 ± 0.7 | 5.04 ± 0.7 222Peaks not found for 2 subjects | |||
| Freq. | 4.78 ± 0.3 | 4.90 ± 0.5 | 5.19 ± 0.5 | 4.60 ± 0.2 | 4.49 ± 0.3 | 4.58 ± 0.2 | 4.64 ± 0.3 | 4.49 ± 0.3 | 4.37 ± 0.2 | 4.54 ± 0.2 | 4.94 ± 0.5 | 4.83 ± 0.3 222Peaks not found for 2 subjects | |||
| Trunk Gain | 4.43 ± 1.3 | 4.27 ± 1.2 | 4.24 ± 1.2 | 4.44 ± 1.0 | 4.30 ± 1.1 | 4.98 ± 0.9 | 4.27 ± 0.9 | 4.66 ± 0.9 | 5.09 ± 0.9 | 4.47 ± 0.9 | 4.07 ± 0.8 | 4.75 ± 0.7 222Peaks not found for 2 subjects | |||
| Freq. | 4.99 ± 0.7 | 4.75 ± 0.7 | 5.16 ± 0.5 | 4.57 ± 0.2 | 4.49 ± 0.2 | 4.57 ± 0.3 | 4.60 ± 0.3 | 4.43 ± 0.3 | 4.39 ± 0.2 | 4.43 ± 0.2 | 4.42 ± 0.5 | 4.73 ± 0.3 222Peaks not found for 2 subjects | |||
| Pelvis Gain | 2.00 ± 0.9 | 2.27 ± 0.6 | 2.53 ± 0.7 | 1.99 ± 0.6 | 2.09 ± 0.6 | 2.16 ± 0.5 | 2.05 ± 0.5 | 2.23 ± 0.5 | 2.29 ± 0.8 | 2.39 ± 0.6 | 2.44 ± 0.6 | 2.61 ± 0.7 222Peaks not found for 2 subjects | |||
| Freq. | 4.72 ± 1.0 | 4.99 ± 1.2 | 4.94 ± 0.9 | 4.61 ± 0.6 | 4.33 ± 0.8 | 4.66 ± 0.5 | 4.46 ± 0.4 | 4.36 ± 0.4 | 4.37 ± 0.3 | 4.32 ± 1.0 | 5.09 ± 0.8 | 5.10 ± 0.8 222Peaks not found for 2 subjects | |||
| Vertical Perturbation - Pitch Response | |||||||||||||||
| Head Gain | 23.85 ± 9.1 | 22.03 ± 8.2 | 16.47 ± 6.4 | 24.92 ± 9.9 | 23.05 ± 7.7 | 18.57 ± 10.7 | 26.18 ± 10.5 | 25.25 ± 9.8 | 20.44 ± 5.1 | 24.21 ± 10.3 | 35.33 ± 9.0 | 25.79 ± 6.9 222Peaks not found for 2 subjects | |||
| Freq. | 4.93 ± 0.4 | 5.27 ± 0.8 | 5.77 ± 1.0 | 4.96 ± 0.8 | 4.94 ± 0.7 | 5.70 ± 0.8 | 5.07 ± 0.7 | 5.10 ± 0.7 | 5.67 ± 0.9 | 5.16 ± 0.7 | 4.87 ± 0.4 | 5.36 ± 0.5 222Peaks not found for 2 subjects | |||
| Trunk Gain | 15.19 ± 8.2 | 18.24 ± 12.2 | 18.62 ± 12.2 | 17.54 ± 10.1 | 16.20 ± 8.1 111Peaks not found for 1 subjects | 17.15 ± 9.2 | 19.42 ± 10.5 | 16.48 ± 5.6 | 17.84 ± 9.3 | 16.92 ± 9.2 | 19.12 ± 16.6 | 21.68 ± 13.0 222Peaks not found for 2 subjects | |||
| Freq. | 6.19 ± 0.9 | 6.68 ± 0.9 | 6.22 ± 1.1 | 6.40 ± 1.1 | 5.97 ± 1.1 111Peaks not found for 1 subjects | 5.94 ± 1.0 | 6.46 ± 0.9 | 6.52 ± 1.2 | 6.86 ± 0.9 | 5.94 ± 1.2 | 6.18 ± 0.8 | 6.31 ± 0.7 222Peaks not found for 2 subjects | |||
| Pelvis Gain | 6.57 ± 4.2 333Peaks not found for 3 subjects | 8.19 ± 4.7 | 7.26 ± 5.2 111Peaks not found for 1 subjects | 7.75 ± 4.8 111Peaks not found for 1 subjects | 7.65 ± 5.0 | 14.60 ± 8.7 | 6.22 ± 3.8 | 7.77 ± 7.0 | 11.53 ± 7.2 | 6.80 ± 4.7 | 7.22 ± 5.6 | 7.38 ± 5.5 222Peaks not found for 2 subjects | |||
| Freq. | 5.31 ± 0.8 333Peaks not found for 3 subjects | 6.03 ± 1.1 | 5.86 ± 0.8 111Peaks not found for 1 subjects | 5.95 ± 1.3 111Peaks not found for 1 subjects | 5.49 ± 1.4 | 5.04 ± 0.5 | 5.45 ± 1.0 | 5.73 ± 1.1 | 5.92 ± 1.4 | 5.63 ± 1.1 | 5.55 ± 0.7 | 6.07 ± 1.2 222Peaks not found for 2 subjects | |||
| Posture | Support | Extra | ||||||||||
| E-P | E-S | S-P | L-H | M-H | L-M | EC-MP | HD-MP | LA-MP | ||||
| Fore-aft Perturbation | Fore-aft Response | |||||||||||
| Head | Gain | 0.700 | 0.165 | 1 | 1 | 0.747 | 0.511 | 0.008 | 0.008 | 0.039 | ||
| Freq. | 0.509 | 1 | 0.509 | 0.049 | 0.133 | 0.069 | 0.001 | 0.789 | 0.001 | |||
| Trunk | Gain | 0.062 | 0.020 | 0.3932 | 0.002 | 0.125 | 0.008 | 1 | 0.675 | 0.084 | ||
| Freq. | 0.160 | 0.088 | 0.268 | 0.001 | 1 | 0.001 | 1 | 1 | 0.035 | |||
| Pelvis | Gain | 1 | 1 | 1 | 0.018 | 0.463 | 0.275 | 0.923 | 0.530 | 0.251 | ||
| Freq. | 0.001 | 0.001 | 0.528 | 0.635 | 1 | 0.175 | 1 | 1 | 1 | |||
| Pitch Response | ||||||||||||
| Head | Gain | 1 | 1 | 1 | 0.018 | 0.181 | 0.013 | 1 | 1 | 0.638 | ||
| Freq. | 1 | 1 | 1 | 1 | 1 | 1 | 1 | 1 | 1 | |||
| Trunk | Gain | 1 | 1 | 1 | 0.108 | 0.087 | 1 | 1 | 0.640 | 1 | ||
| Freq. | 1 | 1 | 1 | 0.452 | 1 | 1 | 1 | 1 | 1 | |||
| Pelvis | Gain | 0.374 | 1 | 0.471 | 1 | 1 | 1 | 1 | 1 | 1 | ||
| Freq. | 0.509 | 0.092 | 0.609 | 0.845 | 0.791 | 1 | 1 | 1 | 1 | |||
| Lateral Perturbation | Lateral Response | |||||||||||
| Head | Gain | 1 | 0.644 | 0.864 | 0.485 | 1 | 0.418 | 1 | 1 | 1 | ||
| Freq. | 1 | 0.340 | 0.023 | 0.006 | 0.142 | 0.004 | 0.063 | 0.767 | 0.004 | |||
| Trunk | Gain | 0.164 | 0.180 | 0.602 | 0.034 | 0.698 | 0.556 | 0.007 | 0.236 | 0.001 | ||
| Freq. | 0.243 | 0.271 | 1 | 0.347 | 0.397 | 0.936 | 1 | 0.894 | 0.055 | |||
| Pelvis | Gain | 1 | 1 | 0.973 | 1 | 1 | 1 | 1 | 1 | 0.242 | ||
| Freq. | 1 | 0.593 | 0.566 | 0.181 | 0.775 | 0.285 | 1 | 1 | 0.551 | |||
| Roll Response | ||||||||||||
| Head | Gain | 1 | 1 | 1 | 0.406 | 1 | 0.715 | 0.444 | 0.569 | 1 | ||
| Freq. | 0.332 | 0.015 | 0.261 | 0.005 | 0.857 | 0.008 | 1 | 0.994 | 0.003 | |||
| Trunk | Gain | 1 | 0.924 | 1 | 1 | 1 | 0.489 | 1 | 1 | 0.172 | ||
| Freq. | 0.048 | 0.280 | 1 | 1 | 1 | 1 | 1 | 0.898 | 1 | |||
| Pelvis | Gain | 1 | 0.439 | 0.358 | 0.511 | 1 | 0.208 | 1 | 1 | 1 | ||
| Freq. | 0.686 | 1 | 0.461 | 1 | 1 | 1 | 1 | 1 | 0.135 | |||
| Vertical Perturbation | Vertical Response | |||||||||||
| Head | Gain | 1 | 1 | 1 | 1 | 0.269 | 1 | 0.579 | 1 | 0.215 | ||
| Freq. | 1 | 1 | 1 | 0.045 | 1 | 0.118 | 1 | 0.113 | 0.003 | |||
| Trunk | Gain | 0.103 | 0.106 | 0.216 | 1 | 0.824 | 1 | 1 | 1 | 0.598 | ||
| Freq. | 1 | 1 | 1 | 0.017 | 0.121 | 0.077 | 1 | 1 | 0.006 | |||
| Pelvis | Gain | 0.113 | 0.039 | 0.162 | 1 | 1 | 1 | 1 | 1 | 0.536 | ||
| Freq. | 1 | 1 | 1 | 0.104 | 0.051 | 0.244 | 1 | 0.189 | 0.235 | |||
| Pitch Response | ||||||||||||
| Head | Gain | 0.193 | 0.012 | 0.099 | 0.663 | 0.768 | 1 | 1 | 0.005 | 1 | ||
| Freq. | 0.503 | 0.001 | 0.001 | 1 | 1 | 1 | 0.295 | 1 | 0.025 | |||
| Trunk | Gain | 1 | 1 | 1 | 1 | 0.453 | 1 | 1 | 1 | 0.456 | ||
| Freq. | 1 | 1 | 1 | 1 | 0.083 | 0.027 | 1 | 0.326 | 1 | |||
| Pelvis | Gain | 0.324 | 0.245 | 0.024 | 1 | 1 | 1 | 1 | 1 | 1 | ||
| Freq. | 0.368 | 1 | 0.212 | 0.408 | 1 | 0.752 | 1 | 1 | 1 | |||
| Fore-aft Perturbation - Fore-aft Response | |||||||||||||||
| Head | 1.6±0.3 | 1.7±0.3 | 1.5±0.3 | 1.5±0.3 | 1.4±0.3 | 1.3±0.3 | 1.4±0.4 | 1.3±0.3 | 1.2±0.2 | 1.3±0.2 | 1.7±0.3 | 1.1±0.4 | |||
| Trunk | 1.0±0.2 | 1.2±0.2 | 1.2±0.1 | 1.3±0.1 | 1.2±0.1 | 1.2±0.1 | 1.2±0.1 | 1.2±0.1 | 1.2±0.1 | 1.2±0.1 | 1.4±0.2 | 1.1±0.1 | |||
| Pelvis | 0.9±0.1 | 1.0±0.1 | 1.0±0.1 | 0.9±0.1 | 1.0±0.1 | 1.0±0.1 | 0.9±0.1 | 1.0±0.1 | 1.0±0.1 | 1.0±0.1 | 1.0±0.1 | 1.0±0.1 | |||
| Fore-aft Perturbation - Pitch Response | |||||||||||||||
| Head | 7.5±2.2 | 8.4±2.0 | 9.2±2.9 | 9.3±3.0 | 8.6±2.4 | 8.4±2.4 | 8.3±2.1 | 8.1±2.0 | 8.4±2.0 | 10.2±2.8 | 6.8±2.1 | 8.3±3.5 | |||
| Trunk | 3.4±0.7 | 2.9±1.4 | 1.7±0.8 | 1.7±1.0 | 1.3±0.5 | 0.8±0.3 | 1.3±0.9 | 0.9±0.5 | 0.6±0.3 | 1.2±0.7 | 1.8±0.7 | 1.3±0.5 | |||
| Pelvis | 1.0±1.4 | 0.6±0.3 | 0.4±0.4 | 0.4±0.2 | 0.4±0.3 | 0.6±0.5 | 0.4±0.3 | 0.4±0.4 | 0.5±0.4 | 0.4±0.2 | 0.5±0.2 | 0.4±0.2 | |||
| Lateral Perturbation - Lateral Response | |||||||||||||||
| Head | 1.3±0.3 | 1.3±0.2 | 1.5±0.4 | 1.4±0.3 | 1.5±0.3 | 1.5±0.4 | 1.5±0.3 | 1.5±0.3 | 1.5±0.3 | 1.4±0.4 | 1.4±0.3 | 1.4±0.4 | |||
| Trunk | 0.8±0.2 | 0.9±0.2 | 1.1±0.2 | 1.0±0.1 | 1.2±0.2 | 1.4±0.2 | 1.1±0.2 | 1.3±0.2 | 1.5±0.2 | 1.3±0.1 | 1.2±0.1 | 1.3±0.1 | |||
| Pelvis | 1.0±0.0 | 1.0±0.0 | 1.1±0.1 | 1.0±0.0 | 1.0±0.1 | 1.1±0.1 | 1.0±0.0 | 1.0±0.1 | 1.1±0.1 | 1.0±0.1 | 1.1±0.1 | 1.0±0.0 | |||
| Lateral Perturbation - Roll Response | |||||||||||||||
| Head | 6.5±2.2 | 7.3±2.2 | 8.2±2.0 | 7.6±2.0 | 8.4±2.0 | 9.6±2.7 | 8.2±2.2 | 9.4±2.3 | 9.7±2.0 | 10.5±3.1 | 7.8±2.0 | 9.8±3.6 | |||
| Trunk | 4.9±0.7 | 5.1±0.9 | 5.0±1.4 | 4.9±0.8 | 4.5±1.3 | 4.0±1.0 | 4.7±1.2 | 4.3±1.3 | 3.9±1.1 | 4.8±1.1 | 5.0±1.2 | 4.5±1.2 | |||
| Pelvis | 0.7±0.7 | 0.7±0.4 | 0.9±0.5 | 0.5±0.2 | 0.6±0.3 | 1.0±0.4 | 0.5±0.2 | 0.8±0.3 | 1.1±0.5 | 0.7±0.3 | 0.7±0.3 | 0.7±0.3 | |||
| Vertical Perturbation - Vertical Response | |||||||||||||||
| Head | 1.1±0.0 | 1.1±0.0 | 1.1±0.0 | 1.1±0.0 | 1.1±0.0 | 1.1±0.0 | 1.1±0.0 | 1.1±0.0 | 1.1±0.0 | 1.1±0.0 | 1.1±0.0 | 1.1±0.0 | |||
| Trunk | 1.1±0.0 | 1.1±0.0 | 1.1±0.0 | 1.1±0.0 | 1.1±0.0 | 1.1±0.0 | 1.1±0.0 | 1.1±0.0 | 1.1±0.0 | 1.1±0.0 | 1.1±0.0 | 1.1±0.0 | |||
| Pelvis | 0.9±0.1 | 1.0±0.1 | 1.0±0.1 | 0.9±0.1 | 1.0±0.1 | 1.0±0.1 | 0.9±0.1 | 1.0±0.1 | 1.0±0.1 | 1.0±0.1 | 1.0±0.1 | 1.0±0.1 | |||
| Vertical Perturbation - Pitch Response | |||||||||||||||
| Head | 0.9±0.4 | 1.0±0.5 | 1.0±0.4 | 1.0±0.4 | 1.3±0.5 | 1.1±0.2 | 1.0±0.3 | 1.1±0.4 | 1.0±0.3 | 1.3±0.4 | 1.8±0.3 | 1.4±0.4 | |||
| Trunk | 0.3±0.1 | 0.3±0.2 | 0.3±0.1 | 0.3±0.1 | 0.4±0.2 | 0.3±0.1 | 0.3±0.1 | 0.3±0.1 | 0.3±0.1 | 0.3±0.2 | 0.4±0.2 | 0.5±0.2 | |||
| Pelvis | 0.2±0.1 | 0.2±0.1 | 0.2±0.1 | 0.2±0.1 | 0.2±0.2 | 0.4±0.3 | 0.2±0.1 | 0.2±0.2 | 0.3±0.2 | 0.2±0.2 | 0.2±0.2 | 0.2±0.2 | |||
| Posture | Support | Extra | |||||||||
| E-P | E-S | S-P | L-H | M-H | L-M | EC-MP | HD-MP | LA-MP | |||
| Fore-aft Perturbation | Fore-aft Response | ||||||||||
| Head | 1 | 0.074 | 0.219 | 0.002 | 0.156 | 0.002 | 1 | 0.045 | 0.750 | ||
| Trunk | 0.426 | 0.794 | 1 | 0.159 | 0.439 | 0.022 | 0.371 | 0.011 | 0.012 | ||
| Pelvis | 0.012 | 0.001 | 0.003 | 0.246 | 0.355 | 1 | 0.562 | 0.233 | 1 | ||
| Pitch Response | |||||||||||
| Head | 1 | 0.864 | 0.842 | 1 | 0.895 | 1 | 0.013 | 0.060 | 1 | ||
| Trunk | 0.001 | 0.001 | 0.001 | 0.001 | 0.041 | 0.001 | 0.477 | 0.058 | 1 | ||
| Pelvis | 1 | 1 | 1 | 0.175 | 1 | 0.943 | 1 | 1 | 1 | ||
| Lateral Perturbation | Lateral Response | ||||||||||
| Head | 1 | 0.126 | 0.096 | 0.042 | 1 | 0.056 | 1 | 1 | 1 | ||
| Trunk | 0.001 | 0.001 | 0.001 | 0.001 | 0.031 | 0.001 | 0.065 | 1 | 0.211 | ||
| Pelvis | 0.866 | 0.003 | 0.004 | 0.534 | 1 | 0.384 | 1 | 1 | 0.399 | ||
| Roll Response | |||||||||||
| Head | 0.005 | 0.001 | 0.032 | 0.001 | 0.137 | 0.005 | 0.001 | 1 | 1 | ||
| Trunk | 0.156 | 0.013 | 0.432 | 0.021 | 1 | 0.023 | 1 | 0.809 | 1 | ||
| Pelvis | 0.033 | 0.001 | 0.013 | 1 | 0.663 | 1 | 1 | 1 | 1 | ||
| Vertical Perturbation | Vertical Response | ||||||||||
| Head | 1 | 1 | 1 | 0.001 | 0.722 | 0.004 | 1 | 1 | 0.625 | ||
| Trunk | 0.038 | 0.244 | 1 | 0.323 | 1 | 1 | 1 | 1 | 1 | ||
| Pelvis | 0.038 | 0.006 | 0.007 | 0.818 | 0.027 | 1 | 0.587 | 0.213 | 1 | ||
| Pitch Response | |||||||||||
| Head | 0.014 | 0.052 | 1 | 1 | 0.106 | 0.139 | 1 | 0.008 | 1 | ||
| Trunk | 0.275 | 1 | 1 | 0.831 | 1 | 0.621 | 1 | 0.992 | 0.016 | ||
| Pelvis | 1 | 0.130 | 0.055 | 1 | 0.633 | 0.138 | 1 | 1 | 1 | ||
Table 1a presents the average and standard deviation of peaks and related frequencies of gain responses. Selected peak gains and frequencies as function of posture and support height are shown in Figure 8. The highest translational peak gains were found in vertical loading in trunk and head with peak gains between 3.6 and 5.1 between 4.5-5.2 Hz. The highest rotational gains were found in the head in all motion directions and in all conditions except for Low Slouched where the trunk rotation slightly exceeded the head rotation.
3.3.1 Peak translational responses
Analyzing all body segments jointly, peak gains of segment translational responses to platform vibration are influenced significantly by both back support height and sitting posture (support: F(2) = 15.771, p 0.001; posture: F(2) = 19.197, p 0.001) for the main translational response to each perturbation direction (fore-aft to fore-aft, lateral to lateral, and vertical to vertical). The peak gains are significantly lower for low support than for middle support (Table 1a, p = 0.014) and for high support (Table 1a, p = 0.001). There is no significant difference between middle and high support (p = 0.180). The slouched posture leads to higher peak gains than preferred (p = 0.014), and erect (p = 0.011). Between preferred and erect there is no significant difference (p = 0.360). Considering the significant effect of segmentdirectionsupport (F(8) = 11.449, p <0.001) and segmentdirectionposture (F(8) = 3.389, p <0.001), post hoc tests were performed to investigate effects on peak gains for each body segment in each direction. Table 1.b summarizes the results for each direction and segment for both sitting posture and support. With fore-aft perturbations the trunk peak gain is significantly higher in slouched compared to erect, whereas trunk and pelvis peak gains are significantly higher with high and medium compared to low support. With vertical perturbations the pelvis peak gain is significantly higher in slouched compared to erect whereas the head and trunk peak gains are significantly higher with high support.
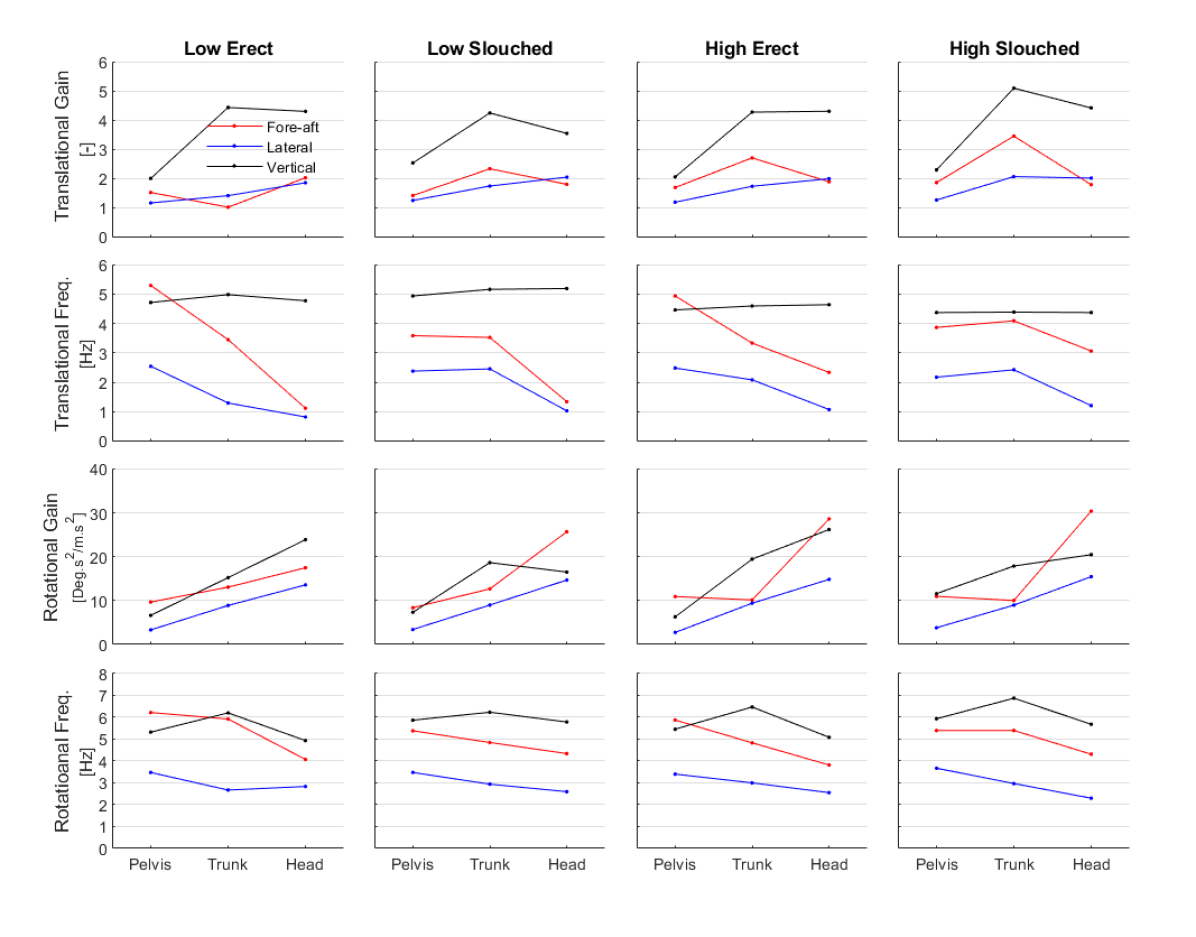
The peak frequencies are not modulated by back support height or sitting posture when all motion directions and segments are jointly analyzed (support: F(2) = 0.593, p = 0.560 ; posture: F(2) = 0.122, p = 0.884). The interactions of segmentdirectionsupport (F(8) = 4.437, p <0.001) and segmentdirectionposture (F(8) = 9.810, p <0.001) are significant which allows performing post hoc tests to investigate the effect of support and posture on peak frequencies for each segment in each perturbation direction (Table 1.b). During fore-aft perturbations, peak frequencies are significantly affected by posture in the pelvis (Table 1.b). Pelvis peak frequencies are significantly higher for erect sitting in comparison with preferred and slouched, while there is no significant difference between preferred and slouched (Table 1a). In the lateral direction, support height and posture have a significant effect on peak frequencies of lateral head acceleration. Peak frequencies are significantly higher in low support conditions in comparison with middle and high support (Tables 1a and 1.b), while there is no significant difference between middle and high support. During vertical vibration, only the peak frequencies for the head and trunk are influenced (Table 1.b) where low support results in higher peak frequencies in comparison with high support.
3.3.2 Peak rotational responses
Main rotational peak gains (when all motion directions and segments are jointly analysed) are not modulated by either sitting posture (F(2) = 0.612, p = 0.657), or back support height (F(2) = 0.897, p = 0.476). Considering the significant effect of segmentdirectionsupport (F(8) = 2.462, p = 0.010) and segmentdirectionposture (F(8) = 4.358, p <0.001), post hoc tests were performed to investigate effects for each segment in each direction (Table 1.b). No significant effects of posture are found during fore-aft and lateral perturbations. However, during vertical perturbations, the head pitch response with erect sitting posture is significantly (around 40%) higher than with slouched posture. High and middle back support lead to significantly higher head pitch gains than low support during fore-aft perturbations (Tables 1a and 1.b).
Similar to main rotational peak gains, peak frequencies are also not modulated by either sitting posture (F(2) = 0.136, p = 0.186), or backrest height (F(2) = 1.870, p = 0.186) when all motion directions and segments are jointly considered in the analysis. No significant interactions are found between direction, segment and support (F(8) = 1.0137, p = 0.434). However, interactions between direction, segment and support are significant (F(8) = 8.843, p 0.001). During lateral perturbations, the head roll peak frequencies are significantly higher for erect sitting posture than slouched. During vertical, peak frequencies of head pitch were significantly lower for erect and preferred sitting posture than slouched (Tables 1a and 1.b).
3.3.3 Low frequency (1-2 Hz) translational and rotational responses
Low frequency gains were analysed taking the average gain from 1-2 Hz where consistent and coherent responses are seen across participants while showing similar trends as even lower frequencies. Table 2a provides 1-2 Hz gains for all motion directions and body segments and the related statistics are reported in Table 2.b. Effects of support and posture on translational responses are negligible. Effects of posture are significant for the pelvis during fore-aft and lateral perturbations, but the actual difference is rather low. Rotational responses, on the other hand, are modulated by support and posture particularly for trunk during fore-aft and for head during lateral excitation.
3.4 Eyes closed
Figure 9 shows body segment responses with and without vision. Translational peak gains are significantly affected by vision (F(1)= 11.799, p = 0.004). Considering the significant effect of segmentdirectioncondition (F(4)=9.823, p 0.001) post hoc tests were performed to investigate effects for each body segment in each direction. Post hoc tests show that the effect of vision on peak gain is only significant for head translation during fore-aft and vertical and for the trunk translation in lateral perturbations (Table 1.b). Translational peak frequencies were also significantly affected by vision (F(1) = 8.958, p = 0.010). Interactions between direction, segment, and average gain were significant (F(4) = 4.268, p = 0.020). Post hoc tests show that only the head peak frequencies during fore-aft perturbations are significantly affected by vision (Table 1.b). Without vision, the head peak frequencies were higher (1.4 Hz on average) than with vision during fore-aft perturbations. Vision shows no significant effect on rotational peak gains and frequencies. The average gain between 1 and 2 Hz for the rotational response (Table 2a) is significantly affected by vision (F(1) = 26.584, p 0.001). Interactions between direction, segment, and average gain are significant (F(4) = 8.509, p 0.001). Post hoc tests show that the head 1-2 Hz rotational gain of the pitch response to fore-aft and roll response to lateral are significantly affected by vision (Table 2.b). Without vision, the 1-2 Hz head pitch gain with fore-aft perturbations increases around 18%, while head roll increases around 25% and trunk roll with 7% with lateral perturbations (Table 2a).
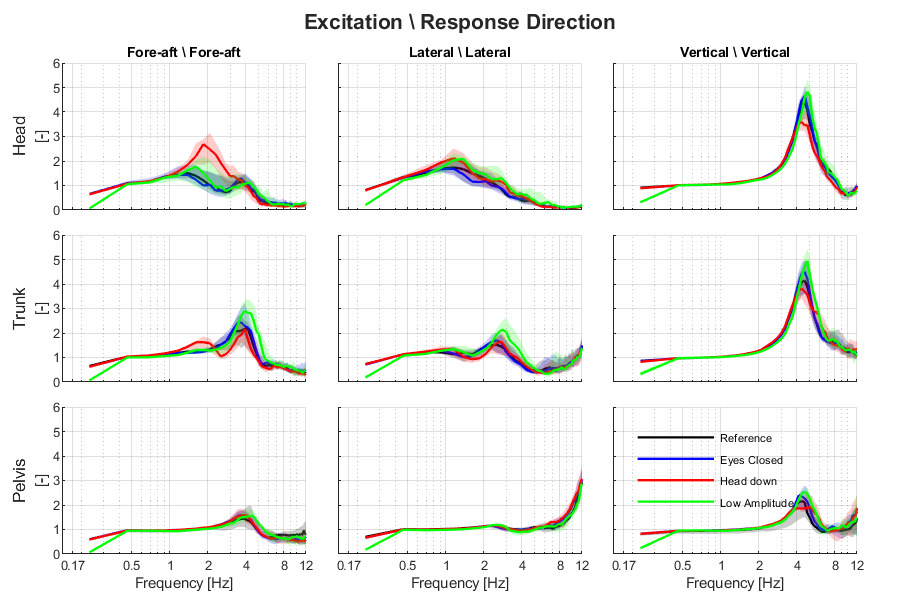
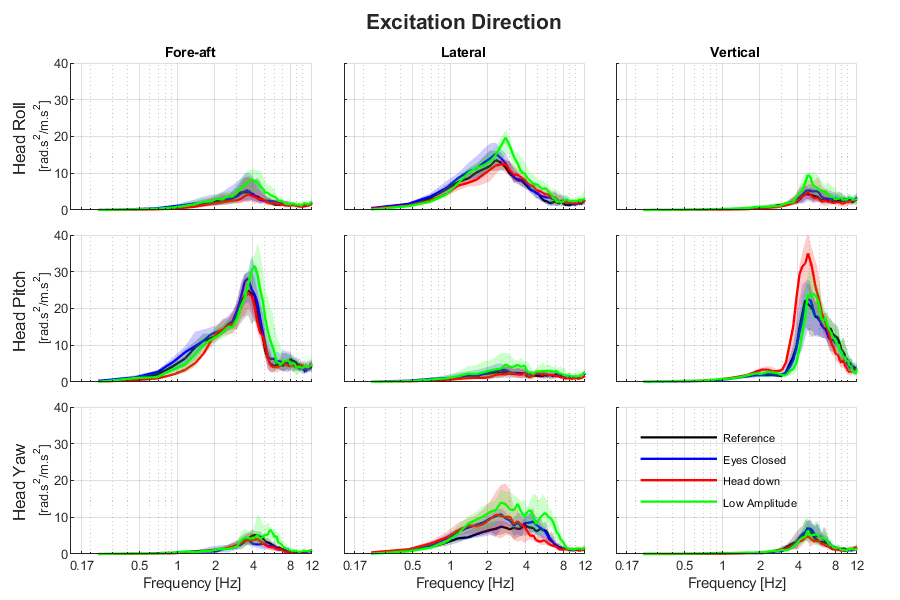
3.5 Head down
Figure 9 shows body segment responses in the head-down posture. Peak gains are not significantly different between conditions looking forward and looking down (F(1)=4.304, p = 0.058). However the interaction with segment and direction is significant (F(4)= 6.554, p 0.001). Post hoc tests show that this is significant for the head with fore-aft perturbations and for the trunk with lateral perturbations (Table 1.b). Related frequencies are significantly affected by head orientation (F(1) = 4.710, p = 0.049) with no significant interaction with segment and direction (F(4)= 2.929, p = 0.054). Figure 9 shows that particularly during the fore-aft perturbations, the peak gain was higher and shifted up around 0.5 Hz in the head-down condition compared to the reference posture (i.e., preferred posture with middle support height and looking straight forward). Peak main rotational gains are significantly affected by head orientation (F(1) = 5.112, p = 0.040). Post hoc tests show that the difference is only significant in the head main rotational response (pitch) to vertical perturbations where the peak pitch gain in the head-down condition is 65% percent more than ’looking forward’ (Table 1a). No significant effects on main rotational peak frequencies were found.
3.6 Motion amplitude
Peak gains are higher in the condition where the amplitude of the applied vibration was scaled to 0.25 of the default signal (Figure 9, Table 1a). A repeated-measures ANOVA shows that this difference is significant (F(1) = 26.548, p 0.001) as well as the interaction with segment and direction (F(4)=9.363, p 0.001). Post hoc tests show that the difference is significant in all cases except for the pelvis during vertical and the head during lateral perturbations (Table 1.b). Peak frequencies are also significantly different between low amplitude and default excitation (F(1) = 66.433, p <0.001) and with significant interaction with direction and segment (F(4)=8.785, p 0.001). Low amplitude excitation signals lead to slightly higher peak gain frequencies (Figure 9, Table 1a). Peak main rotational gains are also significantly affected by motion amplitude (F(1) = 9.780, p = 0.008). Post hoc tests indicate that peak gains differ significant only for the head with fore-aft perturbations and for the trunk with lateral perturbations (Table 1.b). The averaged 1-2 Hz gain is also affected by motion amplitude (Tables 2a and 2.b). Similar to translational peak gains, rotational gains were higher in low amplitude conditions (Table 1a). Rotational peak gain frequencies were also significantly affected by motion amplitude (F(1) = 6.927, p = 0.021), but with no interaction with segment and direction (F(4) = 0.420, p = 0.792). Low amplitude excitation signals led to slightly higher rotational peak gain frequencies (Table 1a).
3.7 Seat pressure
The seat Centre of Pressure (CoP) forward displacement was on average below 0.2 mm rms in all conditions and lateral displacement was also below 0.2 mm with fore-aft and vertical perturbations (Figure B.1). The lateral CoP displacement with lateral perturbations was significantly higher at 1.6 mm. Frequency domain analysis indicated a moderate coherence between lateral CoP displacement and the applied platform motion (Figure B.2). For the vertical excitation, the apparent mass was calculated by computing the transfer functions of the total seat contact force (summation of pressure signals of individual sensors) relative to the vertical acceleration of the motion platform resulting in an unrealistically low apparent mass of 15 kg with varying coherence (Figure B.3). Hence the dynamic pressure response seems underestimated calling for dynamic calibration Liu and Griffin (2018) and verification measuring seat forces.
4 Discussion
To achieve our scientific objectives we developed an experimental methodology to evaluate 3D vibration transmission from compliant seats to the human body. We designed wide-band motion stimuli and applied these in fore-aft, lateral and vertical direction and evaluated the translational and rotational body response in pelvis, trunk and head. Coherent kinematic results were obtained using body inertial measurements with a platform motion amplitude of only 0.3 m/s2 rms. This allowed wide-band motion (0.1-12 Hz) on a 0.7 m stroke motion platform. An exposure of 60 seconds per motion condition as in Mansfield et al. (2006) was found sufficient to obtain coherent and consistent results from 0.34 Hz. Results below this frequency, as well as the significant effects of amplitude, will be evaluated in the time domain using 3D nonlinear models of human seat interaction (Mirakhorlo et al., 2021). Such biomechanical models can also address cross-axis nonlinearity as demonstrated by Zheng et al. (2019).
Frequency domain results in terms of seat to head transmissibility are comparable to previous studies. In vertical loading, transfer function gains in translation are close to one at frequencies below 4 Hz and peak gains are in the range of previously reported human body resonance frequencies (4-6 Hz) (Nawayseh and Griffin, 2003; Rakheja et al., 2010) (Figure 7, Figure 8). We used analyses of variance to assess the significance of effects of posture and seat back height. Translational responses show significant effects in particular on resonances in terms of gain peak amplitude and frequency. Rotational responses show significant effects in particular at low frequencies. These effects are partially consistent for fore-aft, lateral and vertical perturbations, highlighting the added value of combined testing and statistical analysis for 3 seat motion directions. Future research shall explore contributions of translational and rotational motion to comfort perception in particular for the head. To achieve this we are currently integrating models of sensory integration (Oman, 1982) and postural stabilization (Happee et al., 2017) in full body biomechanical models (Mirakhorlo et al., 2021).
We found substantial effects of posture and seat back height on postural stabilization reflected in altered peak gains and associated frequencies in all seat motion directions. Rotational gain responses to fore-aft (pitch) and lateral (roll) were significantly affected by posture and seat back height at low frequencies (1-2 Hz). Perceived discomfort was substantially affected by posture and seat back height with the strongest discomfort being observed with a low back support with slouched posture.
The low back support led to substantially lower peak gains than the middle and high support during fore-aft and vertical perturbations (Table 1a) in particular for head rotation (Figure 8). Low frequency (1-2 Hz) gains were significantly lower with low back support during lateral perturbations. We attribute these findings to the constraining effect of the back support on trunk motion. As outlined in the introduction we expected larger head motions with more support. This expectation was based on tests with rigid high back support (Forbes et al., 2013) and without back support (van Drunen et al., 2016) and is now confirmed with compliant back support. Presumably, the additional motion freedom of the thorax and lumbar spine with low support allows for more effective head-in-space stabilization. However, the low support is also rated as least comfortable, in particular with the slouched posture, as discussed further below. Hence, the search for more comfortable car seats could explore seat backs that support against gravity and vehicle motion induced loading but which do not so much constrain upper back motion. In line with our findings, it was shown that an arm support can constrain trunk motion but leads to higher head translational motions in response to multiple axes perturbations (Rahmatalla et al., 2010). The vertical STHT has been studied comparing conditions with and without back support (Toward and Griffin, 2011) reporting no effect on peak gains in line with our findings (Table 1.b).
Participants rated the slouched sitting posture more discomforting than the preferred and erect postures. Potential discomforting stimuli include 1) back support and seat pressure, 2) body posture (e.g., high stress in joint structures due to uncomfortable joint orientations approaching the range of motion, and 3) body motion. Regarding point 1, the experimental seat was presumably overall less comfortable than commercial car seats due to higher peak pressures associated with the limited back support surface. This effect may have been most pronounced in the slouched postures and/or with low back support. Regarding point 2, the slouched posture itself may also be perceived as less comfortable, as reported in studies on office chairs (Vergara and Page, 2000) and train seats (Groenesteijn et al., 2014). Regarding point 3, it has been shown that discomfort can be predicted by the acceleration profiles of the seat, back, and feet (Basri and Griffin, 2013). In our study slouched leads to higher translational peak gains than preferred and erect postures. Interestingly, the perceived trunk ratings followed the same pattern as the overall discomfort ratings across conditions (Figure 4). This indicates that the trunk support and the resulting trunk motion are partly responsible for the experienced discomfort. This highlights the need to assess trunk related comfort metrics and not only use head motion, as head motion was actually reduced in the least comfortable condition with low backrest and slouched posture.
A reduced perturbation signal magnitude resulted in increase main response peak gains in all perturbation directions for head and trunk, accompanied with higher peak frequencies (Table 1a). Previous studies found similar non-linear effects of seat vibration magnitude (Bhiwapurkar et al., 2016, 2019; Nawayseh and Griffin, 2003). These findings were explained by non-linear muscle yielding in response to increasing motion magnitudes (Nawayseh and Griffin, 2003; Matsumoto and Griffin, 2002). In the arm a similar yielding was found in relax tasks while position tasks elicited stiffening with higher perturbation amplitude associated with increased muscle activity (Happee et al., 2015).
The eyes closed (EC) condition was tested to support modelling of vestibular and visual contributions to postural stabilization. Exposure to vibration without vision increased head peak gains with no clear effect on the pelvis and trunk (Tables 1a and 1.b). The effect of vision is particularly evident for rotational gains at low frequencies (1-2 Hz) during fore-aft and lateral perturbations, which can be explained by a more dominant effect of visual feedback on postural stabilization at lower frequencies (van Drunen et al., 2016; Forbes et al., 2013).
In this study, we also asked the participants to sit in a head down posture that mimics working on a handheld tablet or smartphone. As automated driving provides the opportunity to perform non-driving tasks instead of paying attention to the traffic or the road, this sitting posture might be very common in the future. The flexed orientation of the head changed the dynamics profoundly as the head started resonating more when vibrated in the fore-aft (i.e., linear acceleration, Fig. 9a) and vertical direction (i.e., pitch angular acceleration, Fig. 9b). Higher averaged low frequency (1-2 Hz) gains were also found for the head down posture (Table 2a). This result concurs with fore-aft vibration experiments where head down postures elicited increased head motion and discomfort (Rahmatalla and DeShaw, 2011). Looking forward at an auxiliary display, rather than looking down was also shown to reduce car sickness while driving a slalom, where beneficial effects were associated with peripheral outside vision (Kuiper et al., 2019).
In this study we present human body responses interacting with a compliant seat. It shall be noted that our results will be affected by the actual seat compliance as well as the absence of seat back wings. Hands were placed on the lap which can dampen the higher modes of vibration (Matsumoto and Griffin, 1998) but effects will be limited as we studied frequencies below 12 Hz. Future modelling studies will address contributions of the seat and the human body in vibration transmission.
5 Conclusion
Our experimental methodology revealed significant effects of experimental conditions on body kinematics which were partially consistent across seat motion directions. Seat back support height and sitting posture affect trunk and head postural stabilization in all motion directions with a more evident effect in fore-aft and vertical. Low STHT gains for low back support confirmed our hypothesis of its advantage for head stabilization. The head-down posture caused higher head fore-aft and pitch responses. Reducing the seat motion amplitude resulted in higher peak gains and frequencies. Without vision, low frequency (1-2 Hz) head rotation increased in pitch with fore-aft perturbations and in roll with lateral perturbations. The collected human response data will support the development of human models capturing postural stabilization and predicting comfort in dynamic interaction with compliant seats.
6 Acknowledgement
We acknowledge the support of Toyota Motor Corporation. The EMG analysis was performed by Anna Marbus and Marko Cvetković contributed to the statistical analysis.
References
- Adam et al. (2020) Adam, S., Abdul Jalil, N., Md. Rezali, K., Ng, Y., 2020. The effect of posture and vibration magnitude on the vertical vibration transmissibility of tractor suspension system. International Journal of Industrial Ergonomics 80, 103014. URL: https://www.sciencedirect.com/science/article/pii/S0169814119305396, doi:https://doi.org/10.1016/j.ergon.2020.103014.
- Basri and Griffin (2013) Basri, B., Griffin, M.J., 2013. Predicting discomfort from whole-body vertical vibration when sitting with an inclined backrest. Appl Ergon 44, 423–434. doi:10.1016/j.apergo.2012.10.006.
- Basri and Griffin (2014) Basri, B., Griffin, M.J., 2014. The application of seat values for predicting how compliant seats with backrests influence vibration discomfort. Applied ergonomics 45, 1461–1474.
- Bhiwapurkar et al. (2019) Bhiwapurkar, M., Saran, V., Harsha, S., 2019. Effects of posture and vibration magnitude on seat to head transmissibility during exposure to fore-and-aft vibration. Journal of Low Frequency Noise, Vibration and Active Control 38, 826–838.
- Bhiwapurkar et al. (2016) Bhiwapurkar, M.K., Saran, V., Harsha, S., 2016. Effects of vibration magnitude and posture on seat-to-head-transmissibility responses of seated occupants exposed to lateral vibration. International Journal of Vehicle Noise and Vibration 12, 42–59.
- Boileau and Rakheja (1998) Boileau, P.É., Rakheja, S., 1998. Whole-body vertical biodynamic response characteristics of the seated vehicle driver: measurement and model development. International Journal of Industrial Ergonomics 22, 449–472.
- Corbridge and Griffin (1986) Corbridge, C., Griffin, M., 1986. Vibration and comfort: vertical and lateral motion in the range 0· 5 to 5· 0 hz. Ergonomics 29, 249–272.
- Dialynas et al. (2019) Dialynas, G., Haan, J., Schouten, A., Happee, R., Schwab, A., 2019. The dynamic response of the bicycle rider’s body to vertical, fore-and-aft, and lateral perturbations. Proceedings of the Institution of Mechanical Engineers, Part D: Journal of Automobile Engineering 234, 095440701989128. doi:10.1177/0954407019891289.
- Dong et al. (2019) Dong, R.c., He, L., Du, W., Cao, Z.k., Huang, Z.l., 2019. Effect of sitting posture and seat on biodynamic responses of internal human body simulated by finite element modeling of body-seat system. Journal of Sound and Vibration 438, 543–554.
- van Drunen et al. (2016) van Drunen, P., van der Helm, F.C., van Dieën, J.H., Happee, R., 2016. Trunk stabilization during sagittal pelvic tilt: from trunk-on-pelvis to trunk-in-space due to vestibular and visual feedback. Journal of neurophysiology 115, 1381–1388.
- Fairley and Griffin (1989) Fairley, T.E., Griffin, M.J., 1989. The apparent mass of the seated human body: vertical vibration. Journal of Biomechanics 22, 81–94.
- Forbes et al. (2013) Forbes, P.A., de Bruijn, E., Schouten, A.C., van der Helm, F.C., Happee, R., 2013. Dependency of human neck reflex responses on the bandwidth of pseudorandom anterior-posterior torso perturbations. Experimental brain research 226, 1–14.
- Frey et al. (2020) Frey, M., Greene, R., De Carvalho, D., 2020. What is the best way to collect maximum forward lumbar spine flexion values for normalizing posture to range of motion? Journal of Biomechanics 103, 109706. URL: http://www.sciencedirect.com/science/article/pii/S0021929020301226, doi:https://doi.org/10.1016/j.jbiomech.2020.109706.
- Groenesteijn et al. (2014) Groenesteijn, L., van Mastrigt, S.H., Gallais, C., Blok, M., Kuijt-Evers, L., Vink, P., 2014. Activities, postures and comfort perception of train passengers as input for train seat design. Ergonomics 57, 1154–1165. URL: https://doi.org/10.1080/00140139.2014.914577, doi:10.1080/00140139.2014.914577, arXiv:https://doi.org/10.1080/00140139.2014.914577. pMID: 24831434.
- Happee et al. (2017) Happee, R., de Bruijn, E., Forbes, P., van der Helm, F., 2017. Dynamic head-neck stabilization and modulation with perturbation bandwidth investigated using a multisegment neuromuscular model. J Biomechanics .
- Happee et al. (2015) Happee, R., de Vlugt, E., van Vliet, B., 2015. Nonlinear 2d arm dynamics in response to continuous and pulse-shaped force perturbations. Experimental brain research 233, 39--52.
- Jalil and Griffin (2007a) Jalil, N.A.A., Griffin, M.J., 2007a. Fore-and-aft transmissibility of backrests: Effect of backrest inclination, seat-pan inclination, and measurement location. Journal of sound and vibration 299, 99--108.
- Jalil and Griffin (2007b) Jalil, N.A.A., Griffin, M.J., 2007b. Fore-and-aft transmissibility of backrests: Variation with height above the seat surface and non-linearity. Journal of Sound and Vibration 299, 109 -- 122. URL: http://www.sciencedirect.com/science/article/pii/S0022460X06005657, doi:https://doi.org/10.1016/j.jsv.2006.06.057.
- Khusro et al. (2020) Khusro, Y.R., Zheng, Y., Grottoli, M., Shyrokau, B., 2020. Mpc-based motion-cueing algorithm for a 6-dof driving simulator with actuator constraints. Vehicles 2, 625--647.
- Kuiper et al. (2019) Kuiper, O.X., Bos, J.E., Diels, C., Cammaerts, K., 2019. Moving base driving simulators’ potential for carsickness research. Applied ergonomics 81, 102889.
- Kyriakidis et al. (2015) Kyriakidis, M., Happee, R., de Winter, J.C., 2015. Public opinion on automated driving: Results of an international questionnaire among 5000 respondents. Transportation research part F: traffic psychology and behaviour 32, 127--140.
- Li and Huang (2020) Li, J., Huang, Y., 2020. The effects of the duration on the subjective discomfort of a rigid seat and a cushioned automobile seat. International Journal of Industrial Ergonomics 79. URL: https://www.scopus.com/inward/record.uri?eid=2-s2.0-85089475250&doi=10.1016%2fj.ergon.2020.103007&partnerID=40&md5=6675f4a30f963cd6218d3e0657d521d1, doi:10.1016/j.ergon.2020.103007.
- Liu and Griffin (2018) Liu, C., Griffin, M., 2018. Measuring vibration-induced variations in pressures between the human body and a seat. International Journal of Industrial Ergonomics 67, 274--282. URL: https://www.scopus.com/inward/record.uri?eid=2-s2.0-85049024351&doi=10.1016%2fj.ergon.2018.05.006&partnerID=40&md5=afdaeae660f2896df68c791539305245, doi:10.1016/j.ergon.2018.05.006.
- Mandapuram et al. (2012) Mandapuram, S., Rakheja, S., Boileau, P.É., Maeda, S., 2012. Apparent mass and head vibration transmission responses of seated body to three translational axis vibration. International Journal of Industrial Ergonomics 42, 268--277.
- Mansfield et al. (2006) Mansfield, N., Holmlund, P., Lundström, R., Lenzuni, P., Nataletti, P., 2006. Effect of vibration magnitude, vibration spectrum and muscle tension on apparent mass and cross axis transfer functions during whole-body vibration exposure. Journal of biomechanics 39, 3062--3070.
- Matsumoto and Griffin (1998) Matsumoto, Y., Griffin, M., 1998. Movement of the upper-body of seated subjects exposed to vertical whole-body vibration at the principal resonance frequency. Journal of Sound and Vibration 215, 743--762.
- Matsumoto and Griffin (2002) Matsumoto, Y., Griffin, M., 2002. Effect of muscle tension on non-linearities in the apparent masses of seated subjects exposed to vertical whole-body vibration. Journal of Sound and Vibration 253, 77--92.
- Mirakhorlo et al. (2021) Mirakhorlo, M., Kluft, N., Irmak, T., Shyrokau, B., Happee, R., 2021. Simulating 3d human postural stabilization in vibration and dynamic driving. International Comfort Conference .
- Nawayseh (2015) Nawayseh, N., 2015. Effect of the seating condition on the transmission of vibration through the seat pan and backrest. International Journal of Industrial Ergonomics 45, 82--90. URL: https://www.scopus.com/inward/record.uri?eid=2-s2.0-84921307979&doi=10.1016%2fj.ergon.2014.12.005&partnerID=40&md5=4bbe6d82af1441d4cc8b0c05aa4f1512, doi:10.1016/j.ergon.2014.12.005.
- Nawayseh et al. (2020) Nawayseh, N., Alchakouch, A., Hamdan, S., 2020. Tri-axial transmissibility to the head and spine of seated human subjects exposed to fore-and-aft whole-body vibration. Journal of Biomechanics 109, 109927.
- Nawayseh and Griffin (2003) Nawayseh, N., Griffin, M., 2003. Non-linear dual-axis biodynamic response to vertical whole-body vibration. Journal of Sound and Vibration 268, 503--523.
- Nawayseh and Griffin (2005) Nawayseh, N., Griffin, M., 2005. Non-linear dual-axis biodynamic response to fore-and-aft whole-body vibration. Journal of Sound and Vibration 282, 831--862.
- Oman (1982) Oman, C.M., 1982. A heuristic mathematical model for the dynamics of sensory conflict and motion sickness. Acta Oto-Laryngologica 94, 4--44. URL: https:/doi.org/10.3109/00016488209108197.
- Paddan and Griffin (1998) Paddan, G., Griffin, M., 1998. A review of the transmission of translational seat vibration to the head. Journal of Sound and Vibration 215, 863--882.
- Papaioannou et al. (2021) Papaioannou, G., Jerrelind, J., Drugge, L., Shyrokau, B., 2021. Assessment of optimal passive suspensions regarding motion sickness mitigation in different road profiles and sitting conditions. IEEE International Intelligent Transportation Systems Conference .
- Rahmatalla and DeShaw (2011) Rahmatalla, S., DeShaw, J., 2011. Effective seat-to-head transmissibility in whole-body vibration: Effects of posture and arm position. Journal of Sound and Vibration 330, 6277--6286.
- Rahmatalla et al. (2010) Rahmatalla, S., Smith, R., Meusch, J., Xia, T., Marler, T., Contratto, M., 2010. A quasi-static discomfort measure in whole-body vibration. Industrial health 48, 645--653.
- Rakheja et al. (2010) Rakheja, S., Dong, R., Patra, S., Boileau, P.É., Marcotte, P., Warren, C., 2010. Biodynamics of the human body under whole-body vibration: Synthesis of the reported data. International Journal of Industrial Ergonomics 40, 710--732.
- Reason and Brand (1975) Reason, J.T., Brand, J.J., 1975. Motion sickness. Academic Press, Oxford, England.
- Schepers et al. (2018) Schepers, M., Giuberti, M., Bellusci, G., 2018. Xsens mvn: Consistent tracking of human motion using inertial sensing doi:10.13140/RG.2.2.22099.07205.
- Song et al. (2017) Song, J., Ahn, S., Jeong, W., Yoo, W., 2017. Subjective absolute discomfort threshold due to idle vibration in passenger vehicles according to sitting posture. International Journal of Automotive Technology 18, 293--300.
- Tiemessen et al. (2007) Tiemessen, I.J., Hulshof, C.T., Frings-Dresen, M.H., 2007. An overview of strategies to reduce whole-body vibration exposure on drivers: A systematic review. International Journal of Industrial Ergonomics 37, 245--256.
- Toward and Griffin (2009) Toward, M.G., Griffin, M.J., 2009. Apparent mass of the human body in the vertical direction: Effect of seat backrest. Journal of Sound and Vibration 327, 657--669.
- Toward and Griffin (2011) Toward, M.G., Griffin, M.J., 2011. The transmission of vertical vibration through seats: Influence of the characteristics of the human body. Journal of Sound and Vibration 330, 6526--6543.
- van Veen et al. (2015) van Veen, S., Orlinskiy, V., Franz, M., Vink, P., 2015. Investigating car passenger well-being related to a seat imposing continuous posture variation. Journal of Ergonomics 5 (3) 2015 .
- Vergara and Page (2000) Vergara, M., Page, Á., 2000. System to measure the use of the backrest in sitting-posture office tasks. Applied Ergonomics 31, 247--254. URL: https://www.sciencedirect.com/science/article/pii/S0003687099000563, doi:https://doi.org/10.1016/S0003-6870(99)00056-3.
- Wu and Qiu (2020) Wu, Y., Qiu, Y., 2020. Modelling of seated human body exposed to combined vertical, lateral and roll vibrations. Journal of Sound and Vibration 485, 115509. doi:https://doi.org/10.1016/j.jsv.2020.115509.
- Wu and Qiu (2021) Wu, Y., Qiu, Y., 2021. Modeling and analysis of a train seat with occupant exposed to combined lateral, vertical and roll vibration. Journal of Sound and Vibration 496, 115920. doi:https://doi.org/10.1016/j.jsv.2020.115920.
- Zatsiorsky (2002) Zatsiorsky, V.M., 2002. Kinetics of human motion. Human Kinetics.
- Zhang et al. (2015) Zhang, X., Qiu, Y., Griffin, M.J., 2015. Transmission of vertical vibration through a seat: Effect of thickness of foam cushions at the seat pan and the backrest. International Journal of Industrial Ergonomics 48, 36--45.
- Zheng et al. (2019) Zheng, G., Qiu, Y., Griffin, M., 2019. Fore-and-aft and dual-axis vibration of the seated human body: Nonlinearity, cross-axis coupling, and associations between resonances in the transmissibility and apparent mass. International Journal of Industrial Ergonomics 69, 58--65. URL: https://www.scopus.com/inward/record.uri?eid=2-s2.0-85055338771&doi=10.1016%2fj.ergon.2018.08.007&partnerID=40&md5=fddfb39ecd83a3da73b85dd889b849c3, doi:10.1016/j.ergon.2018.08.007.
- Zheng et al. (2021) Zheng, Y., Shyrokau, B., Keviczky, T., 2021. Comfort and time efficiency: A roundabout case study. IEEE International Intelligent Transportation Systems Conference .
APPENDICES TO BE PUBLISHED ON-LINE ONLY!!!
Appendix A Participant details, posture and Range of Motion
A.1 Participant descriptives
| Age | Sex | Body weight | Body height | L5S1 flexion | L5S1 extension |
|---|---|---|---|---|---|
| years | Male/Female | kg | cm | degrees | degrees |
| 25 | F | 59 | 171.5 | 38.6 | 25.1 |
| 31 | M | 70 | 180 | N/A | N/A |
| 31 | M | 80 | 181.5 | N/A | N/A |
| 32 | M | 78 | 192.5 | N/A | N/A |
| 34 | F | 62 | 174 | 29.9 | 22.1 |
| 36 | F | 61 | 161.5 | 32.8 | 40.8 |
| 38 | F | 72 | 172.5 | 52.2 | 28.3 |
| 40 | M | 77.5 | 181.5 | 54.2 | 23.5 |
| 43 | M | 77 | 180.5 | 53.3 | 13.8 |
| 48 | M | 100 | 194.5 | 56.9 | 24.8 |
| 48 | F | 63 | 188 | 53 | 15 |
| 52 | M | 85 | 186 | 59.8 | 26.2 |
| 52 | F | 88 | 169 | 29.7 | 13.2 |
| 53 | F | 81.5 | 161.5 | 9.7 | 25.9 |
| 54 | F | 83 | 168.5 | 27 | 18.3 |
| 57 | F | 69.5 | 167.5 | 49.6 | 16.3 |
| 59 | M | 79 | 187.5 | 34.3 | 18.6 |
| 60 | M | 90 | 194.5 | 38.1 | 13.6 |
A.2 Postural differences between conditions
A.3 Ranges of Motion
After the experiment the active ranges of motion of the entire spine (flexion/extension and lateral flexion) were recorded. As such, we can relate the sitting posture to the maximum flexibility of the spine. For instance, passive structures will increasingly contribute to postural stabilization when the lumbar flexion approximates the range of motion in slouched postures.
We instructed the participants to stand straight and upright. Then, we asked participants to flex their trunks as far as possible until they felt their pelvis rotating. We instructed the participants to make a roll bending movement in a cranial-to-caudal order, so they first bent the cervical spine and further bent the spine until the pelvis rotated. This protocol was adapted from Frey et al. (2020).
Appendix B Seat pressure and center of pressure
Seat pressure data were unevenly sampled and therefore resampled using linear interpolation.
Centre of pressure
The center of pressure (CoP) location was derived, and the root-mean-square (rms) excursion was calculated (Figure B.1). CoP rms forward displacement was on average below 0.2 mm in all conditions and lateral displacement was also below 0.2 mm with fore-aft and vertical perturbations (Figure B.1). The lateral CoP displacement with lateral perturbations was significantly higher at 1.6 mm. The CoP rms analysis showed a main effect of excitation direction (F(2) = 104.48, p <0.001) and response direction (i.e., fore-aft and lateral; F(2) = 198.13, p <0.001). Furthermore, the excitationresponse direction interaction showed to modify the CoP rms values (F(2) = 588.48, p <0.001). A post hoc analysis, showed that CoP rms displacements were indeed significantly larger for the lateral excitation.
Transfer functions of the CoP motion relative to accelerations of the motion platform were calculated, with a similar approach as the transfer functions of the kinematics. The frequency domain analysis for the lateral CoP displacement showed substantial variation between participants with a moderate and varying coherence (Figure B.2).
Apparent mass
For the vertical excitation, the apparent mass was calculated by computing the transfer functions of the total seat contact force (summation of pressure signals of individual sensors) relative to the vertical acceleration of the motion platform. Again, the transfer function was computed in a similar manner and with the same settings as for the translational and rotational frequency responses (see section 2.5.2). The apparent mass was very low with values around 15 kg (Figure B.3). Coherence varied strongly between participants. The low dynamic mass may be partially due to load transfer through the back support. However, a more likely explanation is that the pressure sensors underestimate dynamic loads calling for dynamic calibration Liu and Griffin (2018) and verification measuring seat forces.
Outlook
Hence we conclude that seat pressure shows partially useful dynamic responses in lateral COP displacement with lateral seat motion and total force with vertical seat motion. Dynamic loads may well be underestimated which shall be taken into account when using pressure data to support modelling the human to seat interaction.
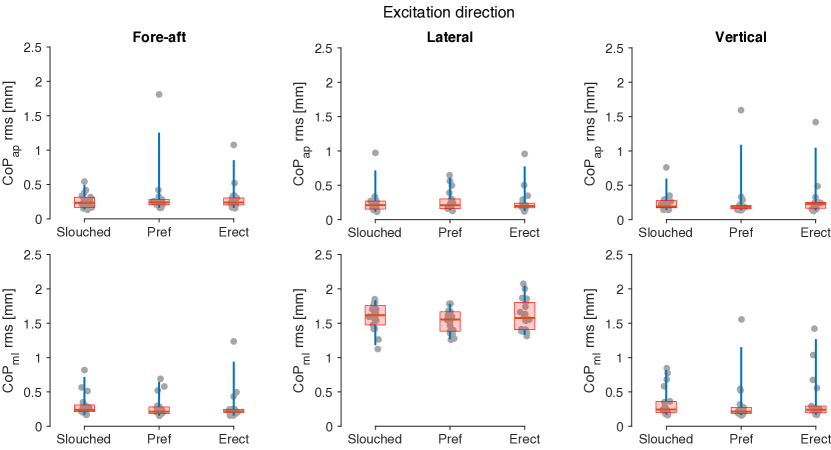
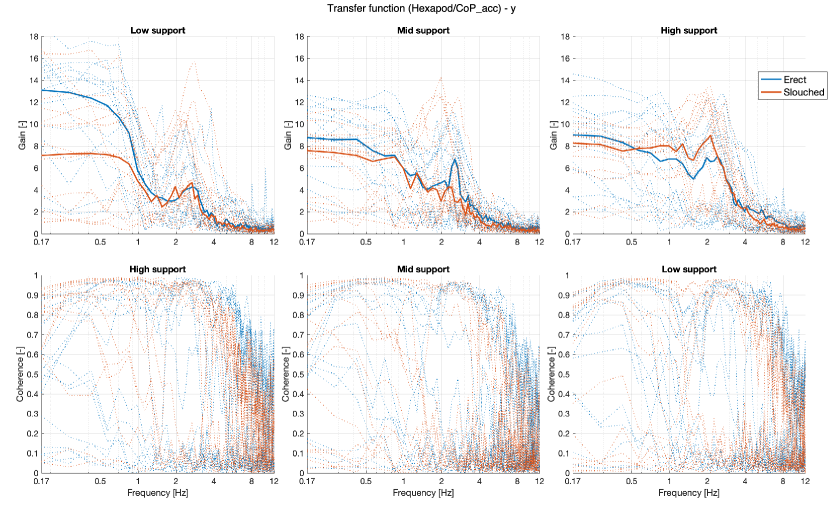
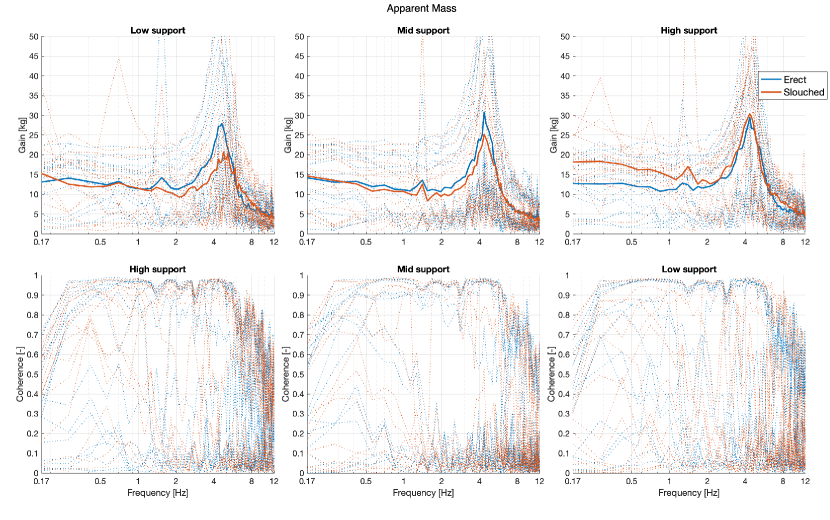
Appendix C EMG analysis
Muscular activity was evaluated recording surface EMG from 8 muscles from 4 subjects. Gel-based electrodes were applied with an interelectrode distance of 2 cm and raw EMG was recorded at 2048 Hz. Electrodes were placed in accordance with the Seniam guidelines. Prior to electrode placement, the skin was shaved and cleaned with alcohol. In the neck we measured the left and right capitis semispinalis, the left and right upper trapezius, and the left and right sternocleidomastoid. In the lumbar area we measured the left and right multifidus at the level of the spinous process of L5. In pilots we also measured the rectus abdominis but no coherent activity was found.
We first analysed EMG with high back support with the preferred posture and focused on the anterior-posterior motion case. With high support we expected clear and consistent activity in the neck muscles. We also explored results with low back support where more lumbar activity was expected.
The raw EMG was bandpass filtered (65 – 800 Hz : see below) and rectified. Gain, phase and coherence were calculated with respect to the applied platform motion. Coherences for all muscles were investigated after the application of both 1st and 6th order bidirectional Butterworth filters. Filter parameters were tuned to achieve a high coherence from 1-6 Hz being the range where coherence was highest in the neck muscles. Application of a 6th order Butterworth filter led to highest coherence. Thus, the 6th order Butterworth filter was chosen for analysis.
A Hamming window was applied using 10 segments with 50% overlap over the selected 65 seconds of data. The applied bandpass filter frequency range was tuned to achieve a good coherence. The lower cutoff frequency (i.e. 65 Hz) was found to strongly affect the coherence. Therefore, after the application of various cutoff frequencies in the range of 5 – 205 Hz, coherences for all muscles were explored. Eventually, a lower cutoff frequency of 65 Hz was chosen as this cutoff frequency showed best results. On the contrary, shifting the upper cutoff frequency had limited effect. After tuning these parameters, coherence improved and gain and phase showed increased consistency between left and right muscles.
We varied the number of segments between 2 – 20 and determined the significance threshold for coherence as this demonstrates whether the coherence differs from zero. Lower segment numbers improved the coherence but also increased the significance threshold as the threshold depends on the number of segments. Hence, 10 segments were selected for further analysis.
EMG and kinematics disclosed some voluntary motions including changes in the head orientation. Attempts to eliminate such events from the frequency domain analysis were not successful possibly due to the irregular and limited duration of remaining time segments.
After filtering and tuning of the filter parameters, normalization towards the rms EMG was performed and left and right muscles were averaged. Furthermore, results obtained from trials in which subjects had to sit in an erect or preferred posture with the back seat set in the mid or highest position, were also averaged. As a consequence of these averaging methods, coherence improved for the neck muscles but not for the lumbar muscle (Multifidus).
In the end, significant coherence in the range of 1 – 6 Hz was obtained for Sternocleidomastoid and Trapezius, coherence was close to significant for Semispinalis and remained insignificant for Multifidus which was the only lumbar muscle studied (fig. C.1,fig. C.2).
These results may be usable to validate models of neck stabilization, but these EMG data seem not informative of lumbar stabilization. Here we need to consider that muscular co-contraction and seat back support will also contribute to trunk stabilization in car occupants. However, pilot measurements showed that with higher motion amplitudes and longer exposure, EMG coherence for lumbar muscles enhanced. In future studies we may explore transient responses such as strong braking and steering. We may also explore usage of more electrodes or electrode arrays to enhance sensitivity and specificity.
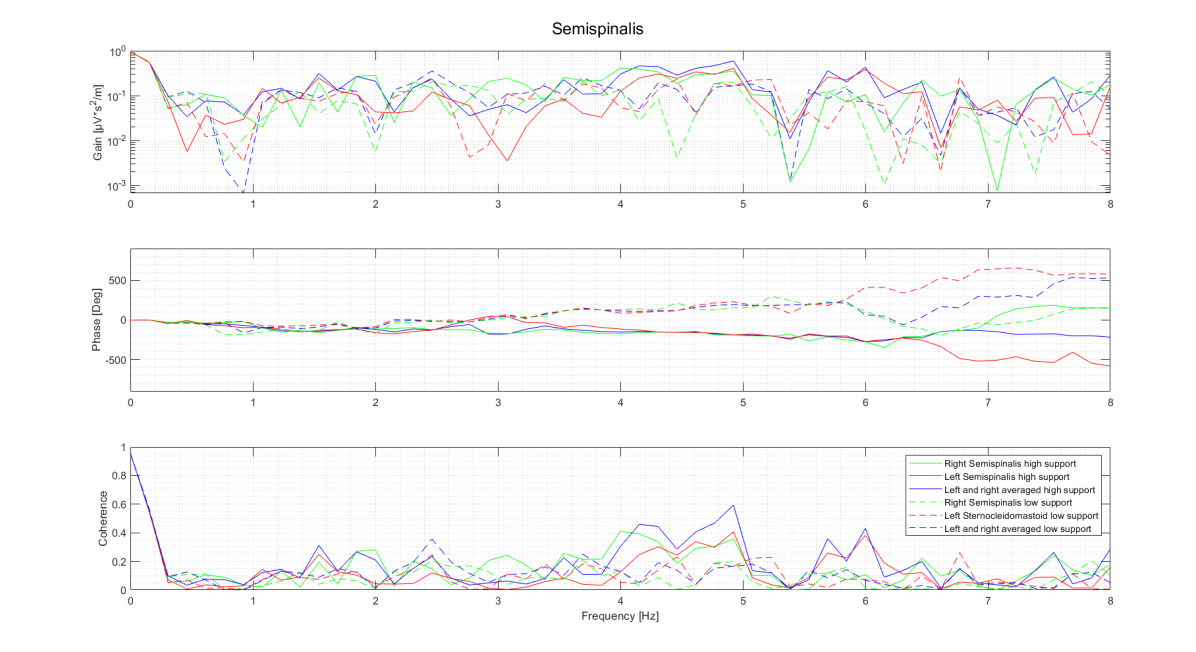
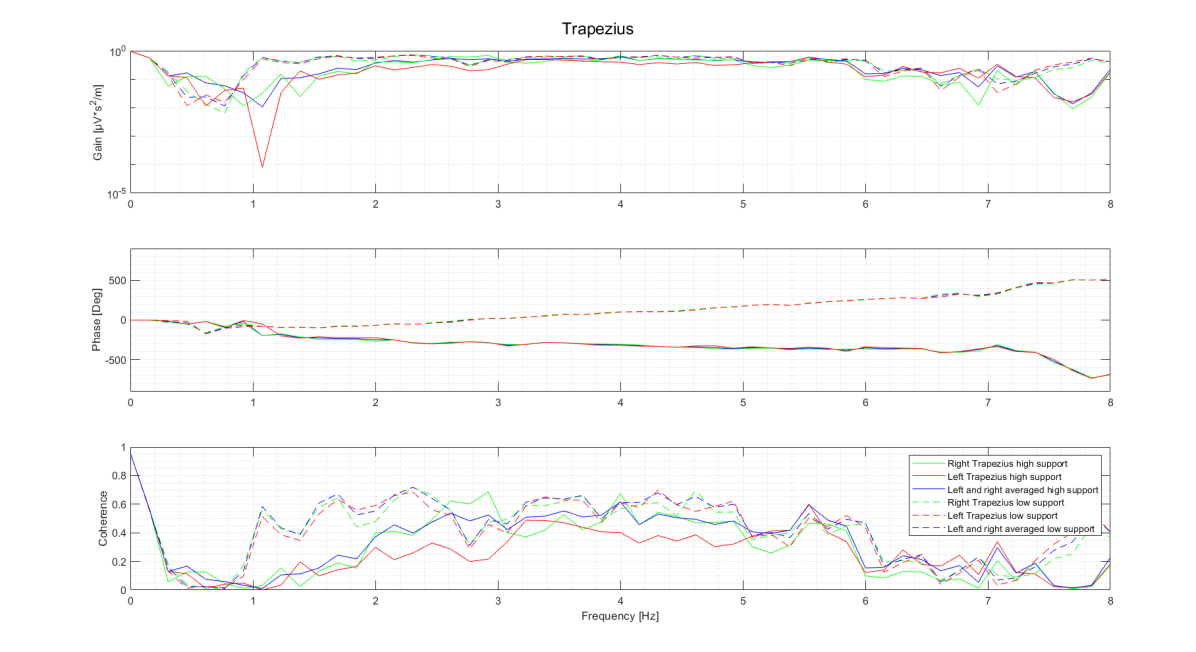
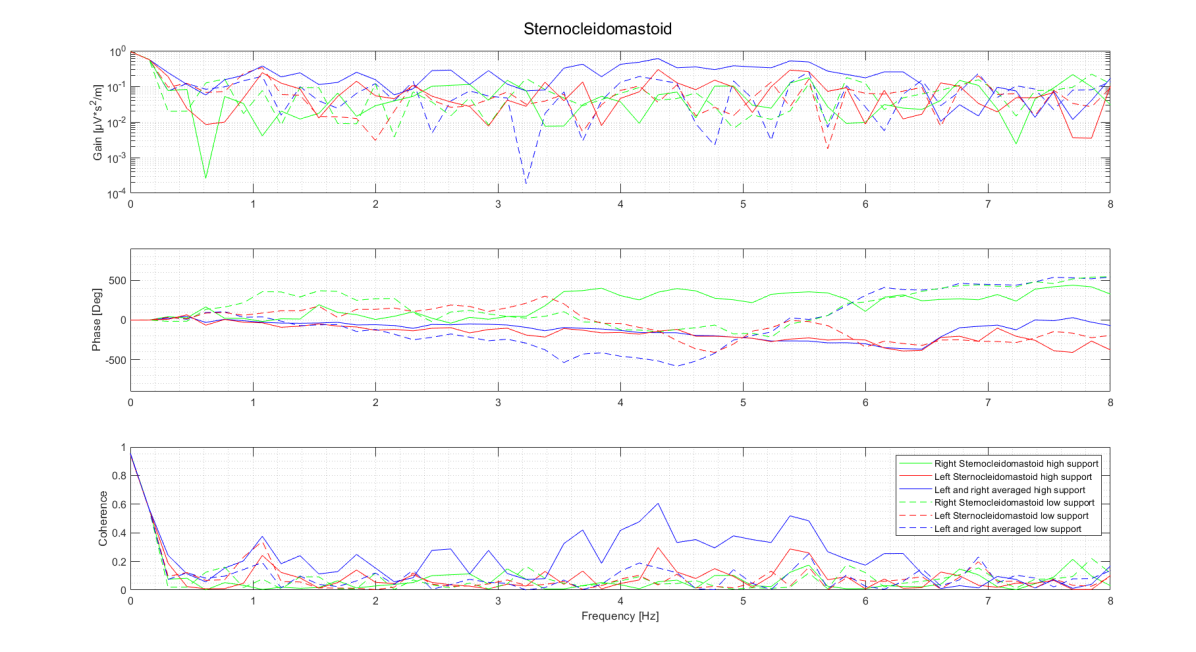
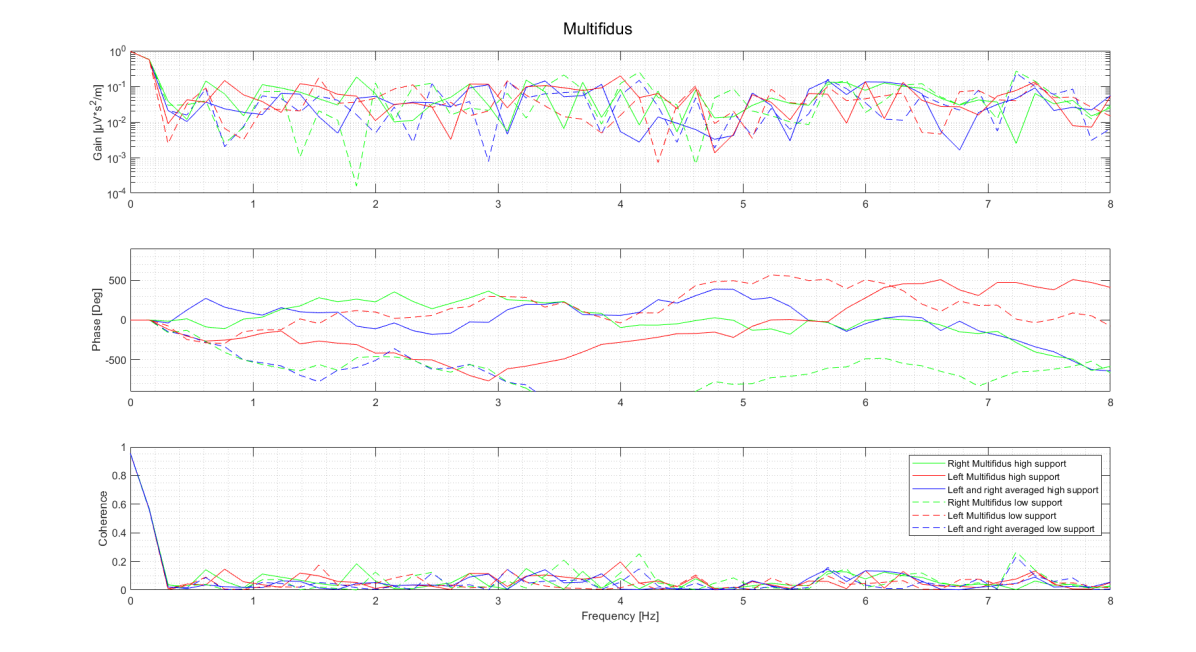
Appendix D Frequency responses for most conditions and all participants
This appendix contains body responses (head, trunk and pelvis) to car mock-up perturbations (see the main paper for more details). Following figures provide frequency domain analysis of recorded kinematic data in terms of Gain, Phase and Coherence. Dotted lines indicate each individual subject response, blue solid lines represent the median and the solid black lines are 25th and 75th percentiles.
Data for 9 conditions are shown:
-
•
3 back support heights (Low, Medium and High) in 2 posture conditions (Erect, Slouched) plus
-
•
3 special cases (Eyes Closed, Head Down and Low Amplitude).
For each condition 7 figures show:
-
•
Figure D.x.1: 3*3 (x: paragraph number) only showing the main translational responses for the perturbation in that direction, being the surge response (X) for the perturbation in surge (left column), the lateral response to lateral perturbations (mid column), and the vertical response to vertical perturbations (right column).
Following figures shows all 3D translational and rotational responses
-
•
Figure D.x.2: Translational responses to fore-aft perturbations.
-
•
Figure D.x.3: Rotational responses to fore-aft perturbations.
-
•
Figure D.x.4: Translational responses to lateral perturbations.
-
•
Figure D.x.5: Rotational responses to lateral perturbations.
-
•
Figure D.x.6: Translational responses to vertical perturbations.
-
•
Figure D.x.7: Rotational responses to vertical perturbations.
See pages - of SimpleSeatAppendixD.pdf
Appendix E Full data set
Supplied as matlab files in the OSF repository